













-
Tree improvement depends on accurate phenotyping of large, structured populations. The constraint is particularly severe for wood quality because many economically important traits are expressed inside the stem and are measured after destructive sampling. Long breeding cycles magnify the cost of late or sparse evaluation[1]. Genomic selection can shorten this cycle, but its accuracy and economy depend on population size, relationship structure, and the availability of a well-phenotyped training set[2]. Forest-genomics assessments continue to identify phenotyping as a principal constraint on translating molecular resources into selection[3]. For complex growth and wood traits, dense phenotyping remains limiting even when genotyping is available[4].
Lignin, cellulose, and hemicellulose determine a substantial part of wood processing behaviour and biomass conversion. Lignin contributes stiffness and resistance to biological degradation, whereas carbohydrate composition influences fibre yield and downstream utilization[5]. Recent work on lignin structural diversity further shows why amount alone cannot be separated from biological formation and end-use value[6]. The polymers are conventionally quantified by laboratory procedures that require milling, extraction, hydrolysis, and gravimetric or chromatographic determination[7]. Such methods are suitable as reference assays but cannot be applied at high density in early progeny trials. In pine breeding, wood chemistry also varies with cambial age, radial position, and genetic background, so a bulk value can obscure tissue-specific variation relevant to selection[8].
Spectroscopy offers an indirect route to dense wood phenotyping. Reviews of wood spectroscopy show that multivariate models can recover chemical and physical traits from broad, overlapping absorption features[9]. Practical reliability, however, depends on sample presentation, calibration transfer, and the match between the reference assay and the scanned material[10]. HSI adds spatially explicit sampling to spectral measurement and can retain radial tissue information that is lost when a disc is reduced to one spectrum[11]. Platforms for hyperspectral mapping have consequently been developed for wood products and transverse surfaces[12]. HSI has also supported early wood-density assessment in tree breeding material[13]. Hyperspectral sensing of Chinese fir seedlings demonstrates the wider movement toward non-destructive physiological phenotyping in forest genetic material[14].
High-throughput sensing becomes a breeding tool only when prediction is linked to a defensible selection unit. Phenomic selection replaces or complements molecular markers with high-dimensional secondary phenotypes and can be competitive with genomic selection when the sensor profile captures heritable variation relevant to the target trait[15]. Evidence from wheat and poplar established the proof of concept for indirect selection using near-infrared profiles[16]. Subsequent work showed that predictive ability depends on the genetic architecture of the target rather than on spectral dimensionality alone[17]. Family-wise validation is therefore more informative than random individual splits when future candidates come from families absent from calibration[18].
Forest phenomics is now moving from trait measurement toward selection decisions. UAV multispectral time series have been used to rank slash pine families for growth, with predictive ability depending on acquisition time and the definition of the validation population[19]. Close-range multimodal sensing has likewise been applied to clonal selection of tree seedlings[20]. Image-based phenotyping can bridge measurement and genetic analysis, but the bridge fails when relatives are distributed across calibration and test sets without restriction[21]. In slash pine, close-range UAV traits have already improved the resolution of association analyses, reinforcing the need to make the training-test structure explicit[22].
The statistical issue is not cosmetic. Random cross-validation assumes that test observations are exchangeable with training observations. Hierarchical ecological and breeding data violate this assumption when groups carry shared genetic or environmental information[23]. Genomic prediction studies similarly show that validation within a structured population can overstate transfer to less related candidates[24]. A family intended for advancement is a group-level decision unit. Evaluation should therefore withhold complete families from HSI-model fitting, tuning, and gating and assess both prediction error and ranking near the selection boundary. Family withholding was applied to HSI calibration conditional on a reference BLUP table estimated from all chemistry records. Held-out-family BLUPs were excluded from HSI-model fitting, tuning, and gating and used only for post-prediction evaluation.
Radial chemistry creates an additional opportunity. Heartwood and sapwood are developmentally related tissues produced by the same tree, but they differ in function, extractives, and polymer composition. Their family effects may therefore contain both shared and tissue-specific information. Multi-task learning can borrow strength across related outcomes when common structure exists[25]. Reduced-rank regression provides a parsimonious way to represent multivariate response covariance[26]. Neither device guarantees improvement in a small family trial. Cross-task correction must be restricted when held-out families do not benefit.
The present study treats HSI as a phenomic selection layer rather than a conventional specimen-level calibration. Three linked questions were addressed. First, do tissue-specific chemical traits show enough family signal and within-site rank concordance to support family prediction? Second, can a guarded multi-task correction improve block-adjusted family effects when complete families are excluded from calibration? Third, are the resulting rankings accurate enough to preserve single-trait and multi-trait advancement decisions? The analysis therefore combined mixed-model family targets, family-wise validation, selection-utility metrics, and explicit comparison with a strong target-tissue PLSR baseline. Because the trees were 4 years old, the tested endpoint is selection within juvenile material; prediction of rotation-age wood quality was not assumed.
-
The progeny test was established at Shouchang Forest Farm, Jiande, Zhejiang Province, China (29°20'17''–29°21'01'' N; 119°12'45''–119°13'33'' E). The site has a humid subtropical monsoon climate and yellow soil. The open-pollinated half-sib material was 4 years old at sampling and had been planted at 3 m by 4 m under uniform management. Site and stand conditions have been described for the same experimental area[27].
The wet-chemistry dataset contained 207 trees assigned to 26 distinct families in two randomized field blocks, G1 and G2. Each distinct CK label was retained as a separate family, consistent with the field-design identity supplied for the trial. Stem discs were collected at 1.3 m in December 2023. Each disc was labelled by tree and prepared as an approximately 2.5-cm transverse section after air-drying. The visible transition between the reddish-brown inner xylem and yellowish-white outer xylem was used to separate heartwood and sapwood. Each tissue was milled and homogenized independently.
Paired heartwood and sapwood HSI was available for 194 trees from 24 families. The 13 remaining chemistry records were not included in the HSI acquisition batch and were retained only for chemical description and mixed-model estimation; spectral values were not imputed. Twenty-three of the 24 HSI families were represented in both G1 and G2, whereas family 34 occurred only in G2. Family labels defined grouping and validation units and were never encoded as numerical predictors (Supplementary Table S1; Supplementary Fig. S1).
Tissue-specific wet chemistry
-
Lignin, cellulose, and hemicellulose were measured separately for heartwood and sapwood. Acid-insoluble lignin was determined gravimetrically, with a laboratory procedure aligned to the relevant fibrous-raw-material standard[28]. Structural carbohydrates were quantified on an oven-dry mass basis following validated biomass analytical principles[7]. The resulting targets were heartwood lignin (HWL), sapwood lignin (SWL), heartwood cellulose (HWC), sapwood cellulose (SWC), heartwood hemicellulose (HWHC), and sapwood hemicellulose (SWHC), expressed in mg·g−1.
One finalized measurement was available for each tree–tissue combination. Information on grinding particle size, the number of technical replicates, and extractives handling was unavailable. Cellulose and hemicellulose values followed the cited structural-carbohydrate procedure, including conversion of monosaccharide yields using the appropriate anhydro factors. Consequently, analytical replicate and extractives-related uncertainty was not propagated into model fitting.
All 207 trees and 26 families were used for descriptive statistics, paired tissue contrasts, and mixed-model estimation of variance components. The family-prediction analysis used the 194 trees and 24 families with paired HSI. Cross-block rank concordance was calculated for the 23 HSI families represented in both blocks. Paired heartwood-sapwood differences were tested within trees, and the false-discovery rate was controlled when the six trait-level tests were interpreted jointly[29].
Hyperspectral imaging and radial regions of interest
-
Transverse disc surfaces were scanned with a line-scan HSI system covering 1,069.0–2,284.1 nm. After removal of noisy edge bands, 181 bands were retained for each tissue. HSI in this study denotes imaging spectroscopy of intact disc surfaces; it is not point spectroscopy of milled powder. The retained wavelength interval lies in the short-wave infrared region, where overtone and combination absorptions associated with wood polymers provide multivariate chemical information[30].
Native ENVI cubes comprised 320 spatial samples × 333 lines × 256 spectral bands. Disc images were acquired with a Xenics XEVA-T2SL camera using an exposure setting of 13.9 (unit not retained) and a software-defined gain setting of 0. Traceable white- and dark-reference cubes and records of illumination geometry, scan speed, and object-space pixel size were unavailable. ROI means were calculated directly from native cube values without white-minus-dark calibration or separate dark-current subtraction. The resulting predictors were treated as relative SWIR-HSI signals, and inference was restricted to within-trial, within-instrument prediction.
Heartwood and sapwood regions of interest (ROIs) were generated with PinusXylemROI (
https://github.com/BioDING2021/PinusXylemROI ). The workflow extracts the xylem body, estimates the pith, unfolds the disc in polar coordinates, optimizes a continuous radial boundary, and permits manual correction before mask export. All 194 paired-disc ROIs (100%) were operator-reviewed and manually corrected before export. Relative to the initial automated boundaries, all samples had a mean change greater than 0.1 pixel in at least one boundary, and 191 of 194 had a mean change greater than 1 pixel. Mean absolute changes were 4.25 pixels for the heartwood boundary and 3.35 pixels for the outer xylem boundary. Corrections followed the visible closed annual-ring heartwood–sapwood transition and the xylem edge while excluding bark, labels, cracks, mould, and deep shadow. Mean relative spectral signals were then calculated separately within the corrected masks. ROI processing preceded model validation and did not use chemical values.Raw tissue spectra were the primary inputs; wavelength selection and spectral-attribution outputs were not used as predictors. Within each training fold, spectra were mean-centred and scaled using training observations only. Partial least-squares (PLS) transformations were fitted independently in each inner training set. This fold-local treatment prevents test-family spectra from influencing latent components or scaling parameters. PLS was selected as a stable base learner for collinear wood spectra[31]. Its role in chemometric calibration is well established[32].
First-derivative predictors were calculated with a Savitzky–Golay filter using an 11-band window, a second-order polynomial, and the first derivative (deriv = 1). This transformation, like centering, scaling, and PLS fitting, was recomputed inside the relevant training partition and applied unchanged to its held-out observations.
Mixed-model family effects and genetic diagnostics
-
For each of the six traits, all 207 trees were analysed with block as a fixed effect and family and family-by-block as random effects:
$ {y}_{t}=X{\beta }_{t}+Z{f}_{t}+W{(\text{fb})}_{t}+{\varepsilon }_{t} $ (1) where, yt is the vector of tissue-specific chemical measurements for trait t, βt contains the intercept and fixed block effect, ft is the family random effect, (fb)t is the family-by-block deviation, and εt is the residual. Incidence matrices X, Z, and W link observations to the corresponding effects. Variance components were estimated by restricted maximum likelihood, and family-effect empirical best linear unbiased predictors were obtained from the fitted model[33]. BLUP is appropriate for unbalanced breeding trials because it combines fixed-design adjustment with information-dependent shrinkage[34].
The mixed model was fitted once to the complete set of 207 wet-chemistry trees. Its six family-BLUP vectors formed a fixed reference phenotype table for the 24 HSI families. The 13 chemistry-only trees contributed to the fixed block effect and variance-component estimates but never entered spectral preprocessing or HSI-model fitting. Thus, target construction and HSI validation were distinct stages (Fig. 1).
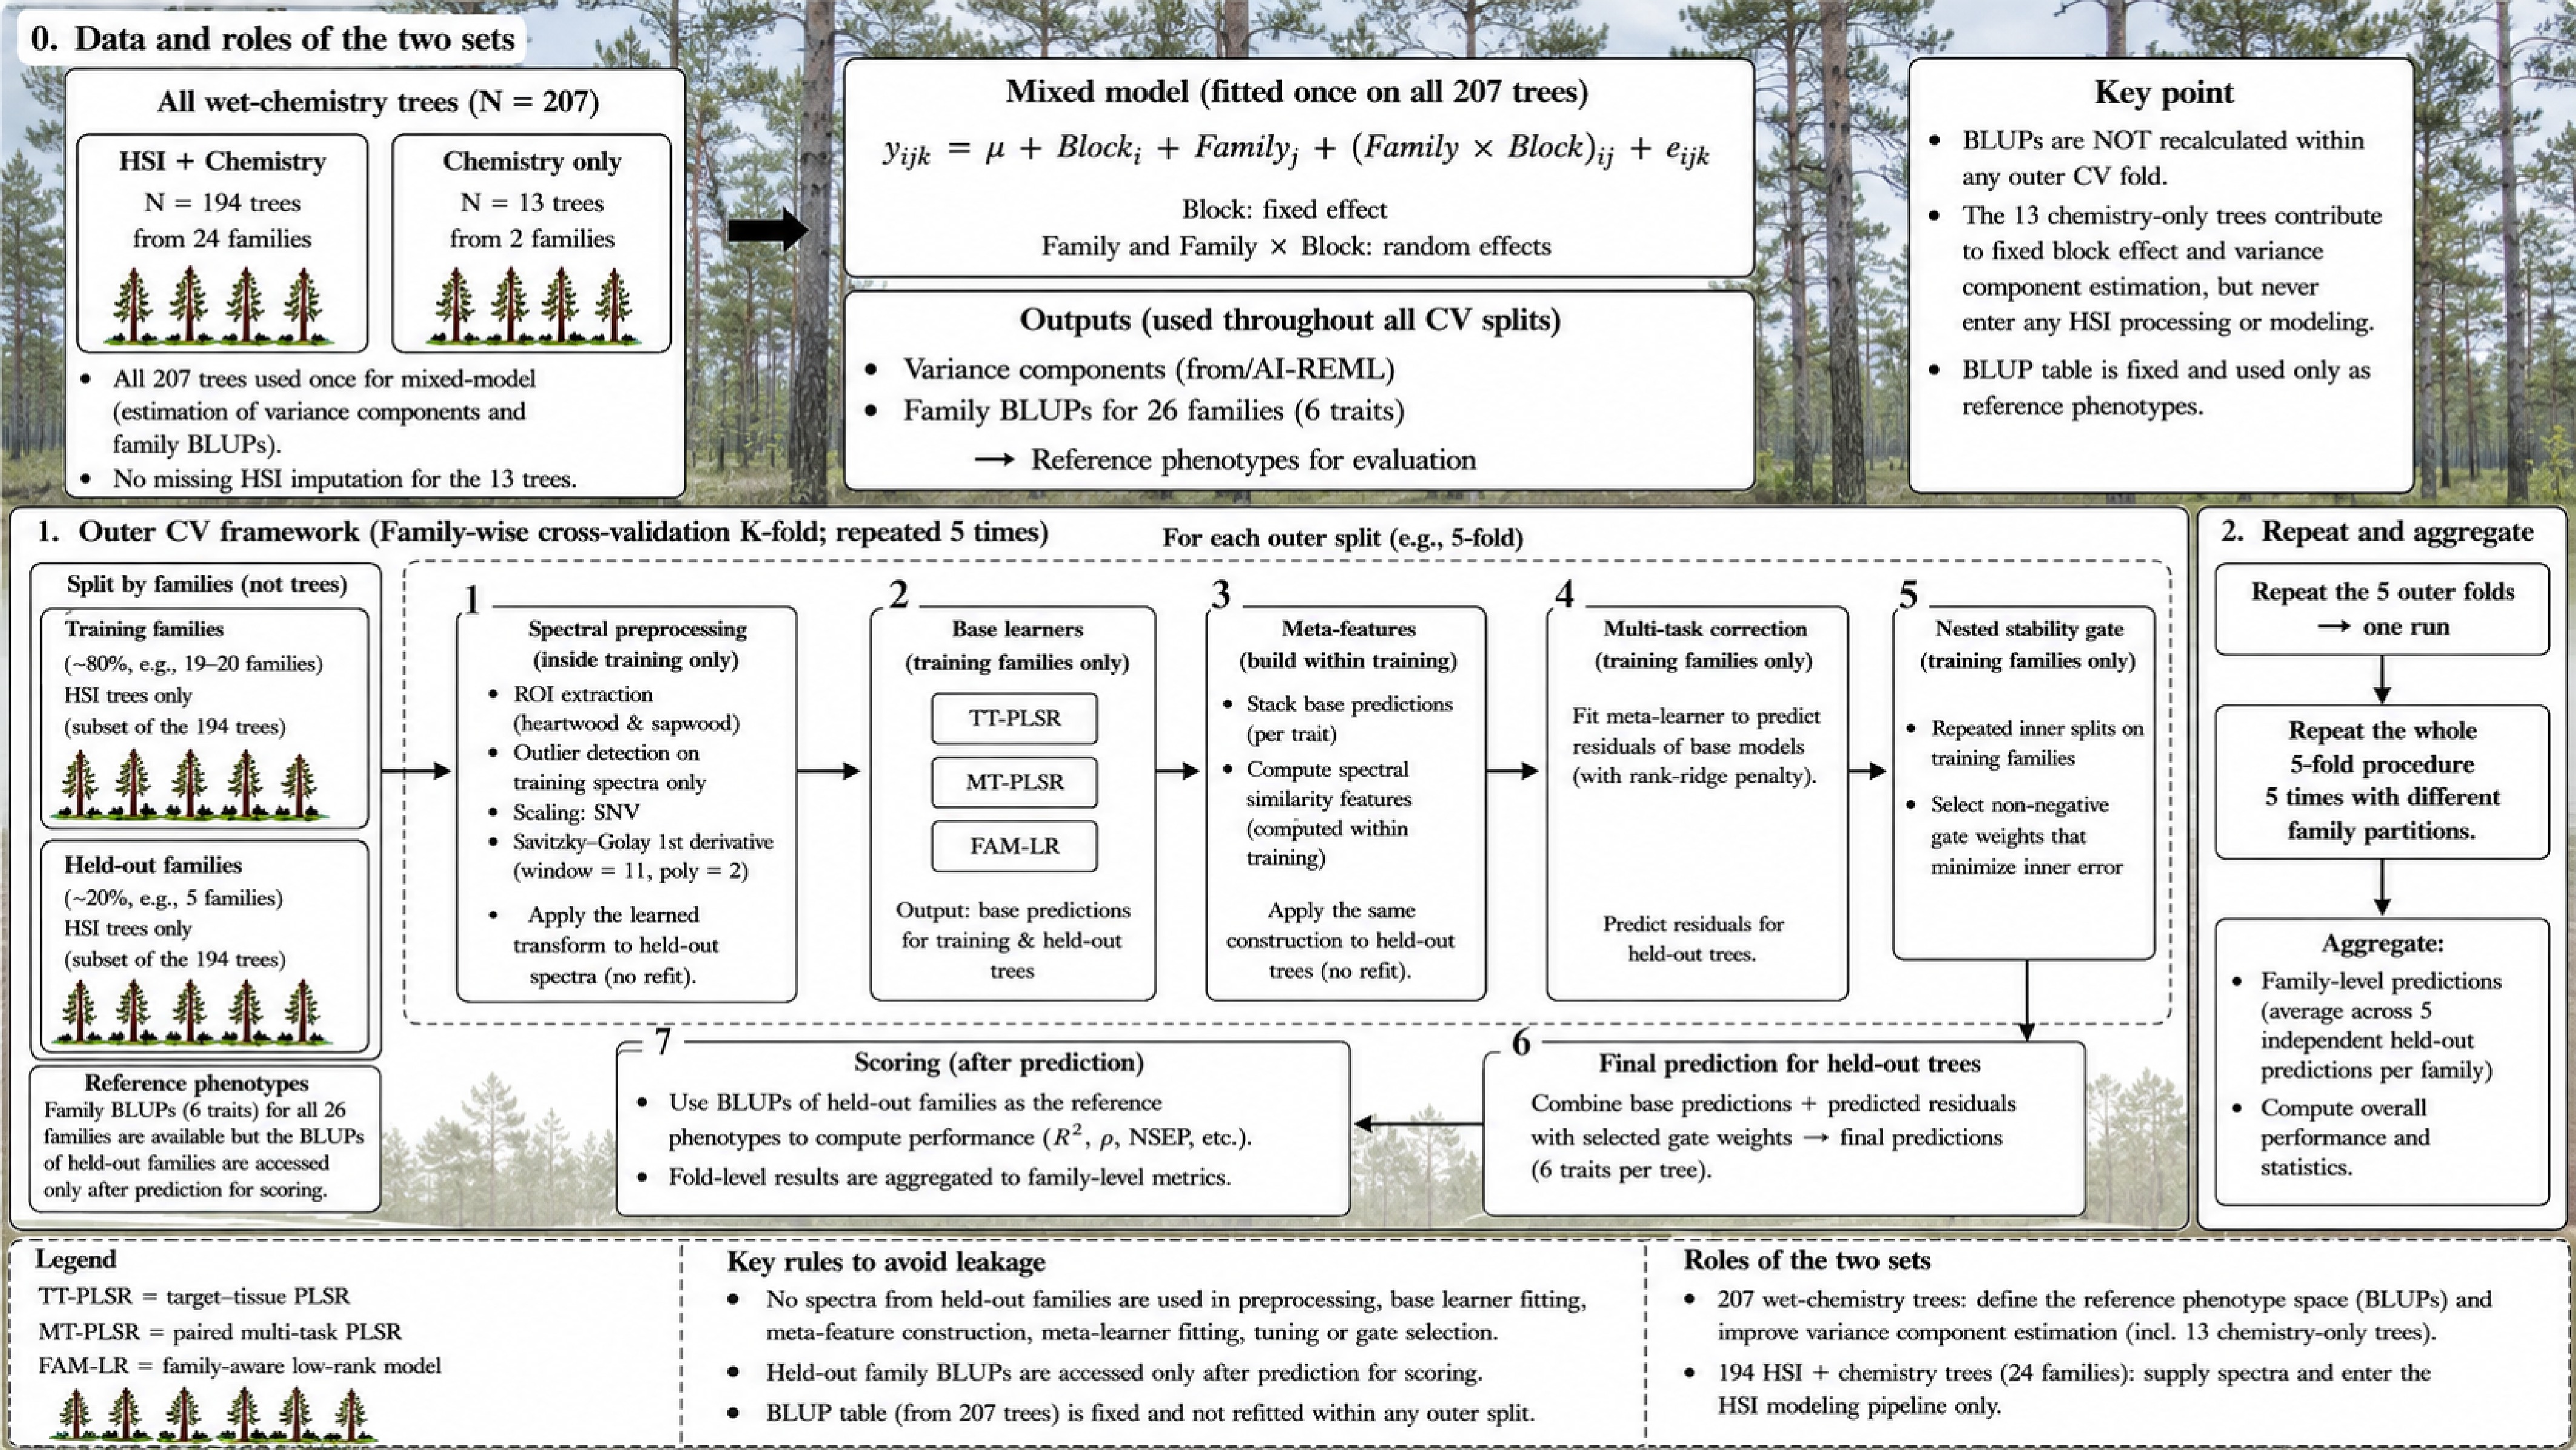
Figure 1.
Study design and family-wise cross-validation workflow for SWIR-HSI prediction of heartwood and sapwood chemistry in slash pine. Family BLUPs for six chemistry traits were estimated once from all 207 wet-chemistry trees, whereas only the 194 trees from 24 families with paired SWIR-HSI entered HSI modelling. Within each outer split, preprocessing, model fitting, tuning, and gate selection used training families only, and held-out-family BLUPs were used only for post-prediction scoring. Five-fold family-wise cross-validation was repeated five times, and predictions were aggregated at the family level.
Under the maternal half-sib approximation for open-pollinated entries, individual-tree narrow-sense heritability was calculated as:
$ h_{t}^{2}=\dfrac{4\sigma _{f,t}^{2}}{\sigma _{f,t}^{2}+\sigma _{\text{fb},t}^{2}+\sigma _{e,t}^{2}} $ (2) where, the three variance components in the denominator correspond to family, family-by-block, and residual effects. The multiplier of four follows the half-sib covariance expectation; estimates are therefore trial-based and depend on the assumption of negligible selfing and unrelated pollen parents. Family-mean reliability was derived from the prediction-error variance of the family BLUP. It quantifies the precision of a family effect estimated from this two-block trial and is not a multi-environment stability parameter[35]. Confidence intervals were obtained from 200 family-stratified bootstrap samples.
Block-specific family means were calculated for the 23 HSI families represented in both blocks. Their Spearman correlation was used only as a within-site concordance diagnostic. It was not interpreted as a Type-B genetic correlation across environments, which requires trials spanning independent sites or environmental strata[36]. Regional loblolly pine progeny tests further show that genotype-by-environment patterns can differ among traits and test sites[37].
Family-rank cross-fitted multi-task regression
-
FRCF-MTR was designed for the deployment situation in which a new family has HSI records but no chemical assays. Its training proceeded in four nested stages (Fig. 1).
First, base learners were fitted using inner family-wise cross-fitting. The fixed base library comprised raw target-tissue PLS with three and five components, first-derivative target-tissue PLS with three components, paired-tissue PLS with five components, six-response PLS2 with five components, first-derivative PLS2 with three components, a family-spectrum learner using four latent components and ridge coefficient 10, extremely randomized trees with 500 trees, minimum leaf size 3 and 0.6 of predictors considered at each split, and radial-basis-function kernel ridge regression with regularization coefficient 1 and kernel scale 1/181. Every out-of-fold prediction was produced without chemistry from that tree's family. The family-spectrum learner was the sole family-level base learner: within each training split, it used an equal-block family mean spectrum formed by first averaging tree spectra within each family-block cell and then averaging the available block means; individual trees and family-block means were not treated as independent response units.
Second, out-of-fold tree predictions were aggregated to the family level. Predictions were averaged within each family-block cell and then given equal weight across available blocks:
$ \hat {g}_{ft}^{(m)}=\dfrac{1}{|{B}_{f}|}\sum\limits_{b\in {B}_{f}}\dfrac{1}{{n}_{fb}}\sum\limits_{i\in (f,b)}\hat {y}_{it}^{(m)} $ (3) where, the inner mean is the base prediction for family f in block b for trait t, and the outer mean gives equal weight to every block represented by that family. Signed G1-minus-G2 contrasts of base predictions were added as stability descriptors. For family 34, which was observed only in G2, the equal-block family mean reduced to its G2 mean, and each unavailable G1-minus-G2 contrast was encoded as 0; no separate missingness indicator was used. The observed response was the mixed-model family BLUP, not the arithmetic family mean.
Third, cross-fitted family features were mapped jointly to the six BLUP targets with reduced-rank ridge regression. Hyperparameters were selected in a four-fold family-wise inner loop: the ridge coefficient was searched over 0.1, 1, 10, 100, and 1,000; the pairwise-order weight over 0, 0.1, 0.25, 0.5, and 1; and the coefficient-matrix rank over 2, 3, 4, and 6. The inner objective combined mean normalized RMSE with 0.35 times mean family-rank loss. A pairwise ordering term penalized disagreement between observed and predicted family differences. Ridge shrinkage stabilized estimation from correlated meta-features[38]:
$ \underset{B\colon \text{rank}(B)\leq r}{\min }\| Y-GB\| _{F}^{2}+\alpha \| B\| _{F}^{2}+\eta \sum\limits_{i \lt j}\| ({y}_{i}-{y}_{j})-({g}_{i}-{g}_{j})B\| _{2}^{2} $ (4) where, Y is the matrix of training-family BLUPs, G contains cross-fitted family features, B is the multi-task coefficient matrix, α controls coefficient shrinkage, η controls the family-ordering term, and the rank of B is restricted. The pairwise term changes the objective from pure concentration error toward preservation of family order. NDCG, a rank metric that weights the top of an ordered list most strongly, was used only for evaluation and not to tune the reported outer test values[39].
Fourth, the multi-task correction was subjected to a stability gate. Within each outer training set, three repeated inner family partitions compared the target-tissue PLSR anchor with the multi-task candidate. The correction was retained only when at least two partitions improved, and the mean relative gain was at least 0.5%; its weight was selected on a 0.125 grid and capped at 0.75:
$ {\hat {y}}_{ft}={\hat {y}}_{0,ft}+{w}_{t}({\hat {y}}_{M,ft}-{\hat {y}}_{0,ft}),\;\;0\leq {w}_{t}\leq 0.75 $ (5) where, the first prediction is the target-tissue PLSR baseline, the second is the multi-task candidate, and w is the trait-specific gate weight. A zero weight returns the baseline. The gate is an inner-validation safeguard, not a guarantee that every correction will improve under every unseen outer-family composition. Stacked generalization provides the broader basis for combining cross-fitted learners[40]; all selection steps were confined to the training families[41].
Comparator models and validation
-
Four comparison models were evaluated at the same family endpoint: target-tissue PLSR (TT-PLSR), paired-tissue PLSR, multi-response PLS2, and kernel ridge regression. Their specifications were fixed as stated above and applied to identical outer-family partitions. Hyperparameter selection for the FRCF-MTR correction occurred only in nested family-wise training splits; outer predictions were never used for model choice. This separation avoids the optimism that arises when tuning and error estimation share the same held-out observations[42].
The principal evaluation consisted of five repeated five-fold family-wise partitions of the 24 HSI families. Each test fold contained complete families; no tree from those families entered scaling, latent-variable fitting, family aggregation, meta-learning, or gate selection. A leave-one-family-out (LOFO) analysis then trained on 23 families and predicted the remaining family, repeating the procedure for all 24. These schemes test transfer to families absent from calibration rather than interpolation among related trees.
The reference BLUP table was estimated once from all 207 wet-chemistry records and held fixed across outer folds. Within each fold, training-family BLUPs were used to calibrate family-level prediction; held-out-family BLUPs were used only for post-prediction scoring and did not enter spectral preprocessing, base-learner fitting, meta-learning, tuning, or gate selection. All families contributed to the global fixed-effect and variance-component estimates underlying the reference table. Thus, family withholding applied to HSI-model calibration rather than mixed-model target estimation. Family IDs were grouping variables only, not predictors. This distinction follows the principle that the validation unit must match the intended unit of selection[15].
Prediction and selection metrics
-
Family-effect prediction was evaluated by the coefficient of determination, root-mean-square error, and Spearman rank correlation:
$ \begin{array}{l} {R}^{2}=1-\dfrac{\displaystyle\sum\nolimits_{f=1}^{F}{\left({{y}_{f}}-{{\hat {y}}_{f}}\right)}^{2}}{\displaystyle\sum\nolimits_{f=1}^{F}{\left({{y}_{f}}-\overline{y}\right)}^{2}}\\ \mathrm{RMSE}=\sqrt{\dfrac{1}{F}\displaystyle\sum\limits_{f=1}^{F}{\left({{y}_{f}}-{{\hat {y}}_{f}}\right)}^{2}} \end{array} $ (6) The repeated five-fold summary used all family-wise predictions within each repeat. Predictions were also averaged across the five repeats to evaluate the five-prediction ensemble; these two summaries are reported separately. For family f, trait t, and model m, normalized squared error was NSE(f, t, m) = (y[f, t] − ŷ[f, t, m])2/s2(t), where s2(t) was the sample variance of the 24 reference family BLUPs for trait t, calculated with a denominator of 24 − 1. The overall six-trait error was the unweighted arithmetic mean of NSE(f, t, m) across the 24 families and six traits. Accordingly, the absolute reduction was 0.1839297 − 0.1724384 = 0.0114913, and the relative reduction was 100 × 0.0114913/0.1839297 = 6.2477% (reported as 0.0115 and 6.25%). For descriptive resolution, paired mean normalized-squared-error differences were calculated for each of the 25 outer folds. For aggregate inference, the five predictions for each family were averaged first, and paired error reductions were defined as d(f, t) = NSE(f, t, TT-PLSR) − NSE(f, t, FRCF-MTR), so positive values favored FRCF-MTR. All six d(f, t) values of a family were then resampled jointly in 10,000 family-cluster bootstrap replicates to preserve within-family trait dependence. The scalar sign-flip statistic D was the arithmetic mean of the 24 × 6 paired error reductions d(f, t). In each of 100,000 draws, one random sign was applied to the complete six-trait vector of each family, and the two-sided p-value was the proportion of draws whose absolute statistic was at least as large as the observed |D|; the directional one-sided p-value was reported as a sensitivity analysis. The family, rather than the 144 family–trait observations, was treated as the biological inference unit. Multiple testing control for trait-wise exploratory comparisons used the Benjamini–Hochberg procedure.
For each trait, the favourable direction was defined as lower lignin and higher cellulose or hemicellulose. The top 20% comprised five of 24 families. Selection fidelity was described by top-set overlap, normalized discounted cumulative gain (NDCG), selection regret, and selection-differential capture:
$ C=\dfrac{{S}_{\text{pred}}-{S}_{\text{pop}}}{{S}_{\text{opt}}-{S}_{\text{pop}}} $ (7) where, the numerator is the observed gain of the HSI-selected families over the population mean, and the denominator is the maximum observed gain attainable from wet chemistry. A value of 1 indicates full retention of the attainable differential; a value below 1 quantifies the loss caused by prediction error.
A pulp-oriented six-trait index was pre-specified for secondary analysis. Within each trait, family BLUPs were standardized; lignin signs were reversed, whereas cellulose and hemicellulose retained positive signs. Equal weights were used as a transparent, non-fitted primary specification because no external economic weights were available. Four directional sensitivity schemes doubled, in turn, the weights for heartwood traits, sapwood traits, lignin traits, or carbohydrate traits while leaving the remaining weights at one. No weight was optimized against the outer predictions.
Auxiliary-feature ablation and reproducibility
-
Structure-related traits and thermal-image descriptors were evaluated in a predefined ablation. Four input sets were compared in a single family-grouped analysis: HSI only, HSI plus structure, HSI plus thermal descriptors, and HSI plus both groups. An auxiliary set was retained only if it improved mean family-wise performance. Needle nutrients and other laboratory traits were excluded because they would replace one difficult assay with another and would not support rapid deployment.
Analyses were implemented in Python 3.10 or later with NumPy, pandas, SciPy, and scikit-learn. The released package contains the input checksum, family partitions, mixed-model targets, family-wise predictions, gate decisions, tables, and figure source data. This separation between data, code, and rendered outputs follows current calls for reproducible digital forestry workflows[43]. The supporting outputs are indexed as Supplementary Data S1−S3, Supplementary Tables S1−S13, and Supplementary Figs S1−S3.
-
Across all 207 trees, heartwood contained 15.7 mg·g−1 more lignin than sapwood, whereas heartwood cellulose and hemicellulose were 9.5 and 7.1 mg·g−1 lower, respectively. All three paired contrasts were significant after multiplicity control (paired p < 0.001; Fig. 2a). The directions are consistent with systematic chemical differentiation during heartwood formation and justify retaining tissue identity rather than reducing each disc to one undifferentiated spectrum.
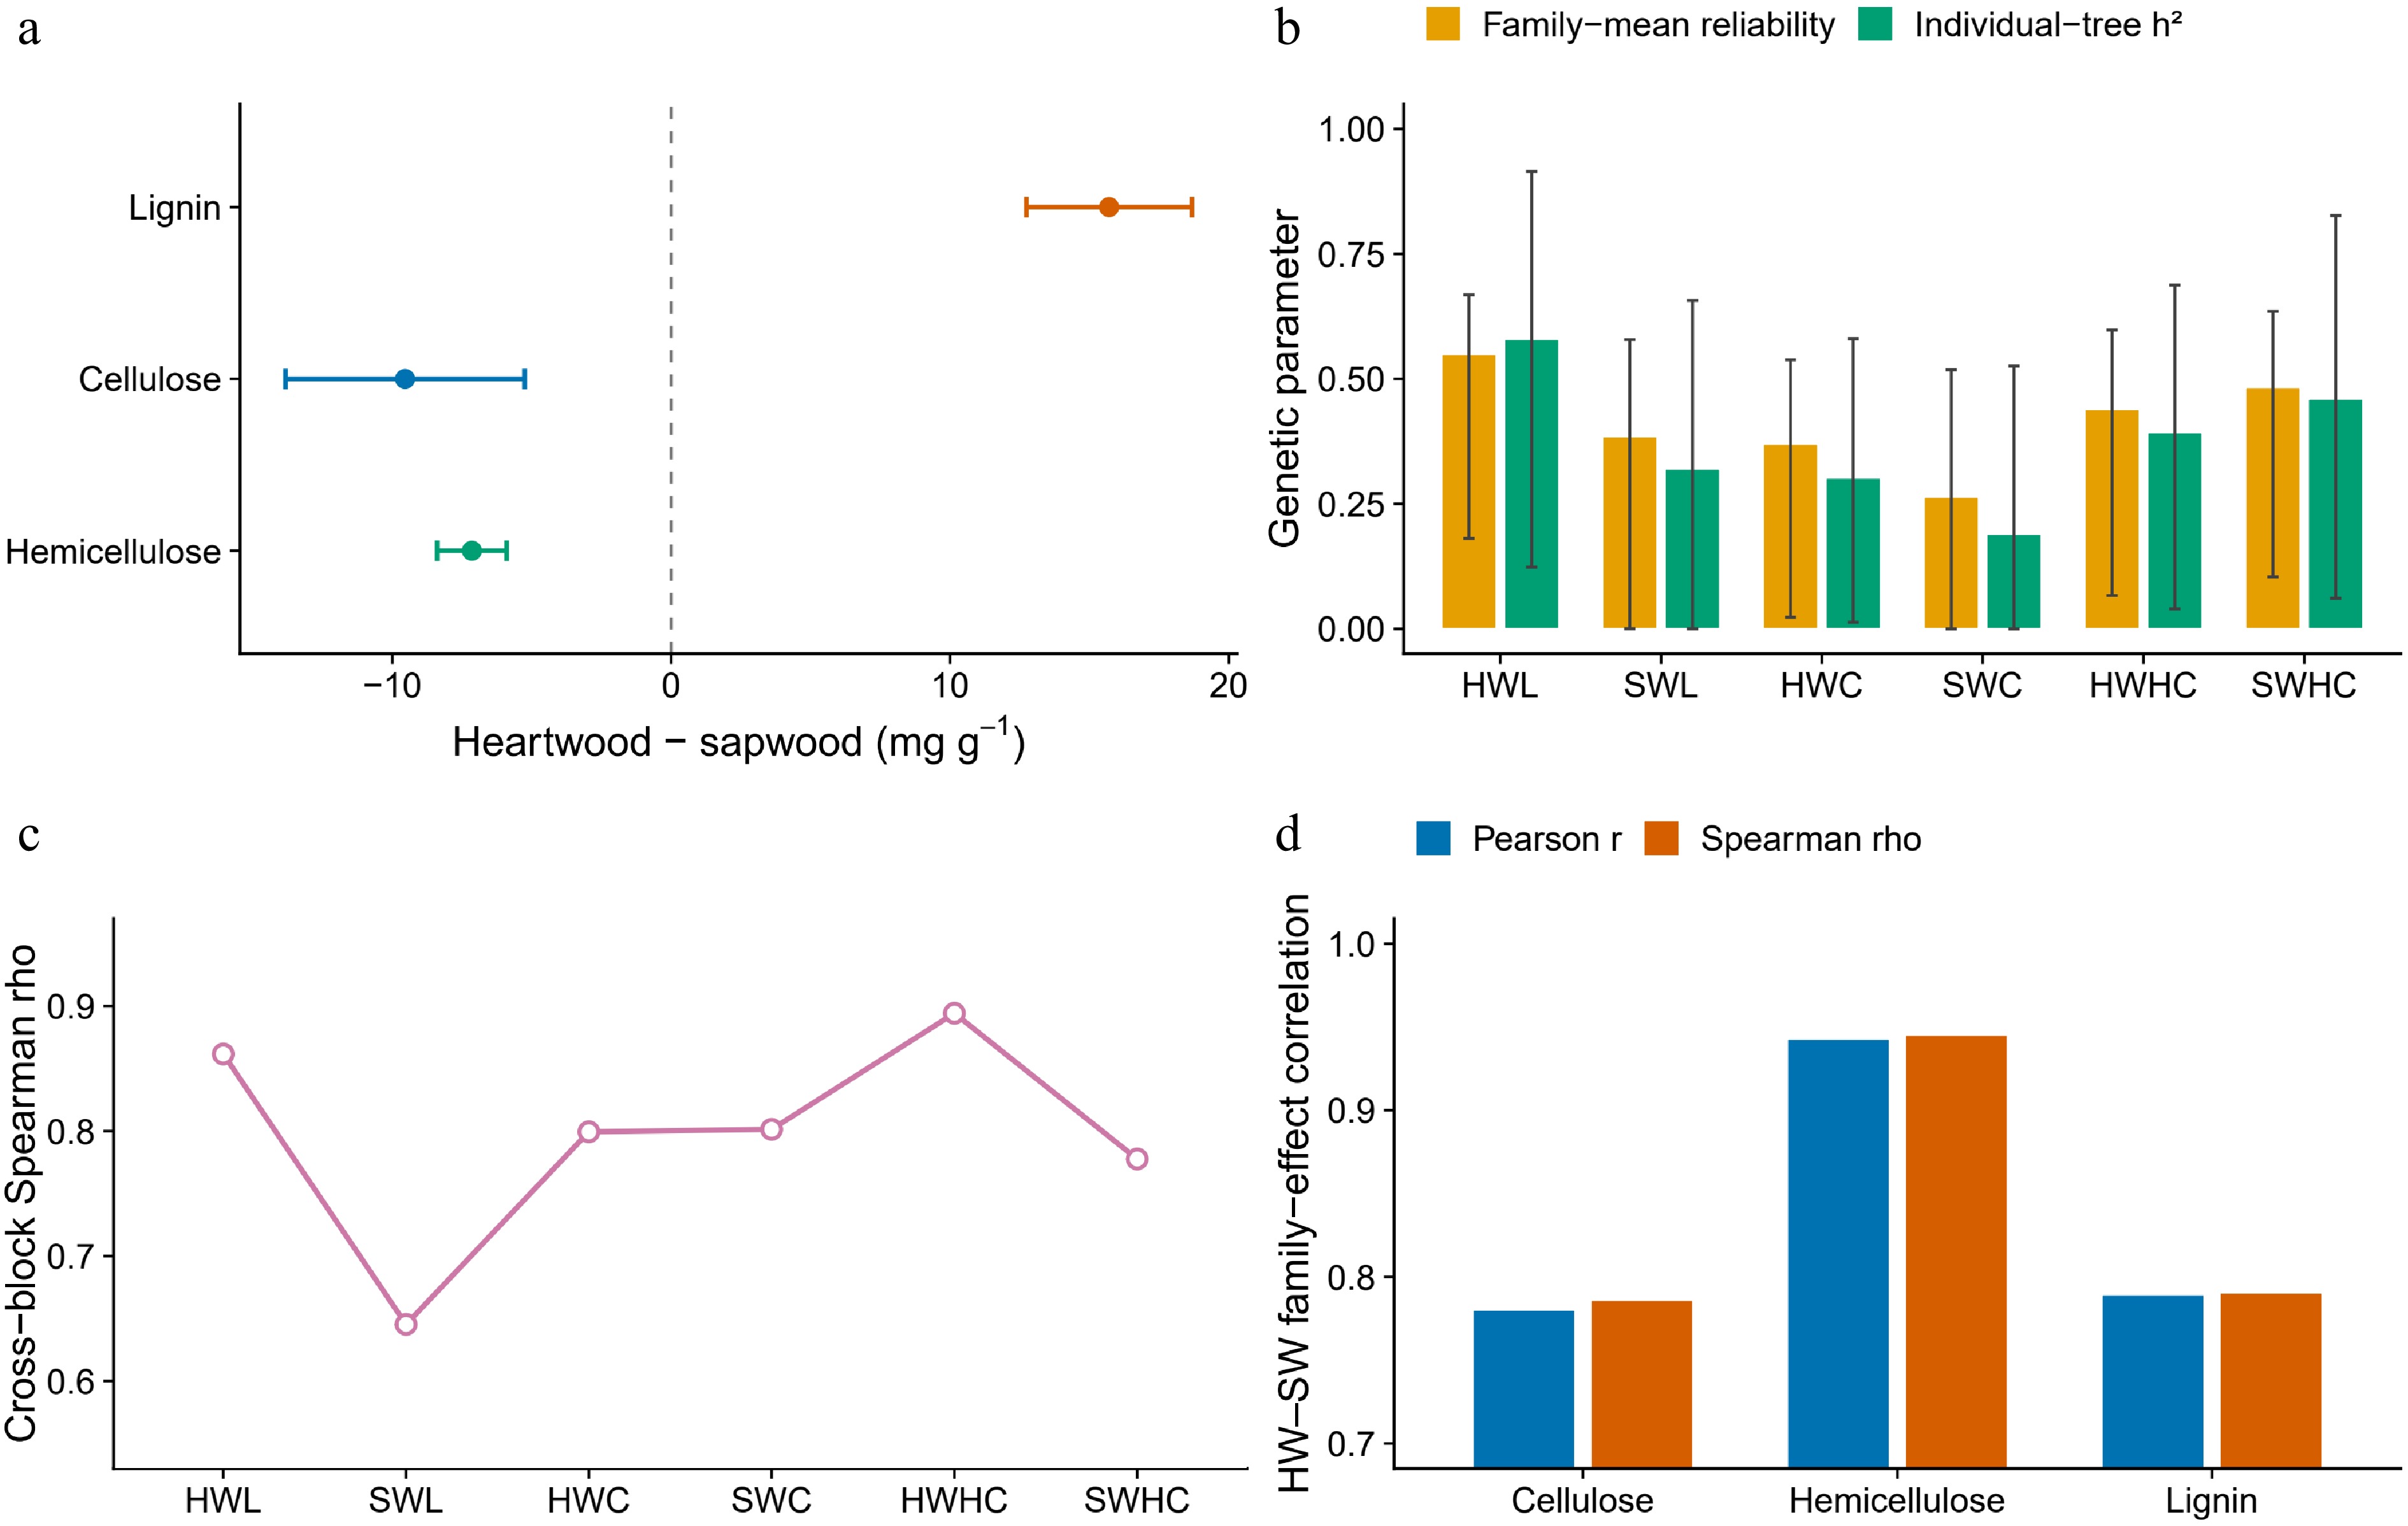
Figure 2.
Radial chemistry, family signal, and tissue covariance. (a) Mean heartwood-minus-sapwood differences for 207 trees with 95% confidence intervals. (b) Individual-tree heritability and family-mean reliability for 26 families; bars are point estimates and error bars are family-stratified bootstrap 95% intervals from 200 replicates. (c) Spearman correlations between block-specific means for the 23 HSI families represented in both blocks. (d) Pearson and Spearman correlations between heartwood and sapwood BLUPs for the 24 HSI families.
The mixed models detected family signal in all six traits. Individual-tree heritability ranged from 0.190 for SWC to 0.579 (Fig. 2b) for HWL, and family-mean reliability ranged from 0.264 to 0.549. Bootstrap intervals were broad for several traits, as expected from 26 families, but all point estimates converged. Family-by-block variance was negligible for five traits and small for SWC relative to residual variance (Supplementary Tables S2, S3).
Within-site cross-block rank concordance was moderate to strong. Spearman ρ ranged from 0.645 for SWL to 0.894 for HWHC among the 23 HSI families represented in both blocks (all p < 0.001; Fig. 2c). Heartwood and sapwood family BLUPs were also correlated within components, with rank correlations of 0.786 for cellulose to 0.945 for hemicellulose. The covariance creates scope for borrowing information across tissues, but it also makes TT-PLSR a demanding baseline (Supplementary Table S8; Fig. 2d).
Conditional generalization to families excluded from HSI-model calibration
-
FRCF-MTR transferred spectral predictions to families excluded from HSI-model calibration. Across the five repeated family-wise partitions, trait-level mean R2 ranged from 0.618 to 0.921 and Spearman ρ from 0.804 to 0.961; the six-trait repeated-run means were 0.813 and 0.902. Averaging each family's five independently held-out predictions produced the ensemble summary, for which mean R2 was 0.820 (trait range 0.625–0.926; Fig. 3a) and mean Spearman ρ was 0.902 (Fig. 3b). Thus, R2 = 0.813 describes the mean of five complete repeated runs, whereas R2 = 0.820 describes performance after prediction averaging.
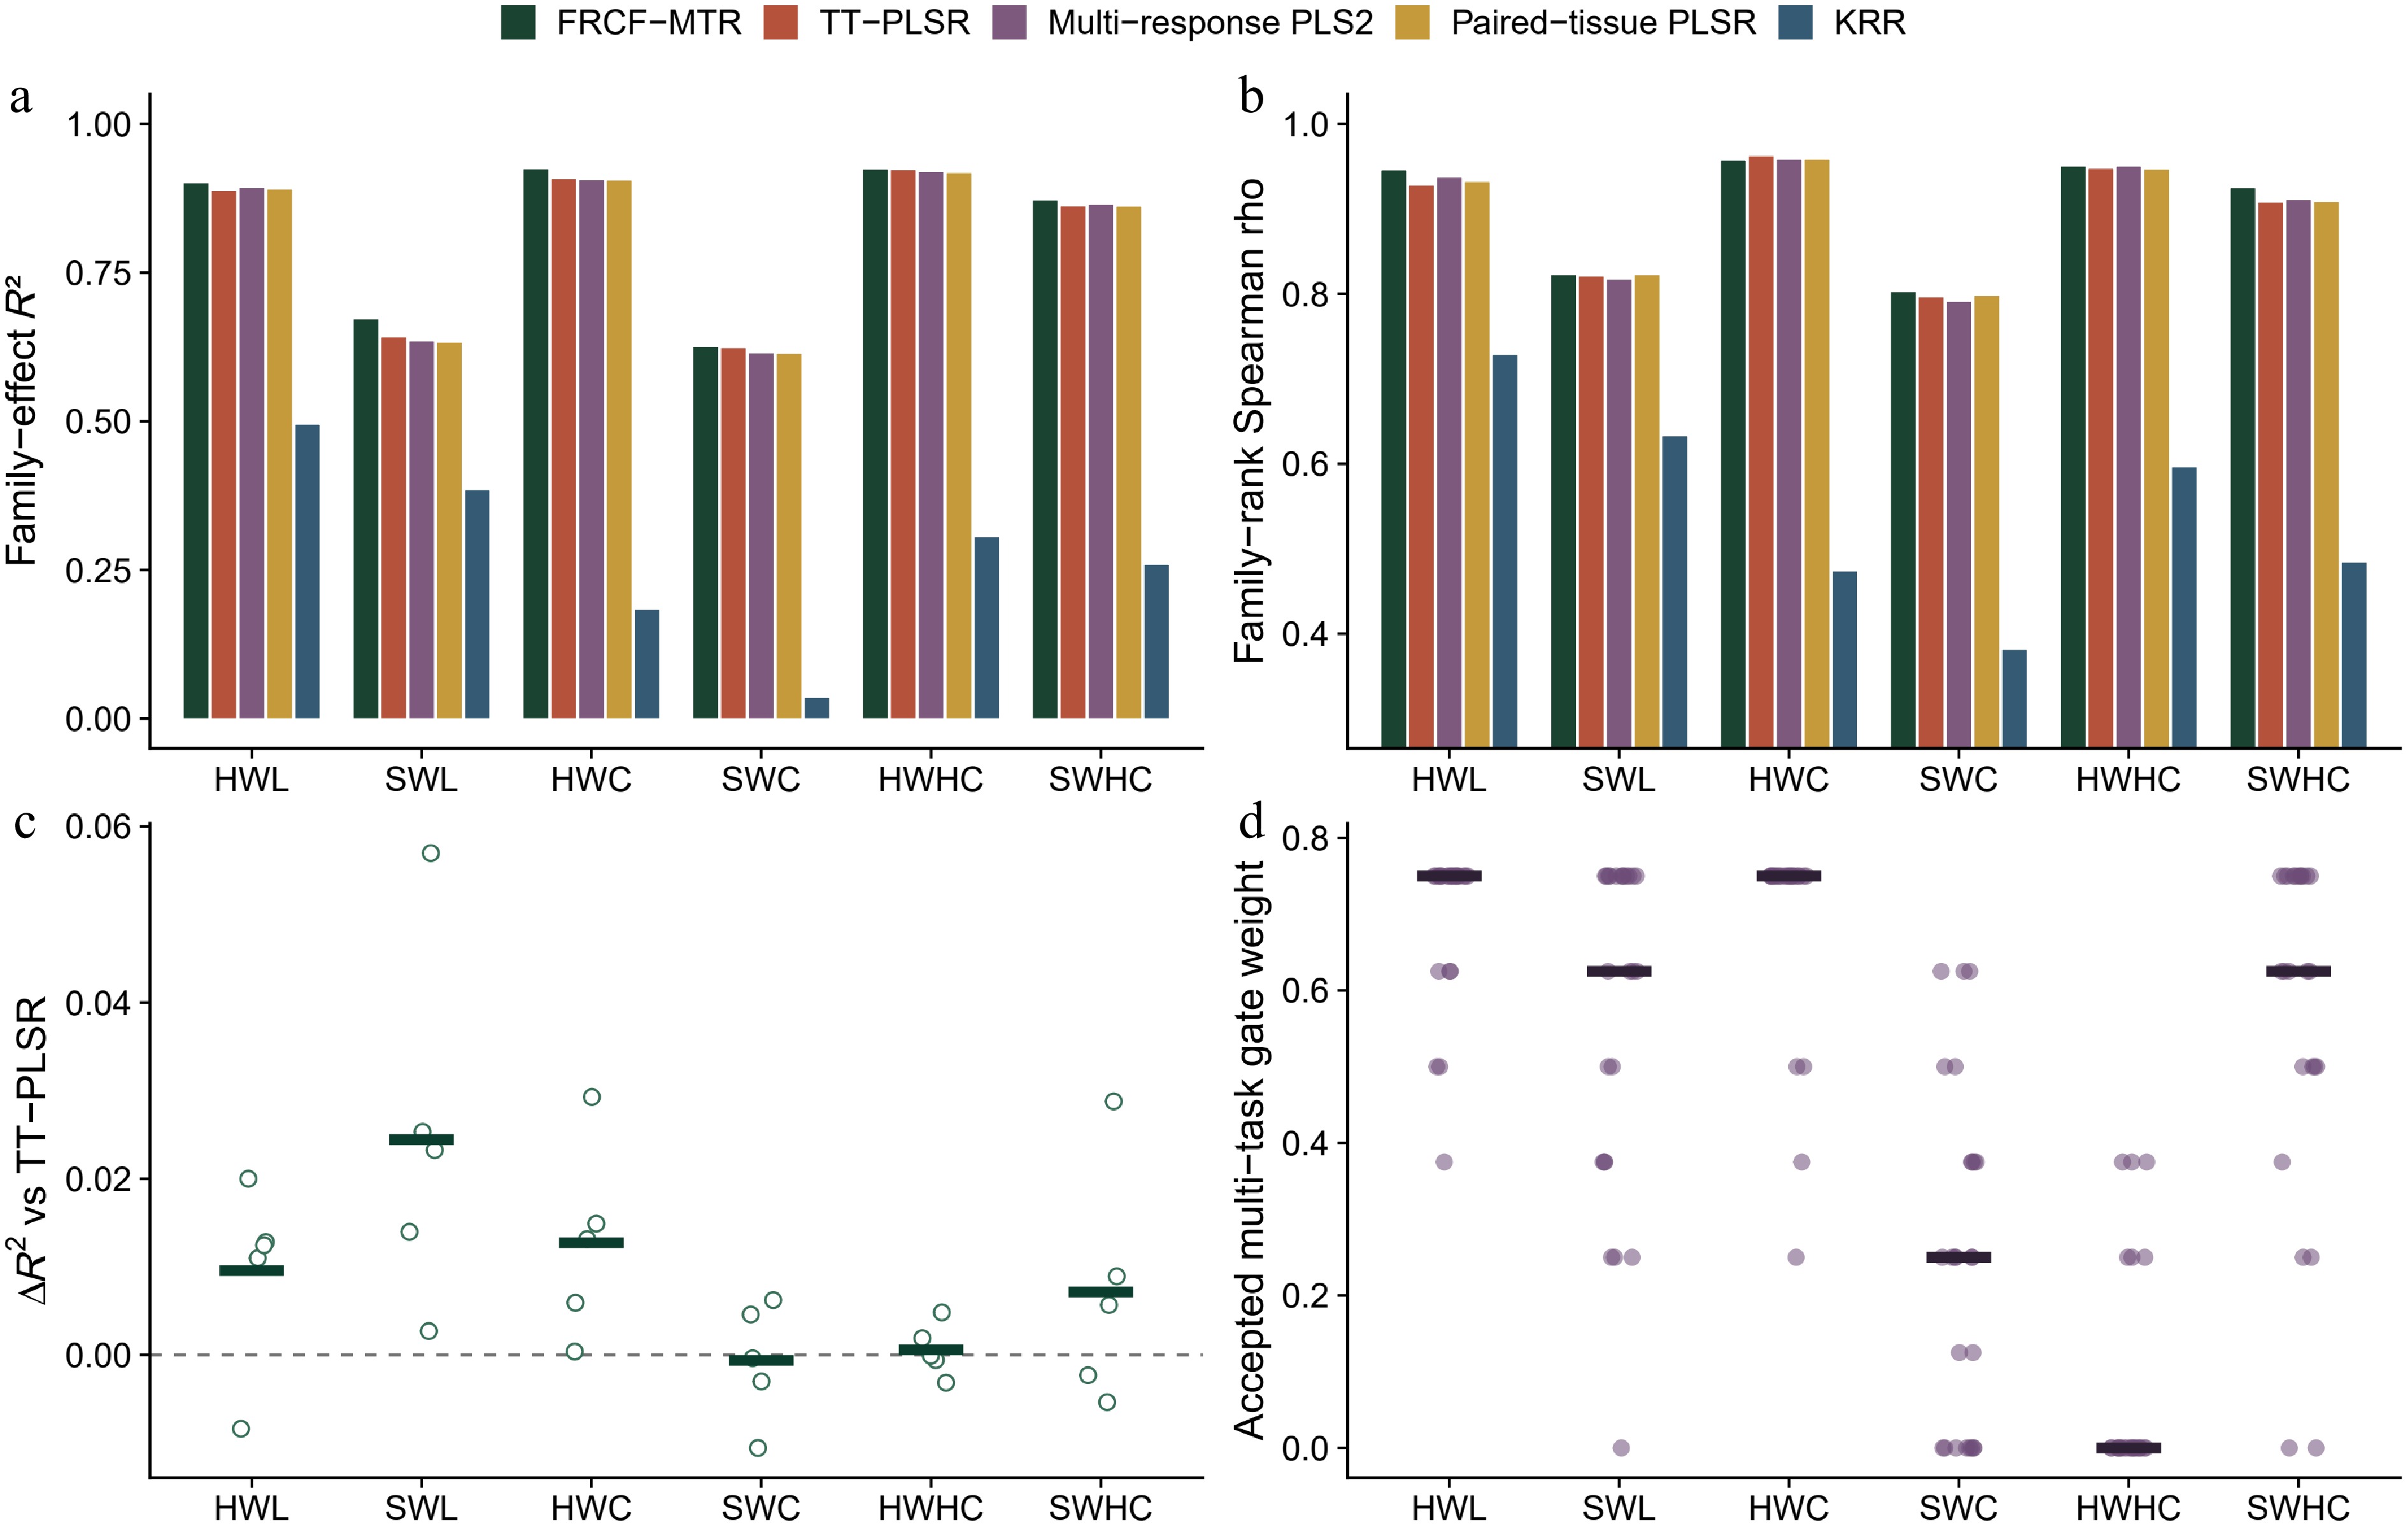
Figure 3.
Family-wise prediction and trait-adaptive correction. (a) Family-effect R2 and (b) family-rank Spearman ρ after averaging five independent family-wise predictions per family. (c) Difference in R2 between FRCF-MTR and TT-PLSR in each outer repeat; horizontal segments indicate trait means. (d) Gate weights selected only from inner training-family splits; zero indicates reversion to TT-PLSR.
FRCF-MTR had the highest mean ensemble R2 (0.820) among the evaluated models, followed by TT-PLSR (0.808), multi-response PLS2 (0.806), and paired-tissue PLSR (0.804). Mean normalized squared error was 0.1839 for TT-PLSR and 0.1724 for FRCF-MTR, an absolute reduction of 0.0115 and a relative reduction of 6.25%. The family-clustered 95% bootstrap interval for the absolute reduction was 0.0028–0.0202, and the family-level joint sign-flip test gave two-sided P = 0.0182 (directional one-sided P = 0.0091). Fold-level reductions ranged from −0.0169 to 0.0334; 19 of 25 folds favored FRCF-MTR, and six favored TT-PLSR (Fig. 3c; Supplementary Tables S11, S12). The evidence therefore supports a small average refinement, not uniform superiority. Gains were clearest for HWL (Fig. 4a), SWL (Fig. 4d), and HWC (Fig. 4b), modest for SWHC (Fig. 4f), negligible for SWC (Fig. 4e), and absent for HWHC (Fig. 4c).
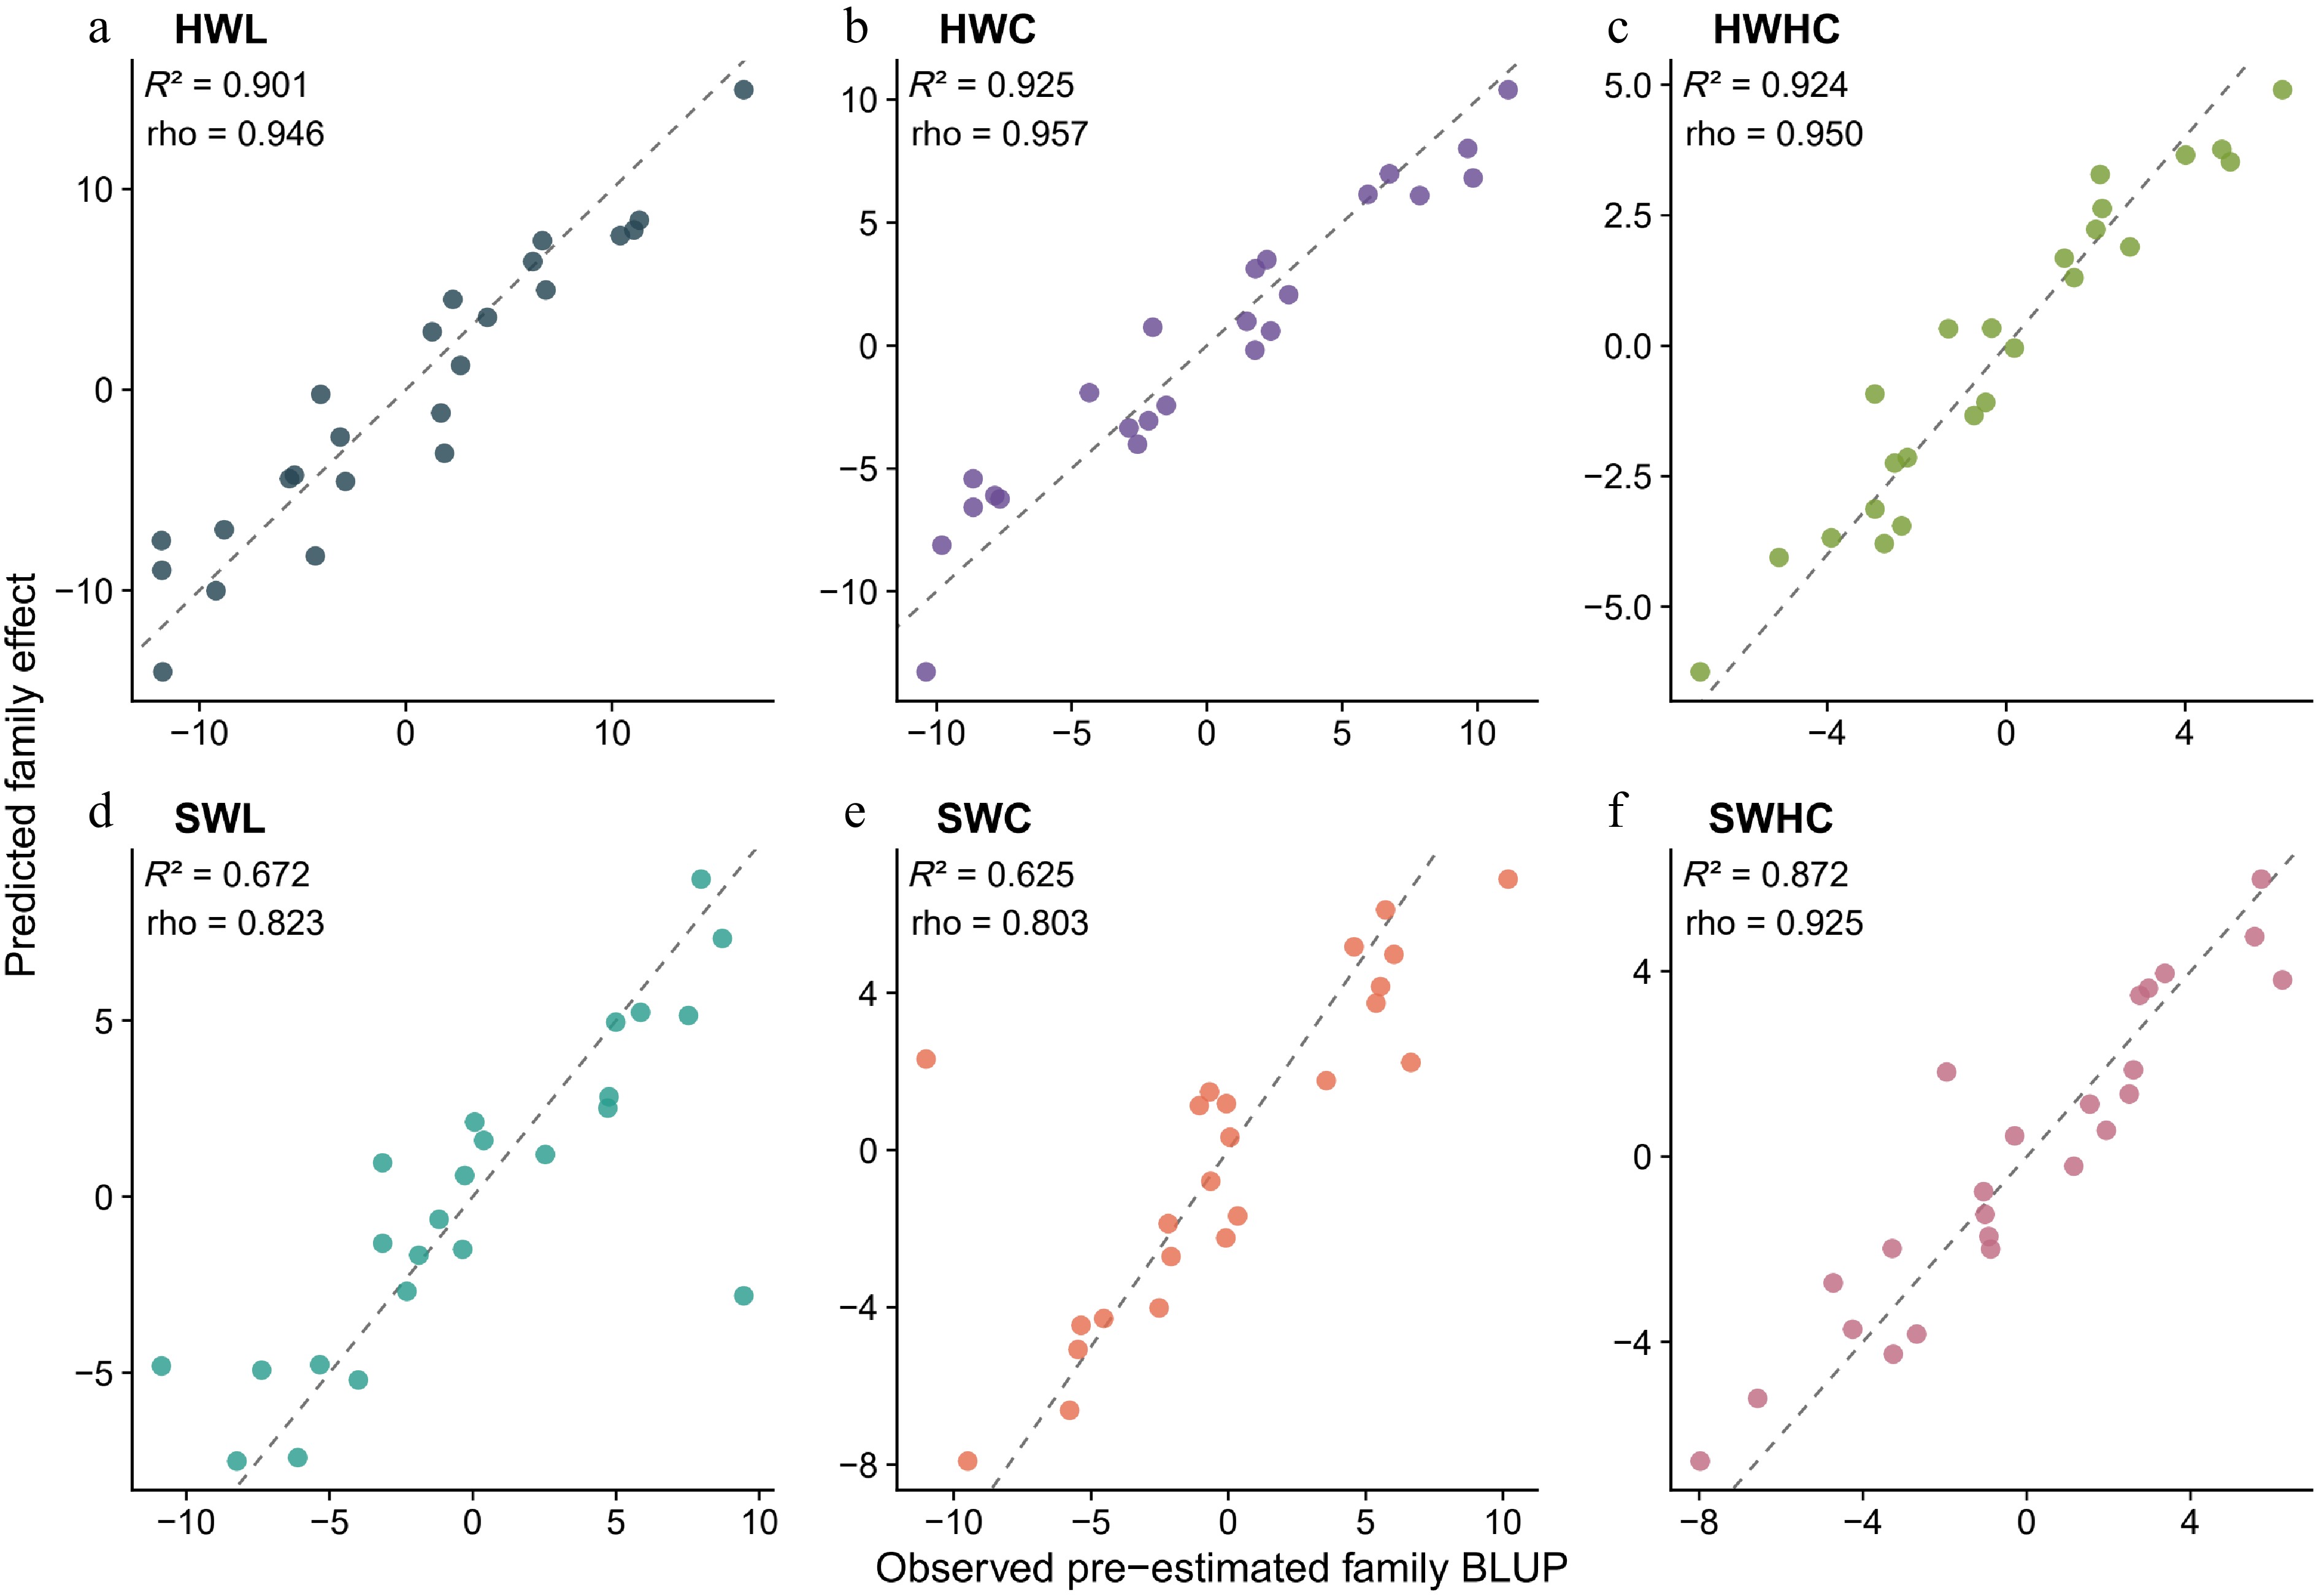
Figure 4.
Held-out-family prediction of block-adjusted family effects. Panels (a)–(f) show HWL, SWL, HWC, SWC, HWHC, and SWHC, respectively. Each point represents one family. Predictions are the means of five family-wise outer repeats; dashed lines indicate equality.
LOFO was evaluated as a family-wise sensitivity analysis using the same 24-family panel, site, and fixed BLUP reference table. Trait-level R2 ranged from 0.614 to 0.930, Spearman ρ from 0.783 to 0.955, and the respective six-trait means were 0.825 and 0.902. Agreement with repeated grouped validation indicates that performance was not tied to one allocation of families. KRR was much less stable than the latent-variable models (Supplementary Tables S5, S10). Agreement with repeated grouped validation indicates that performance was not tied to one allocation of families (Table 1).
Table 1. Absolute error of family-effect predictions for families excluded from calibration.
Validation Model Traits Mean RMSE RMSE range RMSE change vs TT-PLSR (%) Grouped 5 × 5 ensemble TT-PLSR 6 2.236 0.908–3.340 0.00 Grouped 5 × 5 ensemble Paired-tissue PLSR 6 2.256 0.939–3.382 0.91 Grouped 5 × 5 ensemble Multi-response PLS2 6 2.243 0.929–3.372 0.30 Grouped 5 × 5 ensemble KRR 6 4.479 2.735–5.837 100.32 Grouped 5 × 5 ensemble FRCF-MTR 6 2.145 0.903–3.195 −4.06 LOFO TT-PLSR 6 2.204 0.879–3.268 0.00 LOFO FRCF-MTR 6 2.124 0.871–3.237 −3.61 Grouped 5 × 5 denotes five repeated five-fold family-wise validation; the table reports metrics after averaging the five family-wise predictions for each family. LOFO denotes leave-one-family-out validation. RMSE is expressed in mg·g−¹. Negative change denotes lower error than TT-PLSR. Complete R2 and rank-correlation values are provided in the accompanying machine-readable table. Trait-adaptive use of multi-task information
-
The inner gate used tissue-pair information selectively (Fig. 4). Mean accepted weights were 0.700 for HWL, 0.575 for SWL, 0.695 for HWC, 0.245 for SWC, 0.075 for HWHC, and 0.570 for SWHC (Fig. 3d). HWHC reverted completely to TT-PLSR in 19 of 25 outer folds, whereas HWL and HWC accepted a non-zero correction in every fold. The pattern reflects trait-specific complementarity rather than a common multi-task effect (Supplementary Table S6; Supplementary Fig. S2).
The gate reduced, but could not eliminate, outer-family regression. It was selected from inner family partitions whose composition differed from the outer test families. Accordingly, HWC gained in R2 while its rank correlation and top-set recovery did not improve, and SWC remained essentially unchanged (Fig. 4b and e). This behavior is reported as part of the method's op erating boundary, not concealed by the across-trait mean.
Consequences for family selection
-
Prediction accuracy translated into useful, but imperfect, selection fidelity. Across traits, FRCF-MTR recovered 0.807 of the five families selected by observed BLUPs (Fig. 5a), retained 0.943 of the attainable selection differential (Fig. 5b), and achieved a mean NDCG of 0.970. TT-PLSR recovered 0.800; thus, the average improvement in boundary decisions was small. Trait-specific differences were informative: FRCF-MTR improved HWL, SWL, and SWHC recovery, whereas HWC and SWC did not benefit at the top-20% cutoff.
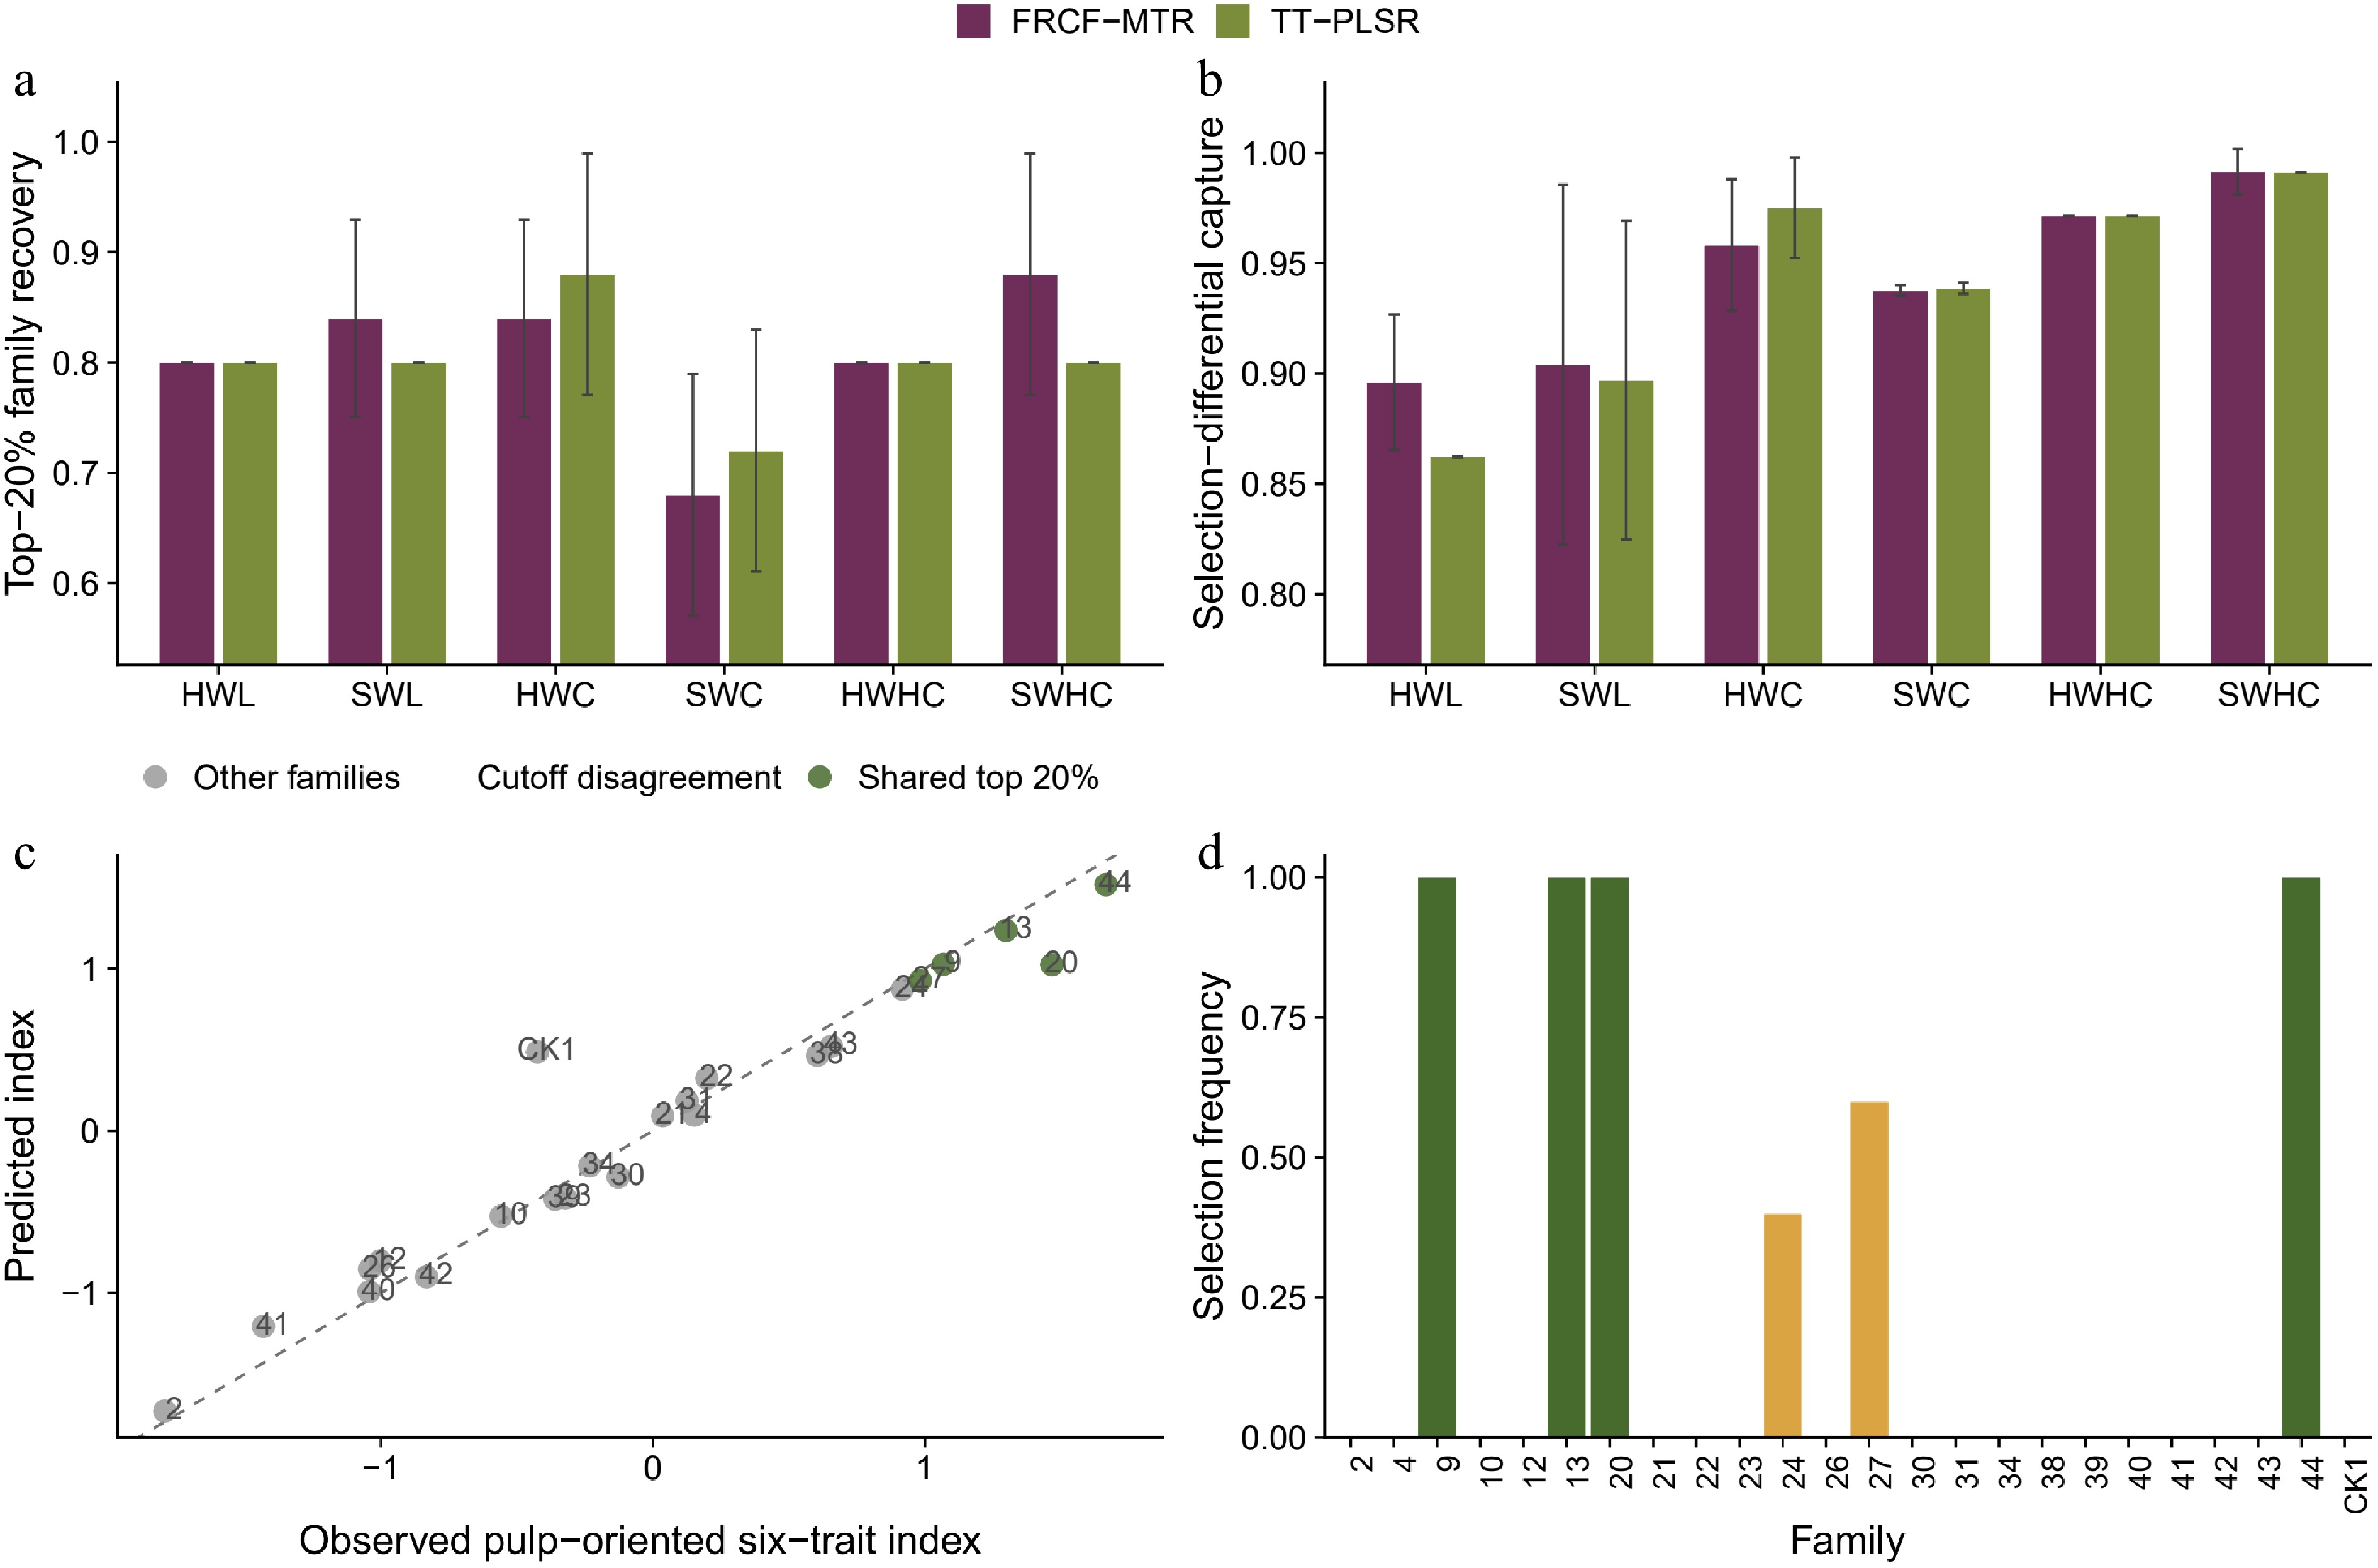
Figure 5.
Breeding-oriented selection utility. (a) Recovery of the observed top 20% of families and (b) fraction of attainable selection differential retained by predicted selection. Bars are means and standard deviations across five outer repeats. (c) Observed and predicted pulp-oriented six-trait index by family; shared top families are green and cutoff disagreements are coral. (d) Frequency with which each of the 24 families was selected by the predicted index.
The pre-specified six-trait pulp-oriented index was more stable than most single traits. Under equal weights, FRCF-MTR and TT-PLSR selected exactly the same five families in each one of the five repeats, although their within-set rank order could differ (Fig. 5c). Consequently, both models had identical mean top-20% overlap (0.920) and selection-differential capture (0.996); their mean rank correlations were 0.954 and 0.956, respectively. Across the four 2:1 sensitivity schemes, FRCF-MTR top-20% overlap ranged from 0.920 to 1.000 and selection-differential capture from 0.992 to 1.000; TT-PLSR ranged from 0.880 to 0.920 and from 0.988 to 0.999. The practical conclusion was unchanged, and neither model's index result depended on an optimized weighting scheme (Supplementary Table S13).
Selection frequency across the five repeats separated a stable advancement core from families near the cutoff. A family selected repeatedly is less sensitive to the composition of the calibration families; intermittent selection identifies candidates that require confirmatory wet chemistry. This distinction is more useful than presenting one deterministic list from 24 families (Fig. 5d).
Robustness to validation scheme and auxiliary information
-
The HSI-only specification remained the preferred operational model (Fig. 6a−d). Mean family-wise R2 was 0.820. Adding structure gave 0.817, adding thermal descriptors gave 0.814, and combining both gave 0.810. In this predefined family-grouped analysis, none of the auxiliary sets improved mean family-wise performance; the final model therefore used HSI alone (Supplementary Table S7).
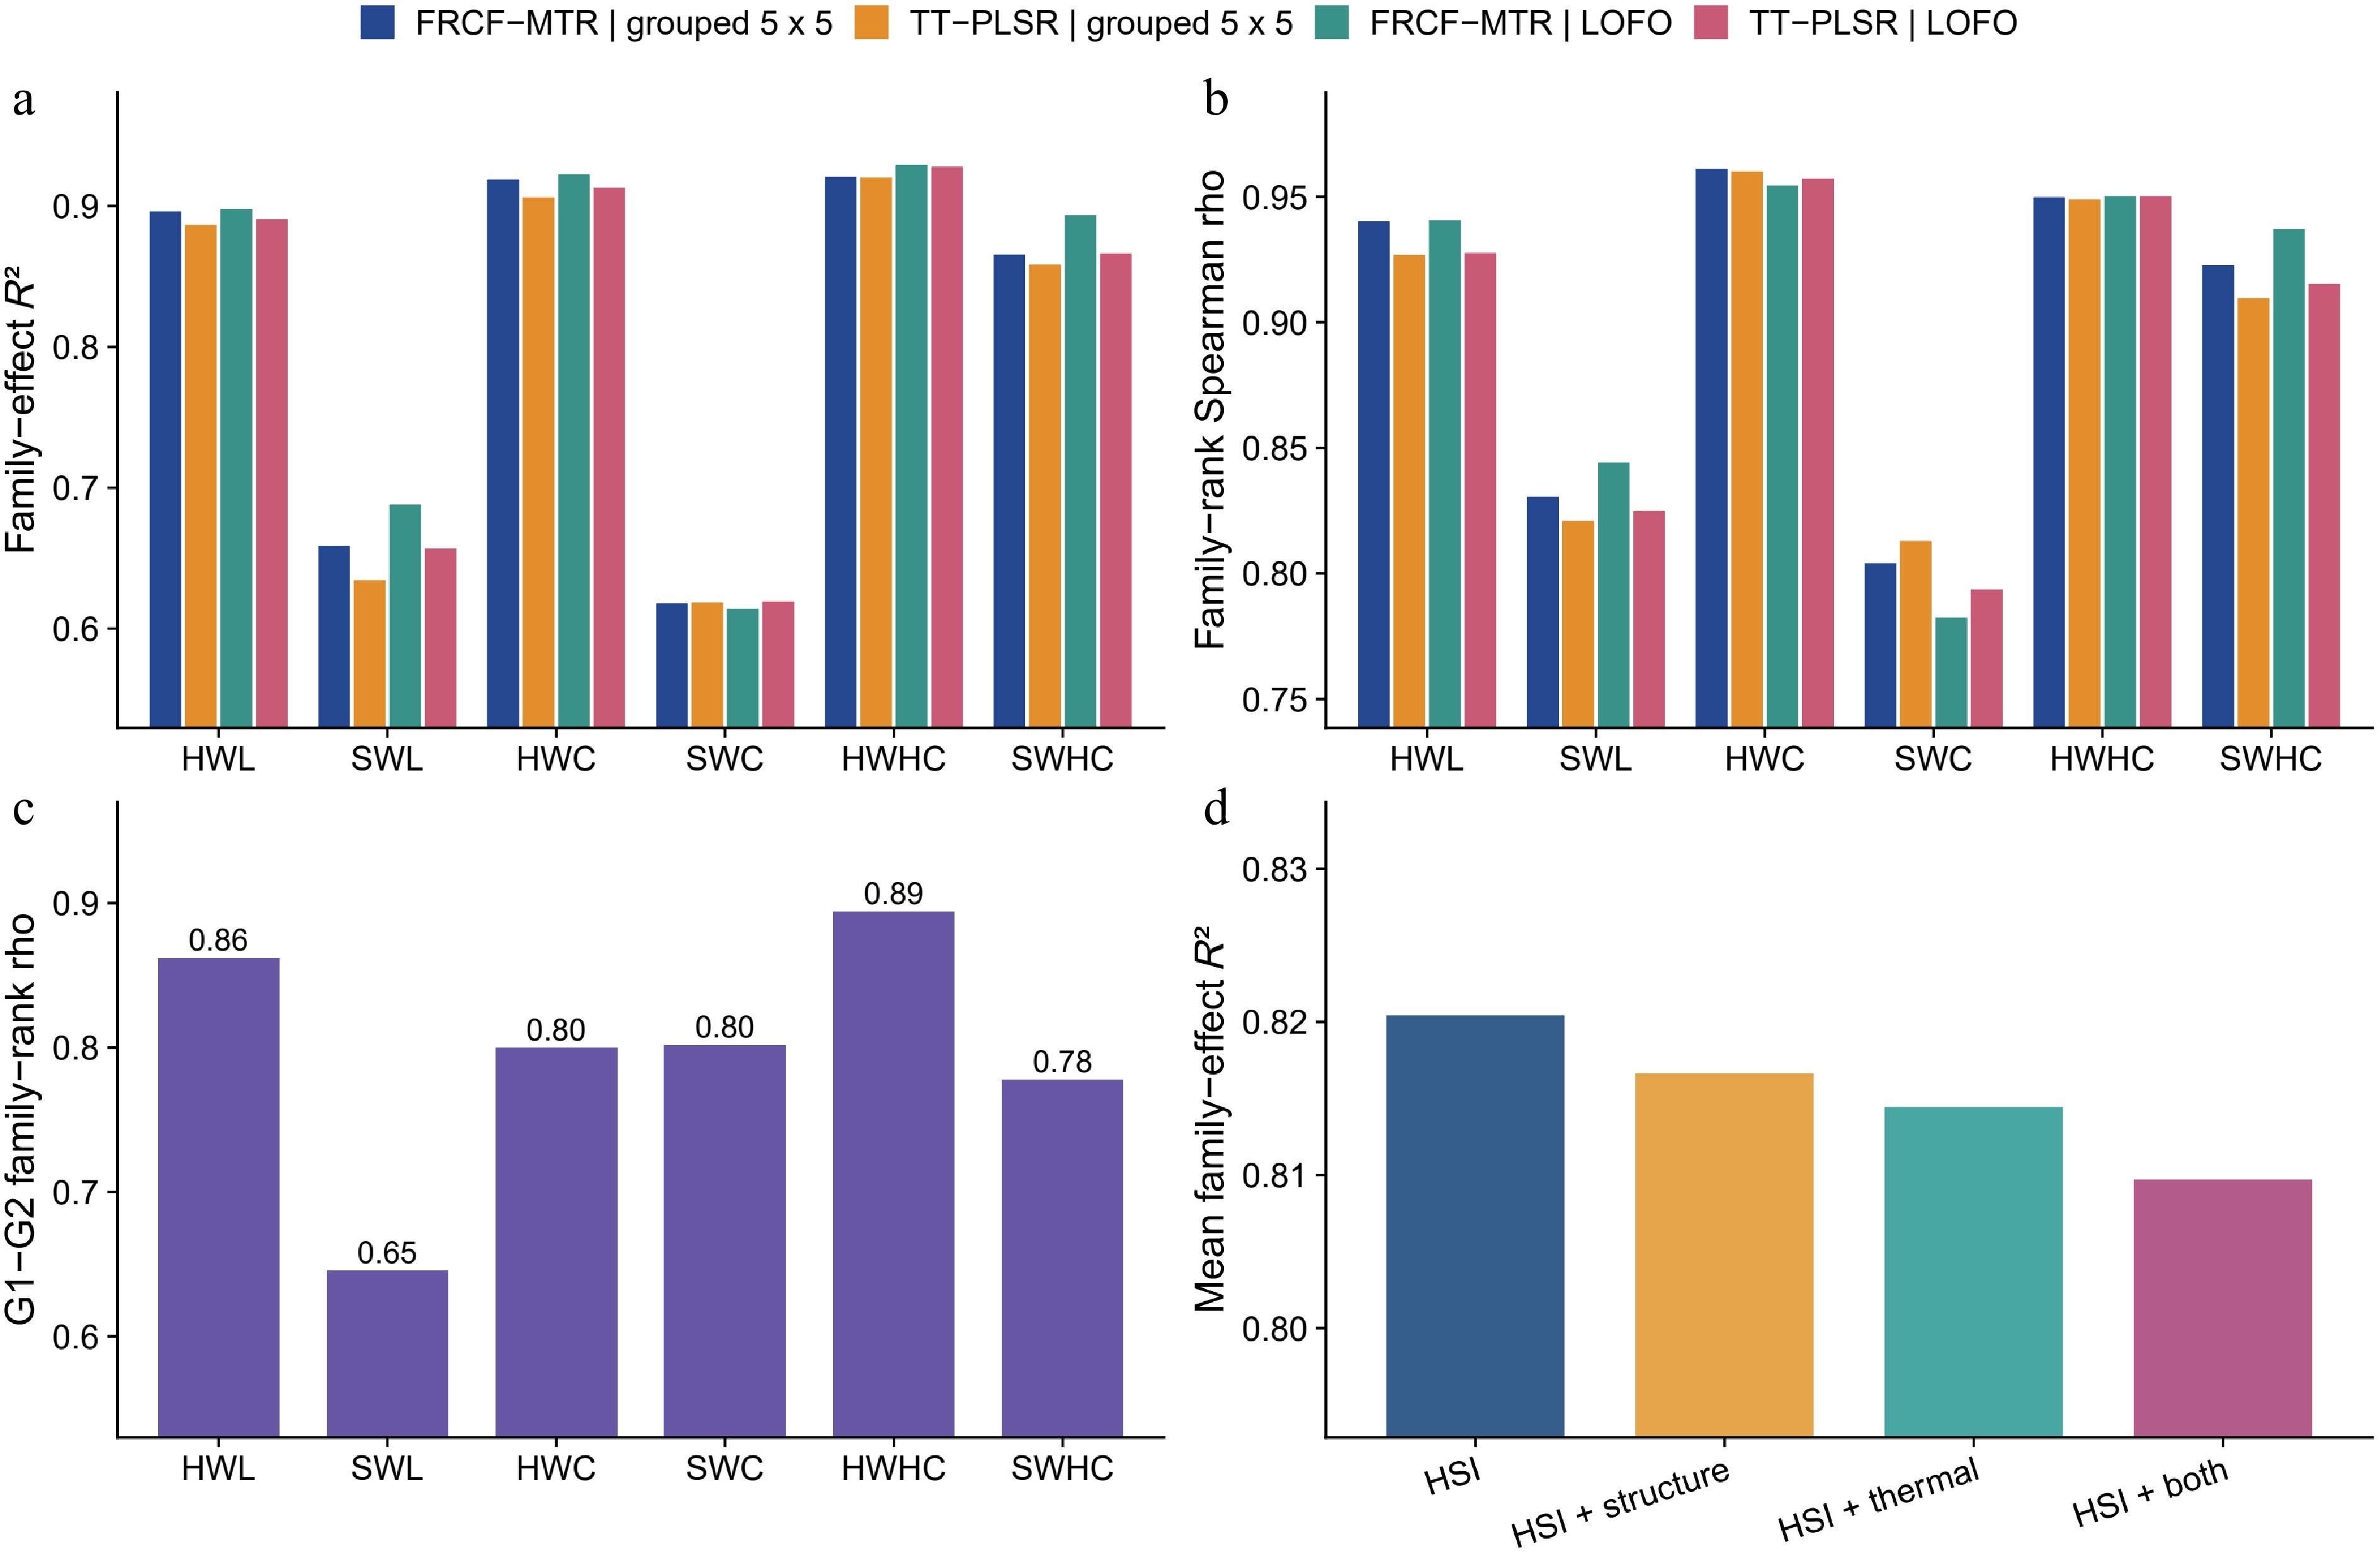
Figure 6.
Robustness to validation scheme, block, and auxiliary inputs. (a) Family-effect R2 and (b) rank correlation under repeated family-wise validation and leave-one-family-out validation. (c) Within-site cross-block family-rank concordance for 23 families. (d) Predefined auxiliary ablation; HSI only was retained because structural and thermal descriptors did not improve mean family-wise performance.
Repeated grouped validation, LOFO, and the 23-family cross-block diagnostic converged on the same qualitative conclusion: family chemistry can be ranked within this juvenile, single-site trial. Their agreement does not establish transfer across ages, sites, or instruments. In particular, the SWL cross-block correlation of 0.645 shows that stability was not equally strong for all traits.
-
The main contribution is the alignment of the prediction target, validation unit, and breeding decision. Conventional wood-spectroscopy studies evaluate unknown specimens; here, the target was a block-adjusted family effect, and the test unit was an entire family absent from HSI-model calibration. This distinction matters because random tree splits permit relatives to occur on both sides of the validation boundary and can reward interpolation within known genetic groups[23].
This distinction also clarifies the model comparison. TT-PLSR was already strong (ensemble mean R2 = 0.808), whereas FRCF-MTR increased the mean to 0.820 and selected exactly the same five families as TT-PLSR in each of the five equal-weight six-trait index repeats. Thus, complete-family withholding and decision-aligned evaluation constitute the principal methodological contribution; the multi-task layer is a guarded, trait-dependent refinement rather than a generally superior replacement for TT-PLSR.
Spectroscopy has long been proposed for early wood-quality screening[44]. HSI adds radial tissue identity, but sensing becomes useful for breeding only when predictions are evaluated at the unit that will be advanced. Recent Chinese fir work demonstrated the value of HSI and machine learning for rapid forest-germplasm phenotyping[14]. The present study extends that measurement logic to complete-family withholding and BLUP-based selection.
Family-level performance should not be compared directly with specimen-level chemical calibration or crown-scale growth prediction. UAV phenomic selection in slash pine has reported lower predictive ability for growth, but canopy traits integrate competition and temporal environment and therefore represent a different endpoint[19]. Close-range UAV phenotyping has also improved genetic association analysis in slash pine[22]. Together, these studies show that sensor value depends less on modality alone than on whether the estimand and validation design match the intended decision.
Genetic interpretation of radial chemical covariance
-
The heritability estimates (0.190–0.579) are plausible for juvenile pine wood chemistry. Loblolly pine progeny tests have reported trait- and radial-zone-dependent genetic control[8]. Multi-site work found that juvenile chemical traits can also show genotype-by-environment effects[45]. Maritime pine likewise exhibits genetic variation in wood chemistry[46]. The current values therefore support selection within the trial but do not imply deterministic inheritance.
The G1–G2 correlations (0.645–0.894) show repeatable within-site family ordering, although SWL was only moderately concordant. They are not Type-B genetic correlations. Separate slash pine research showed that multi-trait family selection must account for trait-specific genetic control and trade-offs[47]. The present two-block result supplies a local prerequisite for HSI ranking, not evidence of regional stability.
Heartwood-sapwood rank correlations ranged from 0.786 to 0.945. The two tissues share genotype and developmental history, whereas heartwood formation contributes to systematic radial differentiation. Consequently, paired spectra contain useful residual information, but much of the family signal is already present in the target tissue. This covariance structure explains both the success of TT-PLSR and the limited, trait-specific scope for multi-task gain.
Why the guarded multi-task model produced a modest gain
-
Multi-task learning is useful when tasks share predictive information that their separate models do not already capture[25]. Here, TT-PLSR already achieved mean R2 = 0.804. Each grouped training fold contained only about 19 or 20 families, so a flexible correction could readily fit split-specific covariance. FRCF-MTR improved mean error, but the size and direction of the benefit varied among traits.
The 24 families, rather than the repeated folds or the 144 family–trait combinations, define the effective biological sample size. Repetition stabilizes allocation-dependent summaries but does not create independent families. The clustered interval and joint sign-flip analysis therefore operate at family level and preserve cross-trait correlation. Even with these safeguards, the interval applies only to this family panel and cannot establish a universal advantage for the nested correction.
Reduced-rank regression constrained six correlated chemistry targets to a smaller coefficient space[26]. The ordering term directed attention to family rank, while the gate rejected corrections that failed in inner family splits. Nevertheless, an inner gate cannot guarantee non-degradation in an outer family set with a different covariance structure. The lower top-set recovery for HWC and SWC is therefore an expected form of transport error and should guide future gate calibration.
KRR provided a useful negative control. Its mean ensemble R2 was 0.278, far below the PLS-based models. With 181 strongly collinear bands but fewer than 20 training families in many outer folds, radial basis distances are unstable, and kernel regularization can fit family-specific geometry that does not transfer. PLS compresses covariance before prediction and was consequently more robust. This failure argues for parsimonious latent-variable baselines when the effective sample size is the number of families, not the number of trees.
Selection utility and deployment boundaries
-
Selection metrics qualify the global fit. FRCF-MTR recovered 0.807 of trait-wise top families and retained 0.943 of the attainable differential, but TT-PLSR was nearly as effective. NDCG places greater weight on correct ordering near the top of a list[39]; it therefore revealed that most disagreements occurred near the advancement threshold rather than between extreme families. The six-trait index further reduced this boundary instability, but did not establish a unique advantage for FRCF-MTR.
HSI should therefore be used as phenomic pre-selection, not as a substitute for genetic evaluation. The model can reduce the number of families requiring full laboratory confirmation or increase the number screened at a fixed assay budget. A defensible deployment sequence is to scan representative discs, rank families with locked coefficients, confirm candidates near and above the selection threshold by replicated wet chemistry, and update family BLUPs with the trial design retained[34].
The approach is not nondestructive at the standing-tree level because a breast-height disc requires destructive sampling. Its operational value arises when such sampling is already part of a progeny test and chemical assays are the bottleneck. Resistance drilling, acoustics, and crown sensing serve different niches[48]. Silvicultural treatments can also alter juvenile wood-quality expression, so calibration populations should retain management context[49]. The present workflow is best viewed as a laboratory-throughput layer between field sampling and confirmatory chemistry.
The auxiliary ablation also guards against complexity without biological gain. Structural and thermal descriptors may be valuable for growth or stress, but they did not improve family-wise chemistry prediction in the predefined grouped analysis. Cross-fitted second-stage prediction follows the central safeguard of stacked regression[50]. Interpretable multi-source fusion has improved cross-region DBH estimation in Chinese fir, but that gain was specific to a forest-mensuration endpoint[51]. A slash pine orchard study likewise showed that stacked spectral models can support management when inputs and targets are closely aligned[52]. Integration should therefore remain conditional on family-wise transfer performance.
Implications for smart tree breeding
-
A digital-breeding pipeline should define the target population, downstream decision, and uncertainty-management strategy. Whole-family withholding, block-aware aggregation, and selection metrics provide a transparent basis for evaluation. The same discipline is important for image-derived forest phenotypes used in genetic analysis[22]. It is also compatible with structured data resources that connect phenotype, sensor, and genomic information[43]. The evidence from provenance testing further shows that realized gains for growth and wood traits can diverge, making decision-specific multi-trait evaluation necessary[53].
FRCF-MTR is complementary to genomic selection rather than evidence of genetic causality. Dense markers predict breeding values through realized relationships and linkage disequilibrium[54]; HSI predicts family chemistry through high-dimensional phenotype. Phenomic selection provides a formal route for treating such measurements as indirect predictors[55]. Hyperspectral relationship matrices have also been used to connect spectral similarity with genetic prediction[56]. In future populations containing both sources, the HSI score can be tested as a secondary phenotype or combined with genomic relationships, but its incremental value must again be evaluated on families excluded from training.
The current evidence remains bounded by 24 HSI families, one site, and one juvenile age. With only 24 family targets, model comparisons have limited power; the half-sib multiplier also depends on negligible selfing and unrelated pollen parents. Training composition is known to govern genomic-prediction transfer[57]. Environmental plasticity among improved forest-tree families further cautions against equating two local blocks with multi-site stability[58]. Early wood-quality measurements can correlate with rotation-age traits in radiata pine, but the strength is trait- and age-dependent[59]. Juvenile and mature pine wood also differ in chemical composition and spectral calibration behavior[60]. The next decisive test is therefore a locked, prospective validation across sites and ages, with age–age and Type-B genetic correlations estimated before the HSI ranking is used for operational selection.
Radiometric limitations restrict model transferability. The absence of traceable white/dark references and complete acquisition logs restricted modelling to relative signals generated within the Xenics system and acquisition series and precluded cross-instrument transfer. The coefficients apply only to comparable juvenile stem discs acquired with the same workflow and used for preliminary family triage followed by confirmatory chemistry. New sites, ages, batches, or instruments require prospective locked validation and, where needed, recalibration.
-
Family-wise SWIR-HSI prediction was feasible within this juvenile single-site slash pine trial. The repeated-run mean R2 of 0.813 and the five-prediction ensemble mean R2 of 0.820 are distinct summaries. Relative to the strong TT-PLSR benchmark, FRCF-MTR produced a small family-cluster-supported but non-uniform average error reduction and selected the same five families as TT-PLSR in every equal-weight six-trait repeat. The principal contribution is the tissue-matched, family-wise validation and breeding-decision framework. Use of a fixed reference BLUP table and uncalibrated relative SWIR-HSI signals restricts inference to conditional within-trial prediction. Prospective validation across sites, ages, acquisition batches, and instruments is required before operational or rotation-age deployment.
-
The authors confirm their contributions to the paper as follows: conceiving the analysis, curating the data, developing the workflow, and draft the manuscript: Ding X; coordinating the field experiment and sampling: Hua X; phenotyping and laboratory work: Wu S, Tan Z; designed the breeding study design, project supervision, and manuscript revision: Luan Q; interpretation and critical revision: Jiang J. All authors reviewed the results and approved the final version of the manuscript.
-
The submission package includes de-identified family-level targets, outer-fold assignments, family-wise predictions, model specifications, and source data for all figures and tables. Raw HSI cubes contain project-specific acquisition metadata and will be made available for research use subject to institutional data-sharing approval.
-
The authors declare no competing interests.
-
accompanies this paper online at: https://doi.org/10.48130/fra-0026-0012.
-
#Authors contributed equally: Xianyin Ding, Xiahui Hua
- Supplementary Table S1 Numbers of HSI-phenotyped trees from each family in field blocks G1 and G2.
- Supplementary Table S2 Variance components, individual-tree narrow-sense heritability, family-mean reliability, block contrast, and model convergence for the six radial chemistry traits.
- Supplementary Table S3 Family-stratified bootstrap medians and 95% confidence intervals for variance components, heritability, and family-mean reliability.
- Supplementary Data S1
- Supplementary Table S4 Fold-resolved family-wise predictions from five repeated five-fold validation, including baseline, multi-task, gate-weight and final FRCF-MTR predictions.
- S3
- Supplementary Table S5 Family-level predictions from leave-one-family-out validation for all six traits.
- Supplementary Table S6 Trait-specific stability-gate weights and inner-validation diagnostics across outer folds.
- Supplementary Table S7 Family-wise performance of HSI-only and auxiliary structural and thermal feature configurations.
- Supplementary Table S8 Block-adjusted family BLUP targets for the 24 HSI families and six traits.
- Supplementary Table S9 Trait-wise and six-trait-index selection utility, including top-20% recovery, selection-differential capture, NDCG, regret, and rank correlation.
- Supplementary Table S10 Complete model-performance summary for repeated family-wise and leave-one-family-out validation.
- Supplementary Table S11 Fold-level paired differences in normalized squared error between TT-PLSR and FRCF-MTR.
- Supplementary Table S12 Family-clustered bootstrap confidence intervals and joint sign-flip permutation inference for FRCF-MTR error reduction.
- Supplementary Table S13 Sensitivity of the six-trait selection index to pre-specified heartwood, sapwood, lignin and carbohydrate weighting schemes.
- Supplementary Fig. S1 Numbers of HSI-phenotyped trees per family and field block.
- Supplementary Fig. S2 Distribution and median of accepted multi-task gate weights across repeated family-wise folds for each trait.
- Supplementary Fig. S3 Repeat-wise mean family-effect R² and Spearman rank correlation for FRCF-MTR and TT-PLSR.
- Supplementary Date S1 Tree-level family and block identifiers, paired heartwood-sapwood wet-chemistry traits, ROI-mean HSI spectra, and evaluated structural and thermal descriptors used in the analyses.
- Supplementary Date S2 Family-wise fold assignments, repeated grouped and leave-one-family-out predictions, model specifications, tuning summaries, gate decisions, performance metrics, fold-level paired differences and family-clustered inference outputs.
- Supplementary Date S3 Source data for all main and supplementary figures and tables, including genetic diagnostics, selection utility, robustness, auxiliary-feature ablation, family-clustered inference, index-weight sensitivity and ROI correction summary.
- Copyright: © 2026 by the author(s). Published by Maximum Academic Press, Fayetteville, GA. This article is an open access article distributed under Creative Commons Attribution License (CC BY 4.0), visit https://creativecommons.org/licenses/by/4.0/.
-
About this article
Cite this article
Ding X, Hua X, Wu S, Tan Z, Luan Q, et al. 2026. Family-wise cross-validation of short-wave infrared hyperspectral imaging models for heartwood and sapwood chemistry prediction in slash pine. Forestry Research Advances 1: e015 doi: 10.48130/fra-0026-0012 

Family-wise cross-validation of short-wave infrared hyperspectral imaging models for heartwood and sapwood chemistry prediction in slash pine
- Received: 28 July 2026
- Revised: 25 August 2026
- Accepted: 03 September 2026
- Published online: 30 September 2026
Abstract: Wet-chemical assays limit wood-chemistry screening, whereas random tree-level validation can overstate transfer when relatives occur in both calibration and testing. We evaluated family-wise prediction of six heartwood and sapwood chemistry traits from stem-disc short-wave infrared hyperspectral imaging (SWIR-HSI) in 207 4-year-old slash pine trees from 26 families in two blocks; 194 trees from 24 families had paired SWIR-HSI. Mixed-model family BLUPs were estimated once from the 207 chemistry records and held fixed as reference phenotypes. During each HSI split, training-family BLUPs were used for calibration and tuning, whereas held-out-family best linear unbiased predictions (BLUPs) were used only for post-prediction scoring. Across five repeated five-fold family-wise runs, trait-level R2 ranged from 0.618 to 0.921 and Spearman ρ from 0.804 to 0.961, with means of 0.813 and 0.902. Averaging each family's five independently held-out predictions gave an ensemble mean R2 of 0.820; Leave-one-family-out (LOFO) mean R2 was 0.825. Relative to target-tissue partial least-squares regression (TT-PLSR), family-rank cross-fitted multi-task regression (FRCF-MTR) reduced mean normalized squared error by 6.25% (absolute reduction 0.0115; family-clustered 95% confidence interval (CI) 0.0028–0.0202; family-level two-sided sign-flip, P = 0.0182), but 6 of 25 outer folds favored TT-PLSR and gains were trait-dependent. Under the equal-weight six-trait index, both models selected the same five families in every repeat, giving identical mean top-20% overlap (0.920) and selection-differential capture (0.996). The primary contribution is therefore the conditional family-wise SWIR-HSI validation and decision framework; the guarded multi-task correction provides a small, non-uniform refinement within this juvenile single-site trial. Cross-site, age, batch, and instrument validation is required before operational deployment.