-
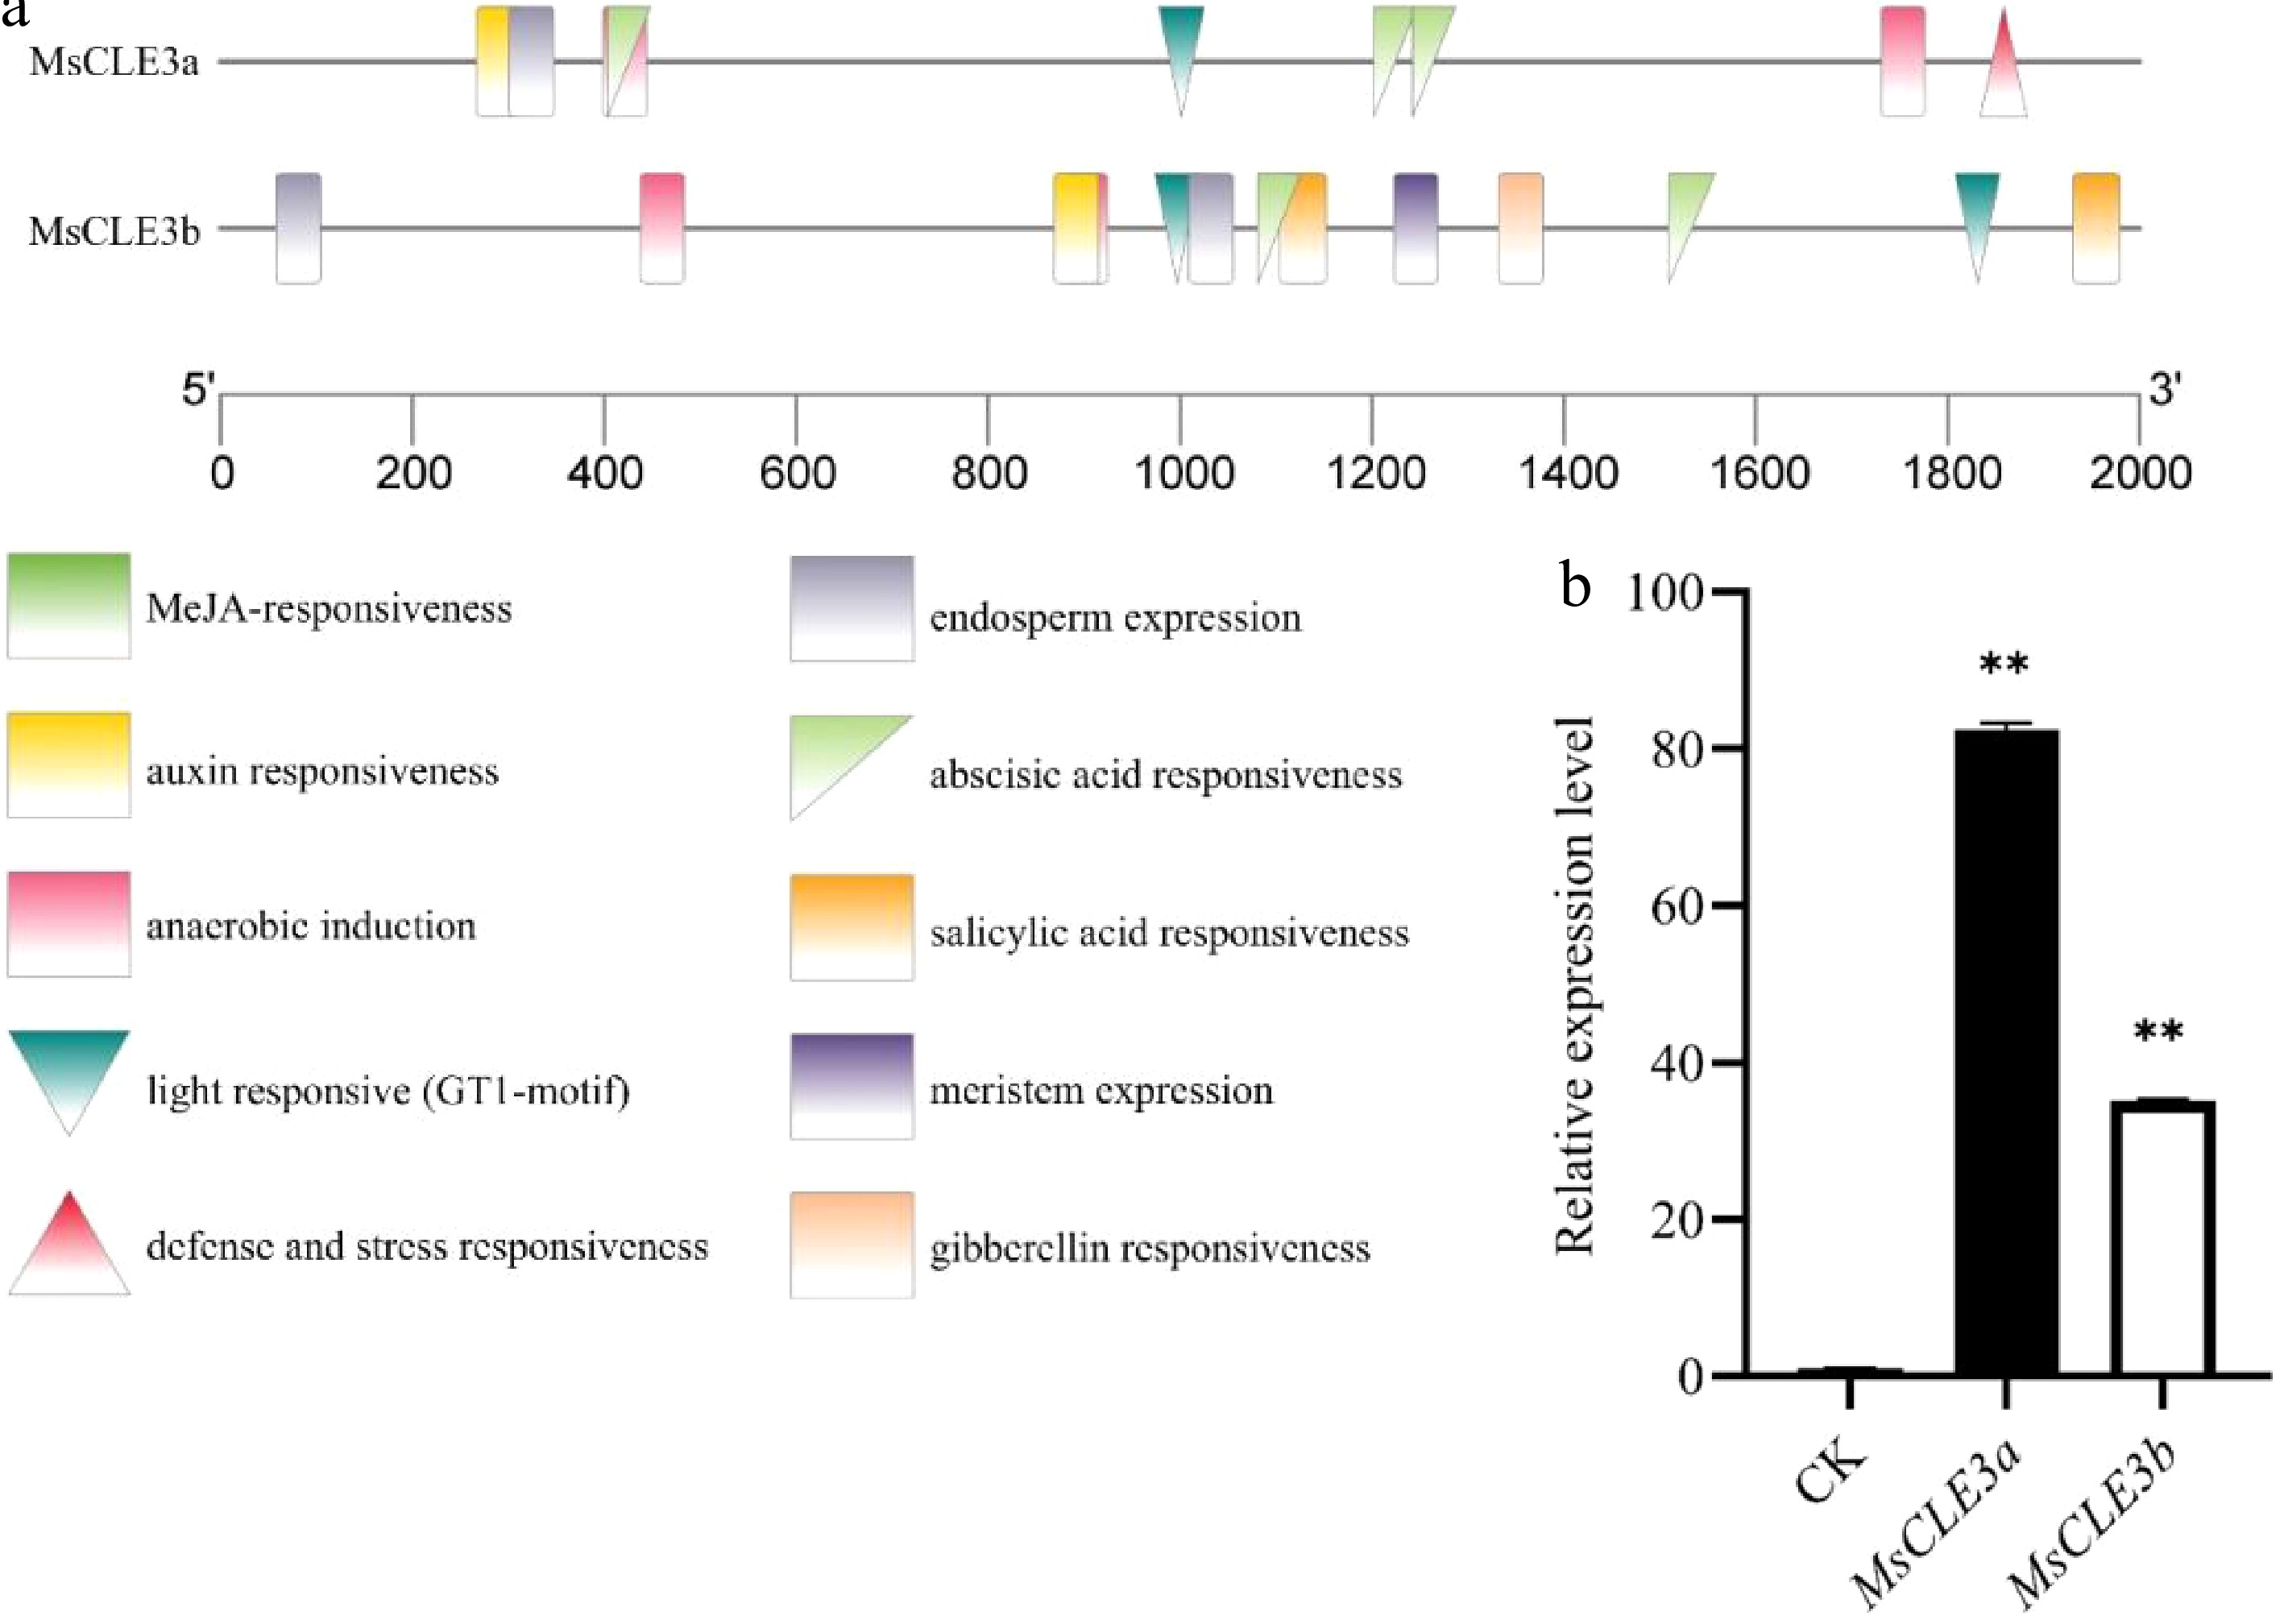
Figure 1.
Promoter analysis and salt-responsive expression patterns of MsCLE3 genes in alfalfa. (a) Graphical representation of the promoter sequences of MsCLE3a and MsCLE3b. Cis-regulatory elements were predicted via the PlantCARE database, confirming the presence of the salt stress-related GT1 motif in both promoters. (b) qRT-PCR validation of MsCLE3a and MsCLE3b transcript levels in response to NaCl treatment. Gene expression was normalized to the reference gene MsACTIN2, and the relative expression in the control group (CK) was defined as 1. Bars represent the mean ± standard deviation (SD) from three independent biological replicates. Significant differences between the treatment and control groups are indicated as *p < 0.05, **p < 0.01 (t-test).
-
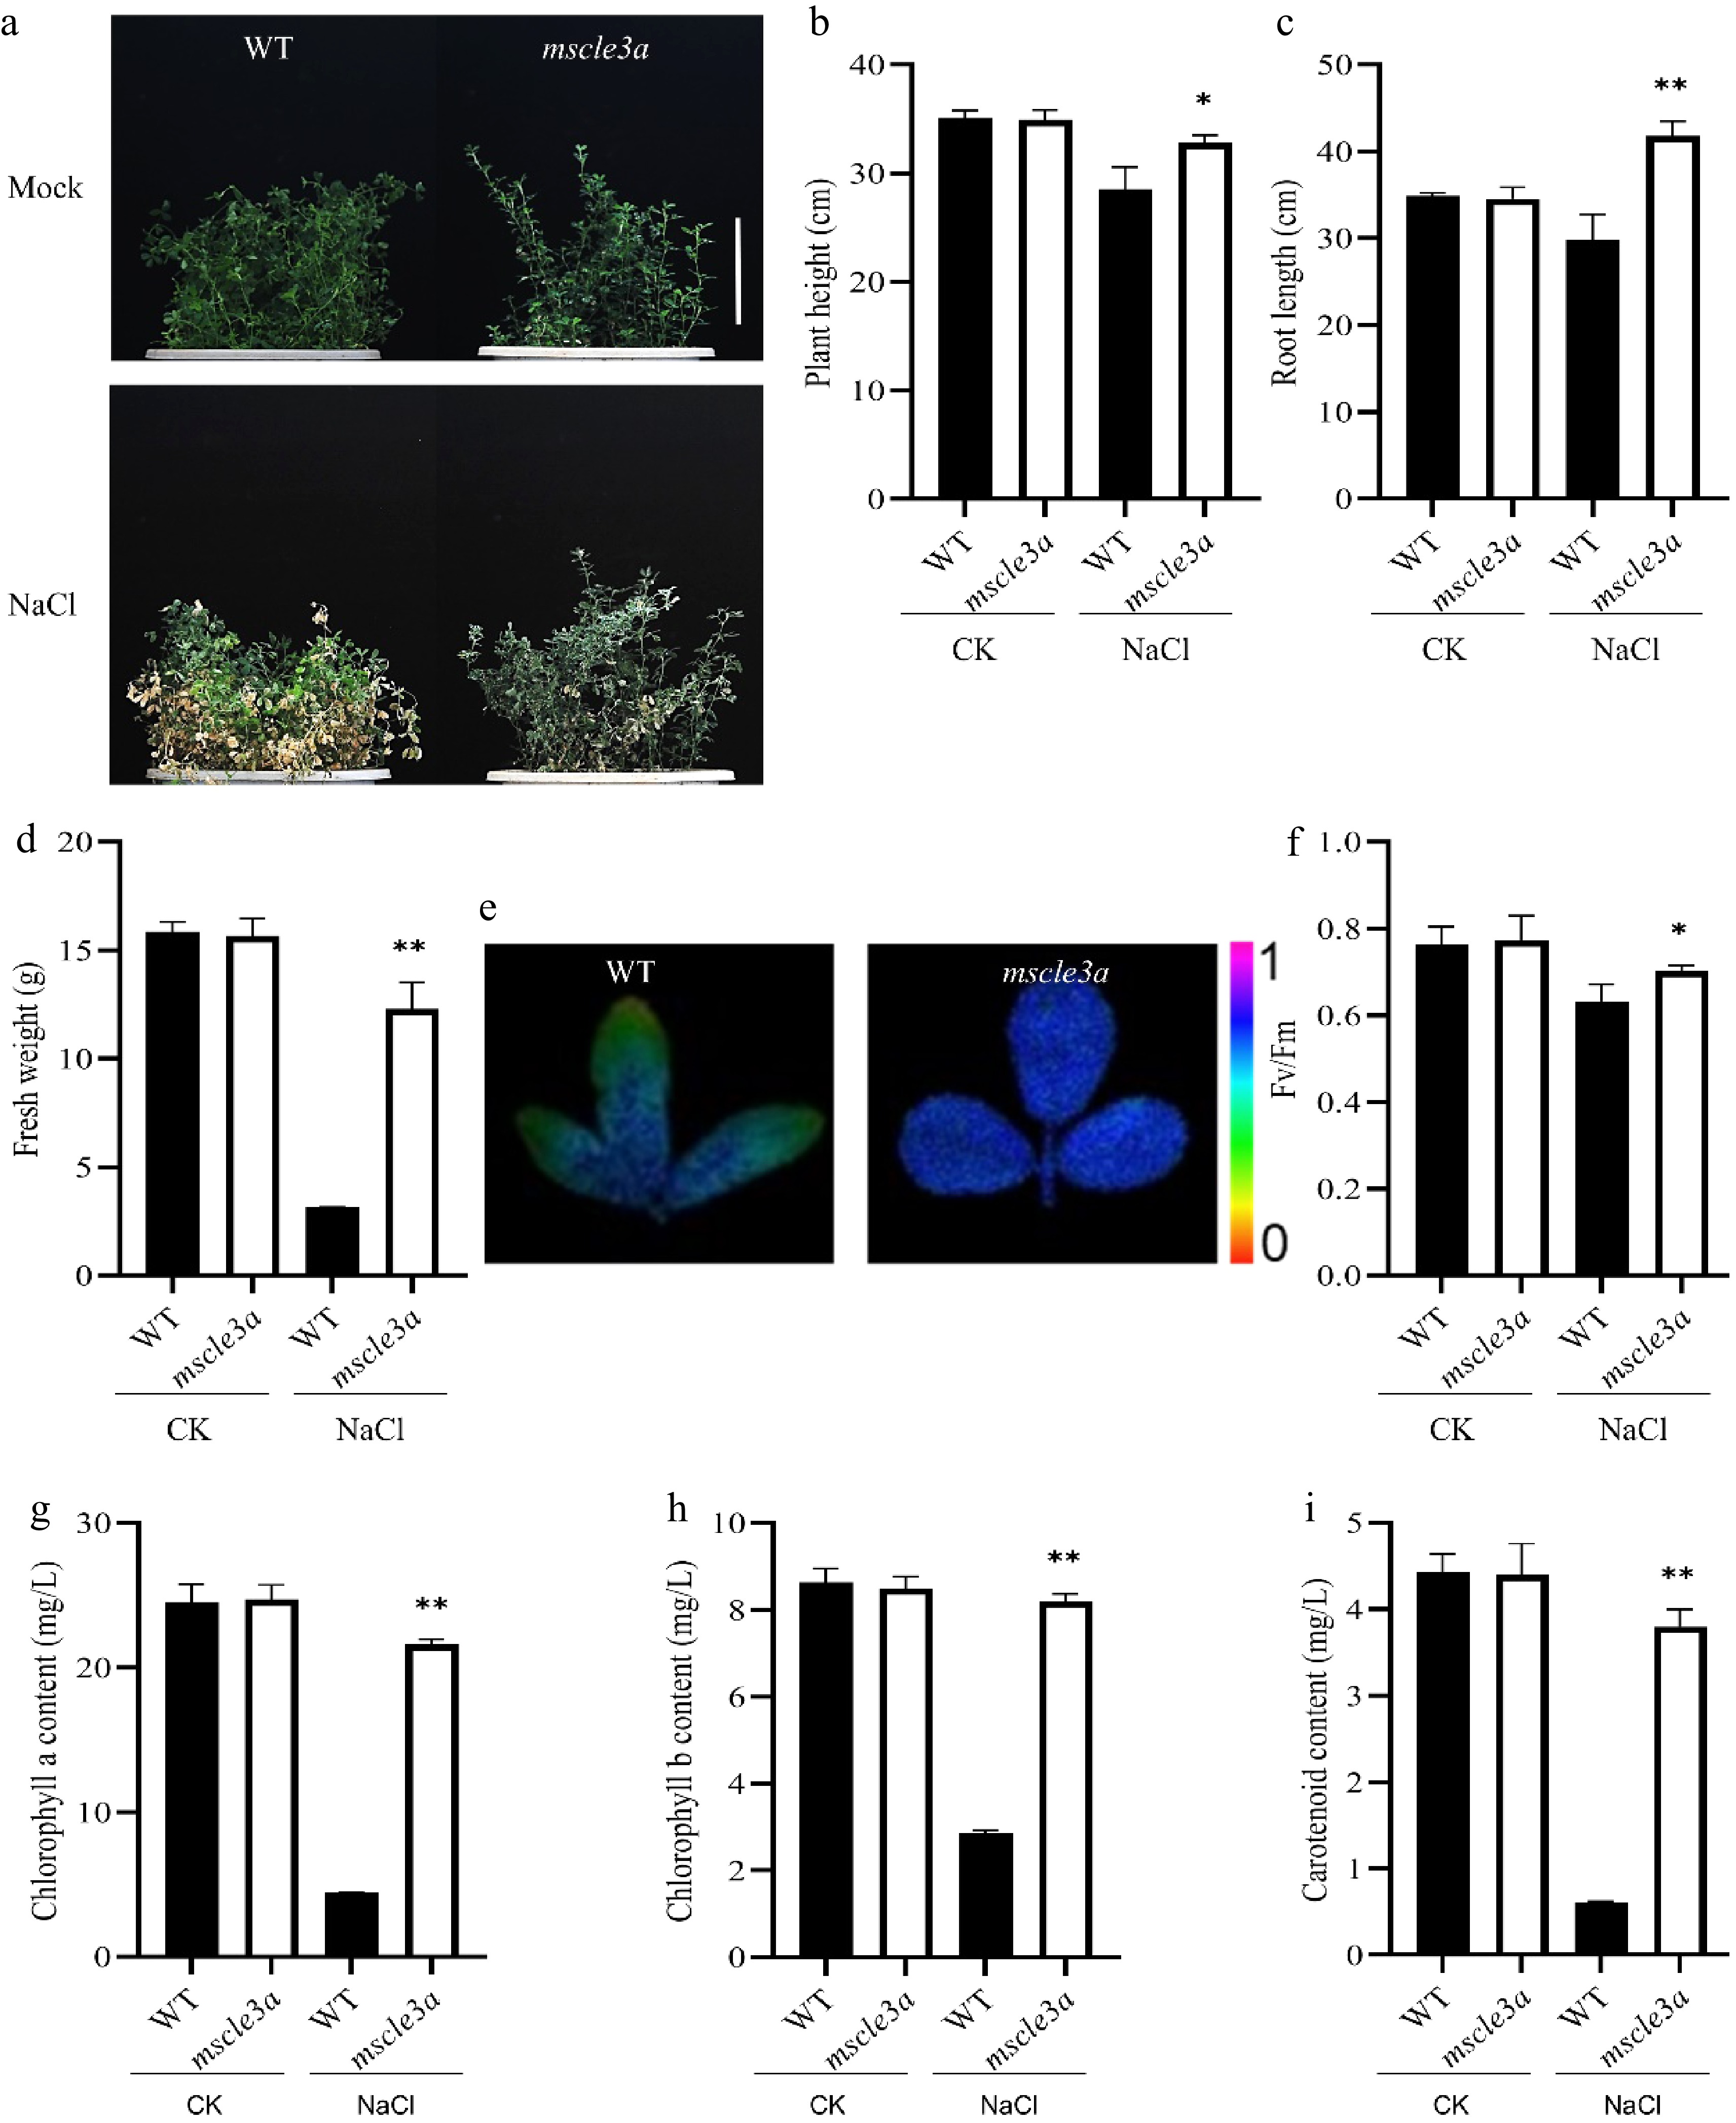
Figure 2.
The mscle3a mutant of alfalfa has enhanced salt stress tolerance. (a) Phenotype of rooted cuttings of WT and mscle3a mutant alfalfa before and after salt stress treatment. The mutant exhibited stronger salt tolerance. Bar = 10 cm. For (b)–(d) and (f)–(i), data were obtained from both WT and the mutant under control (CK) and NaCl conditions. (b) Plant height. (c) Root length. (d) Fresh weight. (e) Chlorophyll fluorescence imaging under NaCl treatment (purple: highest Fv/Fm; red: lowest). (f) Fv/Fm values. (g) Chlorophyll a content. (h) Chlorophyll b content. (i) Carotenoid content. Bars represent the mean ± SD from three independent biological replicates. Significant differences between treatment and control are indicated by * p < 0.05, ** p < 0.01 (t-test).
-
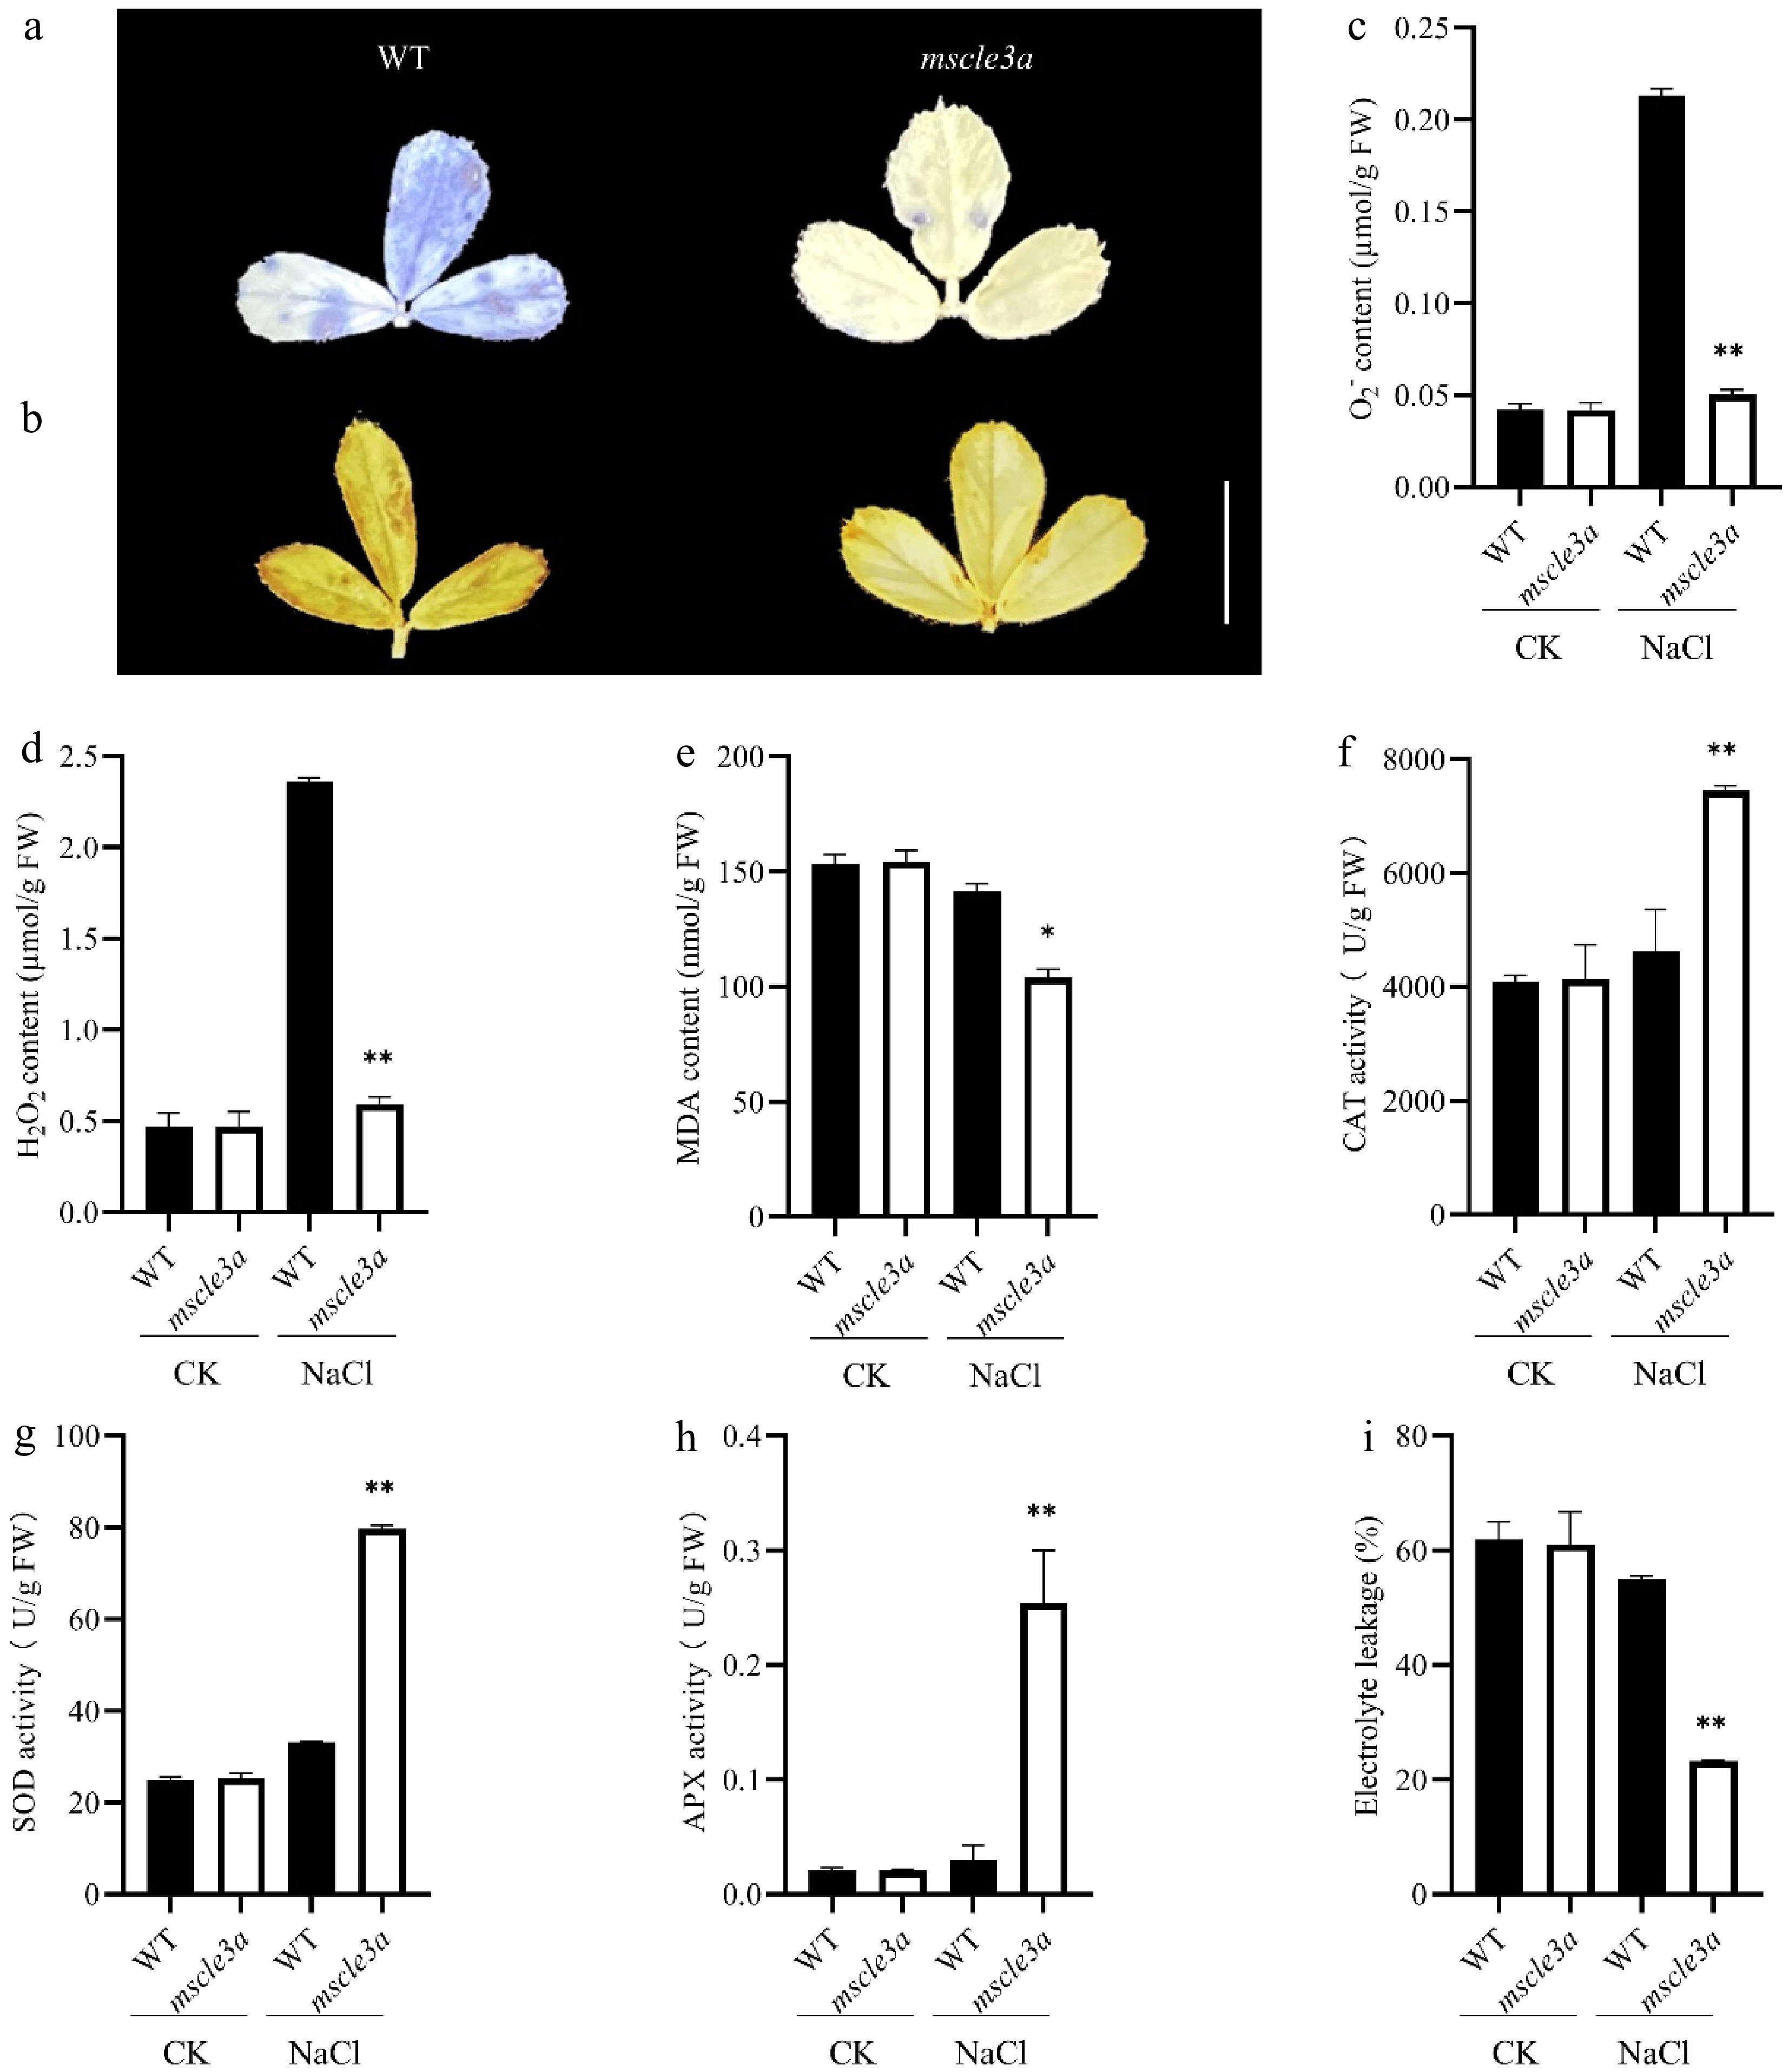
Figure 3.
ROS accumulation, antioxidant enzyme activities, and electrolyte leakage in alfalfa under salt stress. (a) NBT staining of the WT and mscle3a mutant under NaCl treatment for detecting O2−; deeper blue indicates higher O2− content. (b) DAB staining of the WT and mscle3a mutant under NaCl treatment for detecting H2O2; deeper brown indicates higher H2O2 content. Bar = 1 cm. For (c)–(i), data were obtained from both the WT and the mutant under CK and NaCl conditions. (c) O2− content. (d) H2O2 content. (e) MDA content. (f) CAT activity. (g) SOD activity. (h) APX activity. (i) Electrolyte leakage. Bars represent the mean ± SD from three independent biological replicates. Significant differences between the treatment and the control are indicated as * p < 0.05 and ** p < 0.01 (t-test).
-
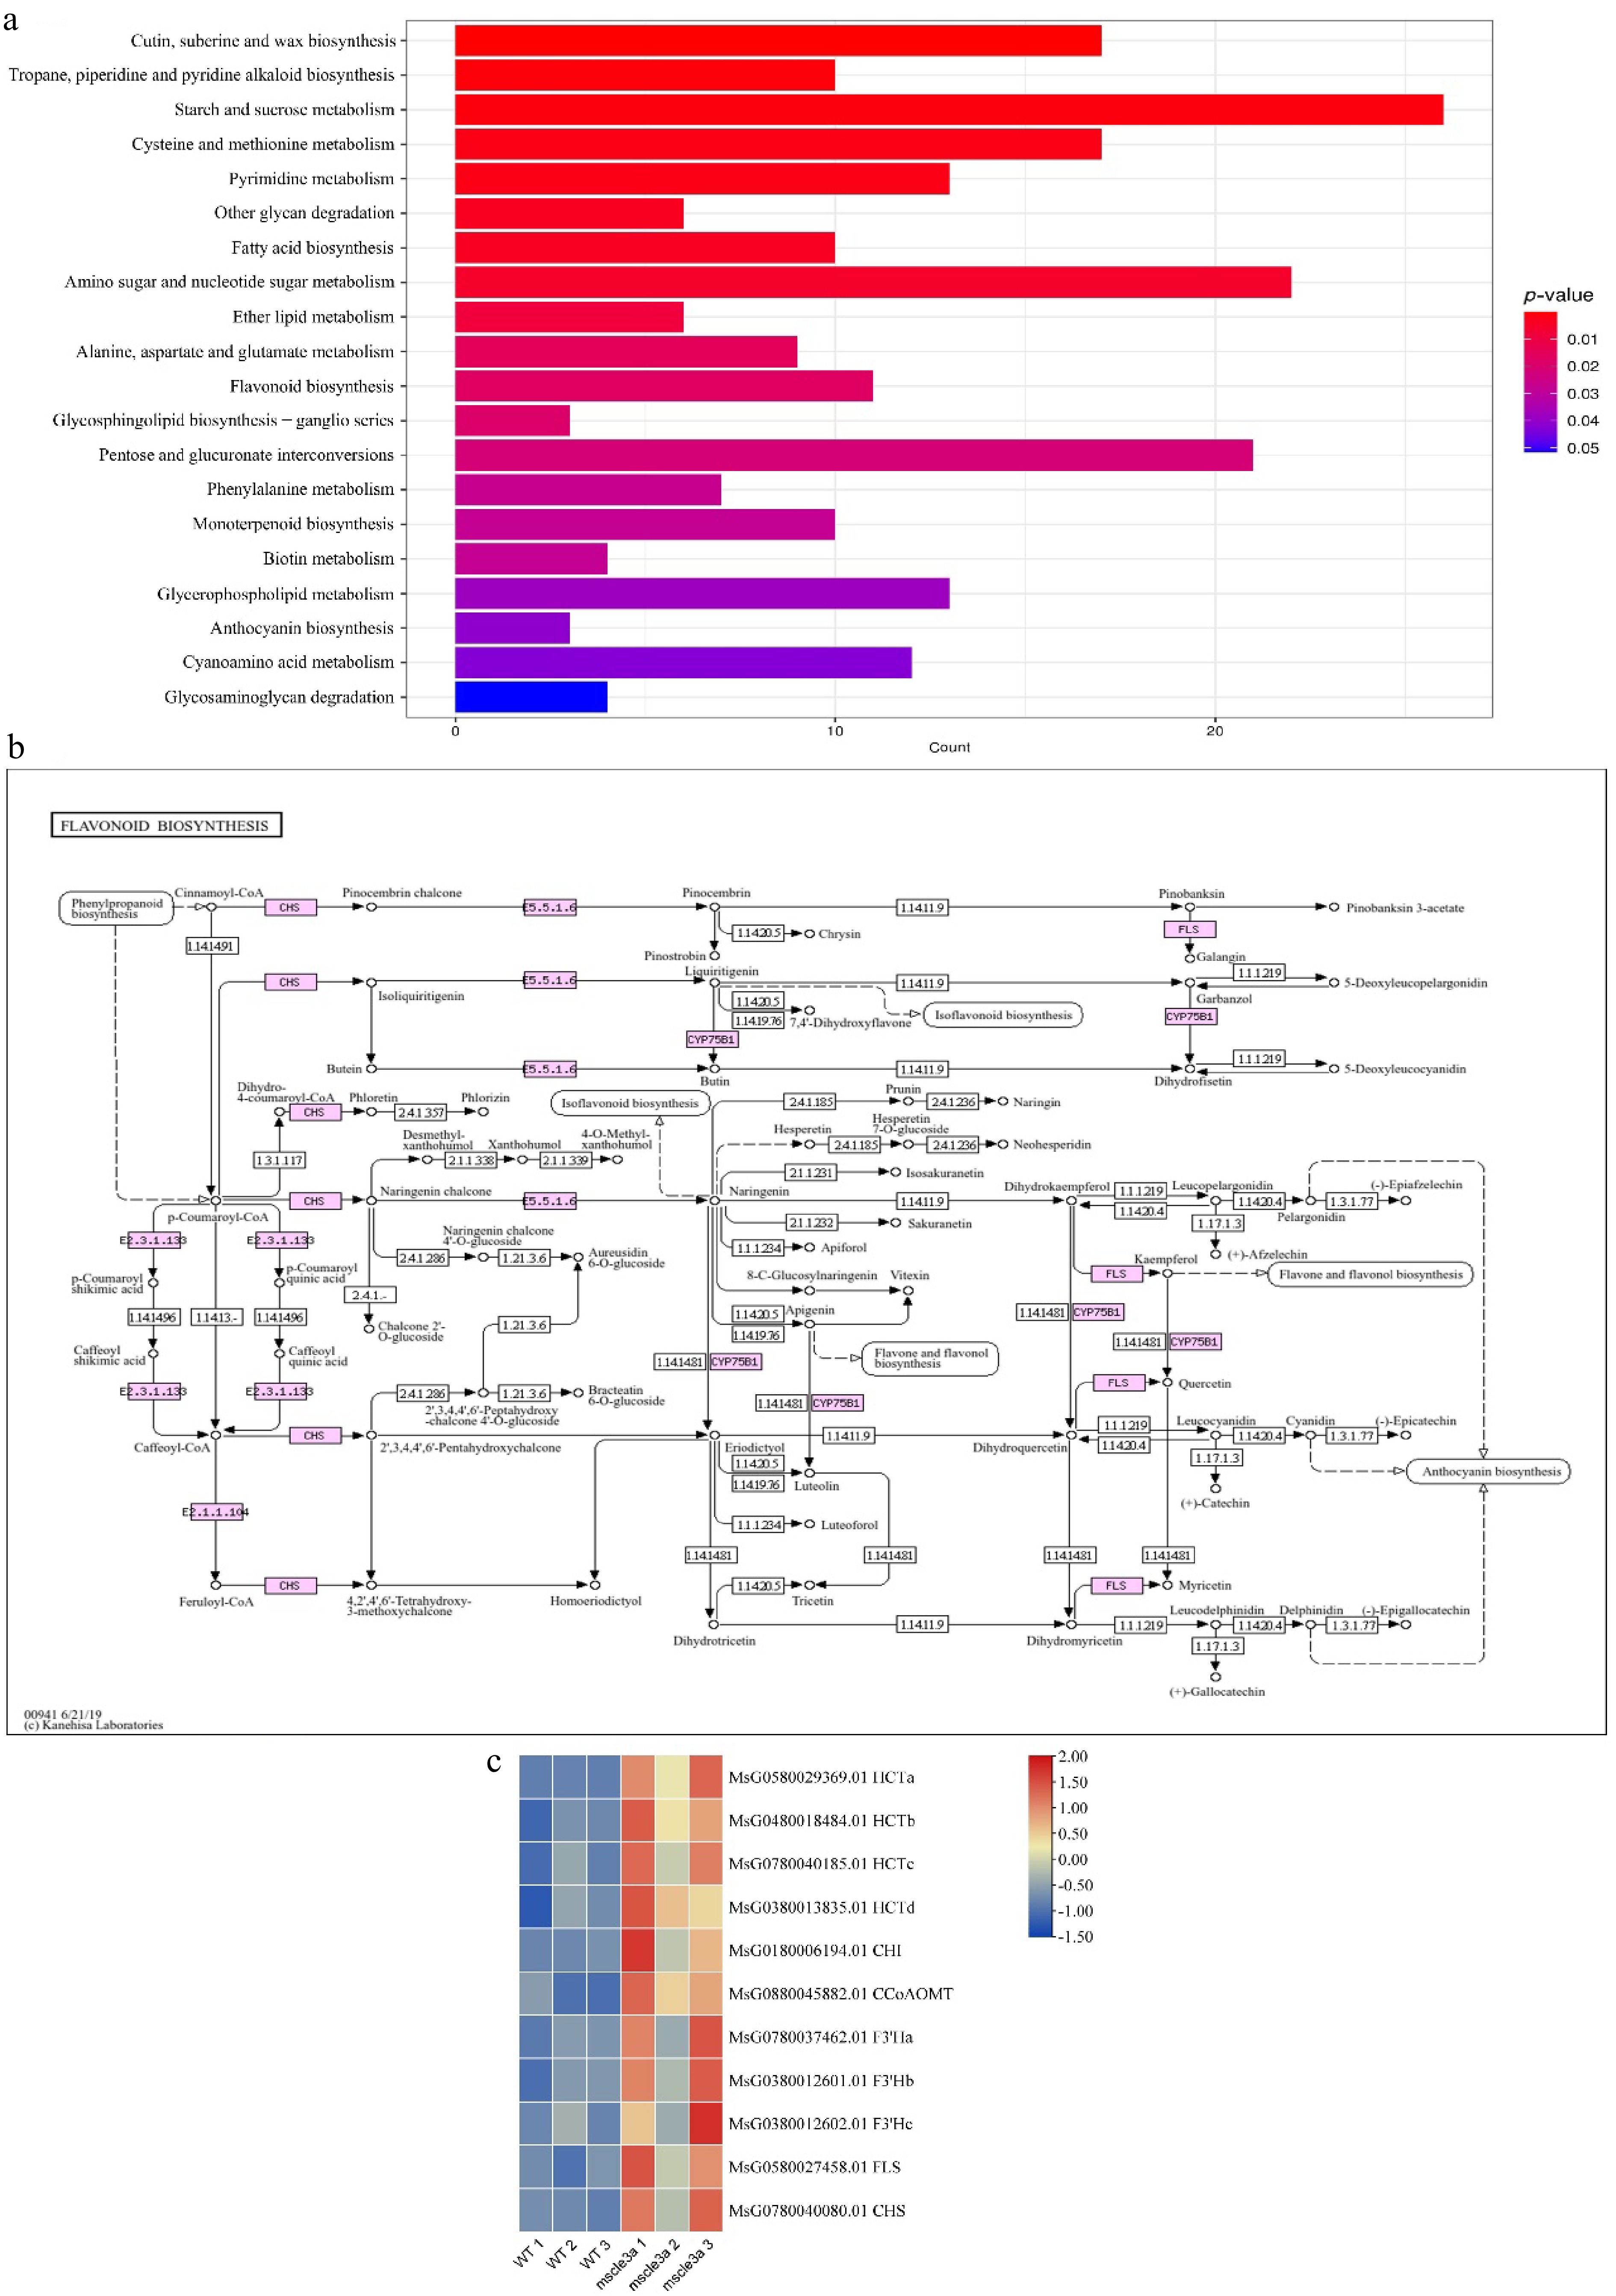
Figure 4.
Transcriptomic analyses. Upregulated DEGs are enriched in the flavonoid biosynthesis pathway. (a) Bar graph showing the upregulated DEGs enriched in KEGG pathways. (b) The flavonoid biosynthesis pathway (map00941). (c) Heatmap displaying the expression of DEGs involved in the flavonoid biosynthesis pathway. The color scale indicates high (red) and low (blue) expression levels based on fragments per kilobase of sequence per million mapped reads.
-
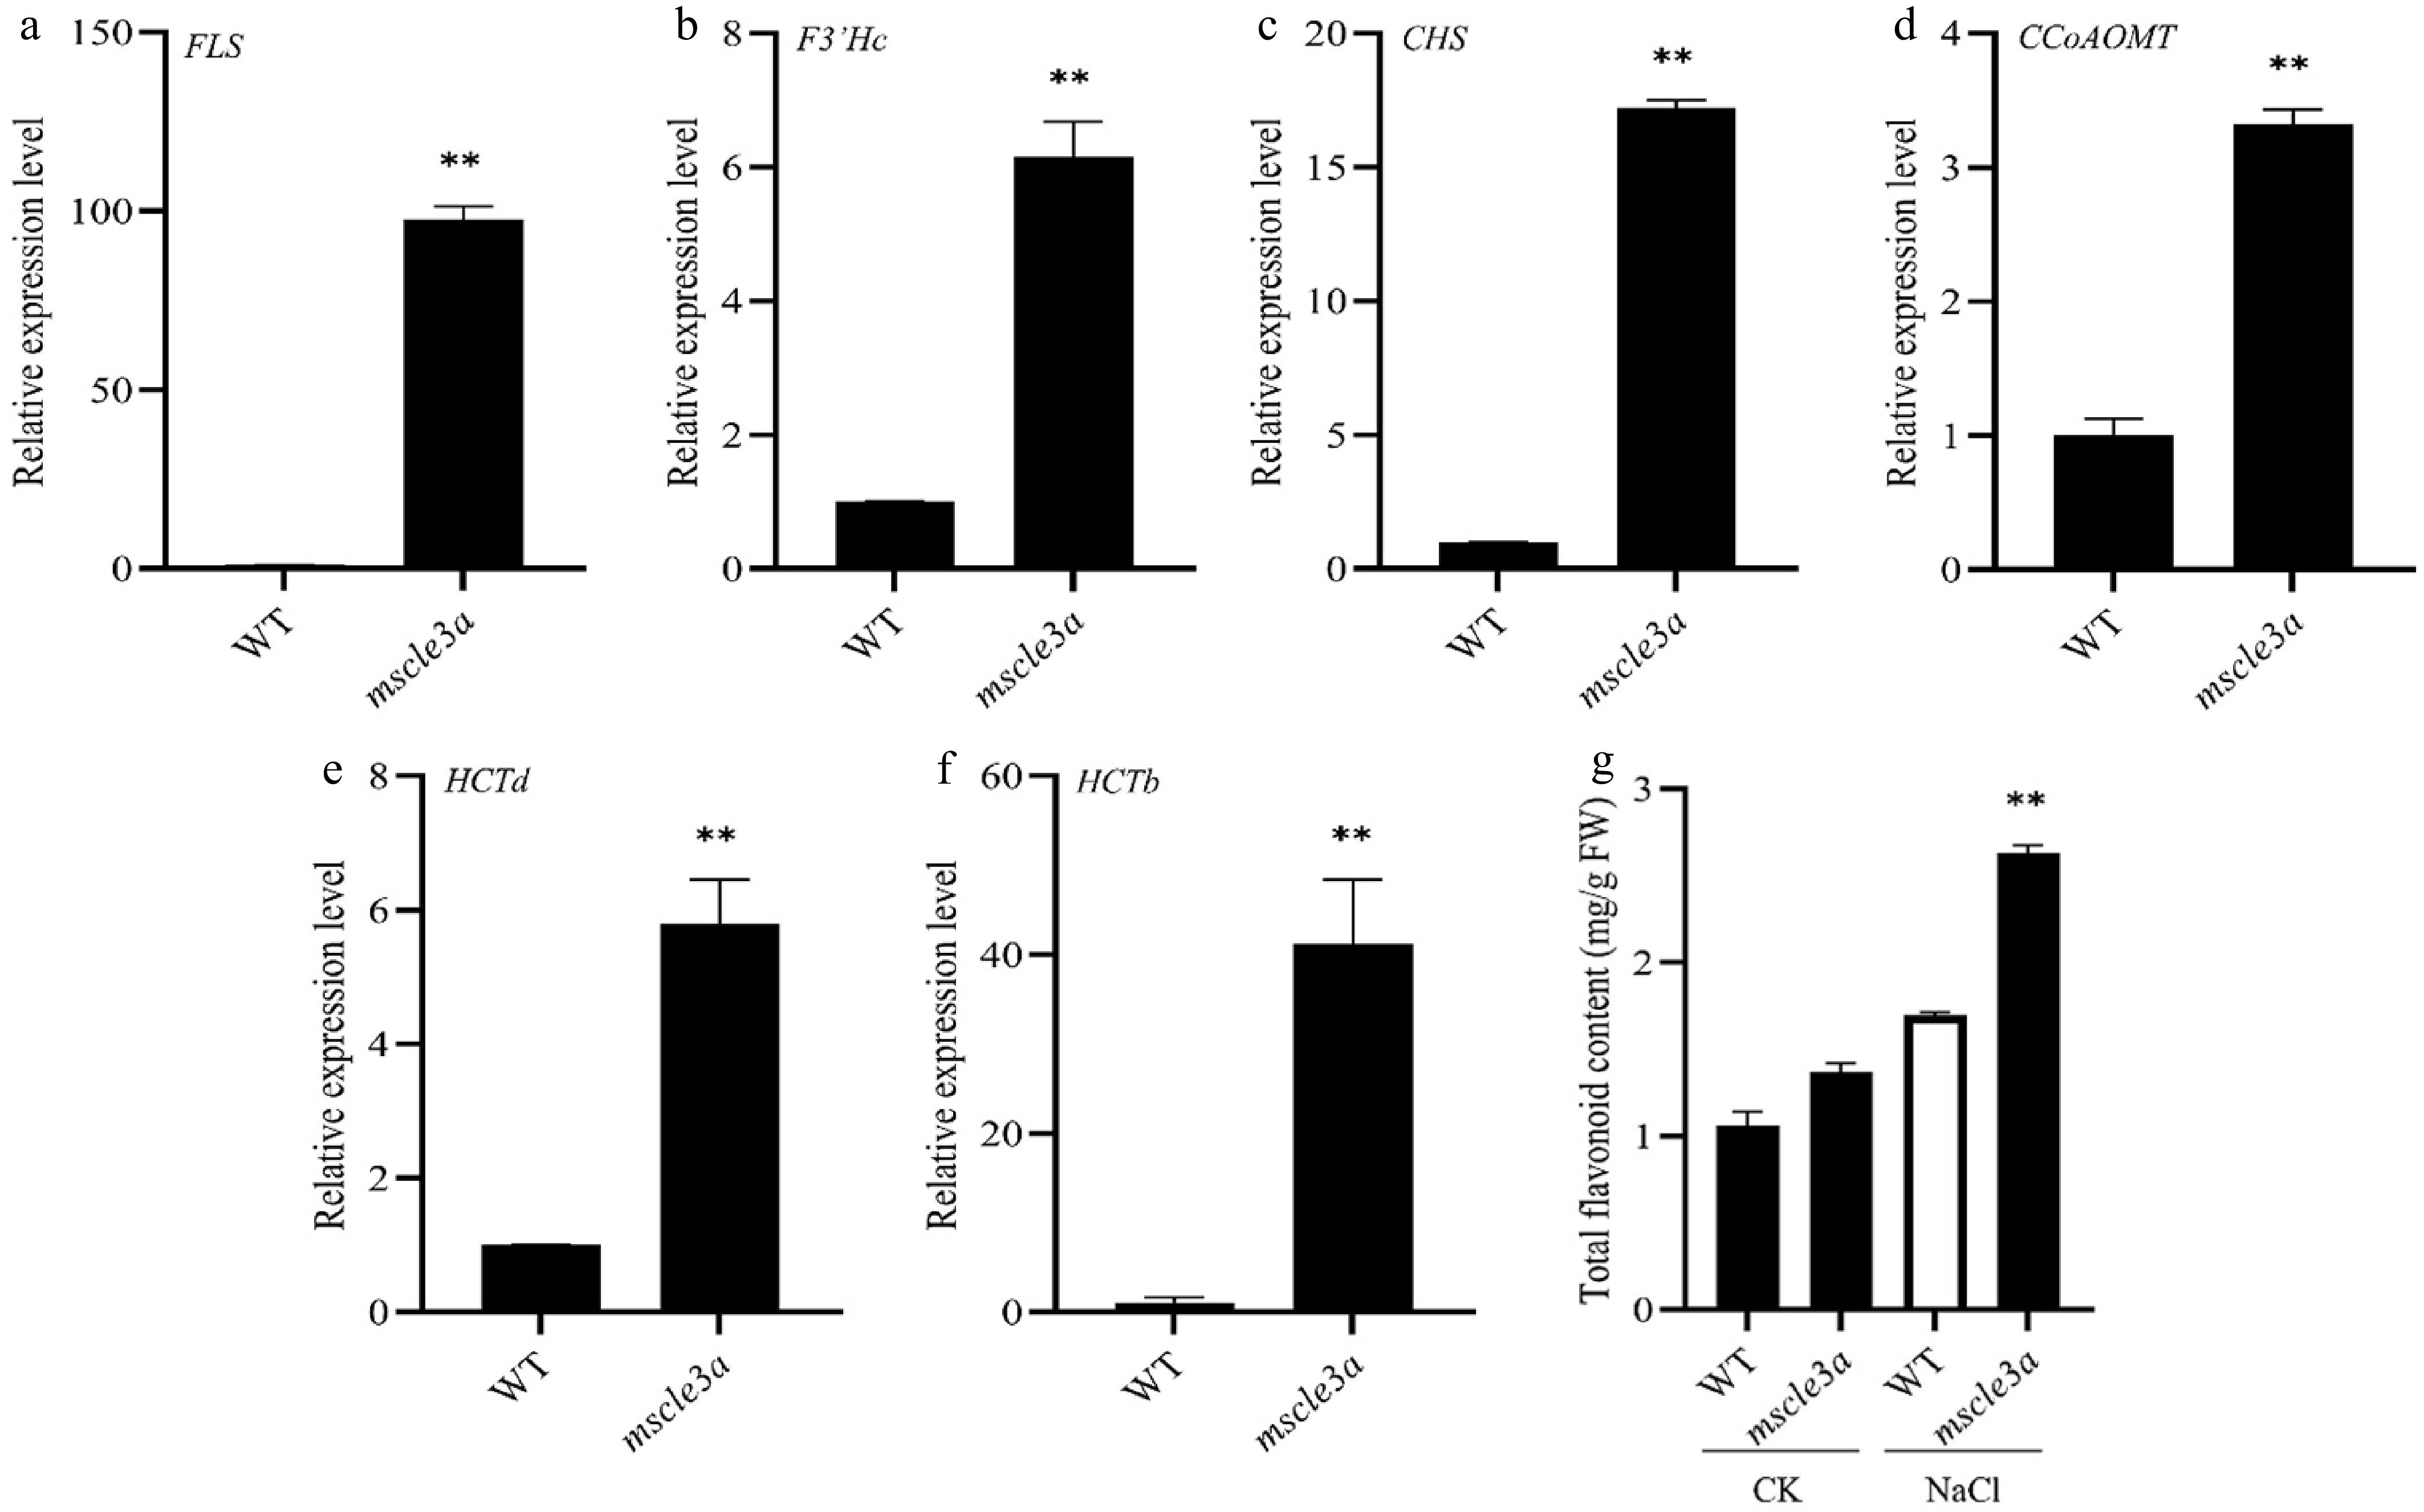
Figure 5.
Role of flavonoid biosynthesis genes in the mscle3a mutant. (a)–(f) qRT-PCR analysis of the expression of flavonoid biosynthesis genes in the WT and mscle3a mutant plants. Expression levels of individual genes were determined as follows: (a) FLS, (b) F3′Hc, (c) CHS, (d) CCoAOMT, (e) HCTd, and (f) HCTb. Gene expression was normalized to the reference gene MsACTIN2, and the relative expression in the WT was set to 1. (g) Flavonoid content in the WT and mscle3a mutant under CK and NaCl conditions. Bars represent the mean ± SD from three independent biological replicates. Significant differences between the treatment and control are indicated as *p < 0.05, **p < 0.01 (t-test). Leaf tissues were collected after continuous treatment with 300 mM NaCl for 20 d.
Figures
(5)
Tables
(0)