-
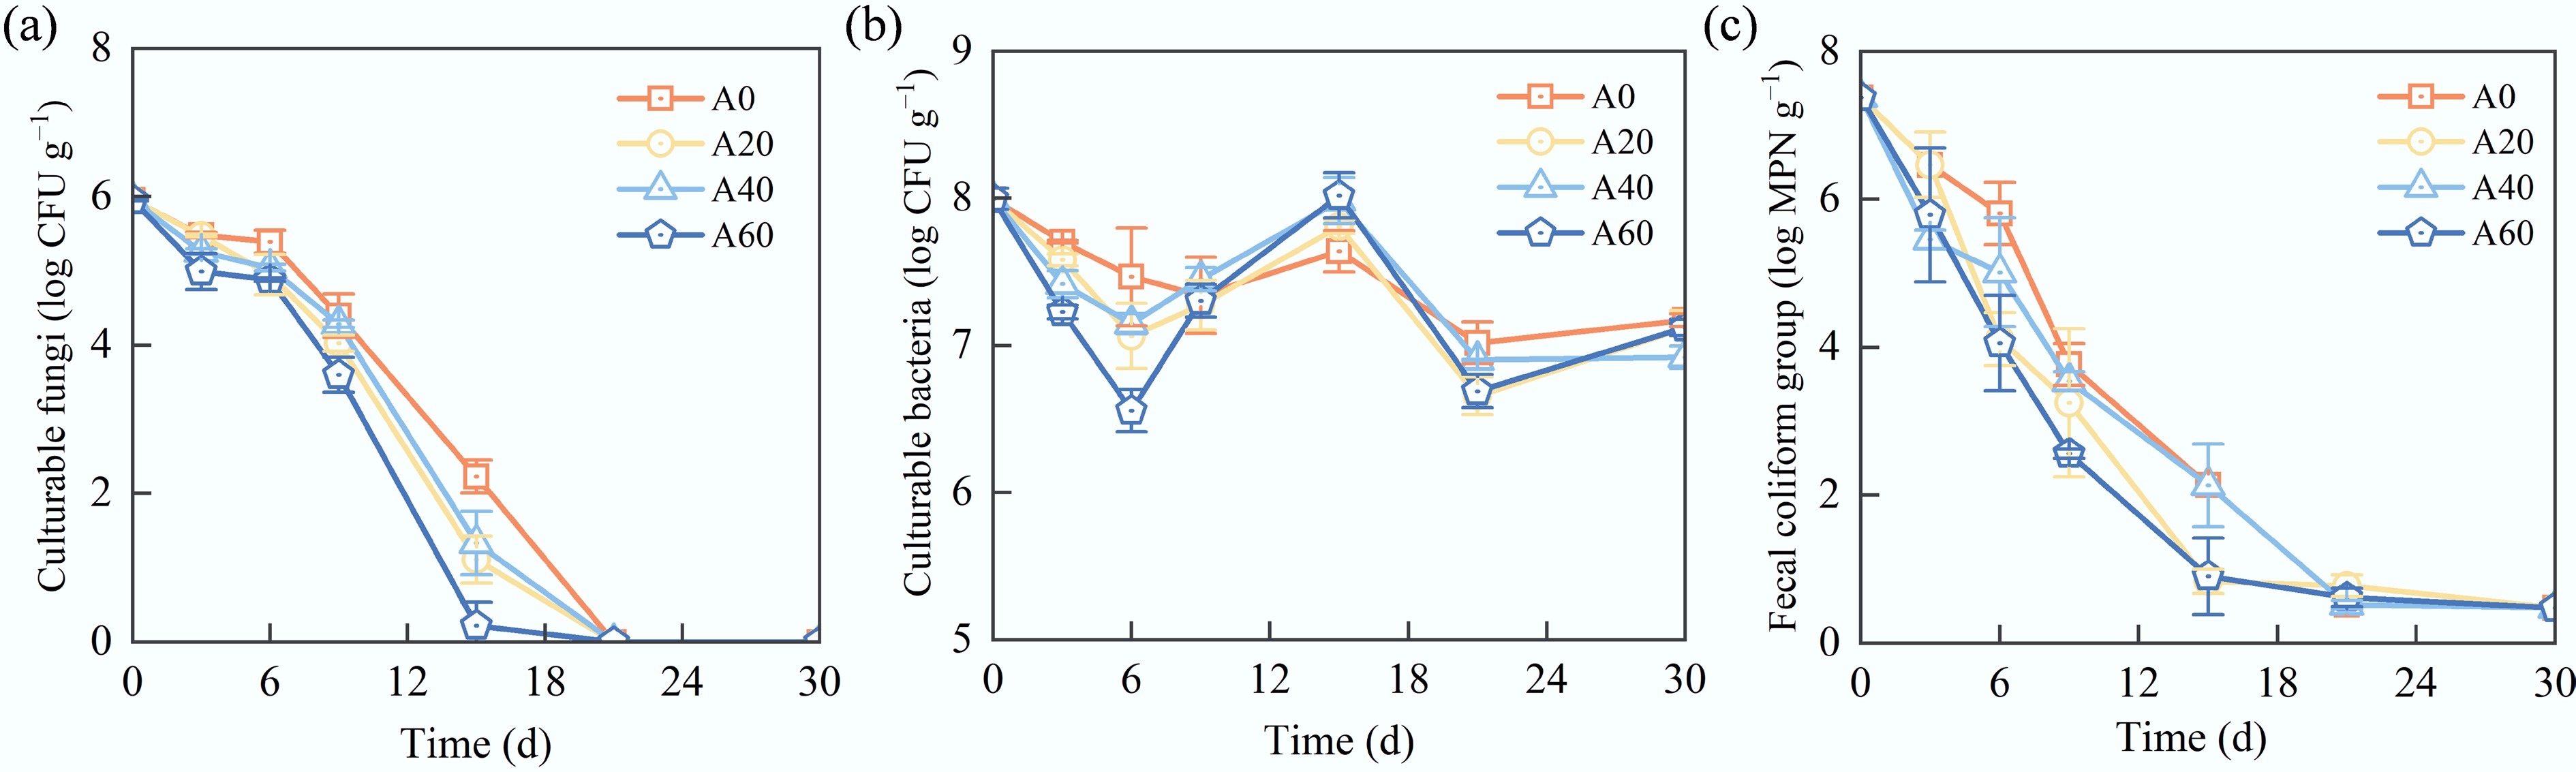
Figure 1.
Changes in the number of culturable microorganisms under different concentrations of fungicide. (a) Culturable fungi; (b) culturable bacteria; (c) fecal coliform group. Treatments A0, A20, A40, and A60 correspond to cycloheximide concentrations of 0, 20, 40, and 60 mg/kg, respectively.
-
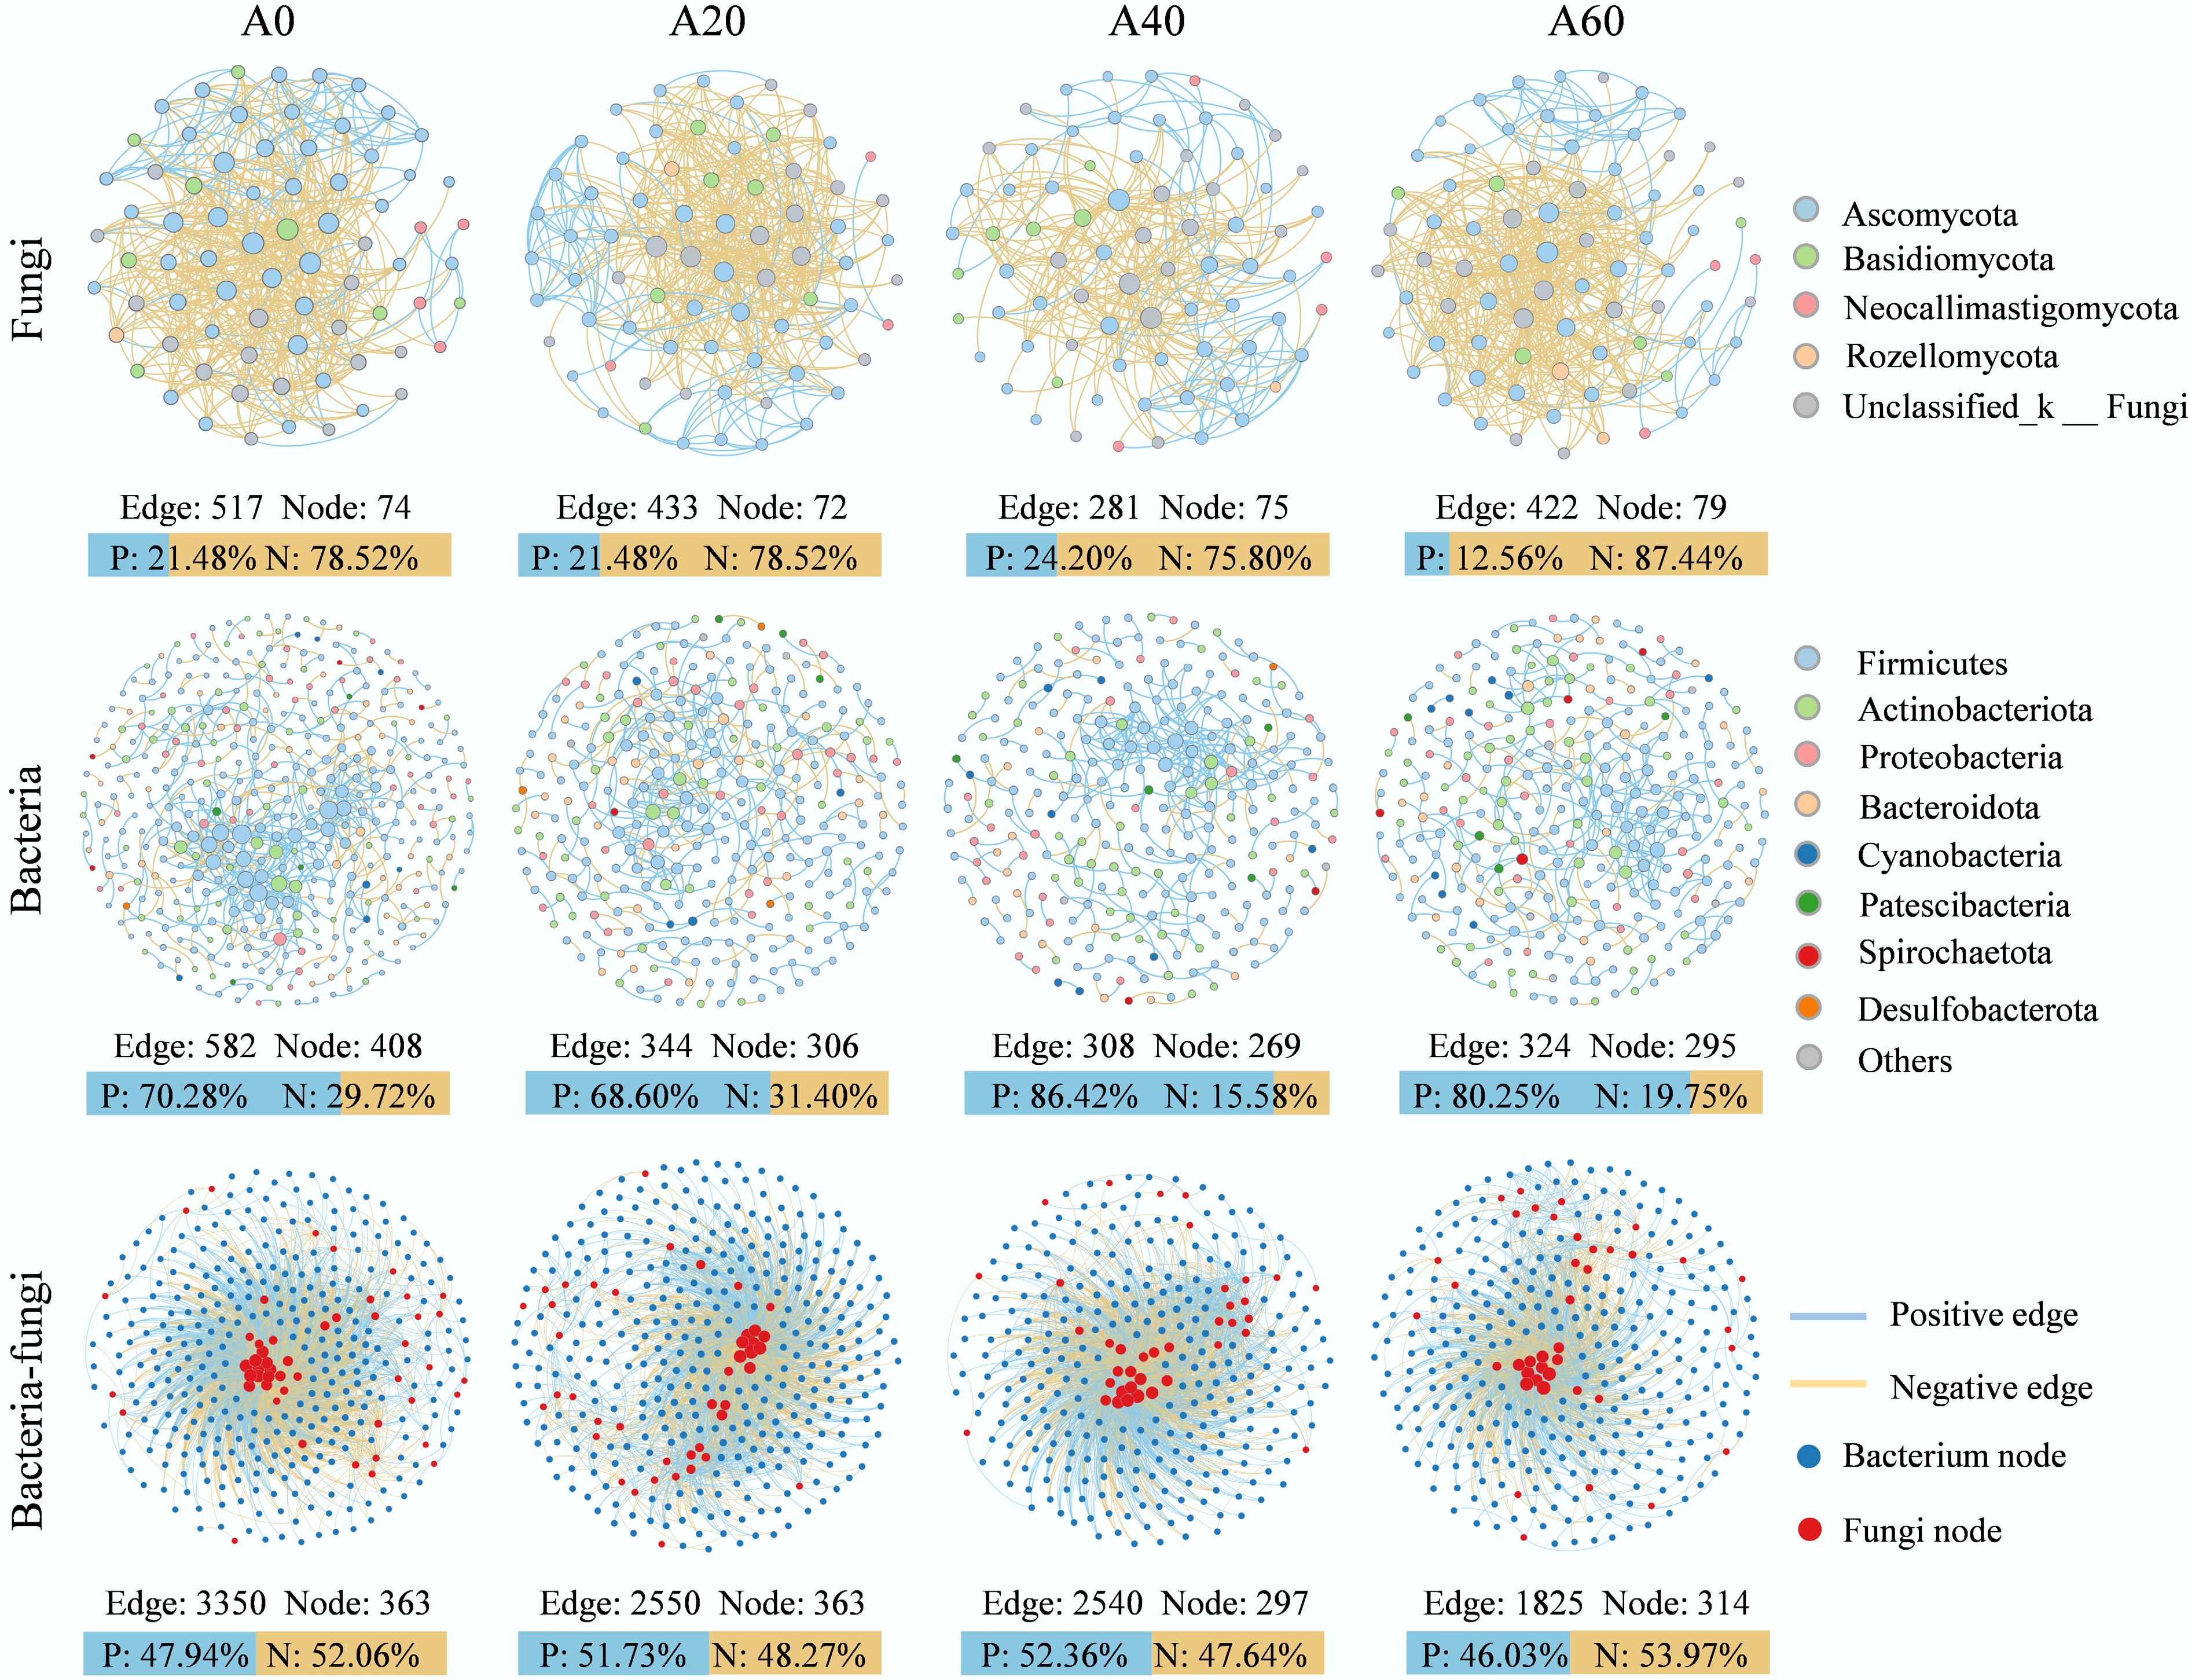
Figure 2.
Molecular ecological networks of microorganism associations in the bacterial and fungal communities under different fungal gradients in facultative composting. The first to third rows represent bacterial, fungal, and bacteria–fungal networks, respectively. Treatments A0, A20, A40, and A60 correspond to cycloheximide concentrations of 0, 20, 40, and 60 mg/kg, respectively. In the figure, P and N represent the proportions of positive and negative edges, respectively.
-
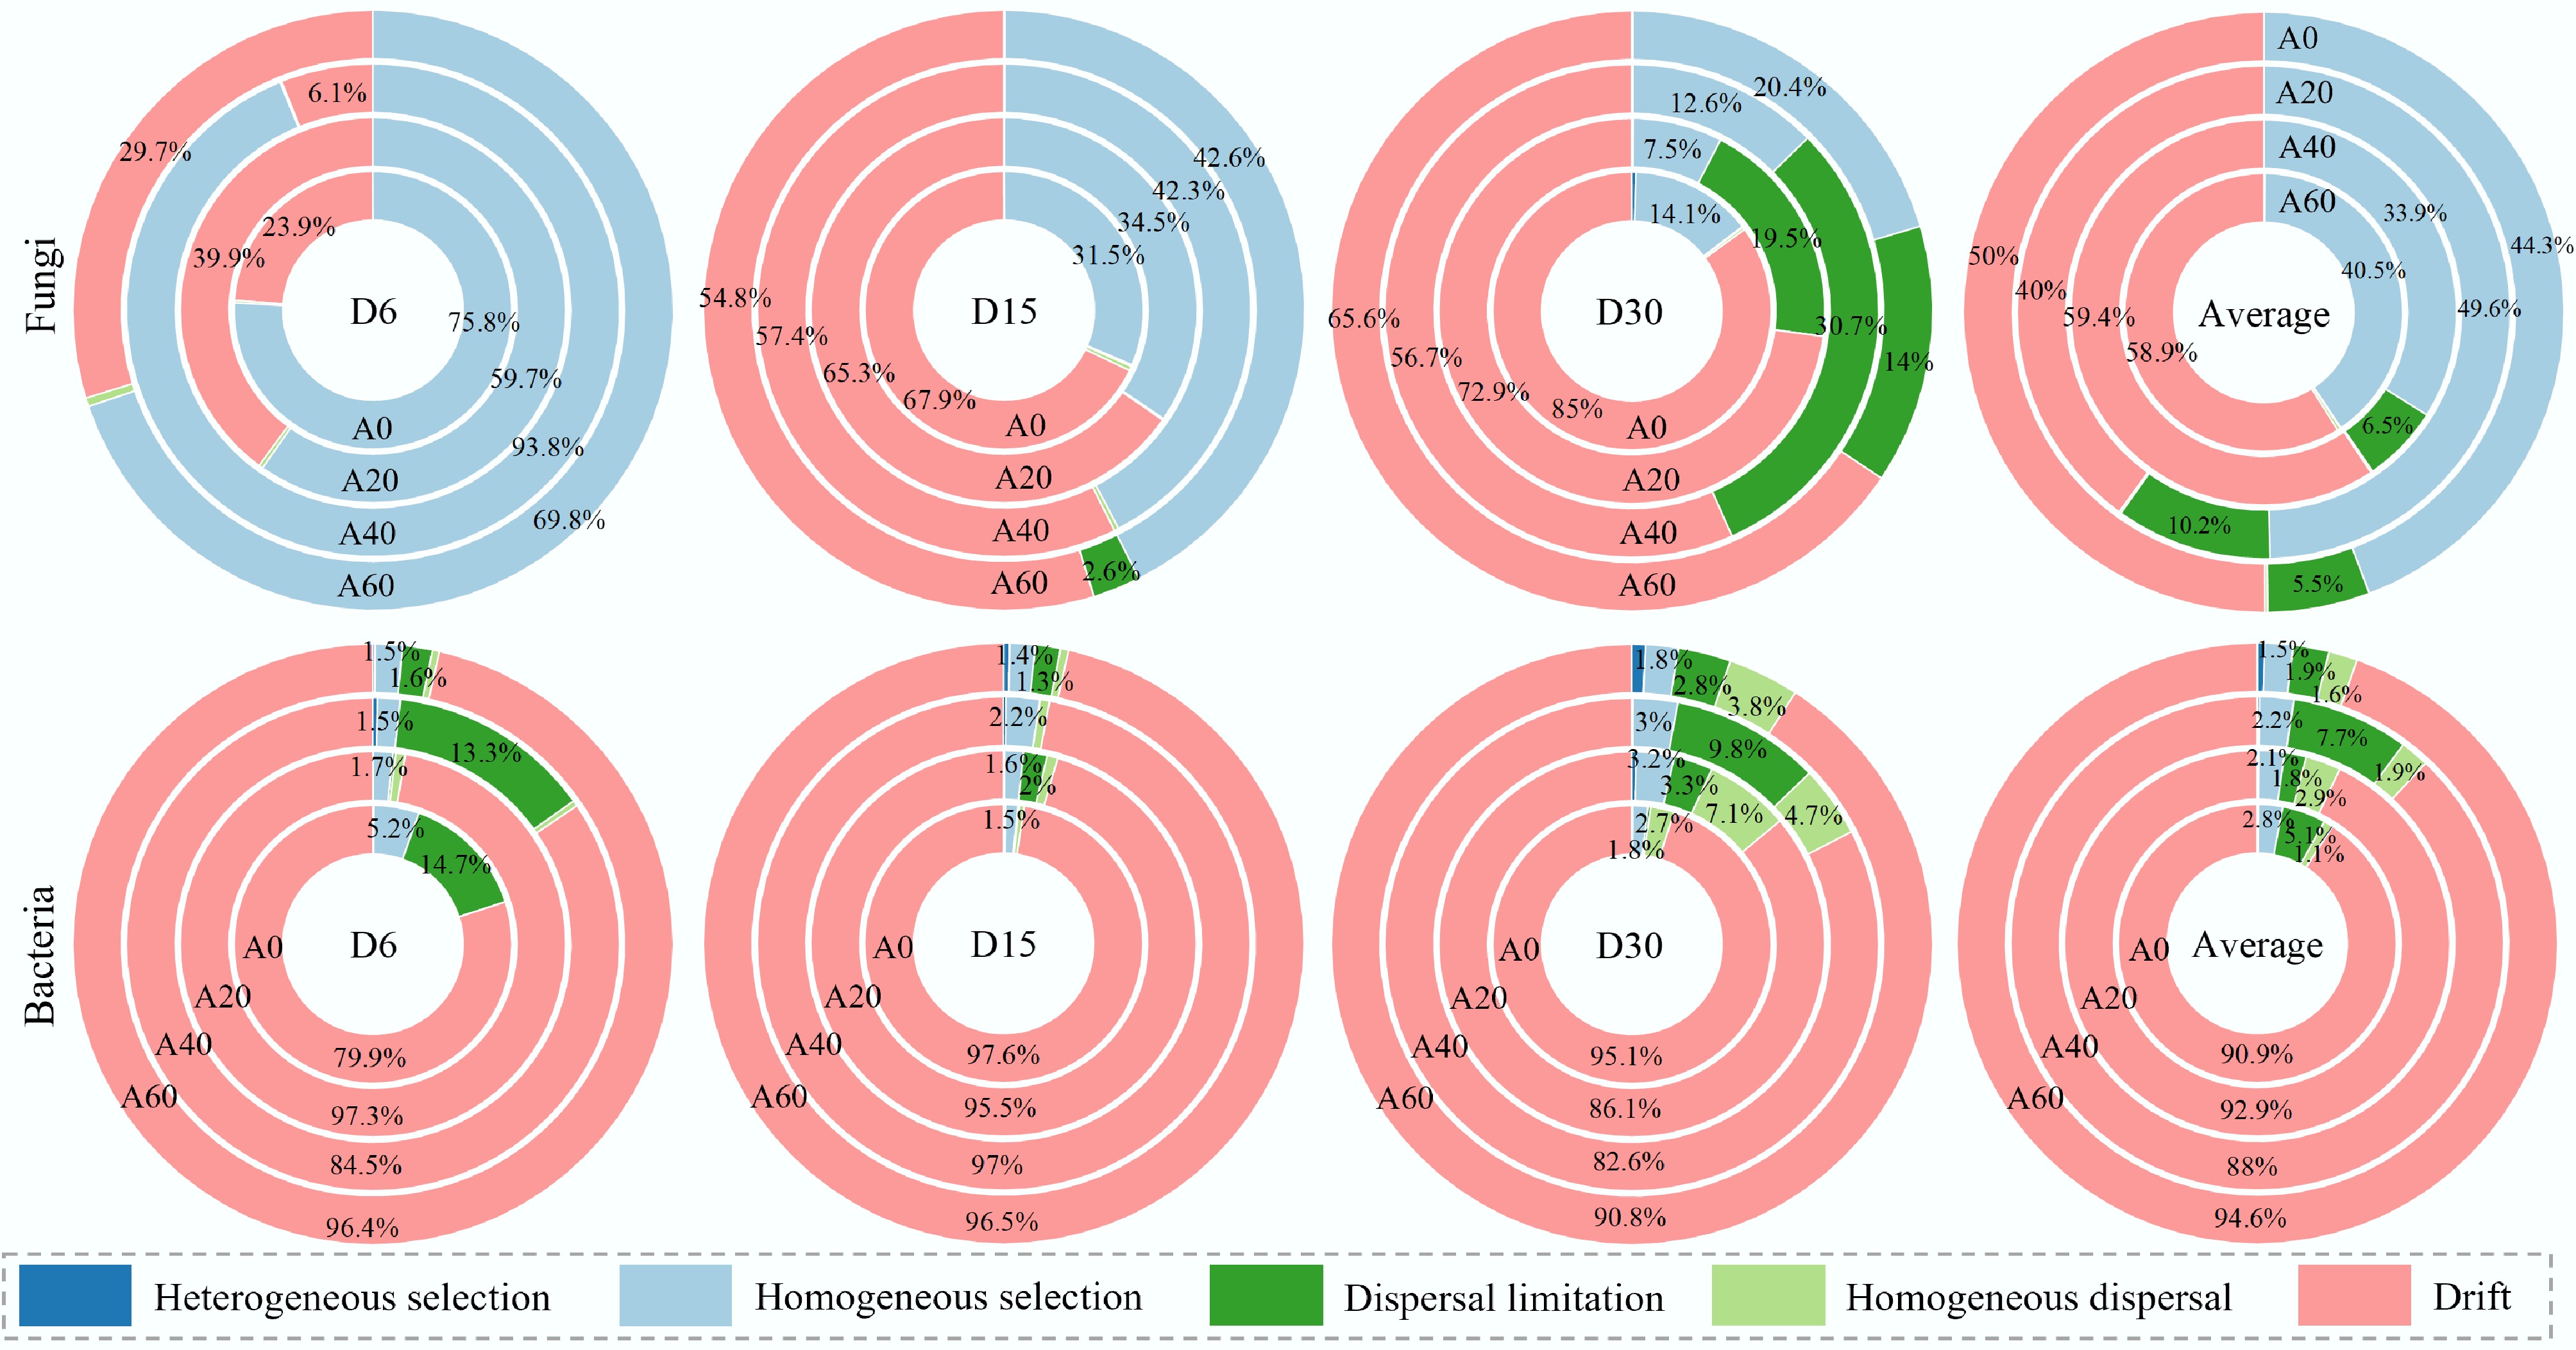
Figure 3.
The relative contribution of microbial deterministic and stochastic assembly processes under different fungal gradients in facultative composting. The first row represents fungi; the second row represents bacteria. The center of the circle represents time, and the inner ring to the outer ring represents A0, A20, A40, and A60 treatments. Treatments A0, A20, A40, and A60 correspond to cycloheximide concentrations of 0, 20, 40, and 60 mg/kg, respectively.
-
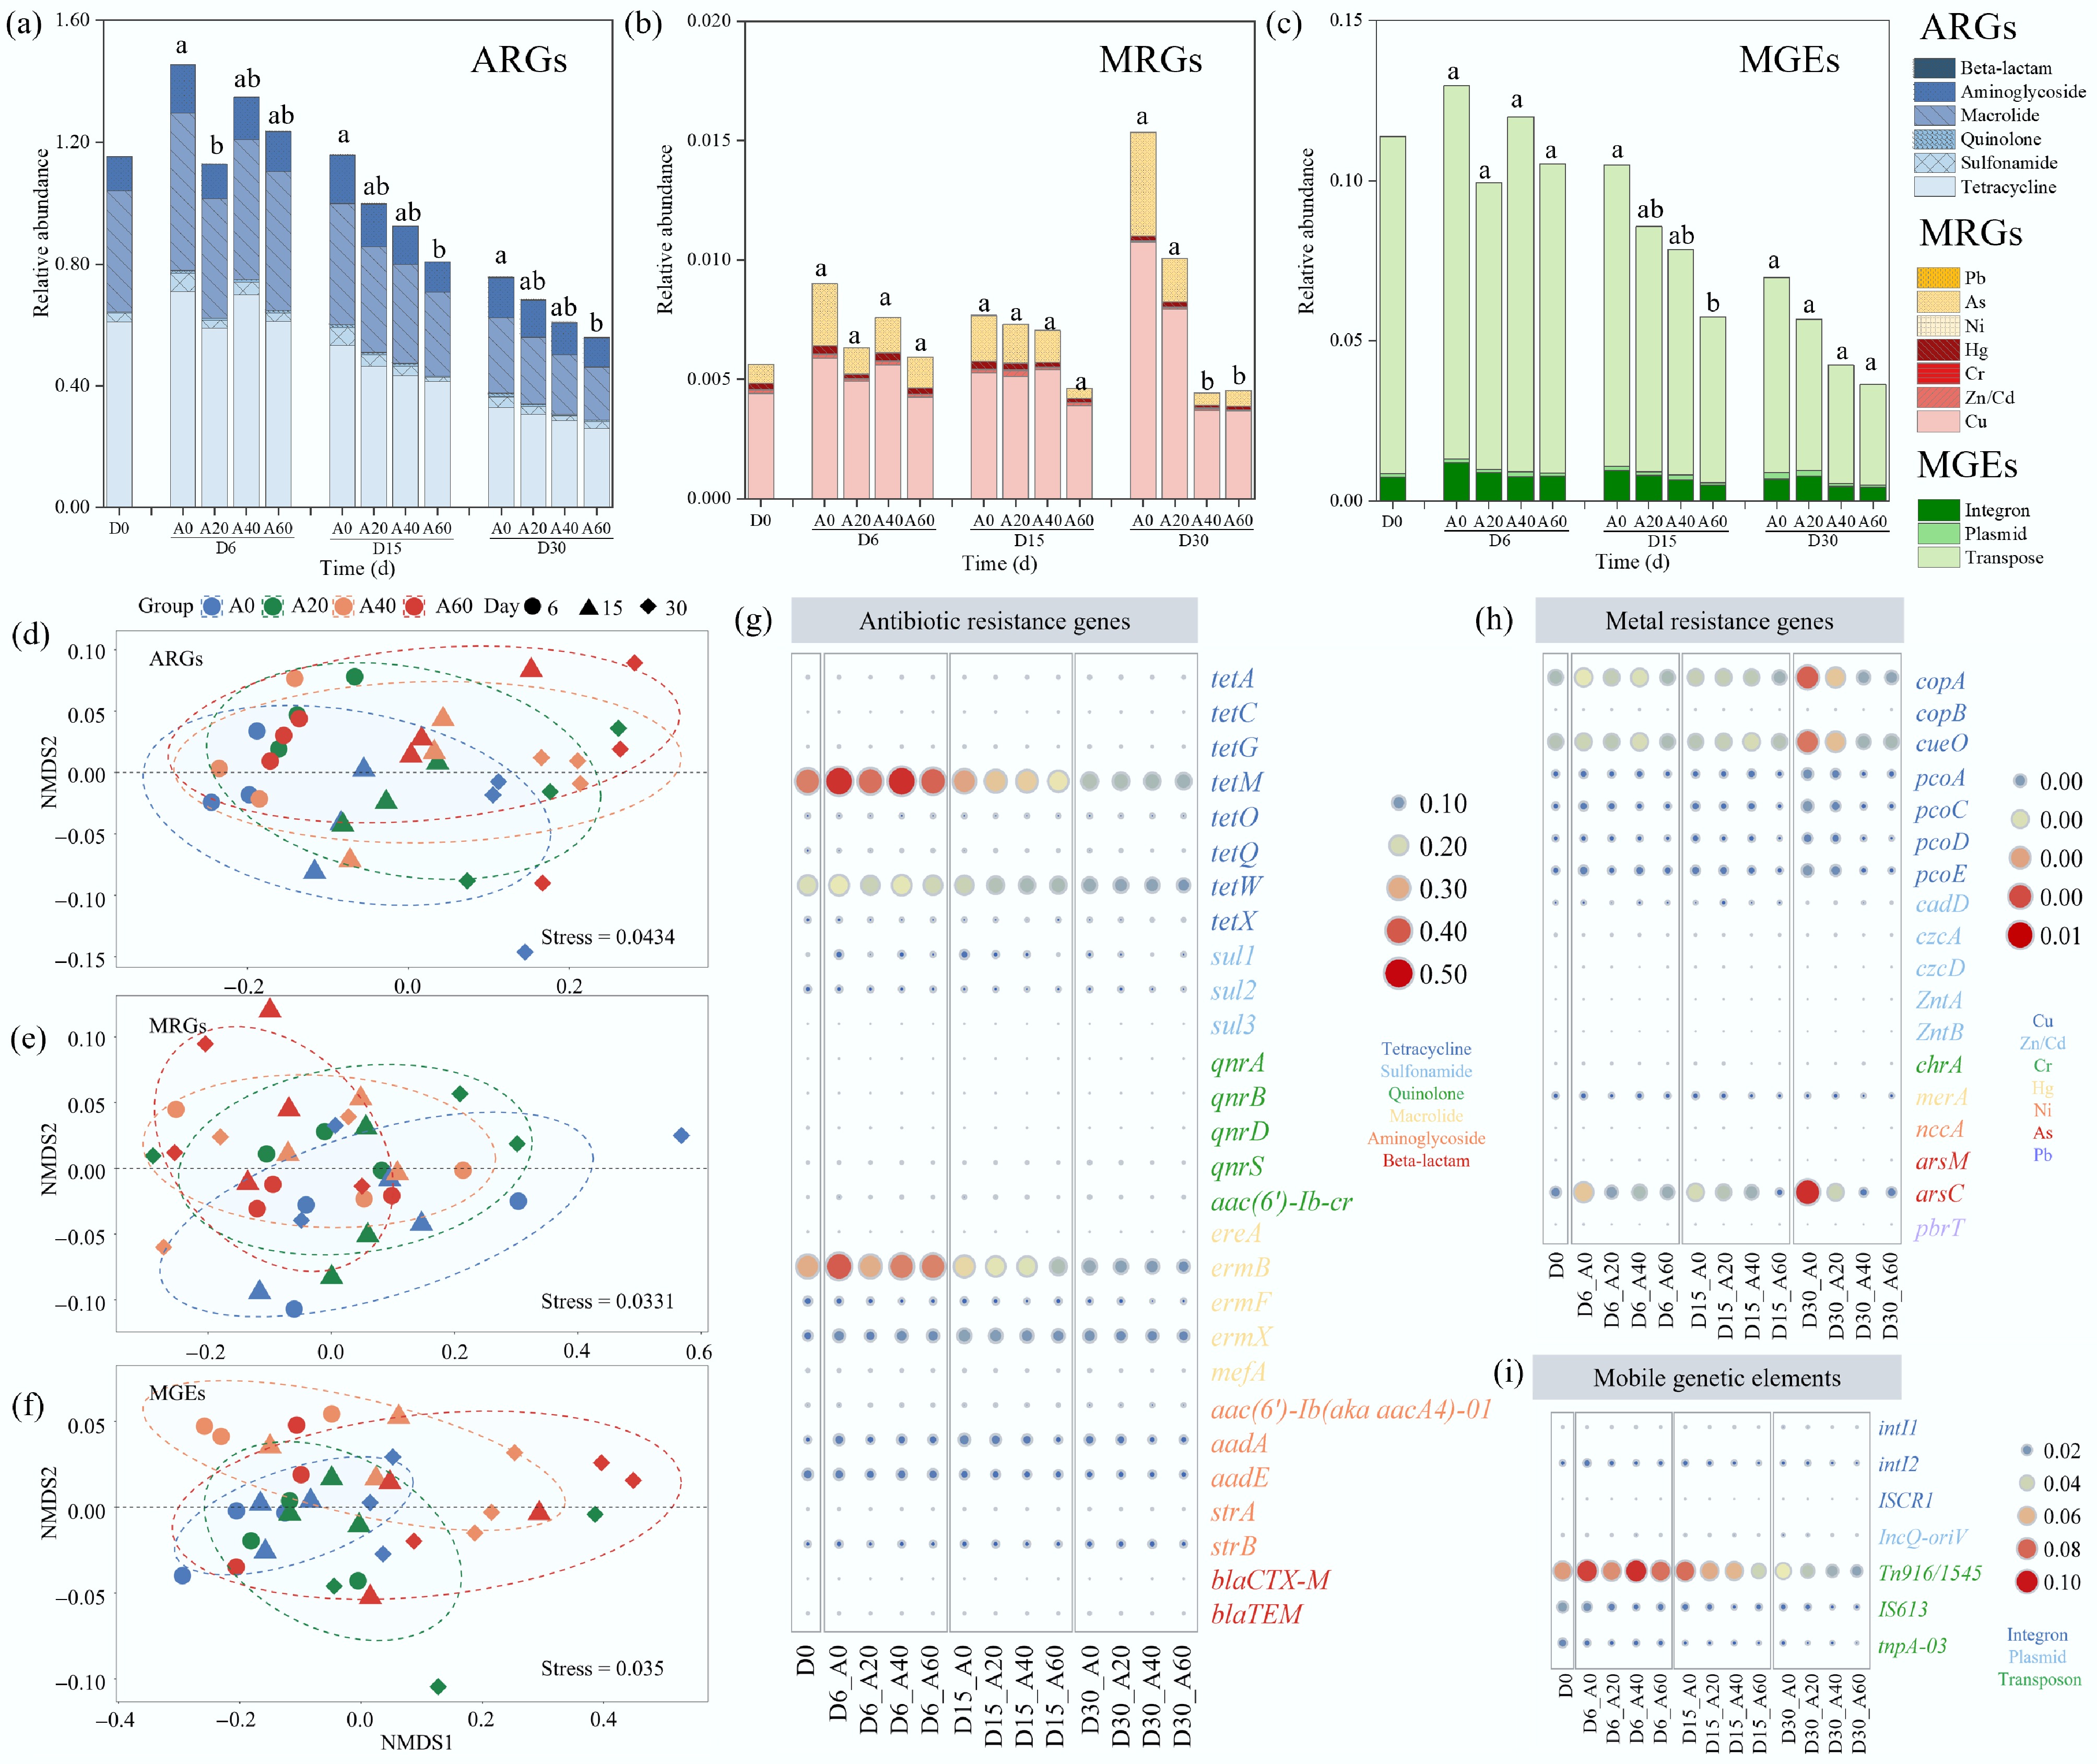
Figure 4.
The profiles of resistant genomes under different fungal gradients in facultative composting. Relative abundance of (a) ARGs, (b) MRGs, and (c) MGEs under different classifications. NMDS based on Bray−Curtis distance showing the overall pattern of (d) ARGs, (e) MRGs, and (f) MGEs under different fungal gradients. Bubble heatmap of (g) ARGs, (h) MRGs, and (i) MGEs. ARGs: antibiotic resistance genes; MRGs: metal resistance genes; MGEs: mobile genetic elements. Treatments A0, A20, A40, and A60 correspond to cycloheximide concentrations of 0, 20, 40, and 60 mg/kg, respectively.
-
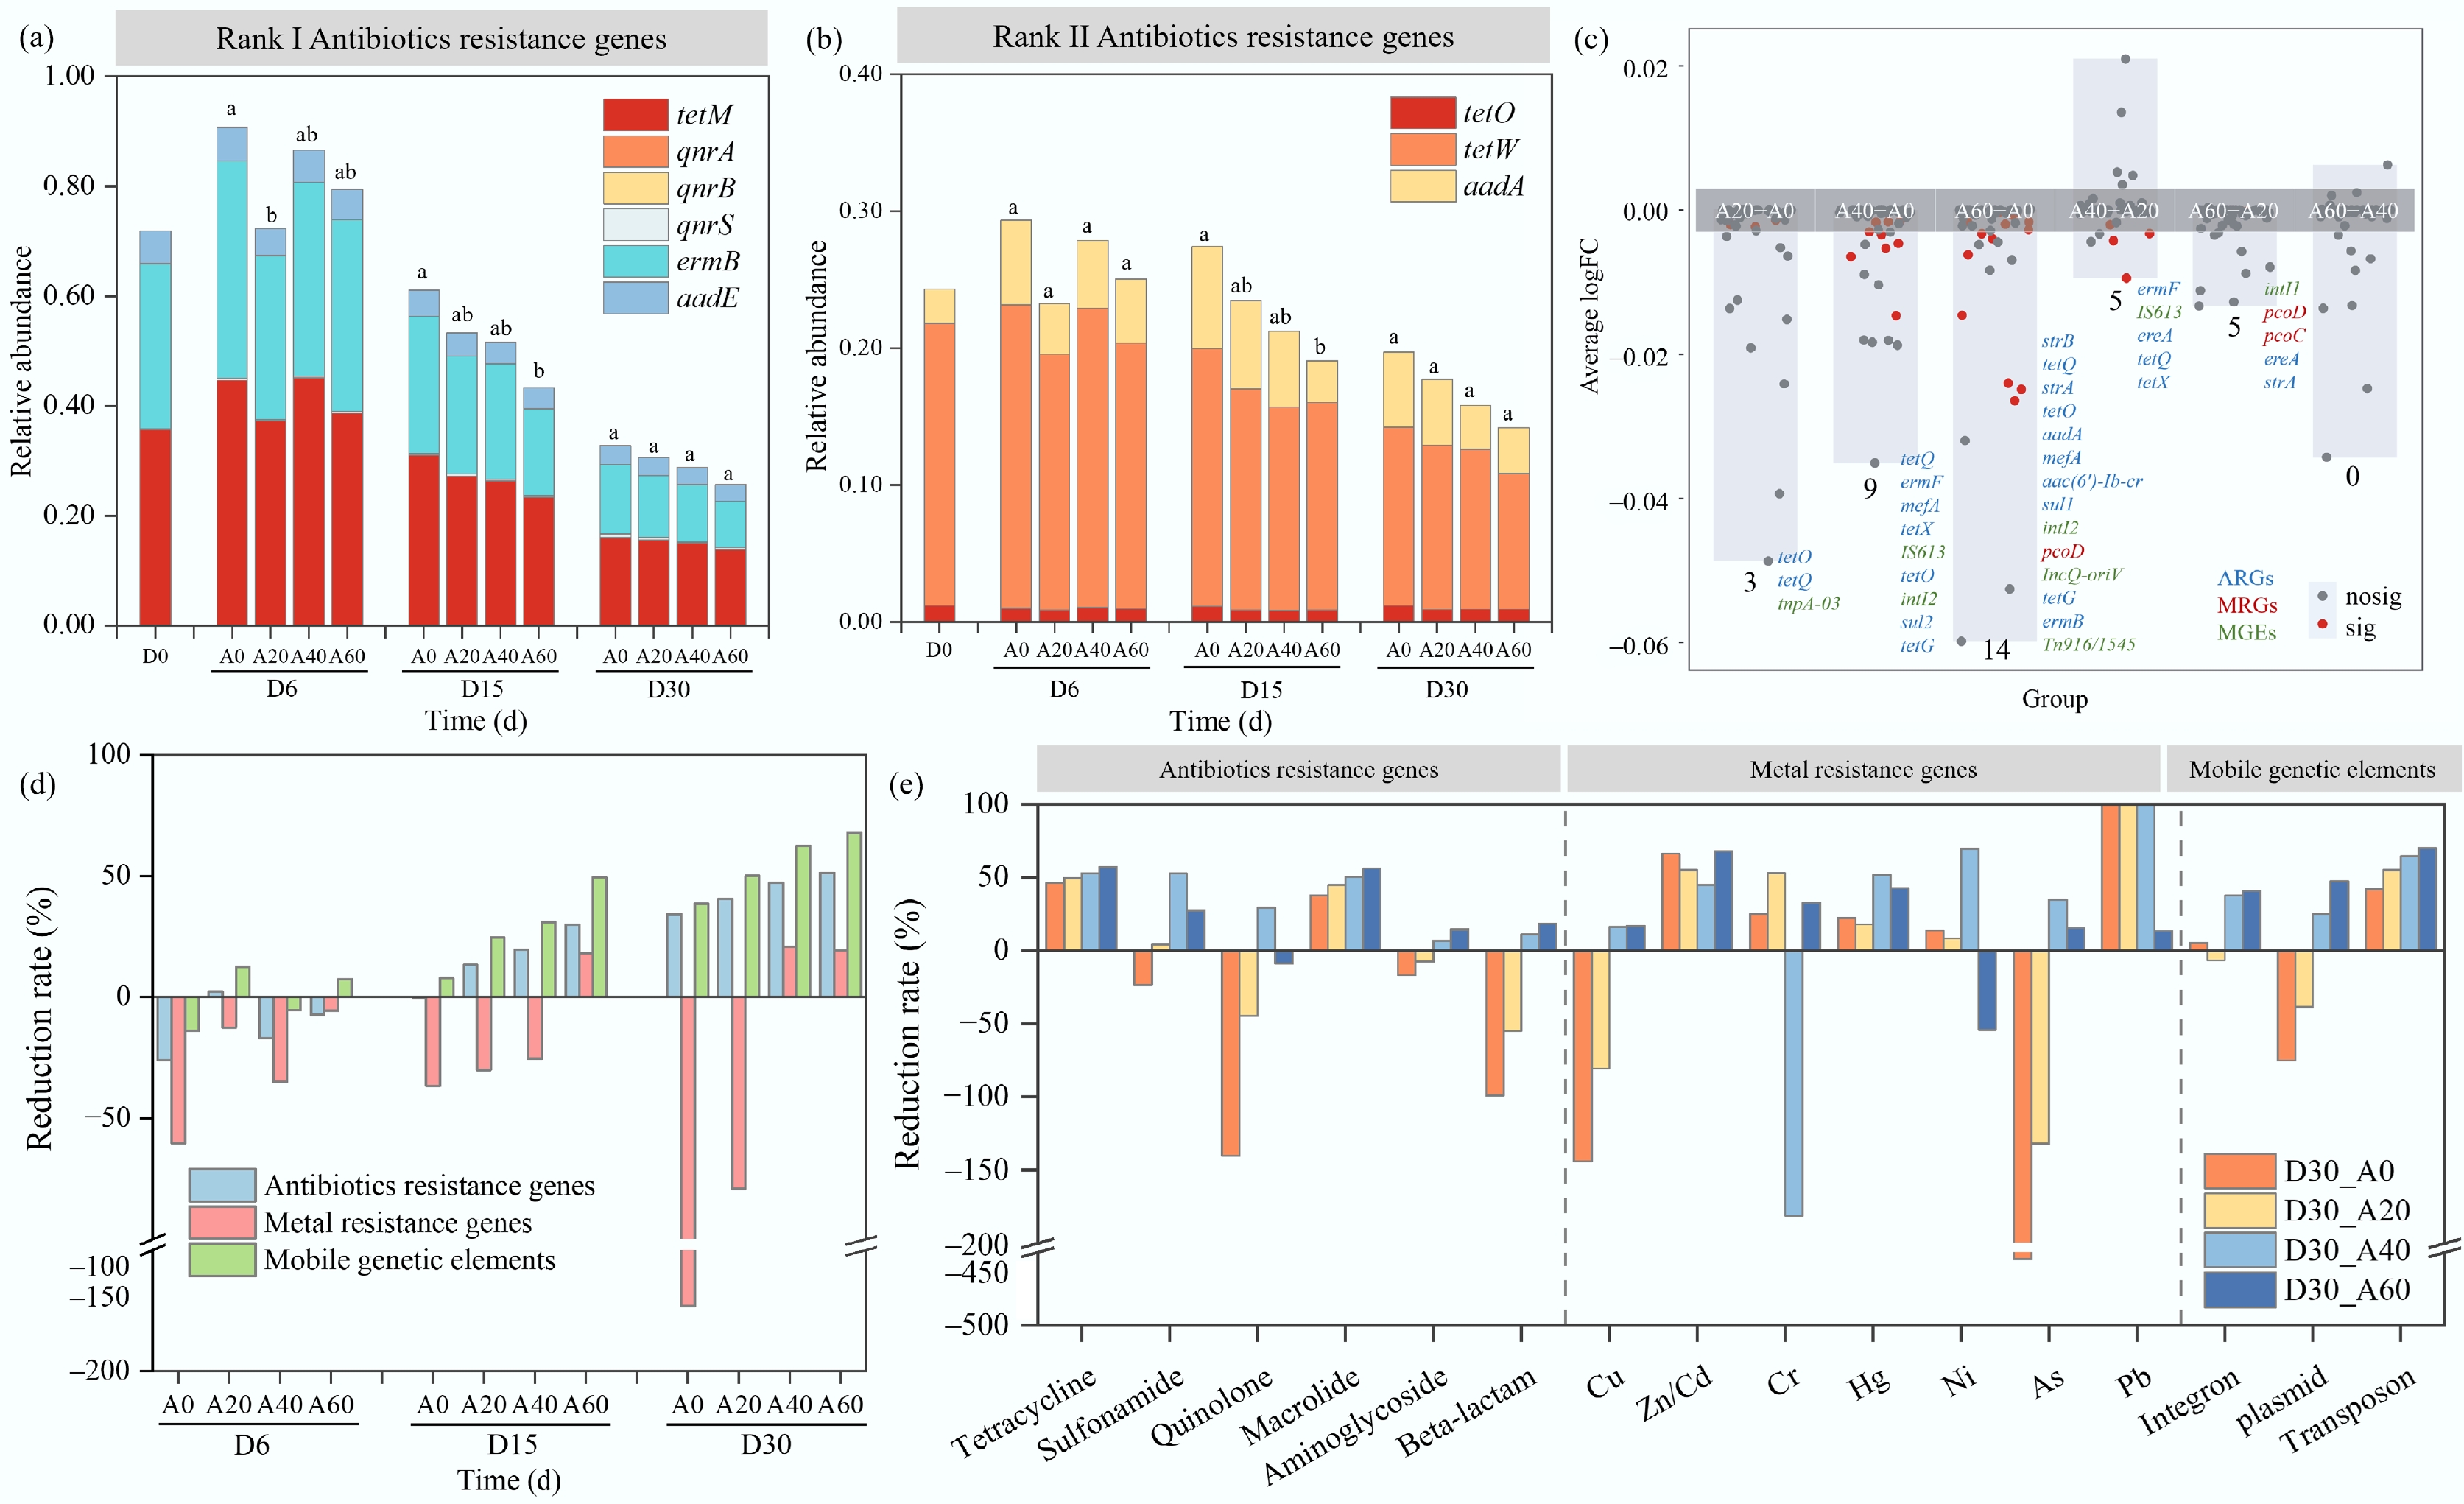
Figure 5.
Reduction of resistance genes under different fungal gradients in facultative composting. Relative abundance of ARGs with risk levels of (a) rank I and (b) rank II. (c) Significantly different genes under different fungal gradients, and the numbers correspond to the number of significantly different genes. (d) The reduction rates of ARGs, MRGs, and MGEs during facultative composting. (e) The reduction rates of each specific class of resistance genes on day 30. Treatments A0, A20, A40, and A60 correspond to cycloheximide concentrations of 0, 20, 40, and 60 mg/kg, respectively.
-
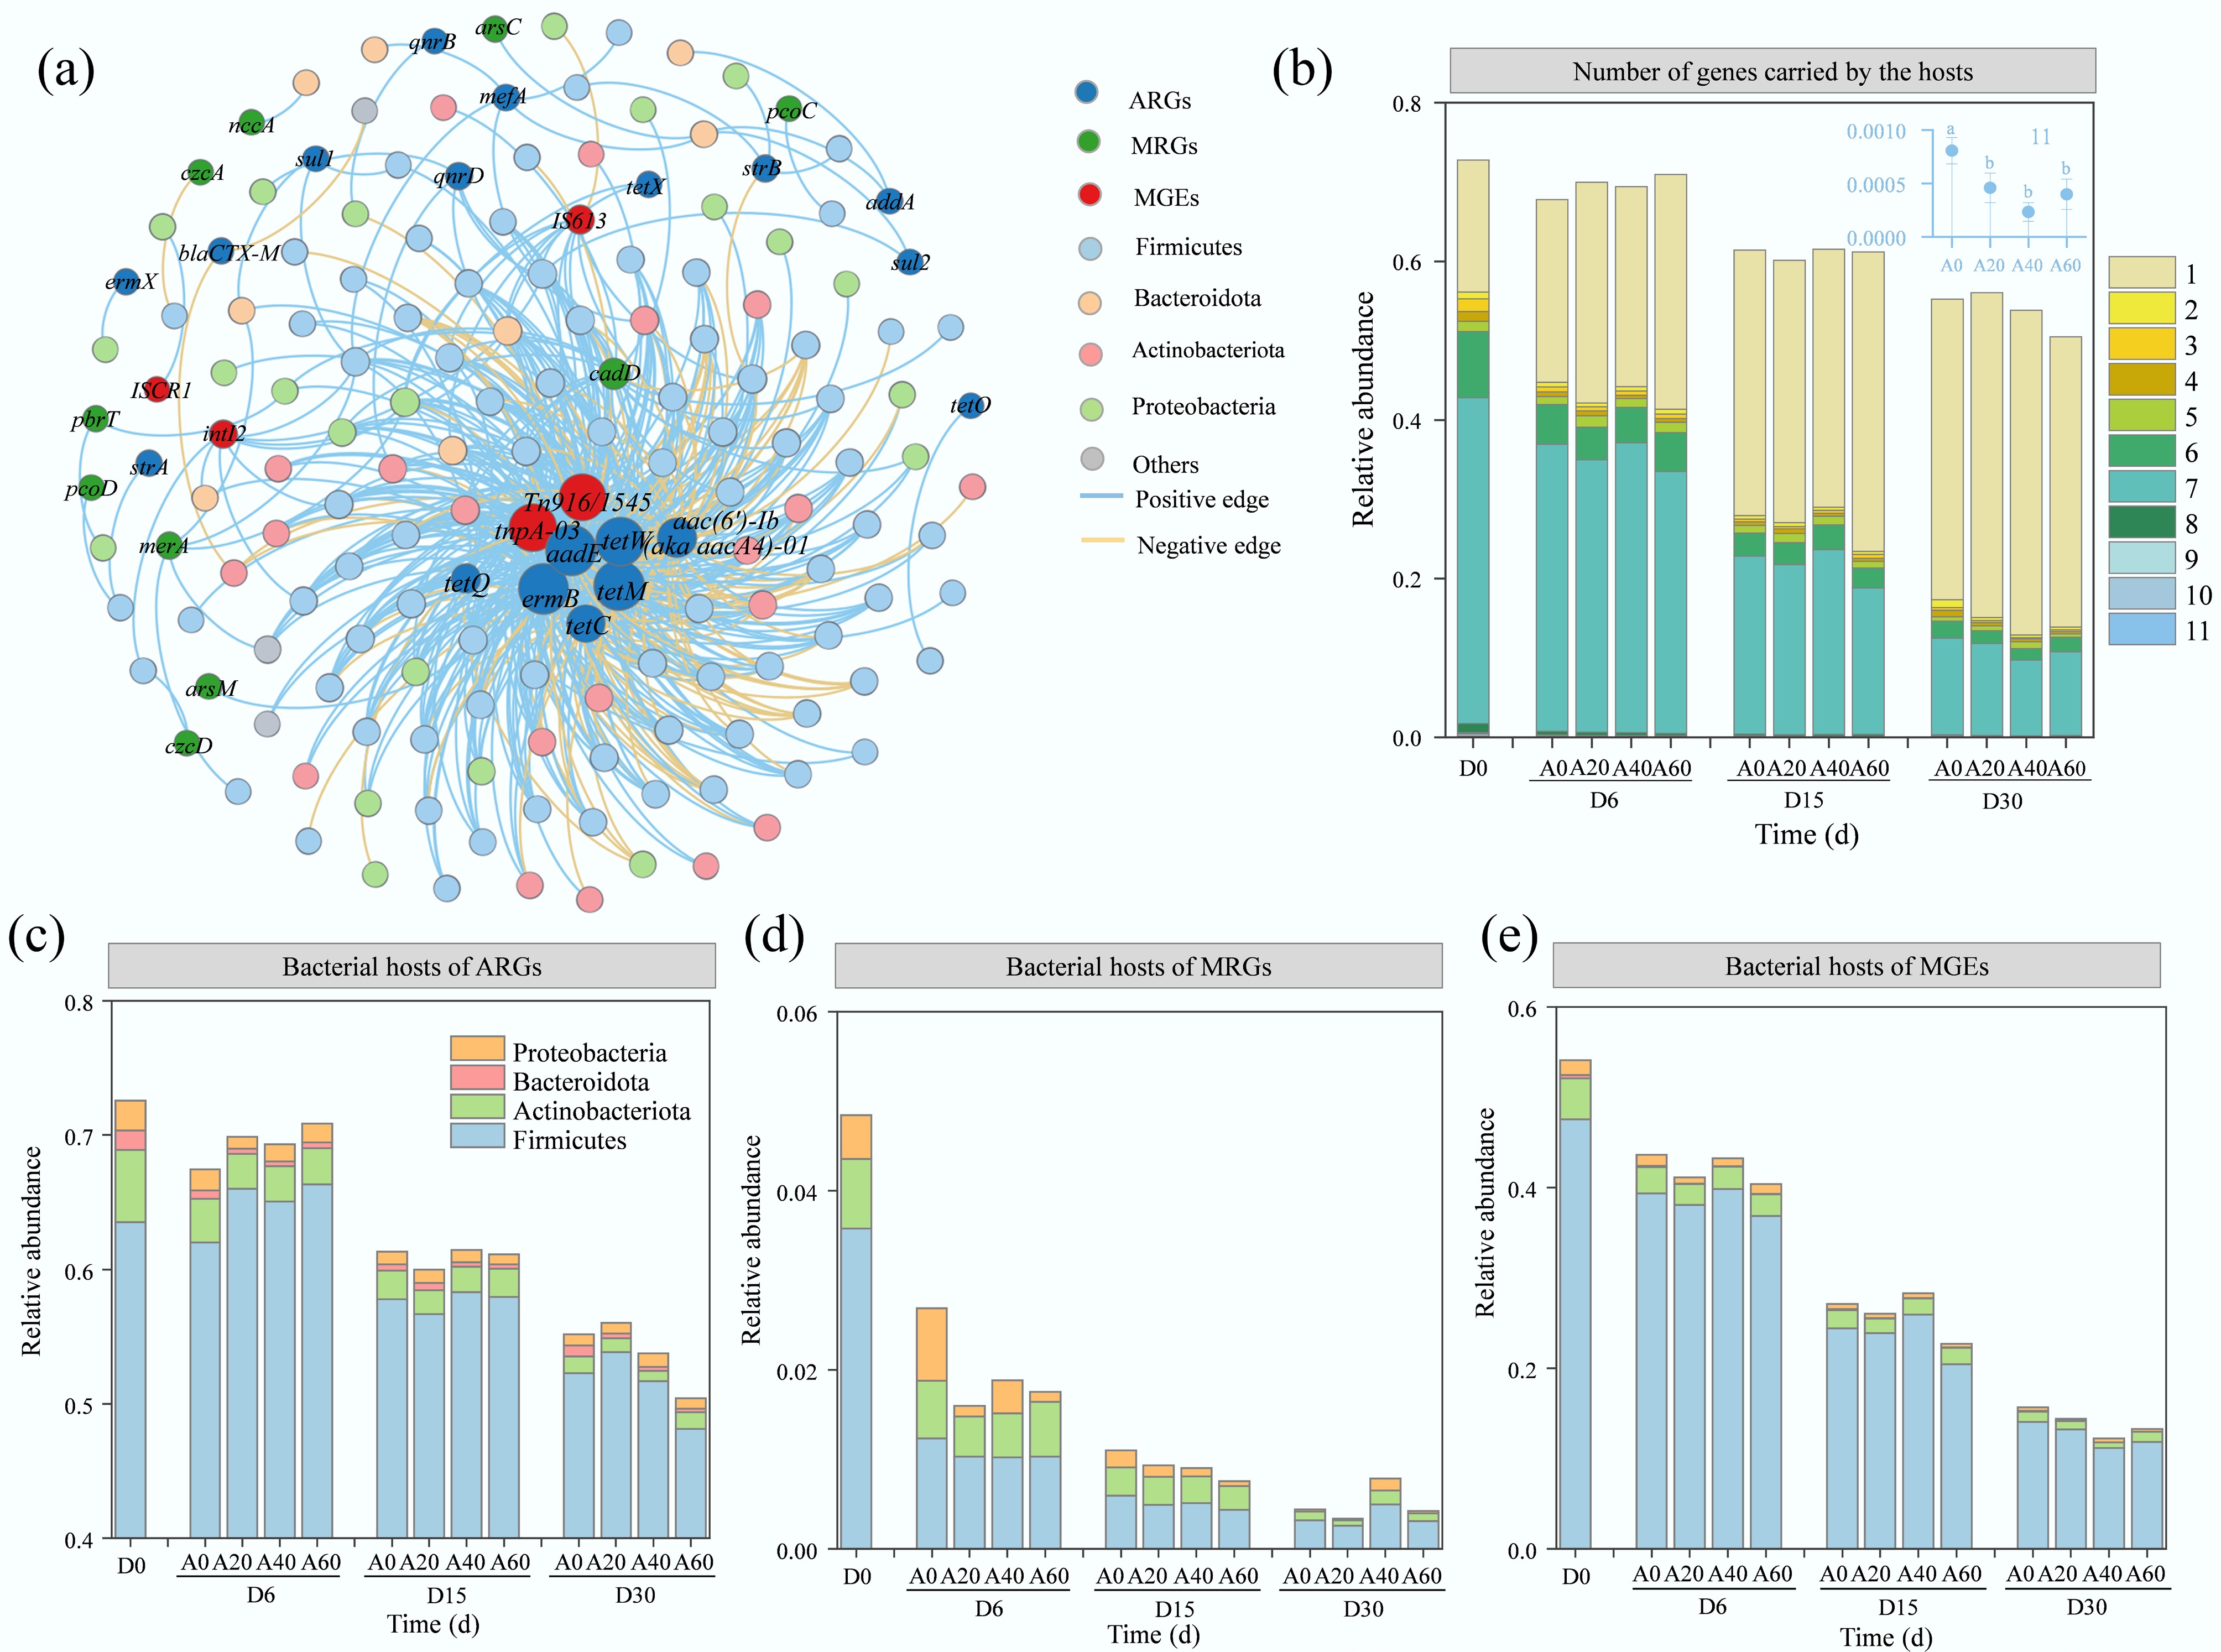
Figure 6.
Co-occurrence of bacterial communities and resistance genes under different fungal gradients in facultative composting. (a) Composition of co-occurrence networks between ARGs/MRGs/MGEs and the bacterial community. (b) Number of genes carried by the potential hosts. Relative abundance of bacterial hosts of (c) ARGs, (d) MRGs, and (e) MGEs. Connections indicate significant correlation (p < 0.01), divided into positive (Spearman's ρ > 0.6, blue) or negative (Spearman's ρ < −0.6, yellow) edges. ARGs: antibiotic resistance genes; MRGs: metal resistance genes; MGEs: mobile genetic elements. Treatments A0, A20, A40, and A60 correspond to cycloheximide concentrations of 0, 20, 40, and 60 mg/kg, respectively.
-
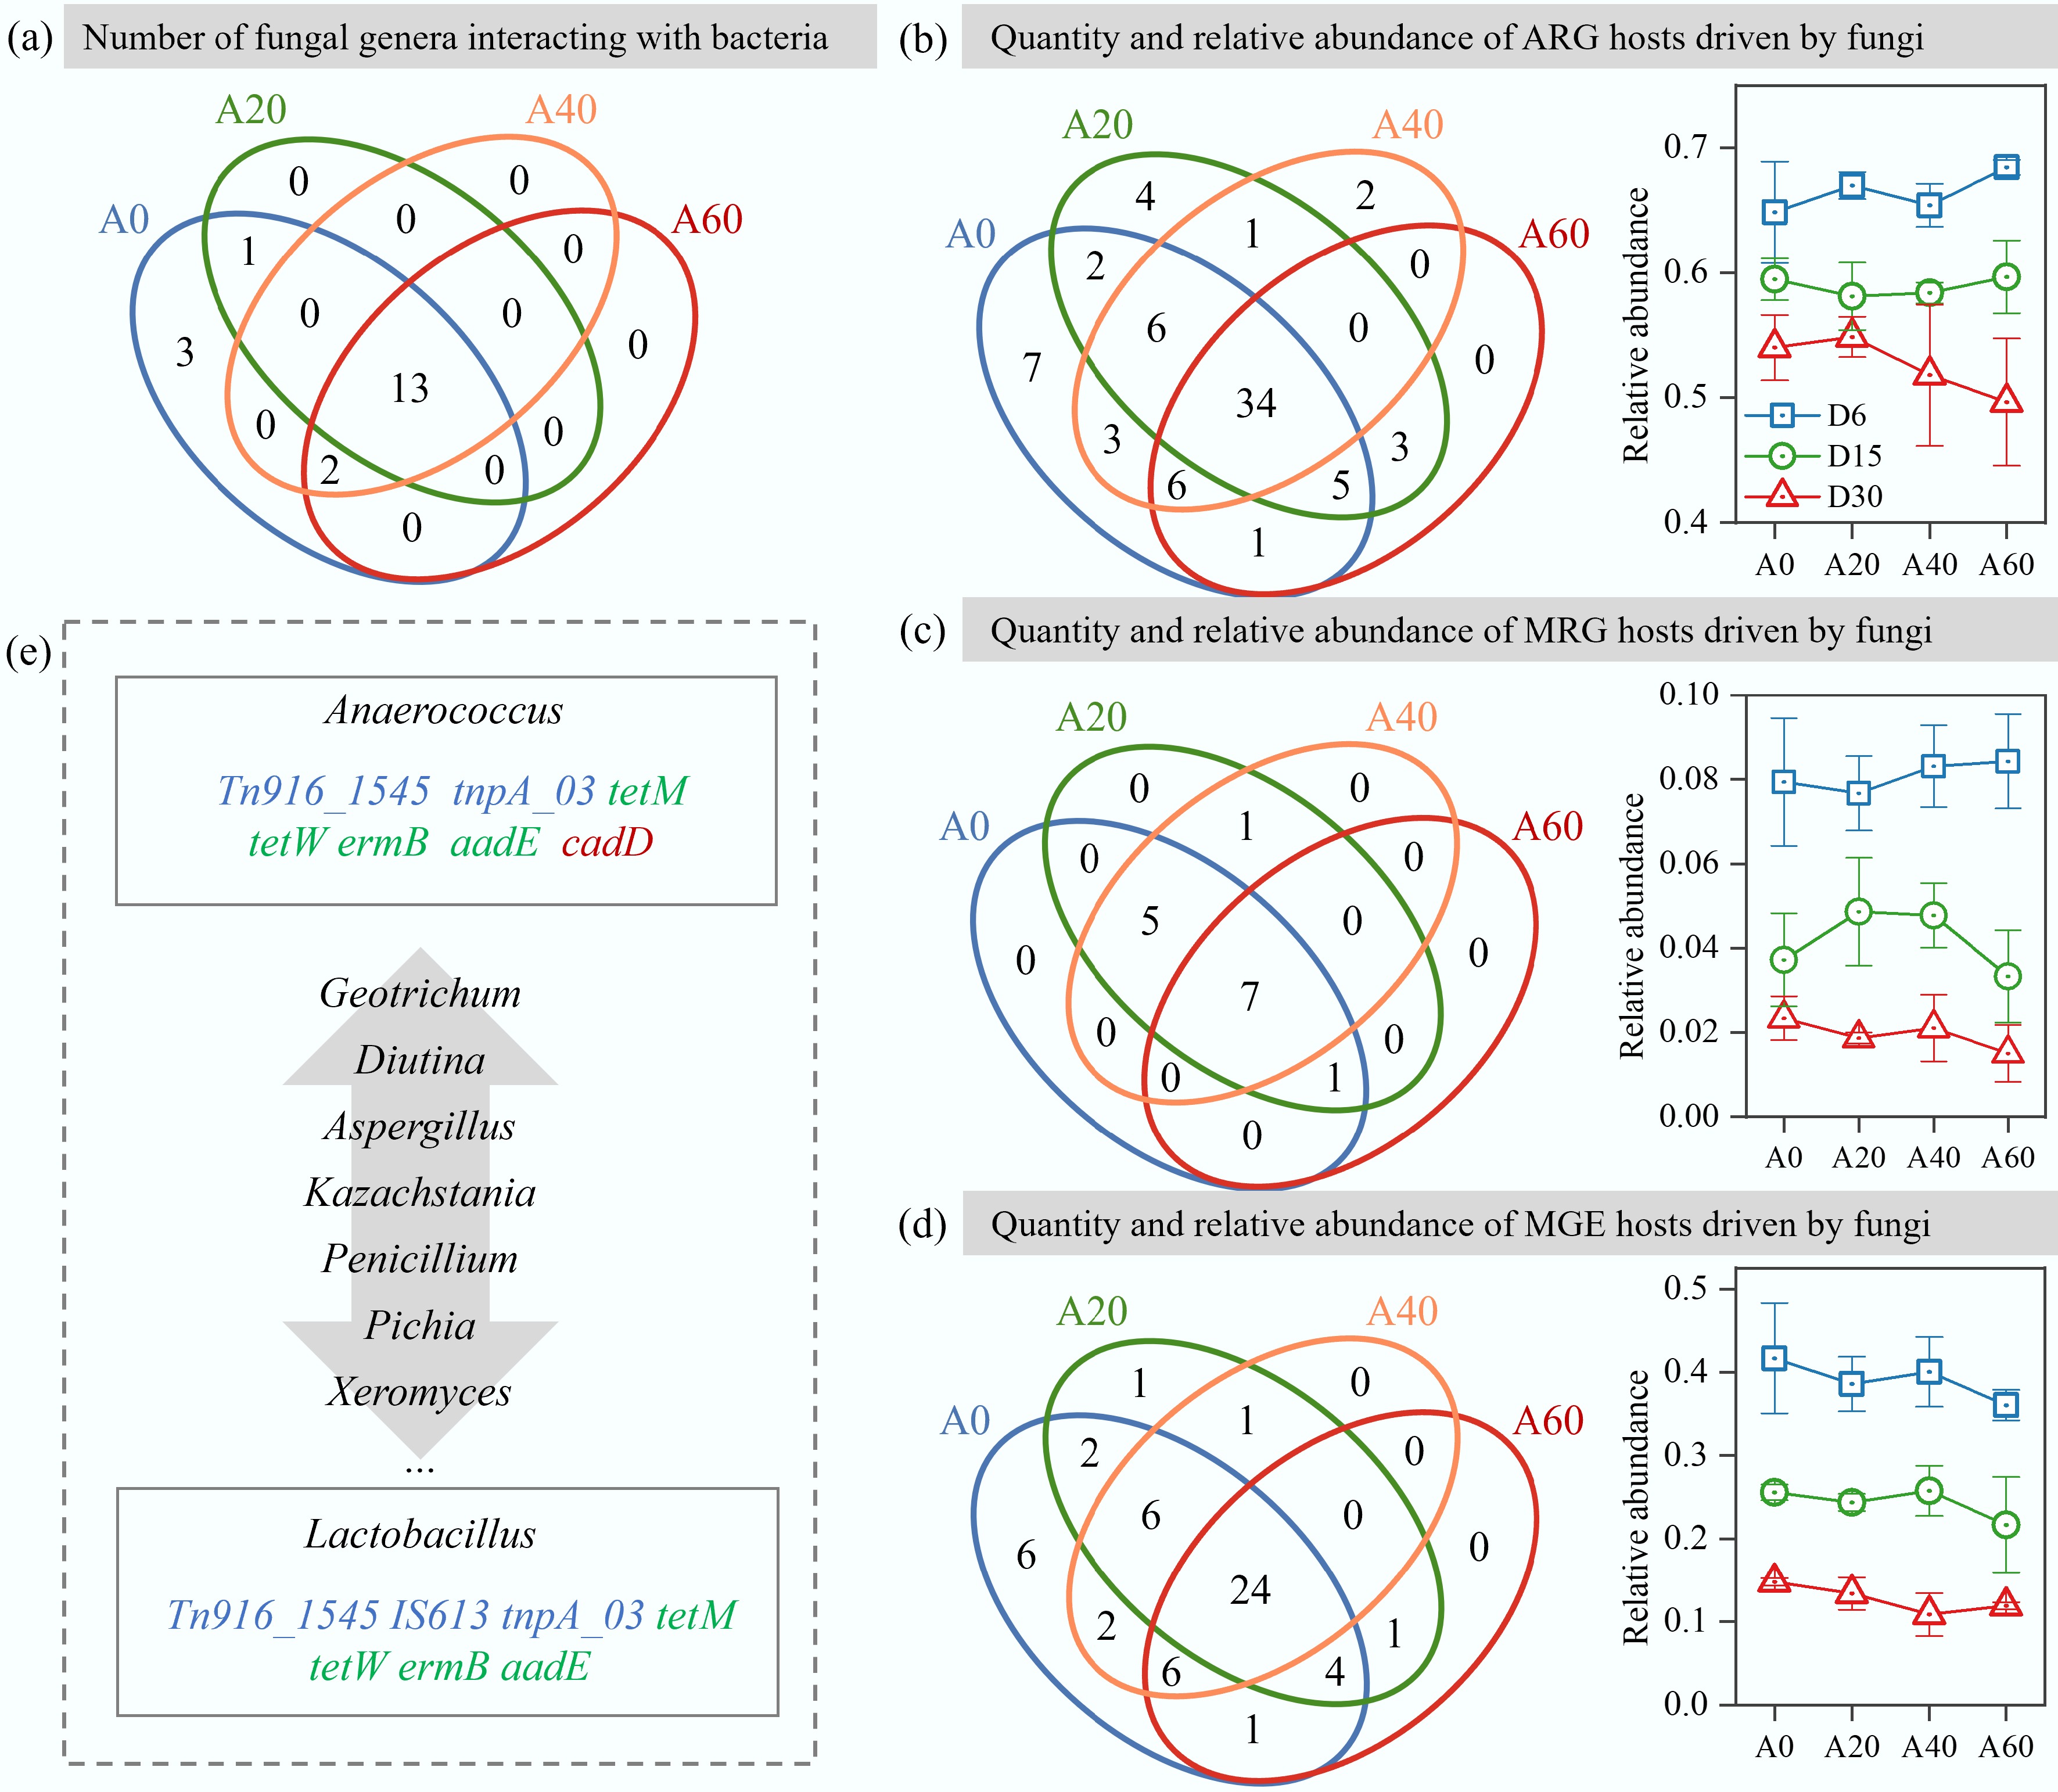
Figure 7.
Numbers of fungi driving different gene hosts under different fungal gradients in facultative composting. (a) Number of fungal genera interacting with bacteria. Quantity and relative abundance of (b) ARG, (c) MRG, and (d) MGE hosts driven by fungi. (e) Key fungi (indicated by arrows) affected key resistance genes by affecting key bacterial hosts. ARG: antibiotic resistance gene; MRG: metal resistance gene; MGE: mobile genetic element. Treatments A0, A20, A40, and A60 correspond to cycloheximide concentrations of 0, 20, 40, and 60 mg/kg, respectively.
Figures
(7)
Tables
(0)