-
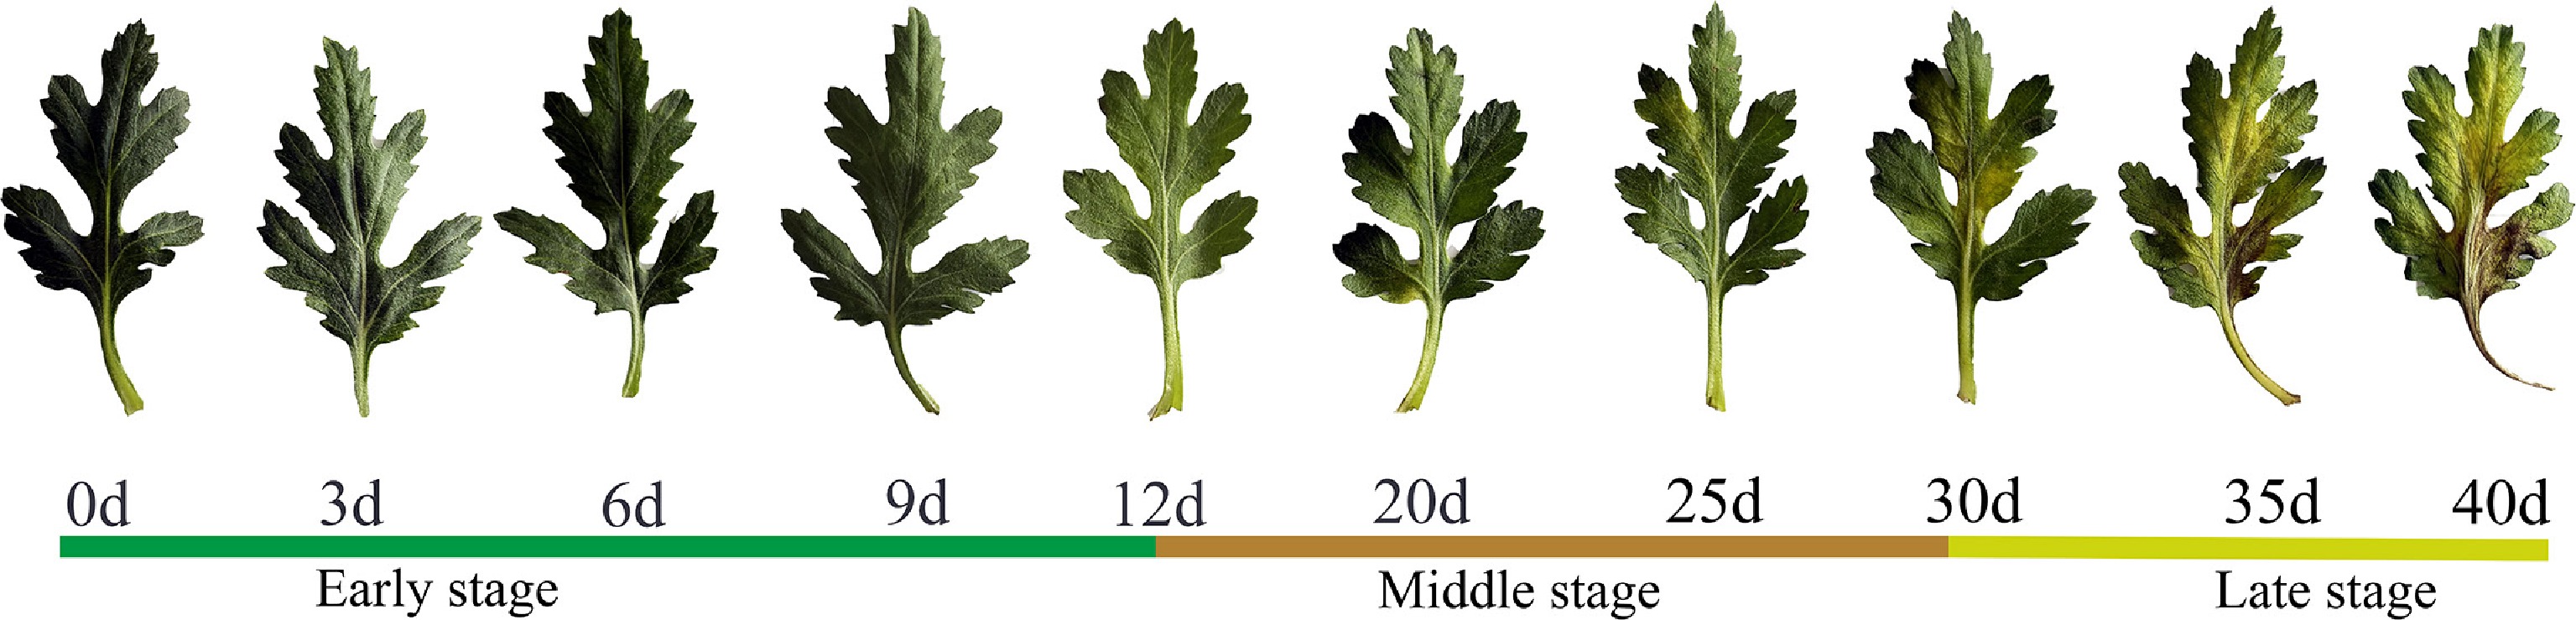
Figure 1.
Leaf senescence phenotypes of cut chrysanthemum during vase life. Leaves were sampled at 0, 3, 6, 9, 12, 20, 25, 30, 35, and 40 d after vase treatment. The horizontal color bar classifies the whole senescence process into three stages: early stage (0–12 d), middle stage (12–30 d), and late stage (30–40 d). Note: d, days after vase insertion.
-
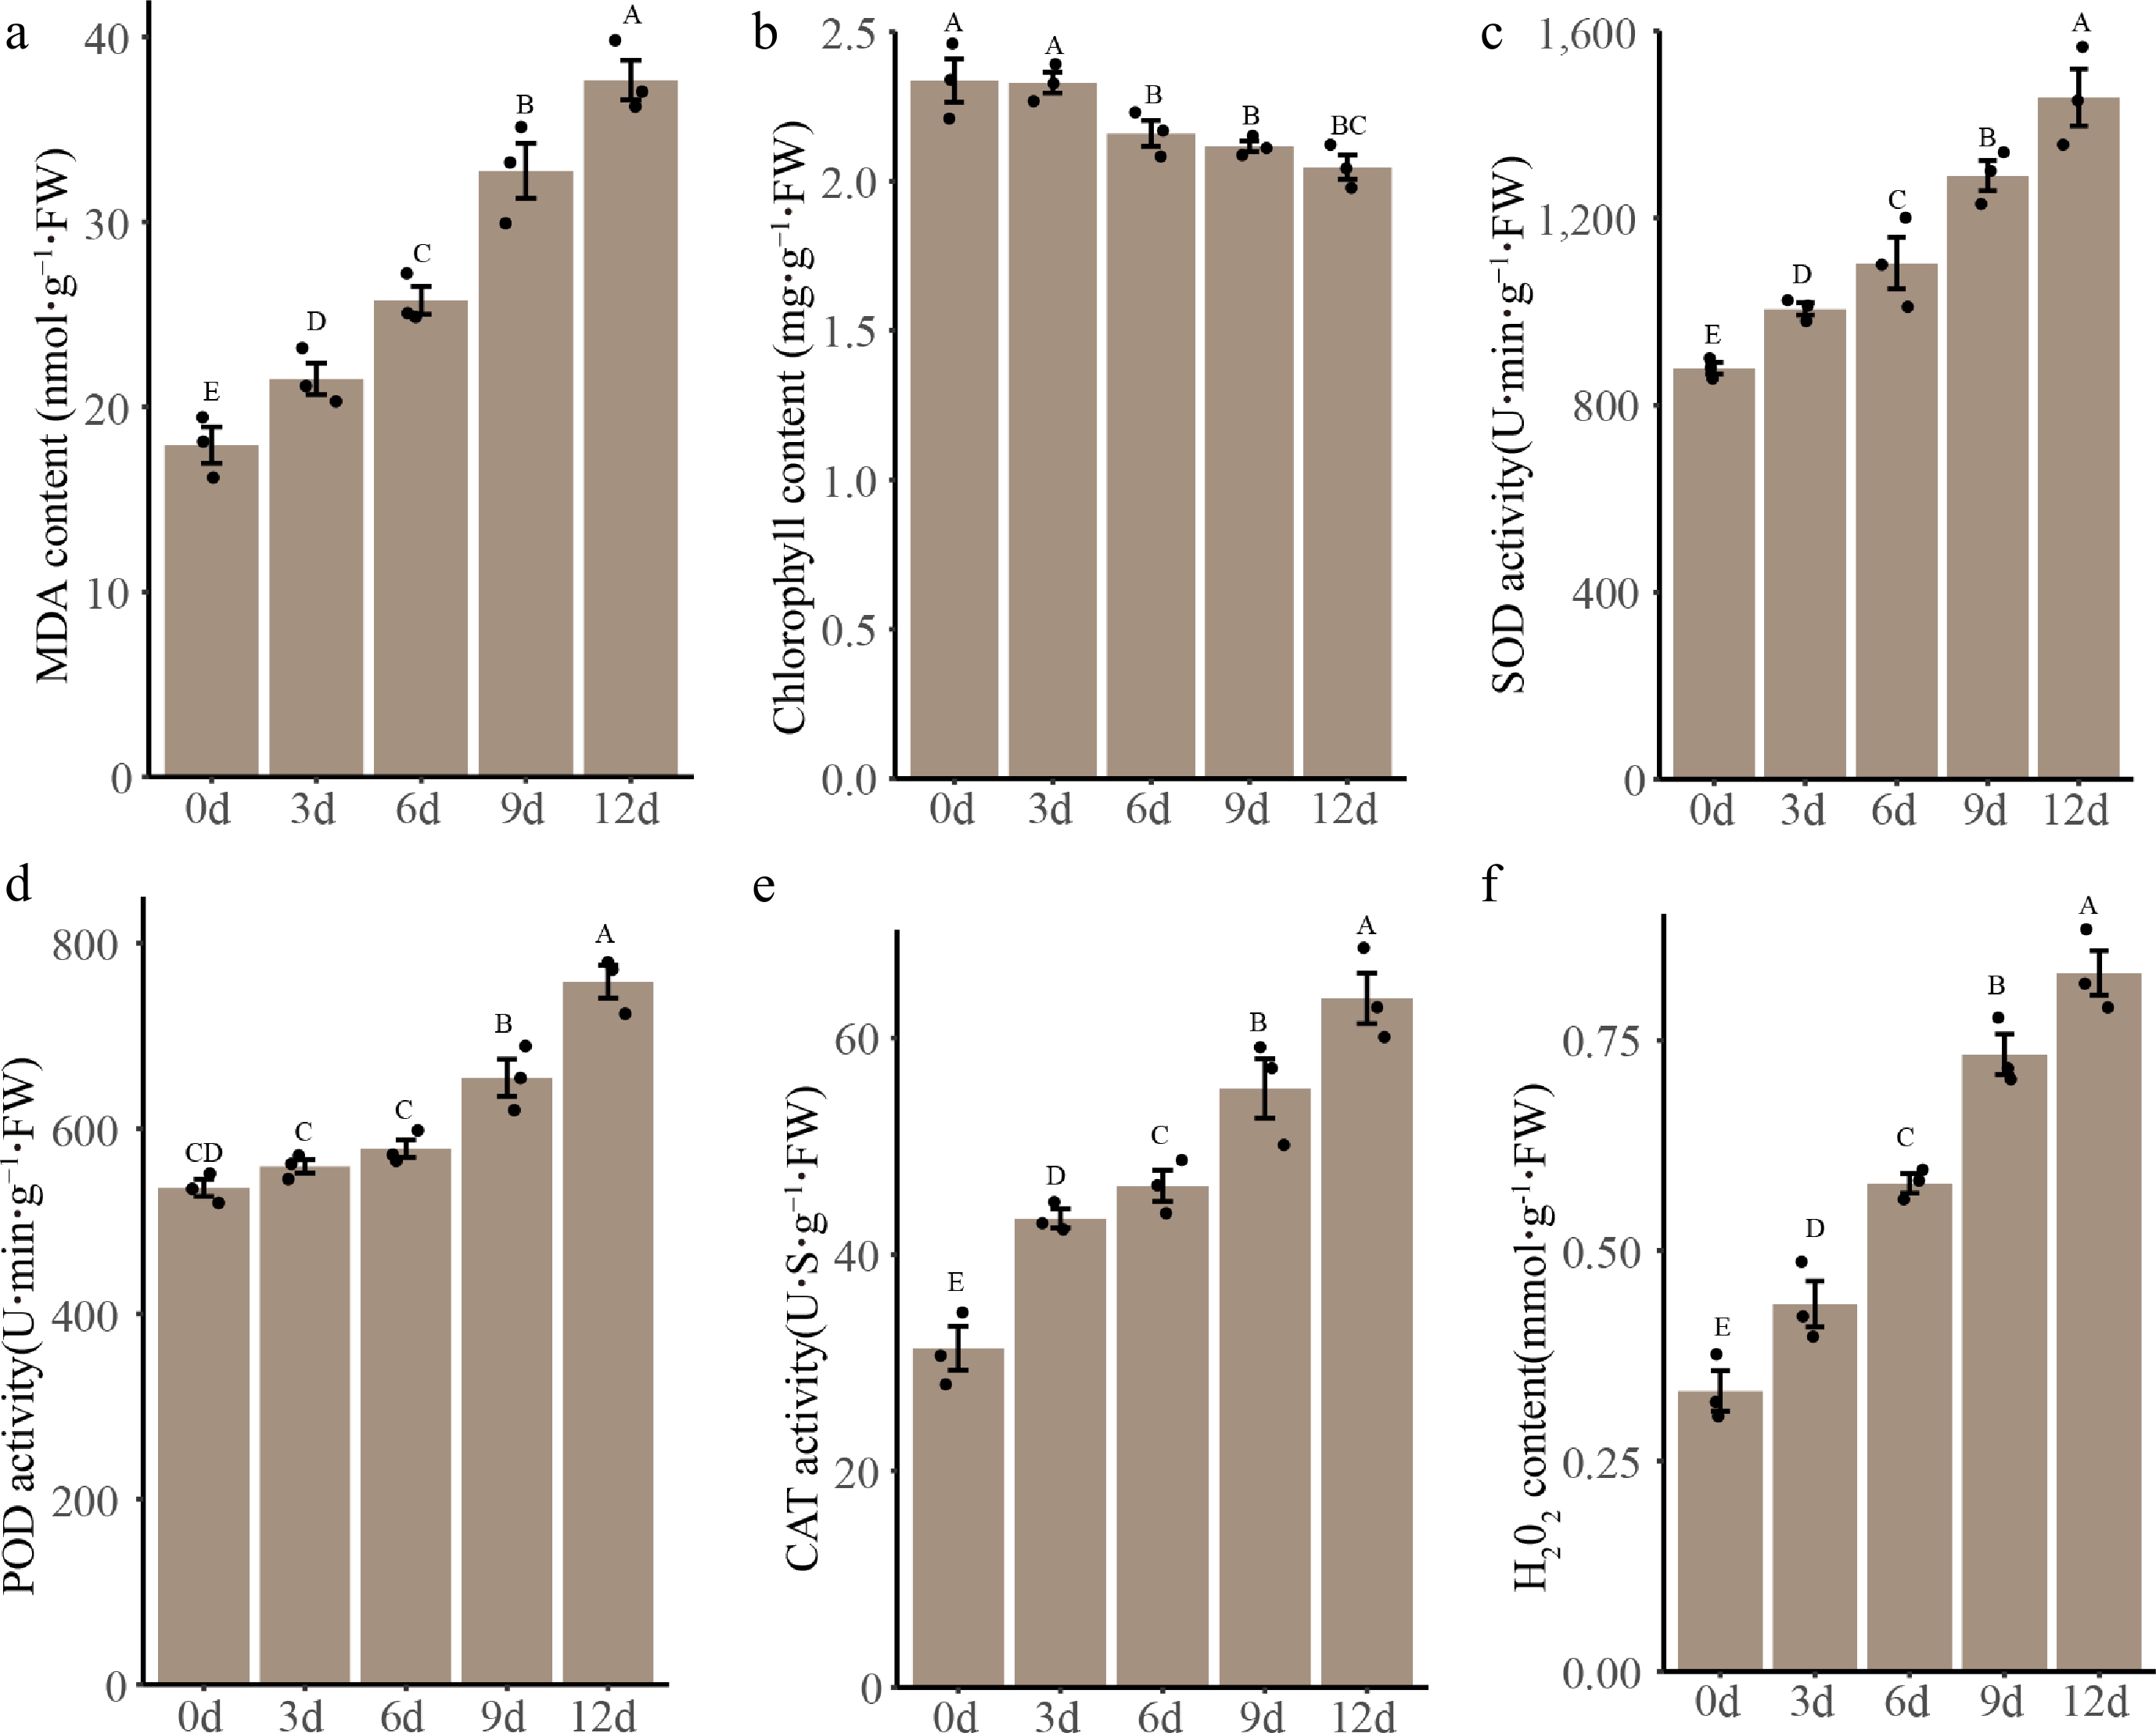
Figure 2.
Changes in physiological indices of cut chrysanthemum leaves during early vase treatment. (a) MDA content. (b) Chlorophyll content. Activities of antioxidant enzymes including (c) SOD, (d) POD, and (e) CAT. (f) H2O2 content. All data are presented as mean ± standard deviation (SD) of three biological replicates. Different uppercase letters indicate significant differences at the p < 0.05 level according to Duncan's multiple range test. FW: fresh weight.
-
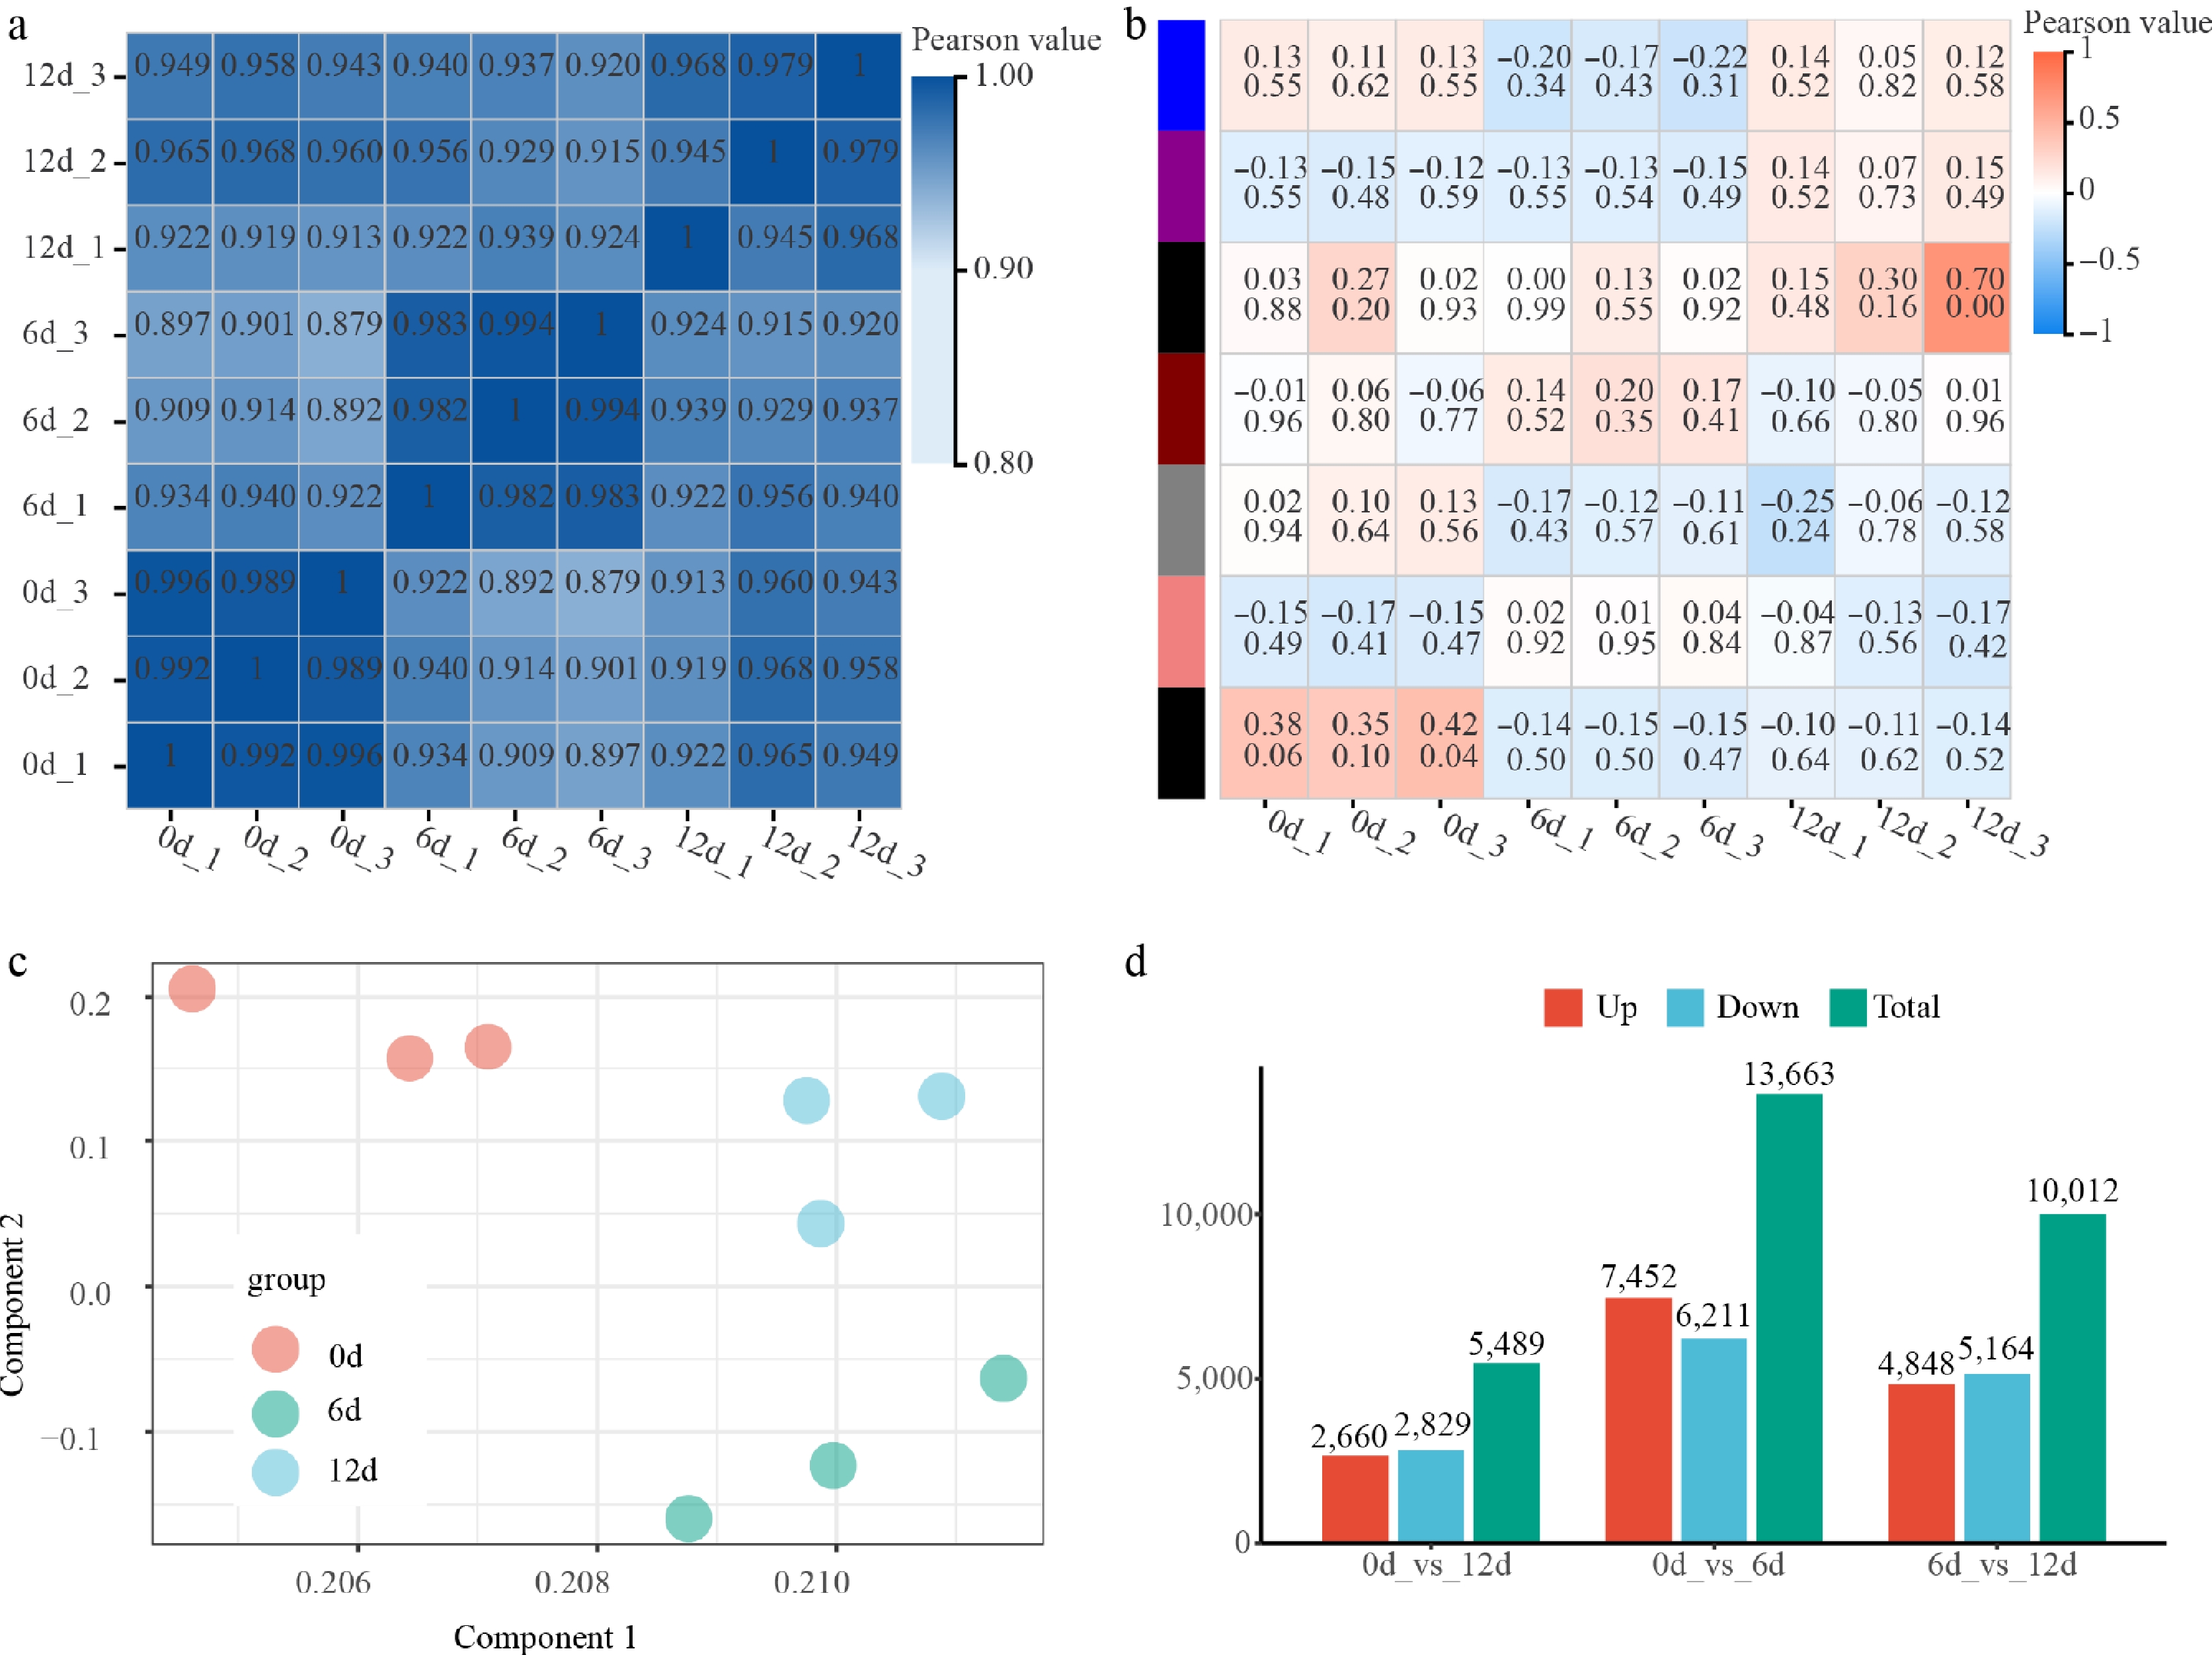
Figure 3.
Multi-dimensional transcriptomic analysis of gene co-expression modules and temporal expression dynamics across different time points. (a) Correlation heatmap of gene co-expression modules. (b) Module-trait association heatmap. (c) Principal component analysis (PCA) of global transcriptomes. (d) Differential gene expression (DGE) statistics between time points.
-
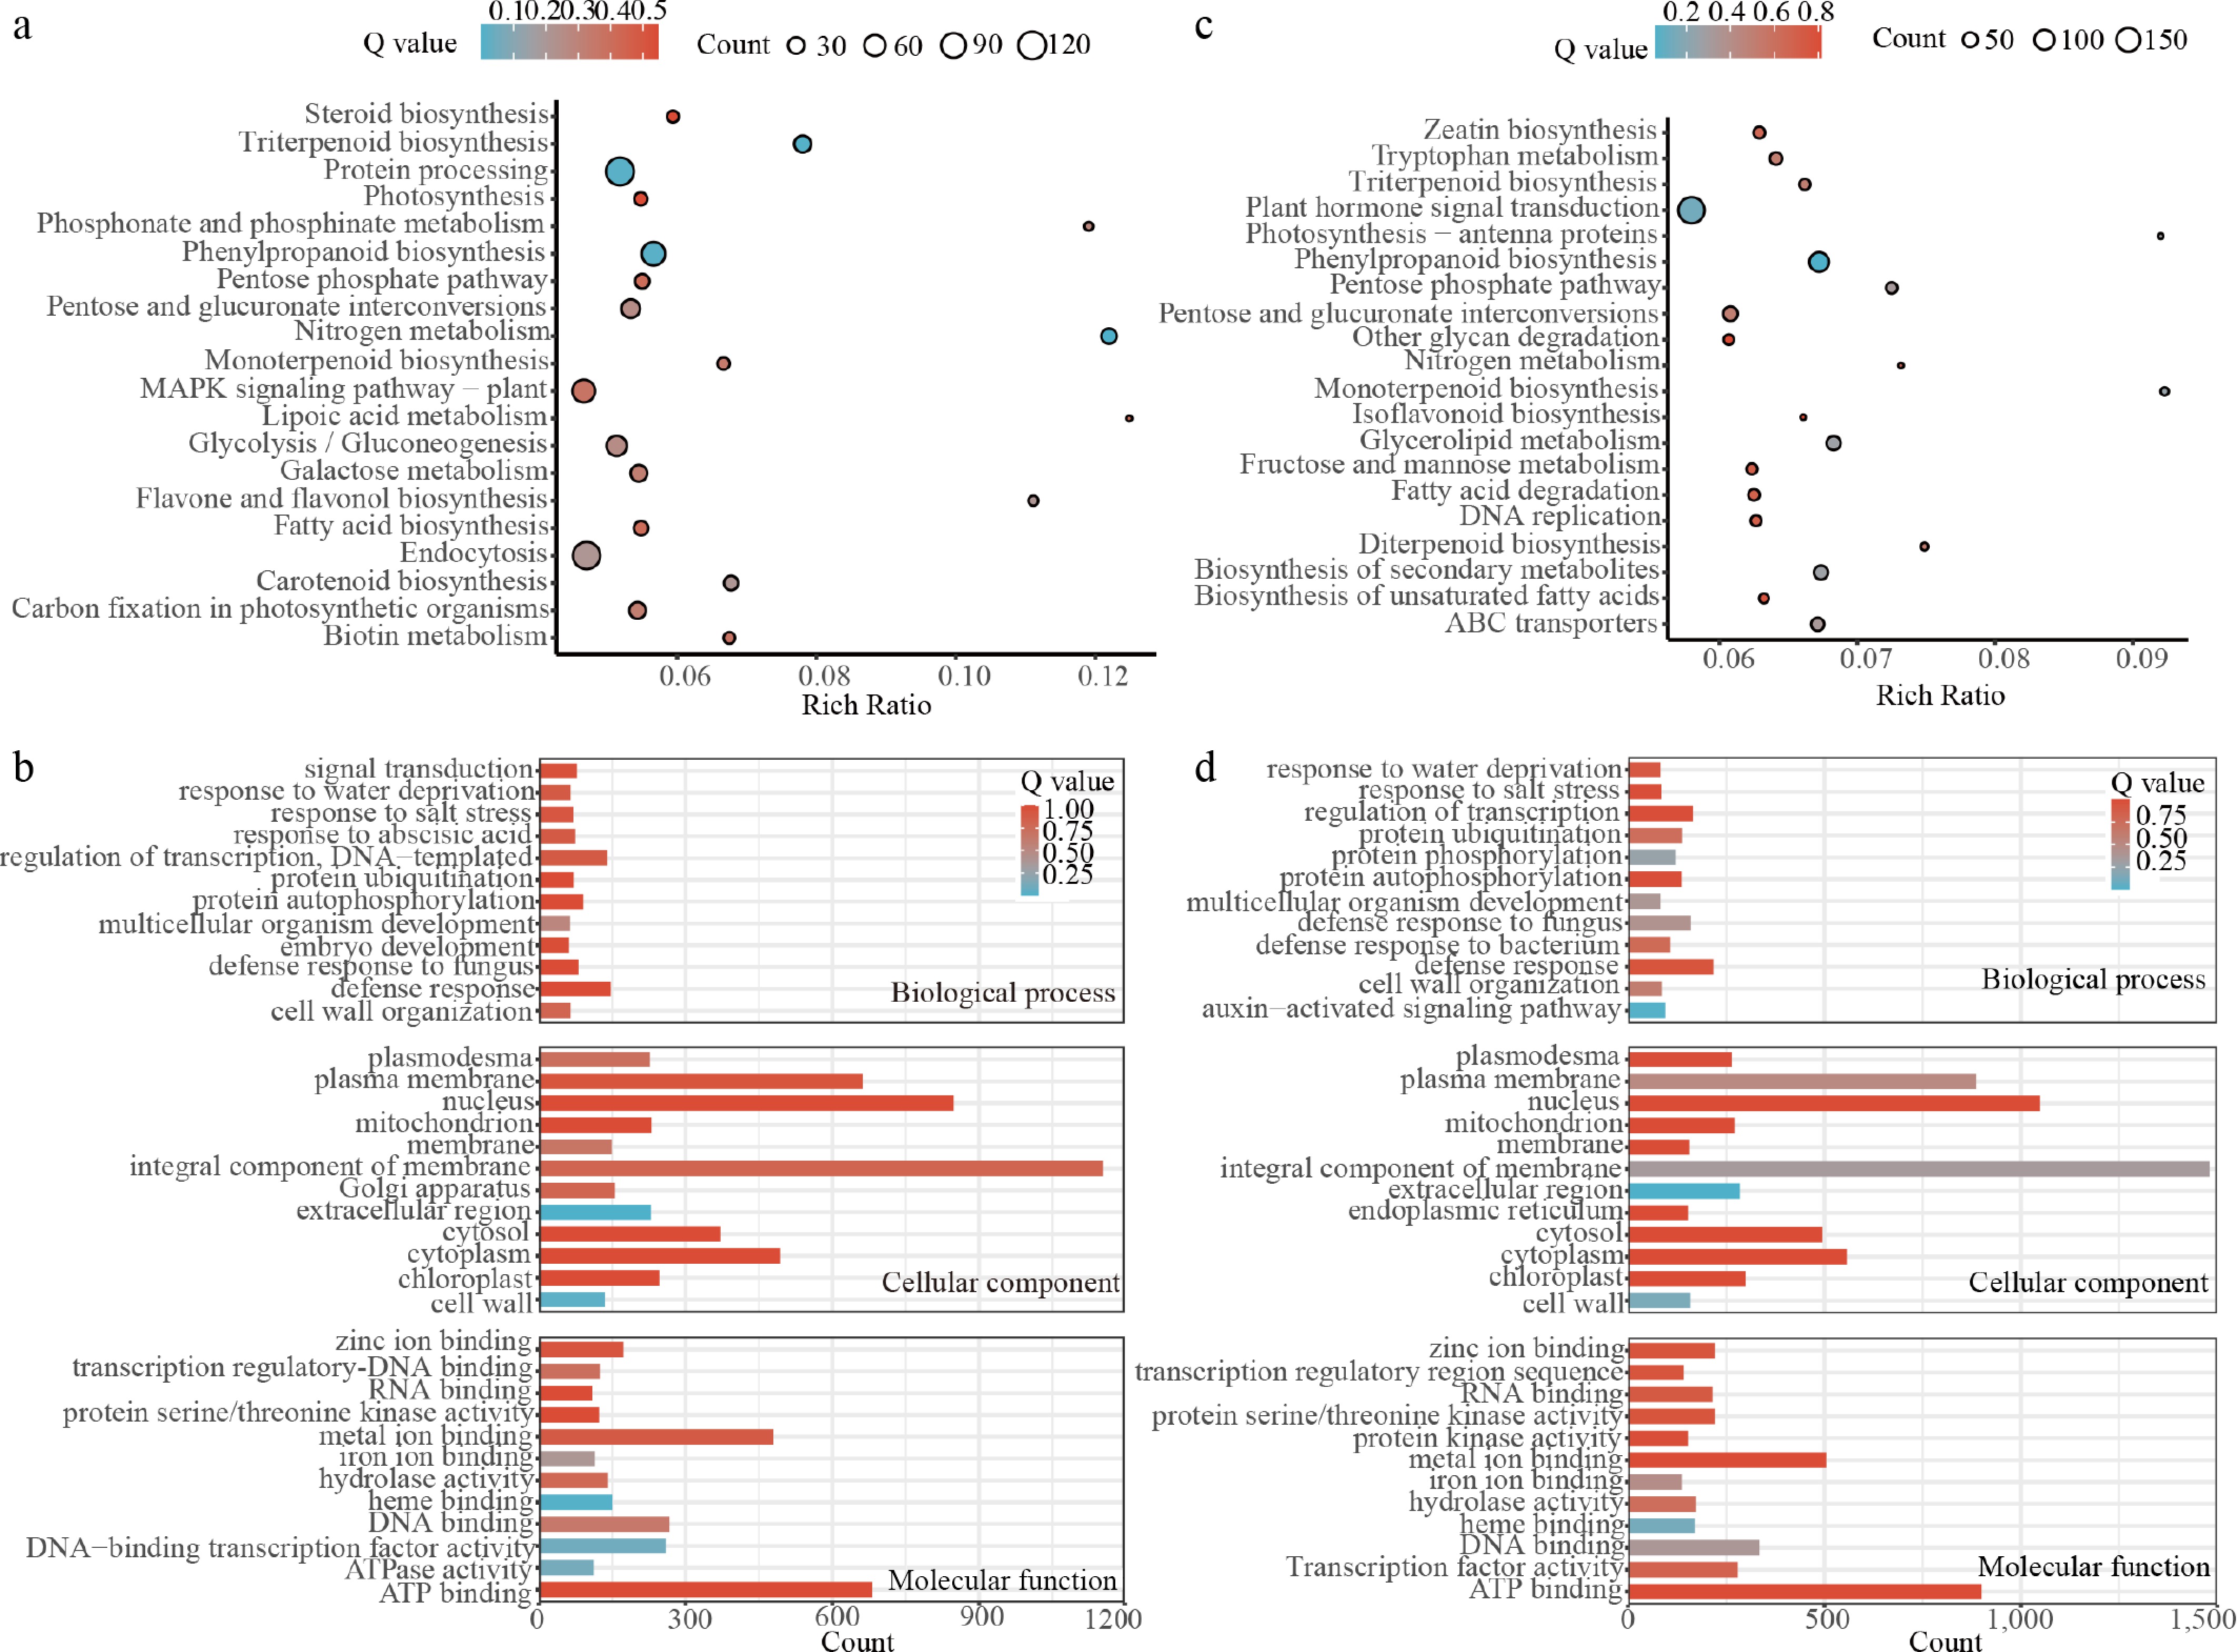
Figure 4.
KEGG pathway and GO enrichment analysis of DEGs during early leaf senescence in chrysanthemum cut flowers during vase treatment. (a) KEGG pathway enrichment of DEGs in the first stage (0–6 d); (b) GO enrichment of DEGs in the first stage (0–6 d); (c) KEGG pathway enrichment of DEGs in the second stage (6–12 d); (d) GO enrichment of DEGs in the second stage (6–12 d). The color of the dots/bars represents the Q value (FDR-adjusted p-value), and the size of the dots/length of the bars represents the number of enriched DEGs.
-
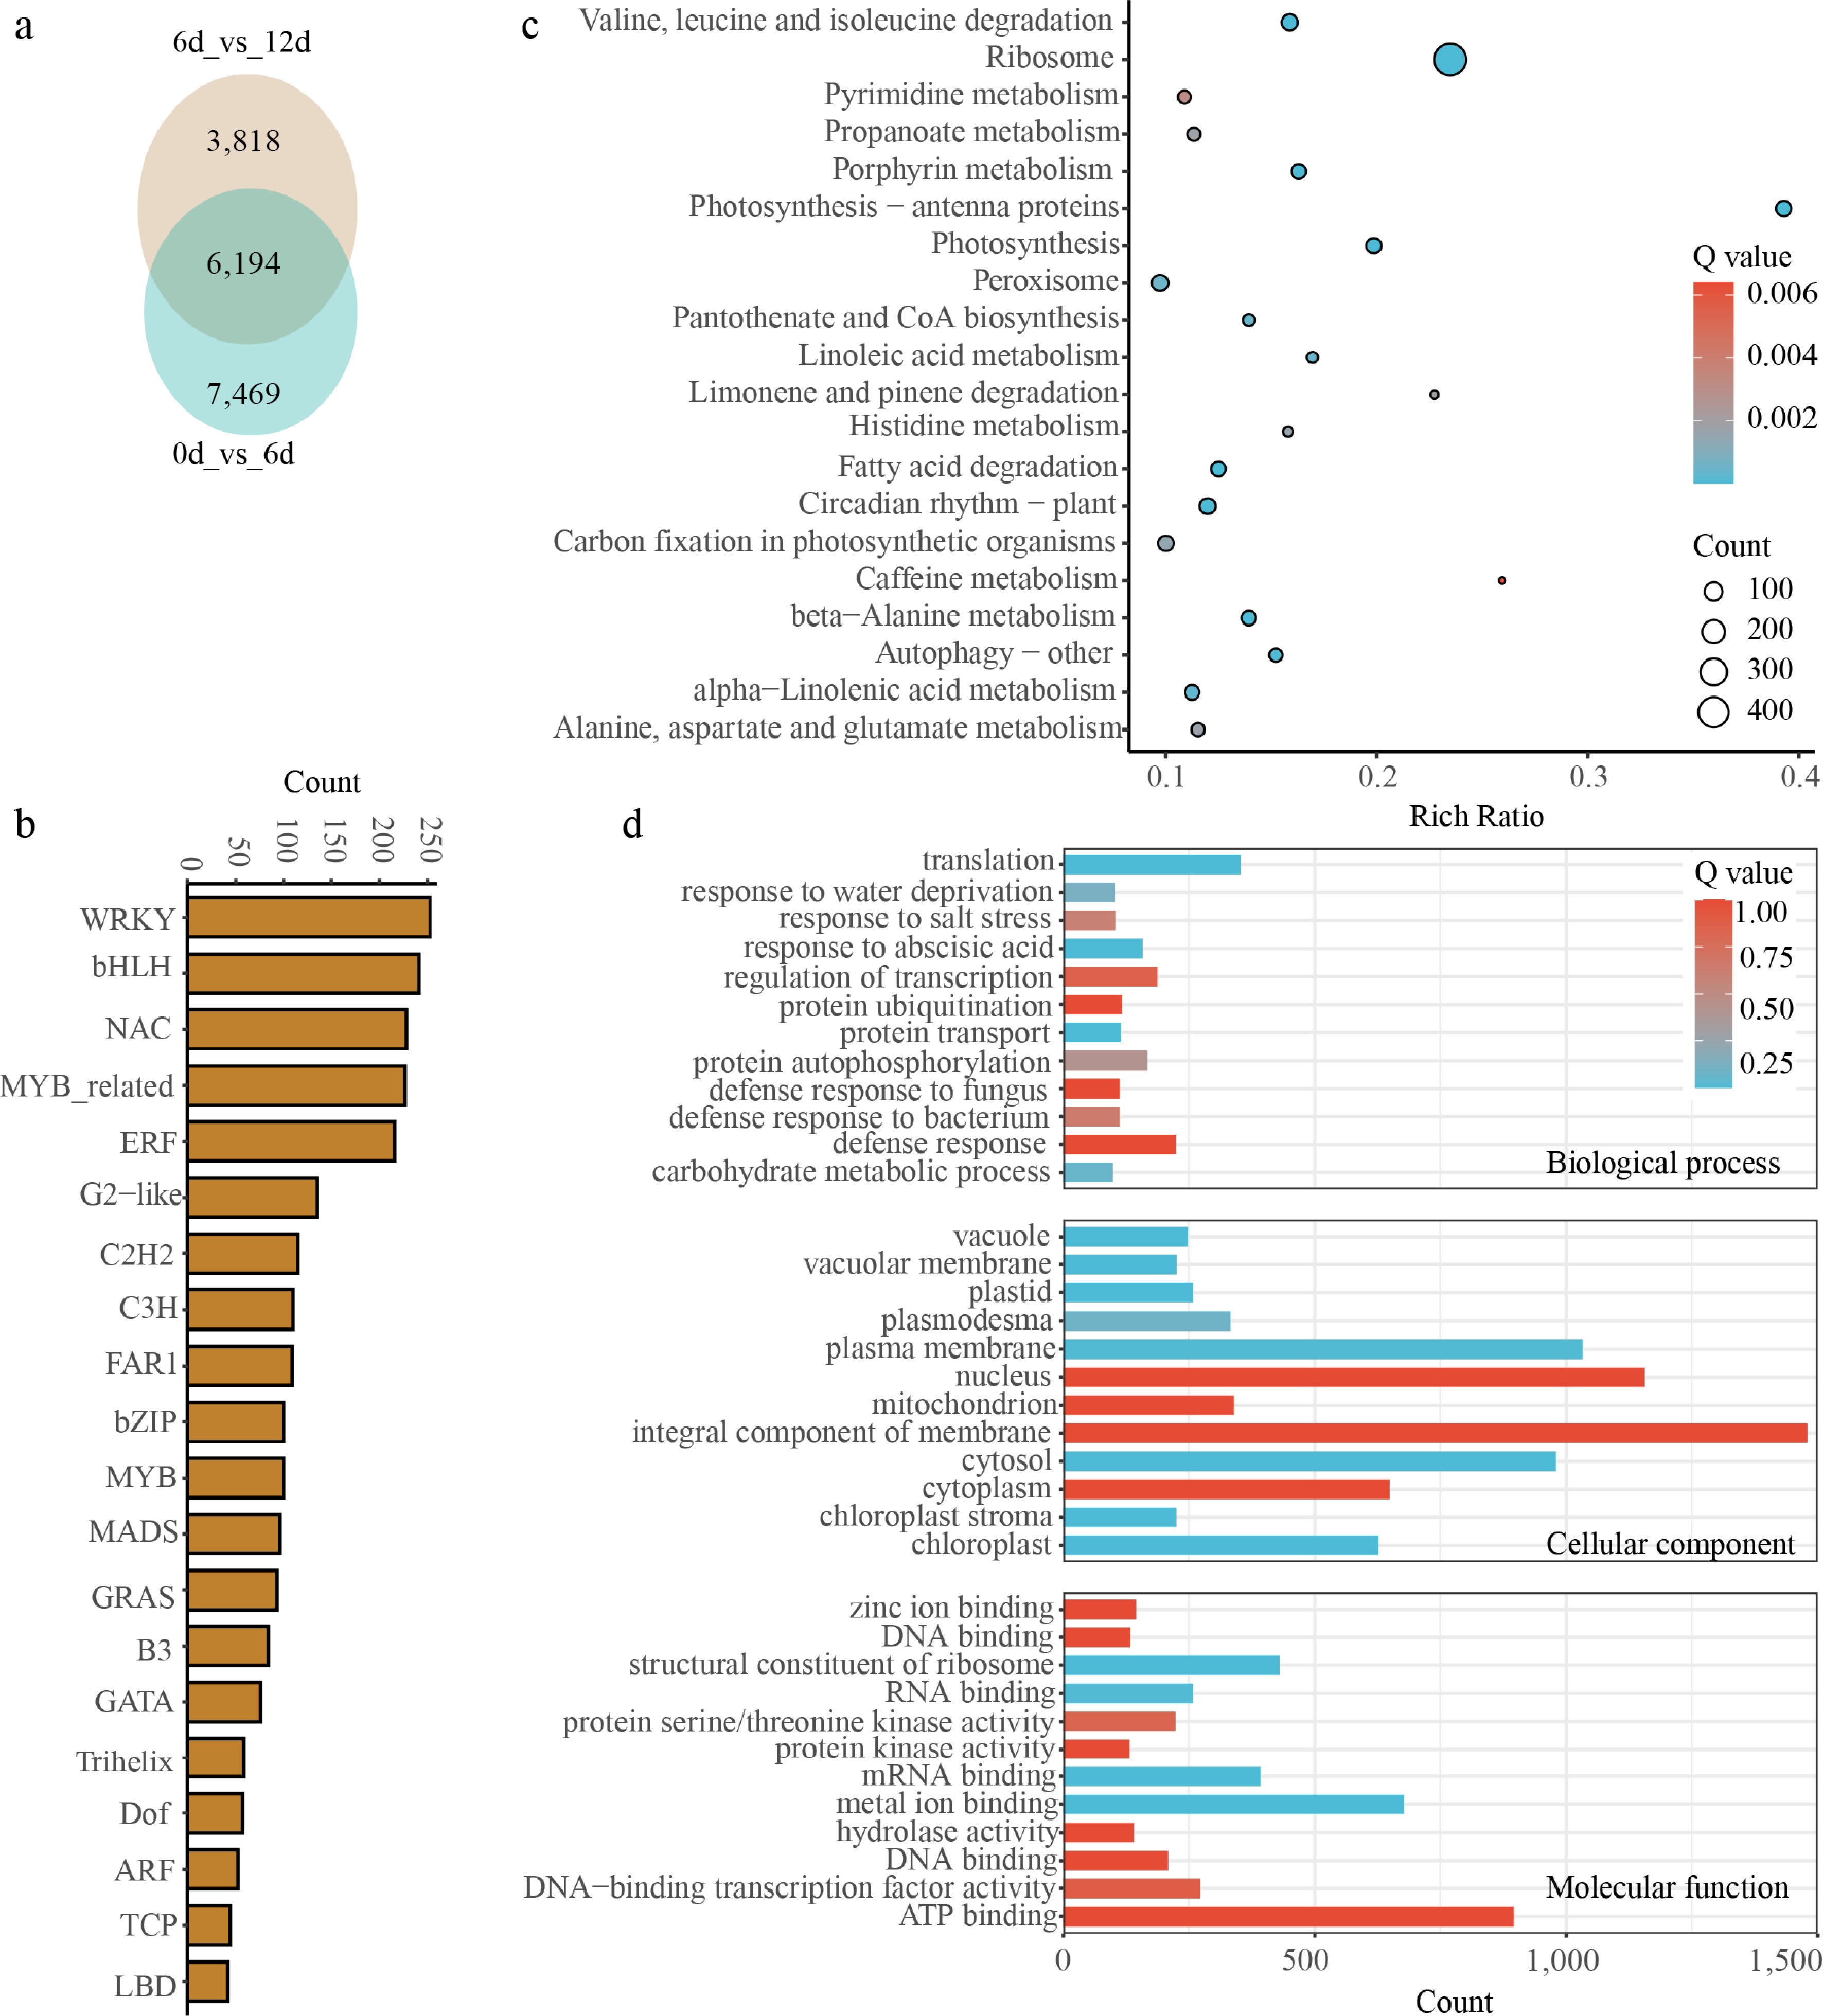
Figure 5.
Identification and functional analysis of the core senescence-associated gene set shared across early vase stages in chrysanthemum cut flowers. (a) Venn diagram showing the overlap of DEGs between the first (0 vs 6 d) and second (6 vs 12 d) early senescence stages. (b) Distribution of transcription factor (TF) families within the core shared DEGs. (c) KEGG pathway enrichment analysis of the core shared DEGs. The dot size represents the number of enriched genes, and the color represents the Q value (FDR-adjusted p-value). (d) GO enrichment analysis of the core shared DEGs, covering biological process, cellular component, and molecular function.
-
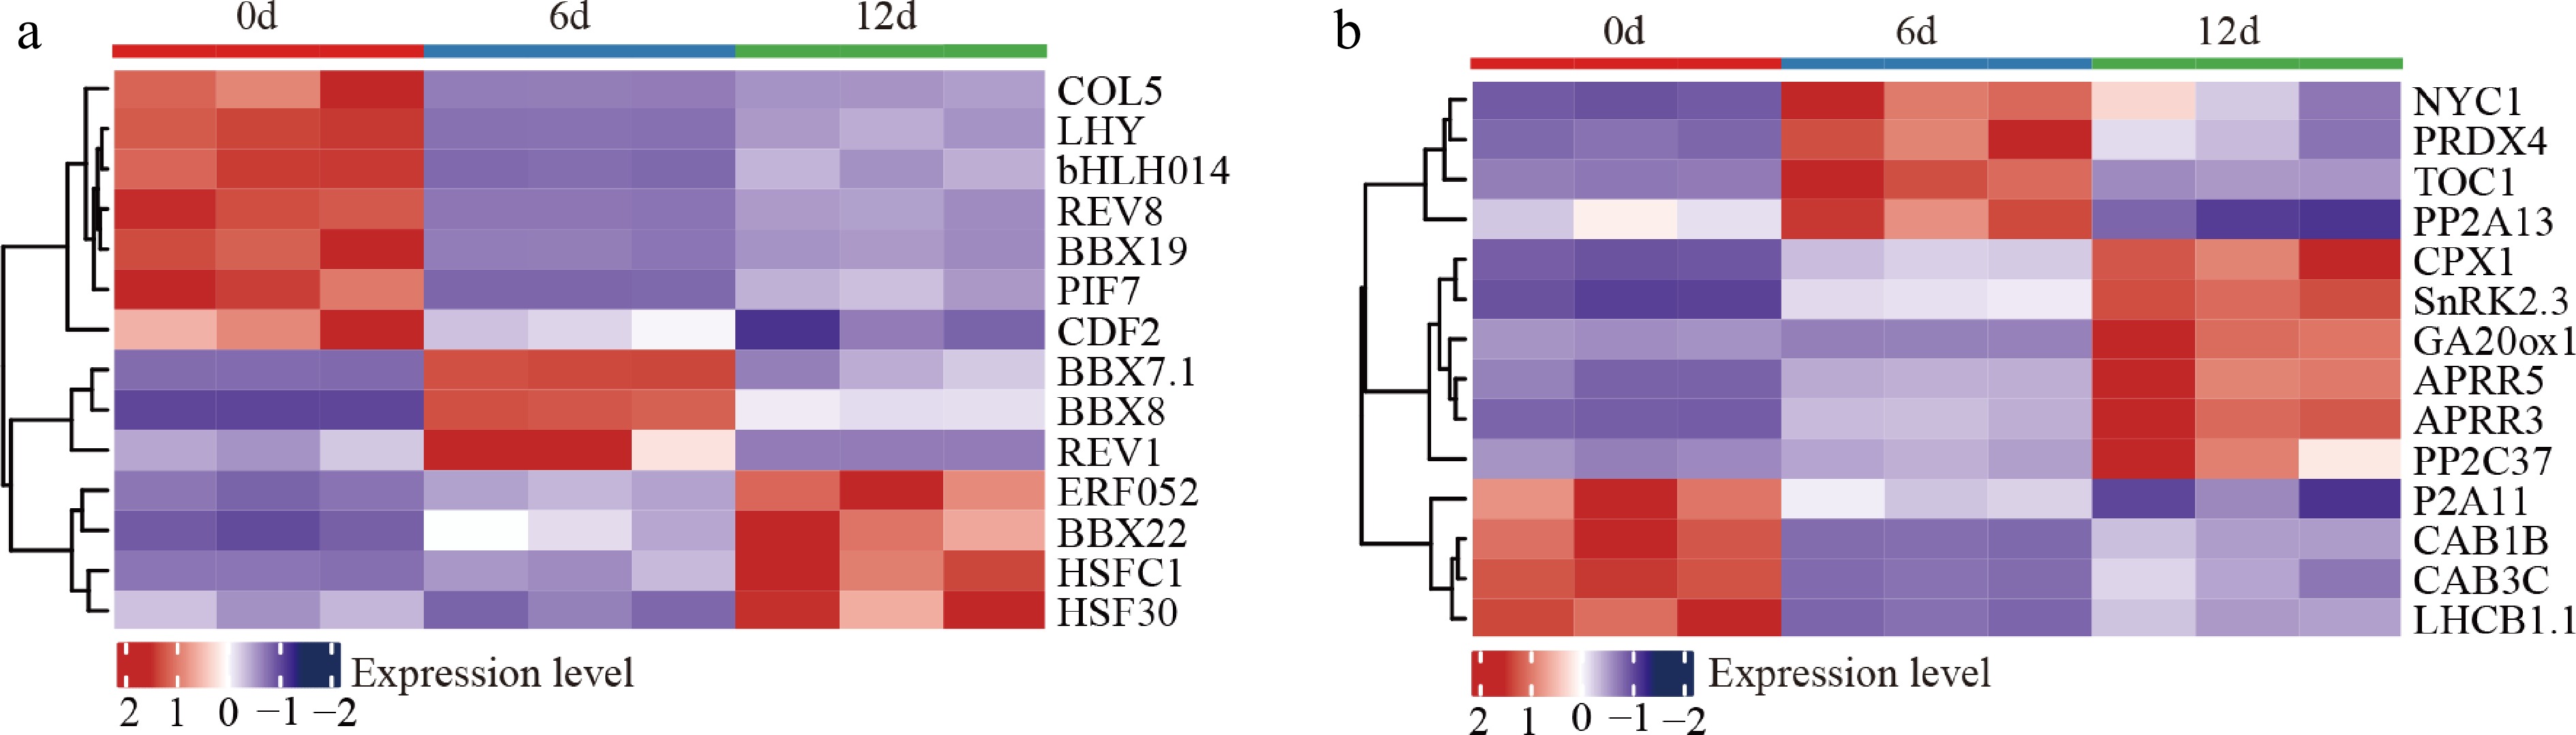
Figure 6.
Hierarchical clustering heatmap of the expression dynamics of core senescence-associated genes during vase treatment in chrysanthemum cut flowers. (a) Expression patterns of key transcription factors across 0, 6, and 12 d of vase life; (b) expression patterns of core functional genes. The color scale represents the z-score-normalized gene expression level, with red indicating high expression and blue indicating low expression.
-
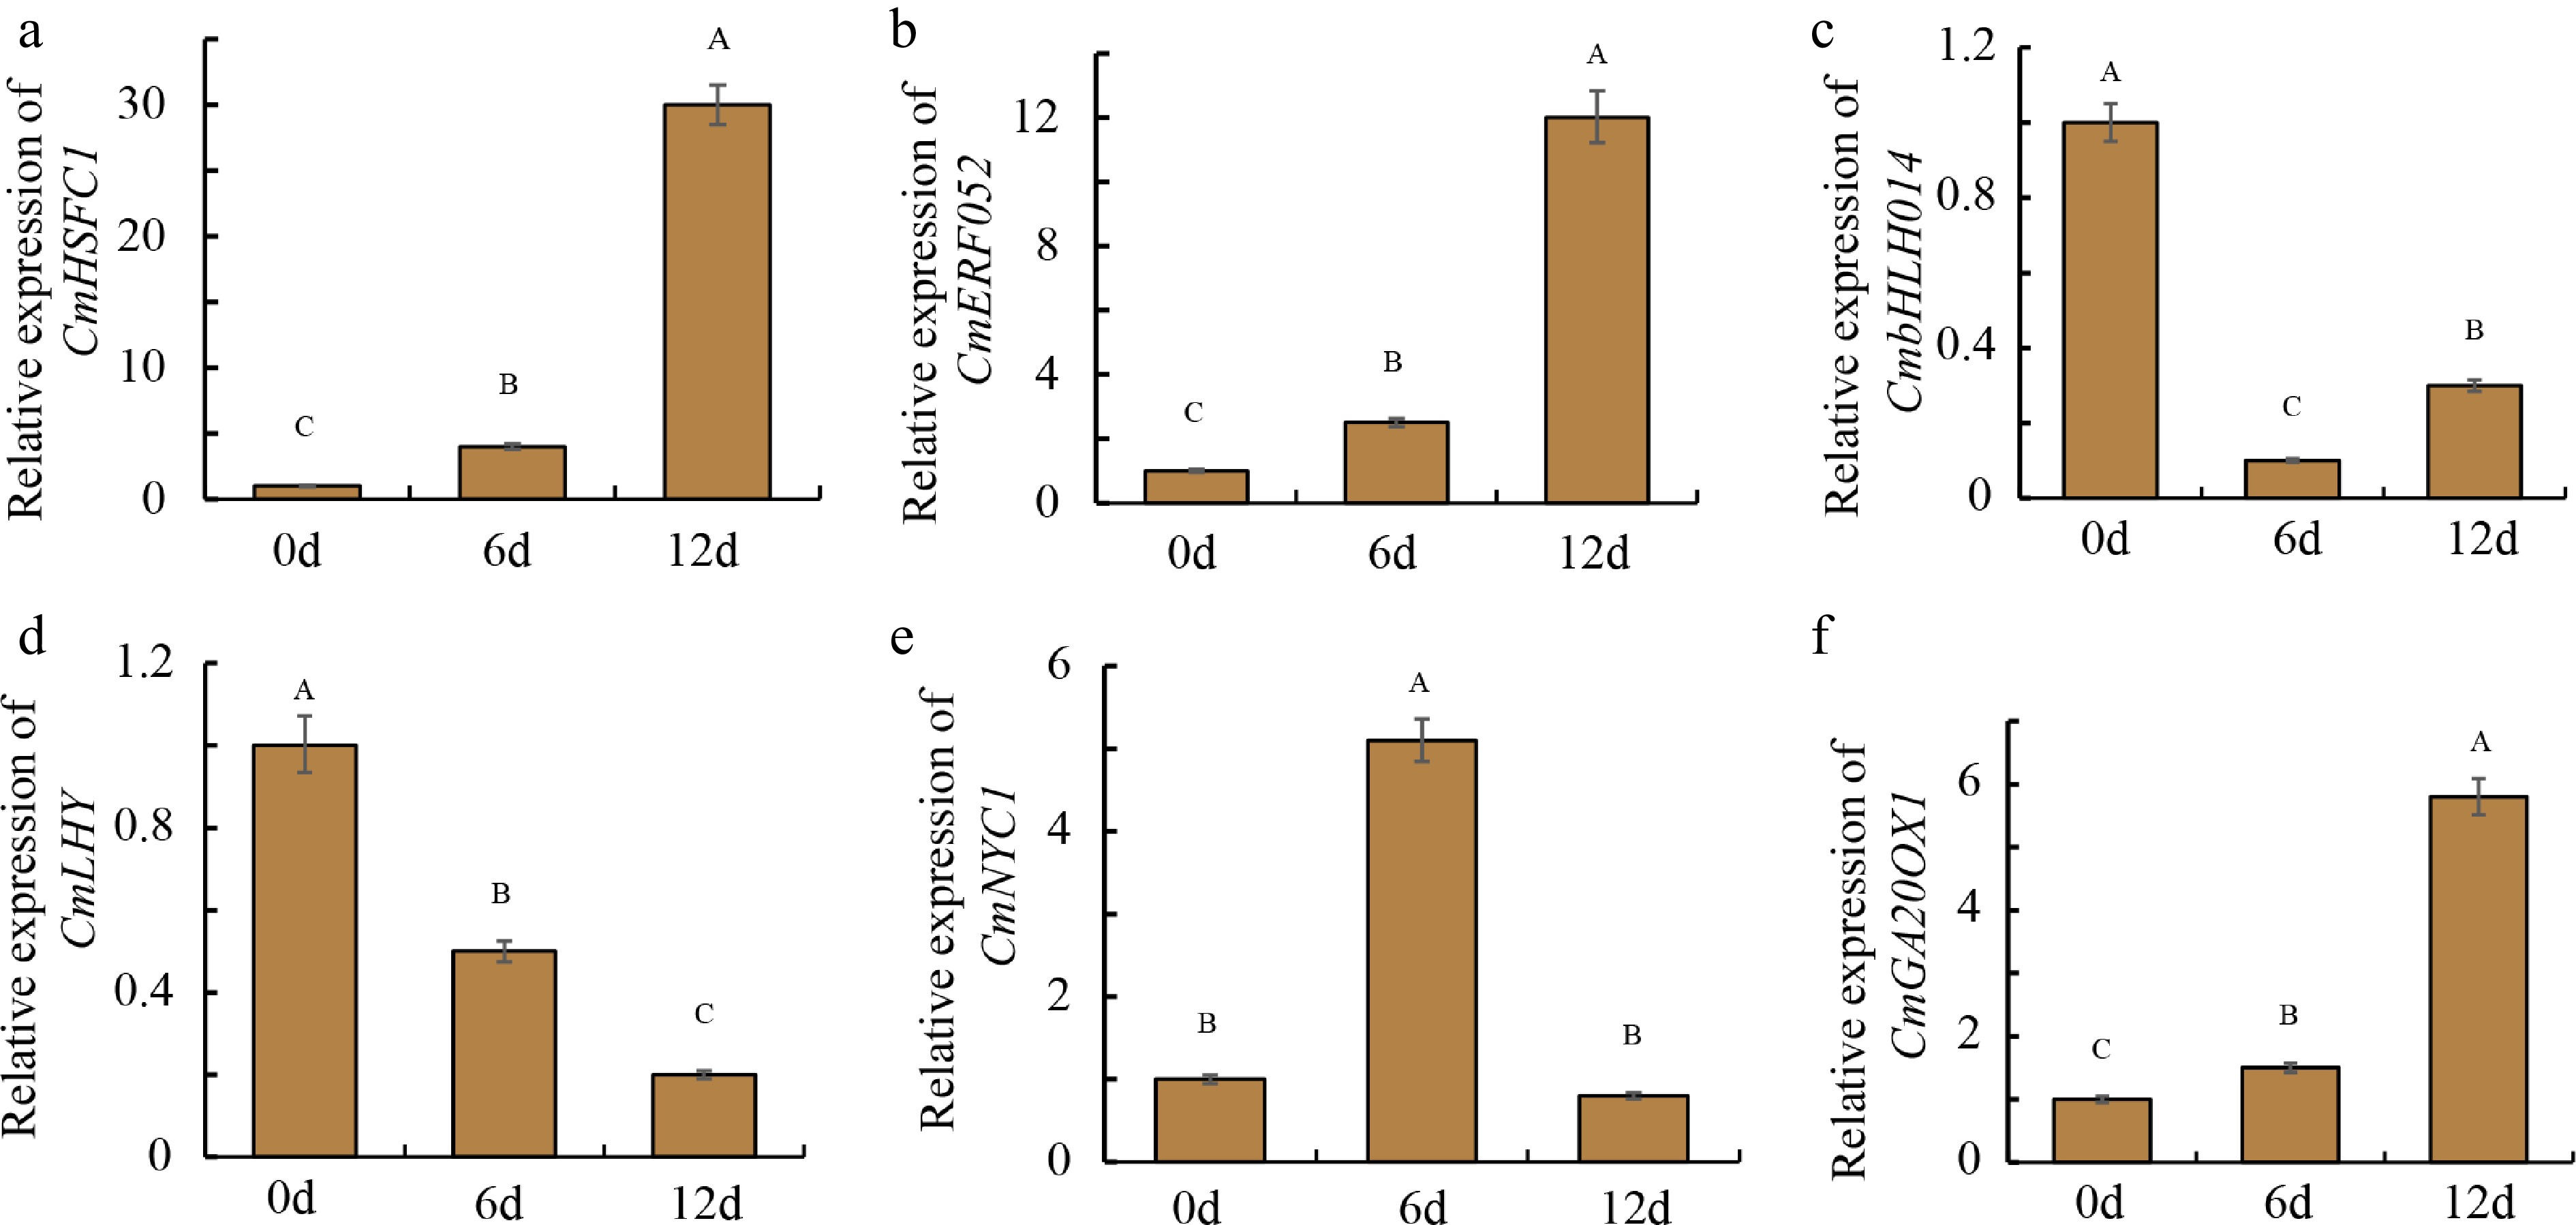
Figure 7.
qRT-PCR validation of the expression dynamics of six core senescence-associated genes during early senescence in chrysanthemum cut flowers. Error bars represent the standard error of three biological replicates. Different uppercase letters indicate significant differences at the p < 0.05 level.
-
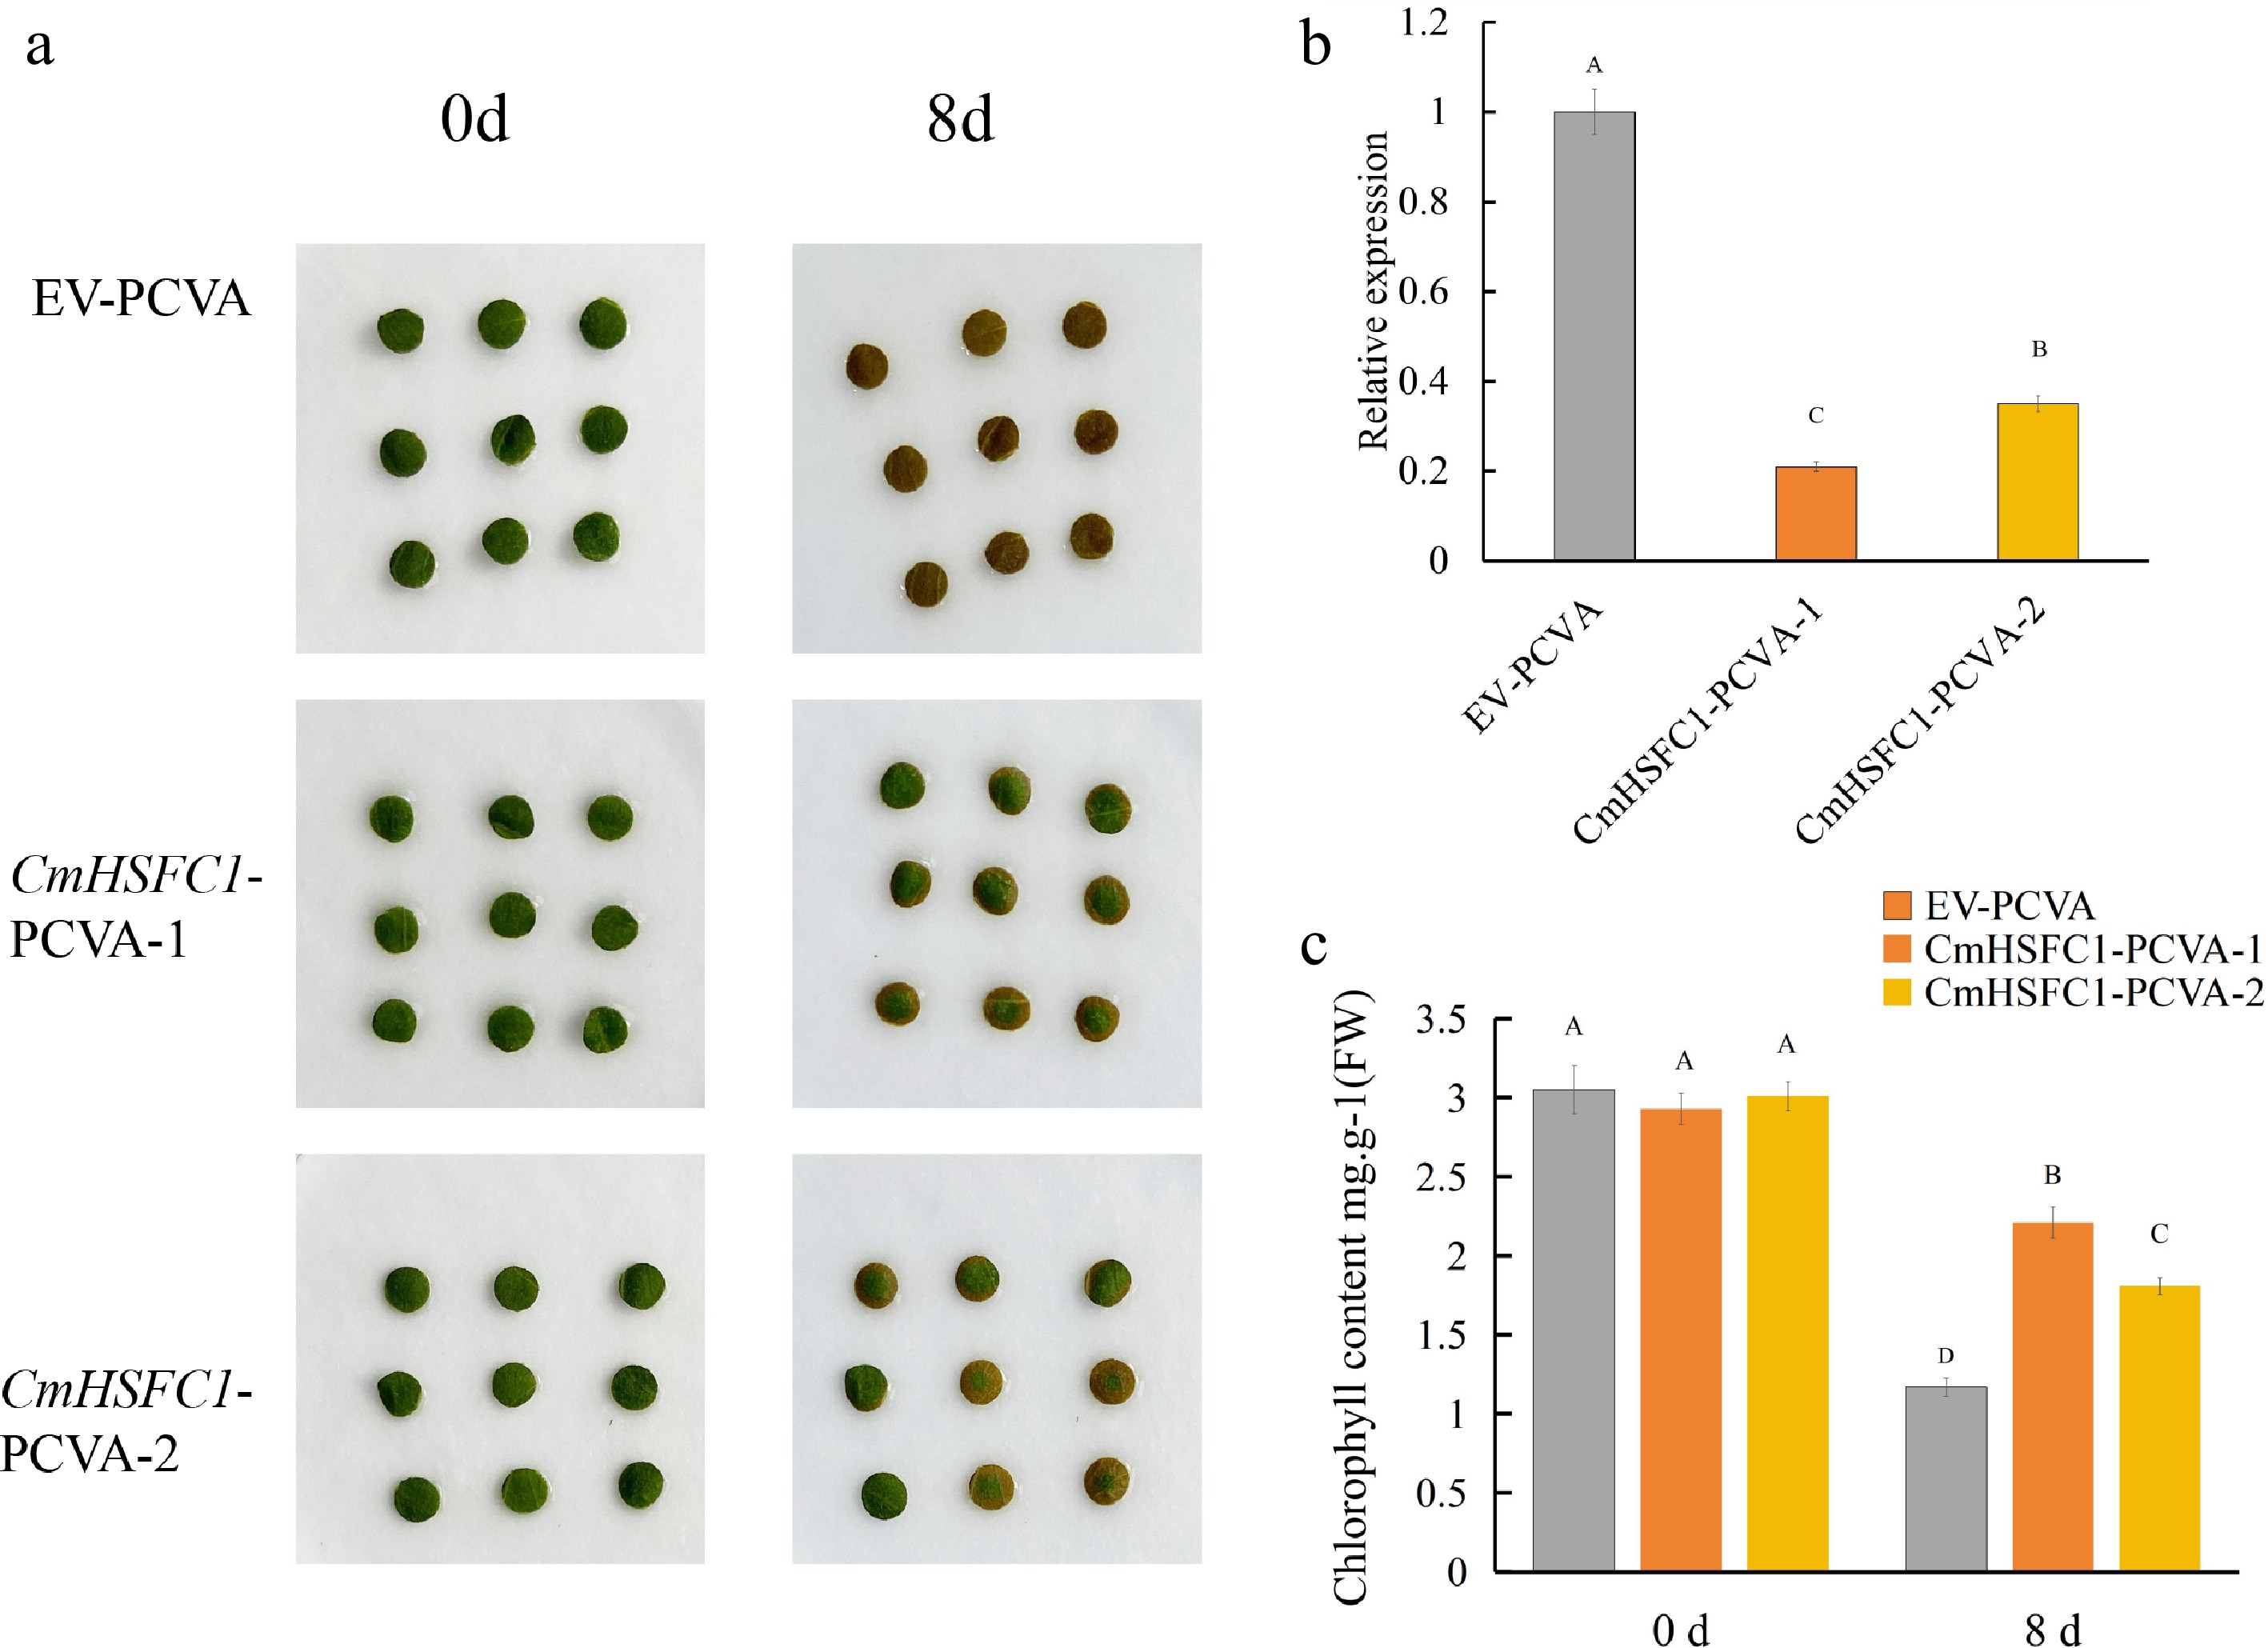
Figure 8.
Silencing of CmHSFC1 delays leaf senescence in chrysanthemum. (a) Phenotypic observation of leaf discs from CmHSFC1-silenced (CmHSFC1-PCVA-1, CmHSFC1-PCVA-2) and empty vector control (EV-PCVA) plants at 0 and 8 d of dark-induced senescence. (b) Relative expression level of CmHSFC1 in silenced and control lines, verified by qRT-PCR. (c) Chlorophyll content in leaf discs of silenced and control lines at 0 and 8 d of of dark-induced senescence. Data are presented as means ± SD (n = 3). Different uppercase letters indicate significant differences at the p < 0.05 level.
Figures
(8)
Tables
(0)