-
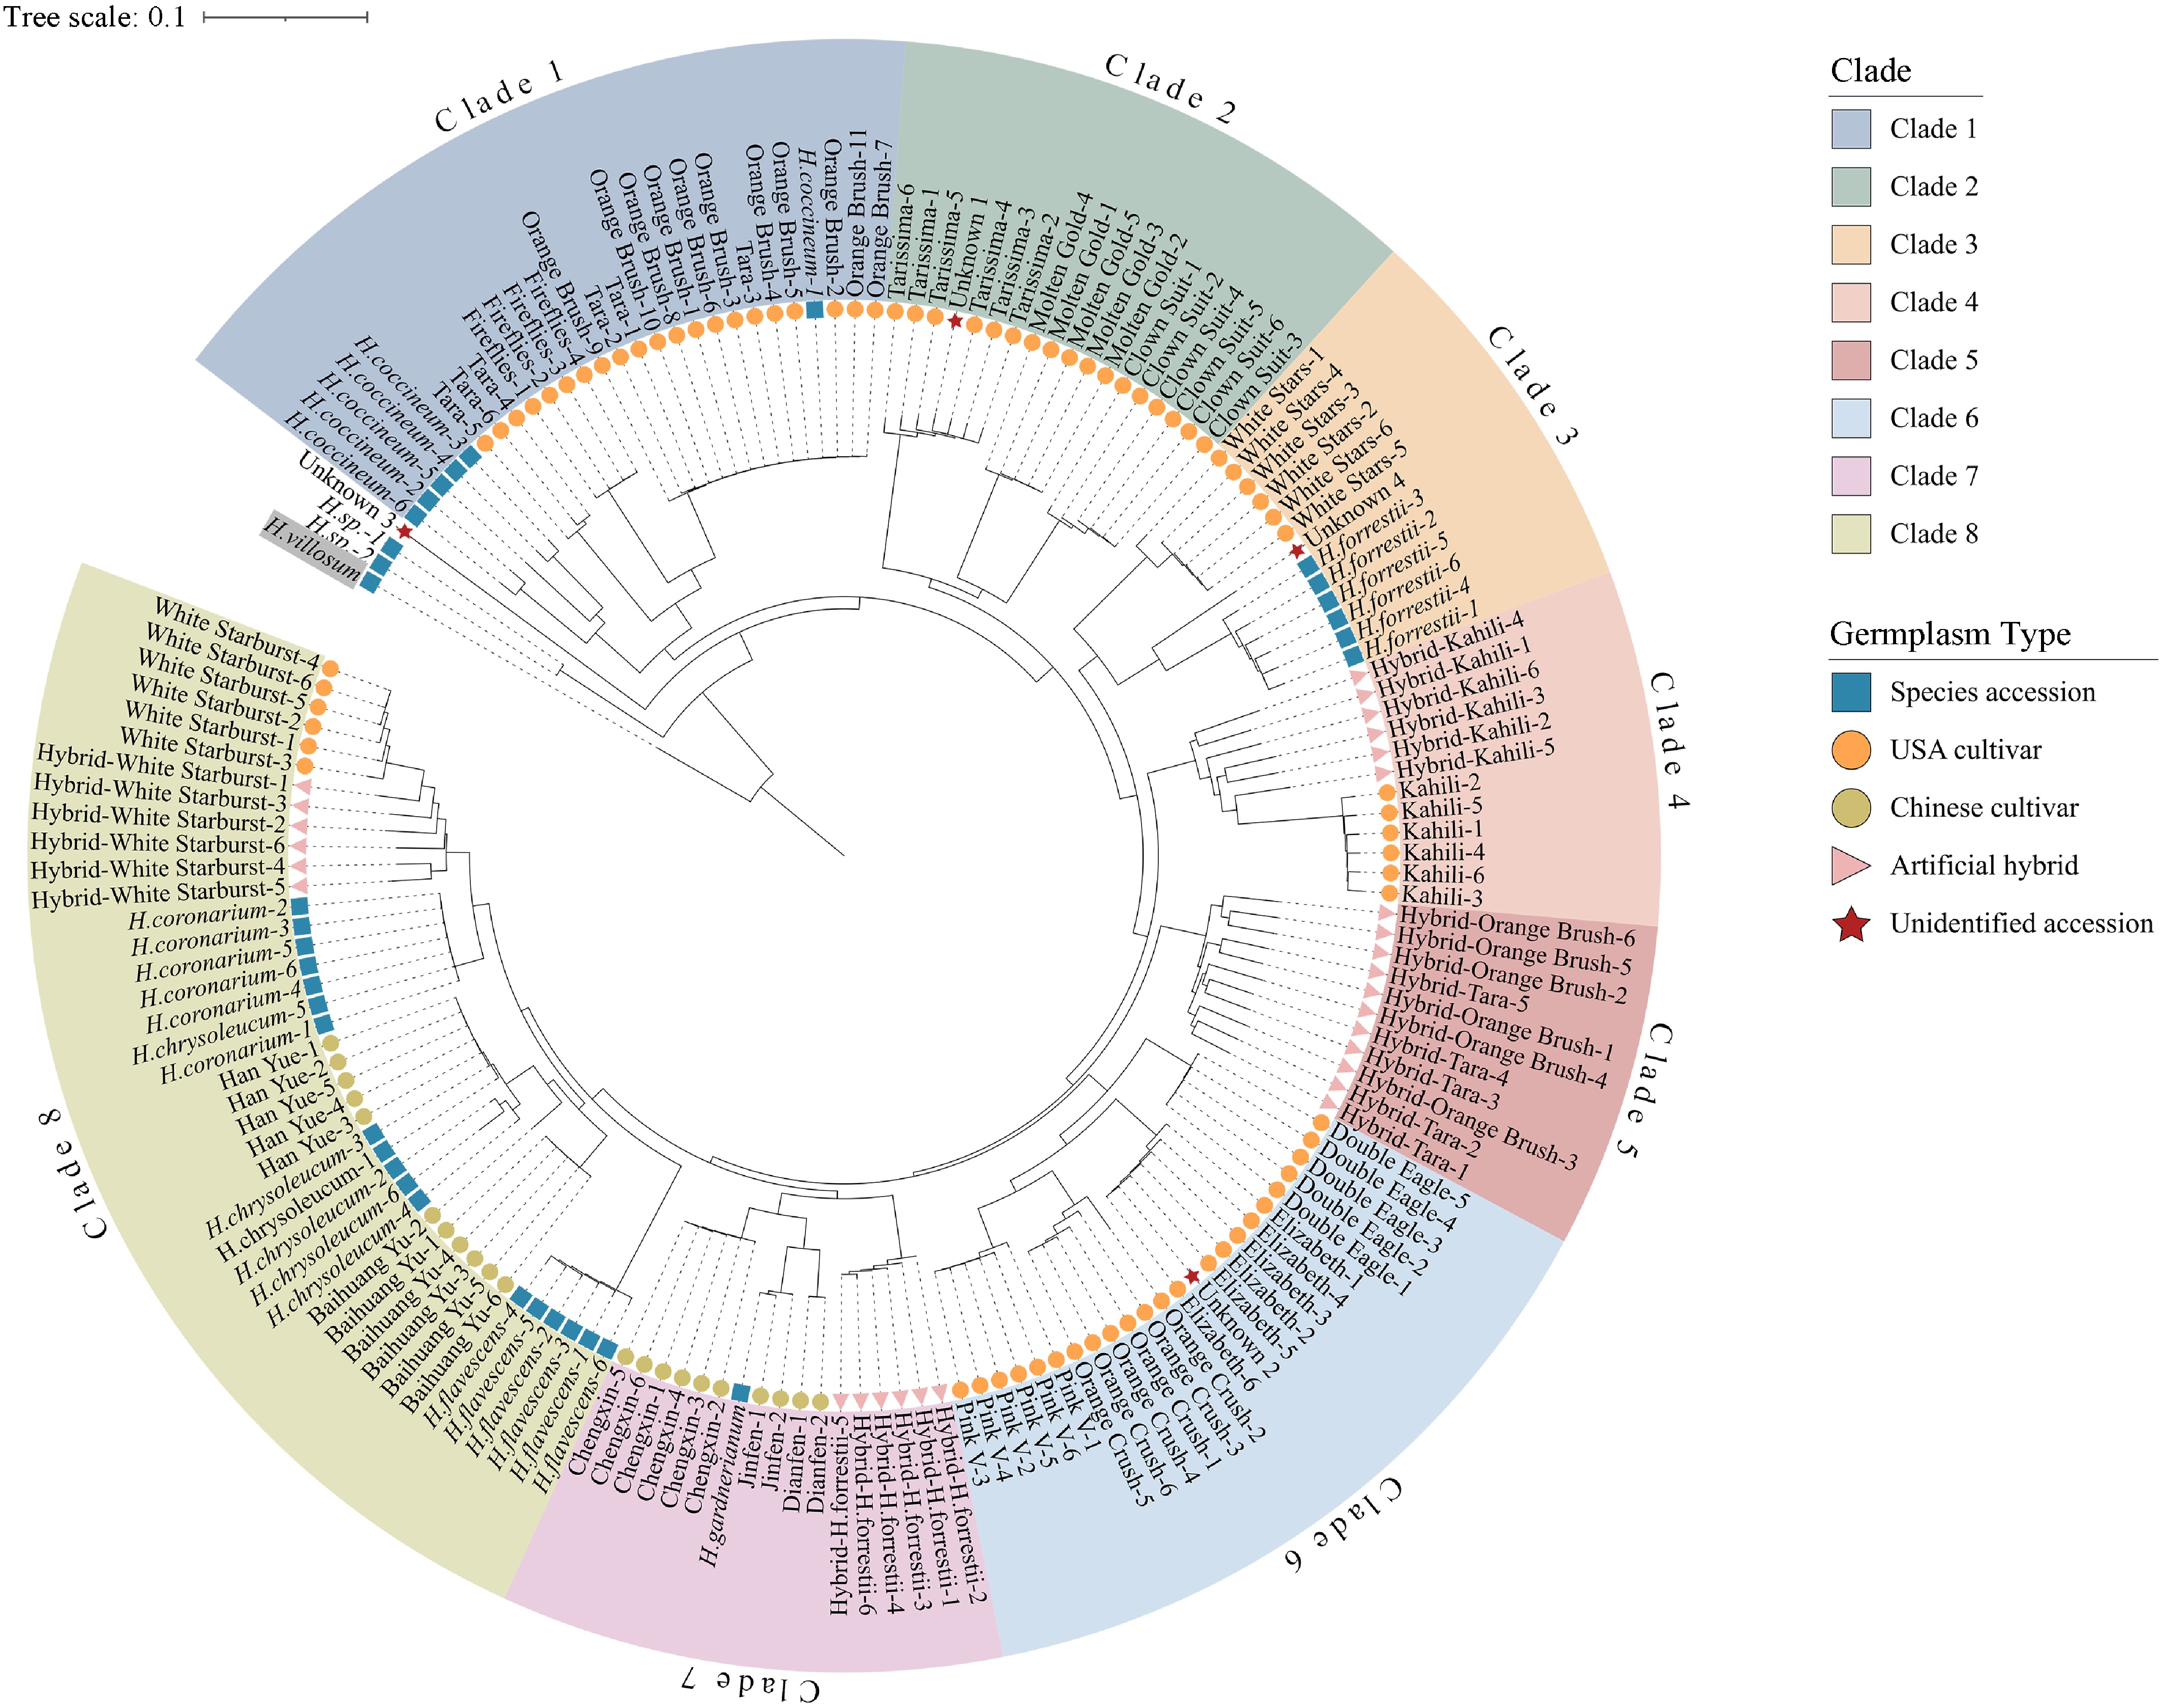
Figure 1.
Pruned NJ tree based on 647,693 high-quality SNPs. The original tree included 168 samples; Sample 30-6 was removed from the displayed topology, leaving 167 samples. The tree was rooted using H. villosum as a functional outgroup. Colors indicate the eight major clades.
-
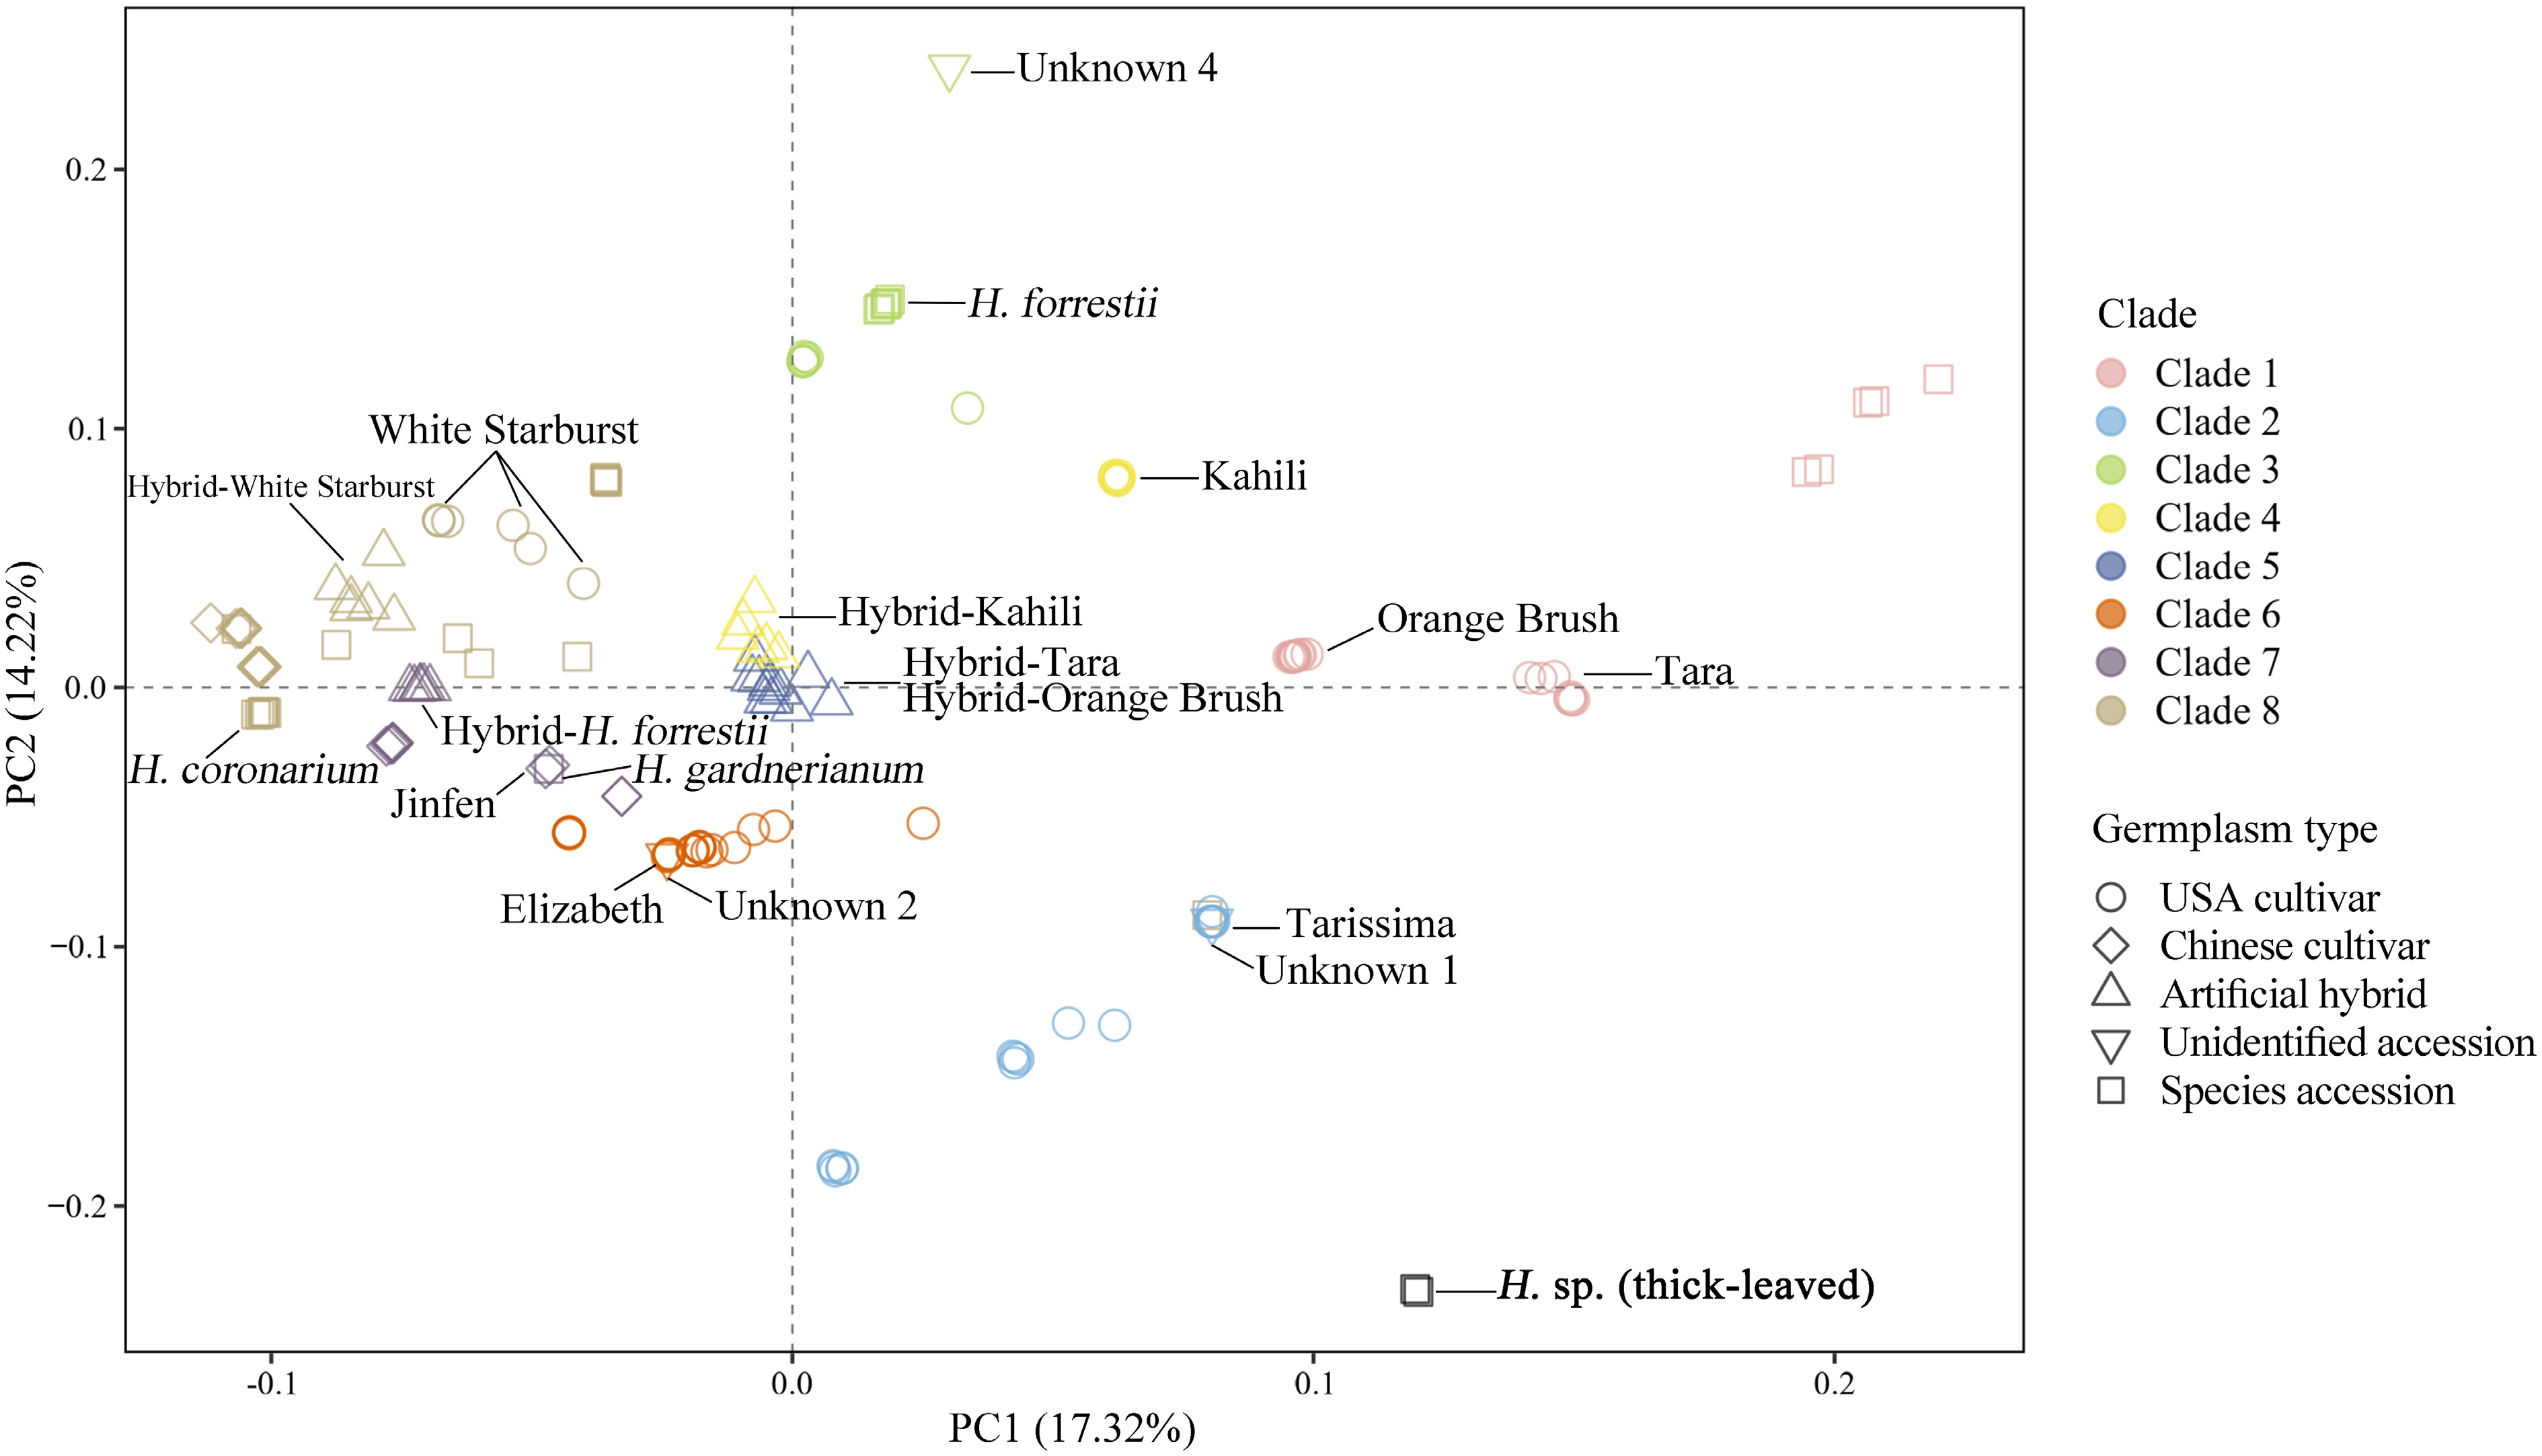
Figure 2.
PCA of 165 samples based on 265,365 SNPs after LD pruning. Colors indicate clades, and the shapes indicate germplasm types.
-
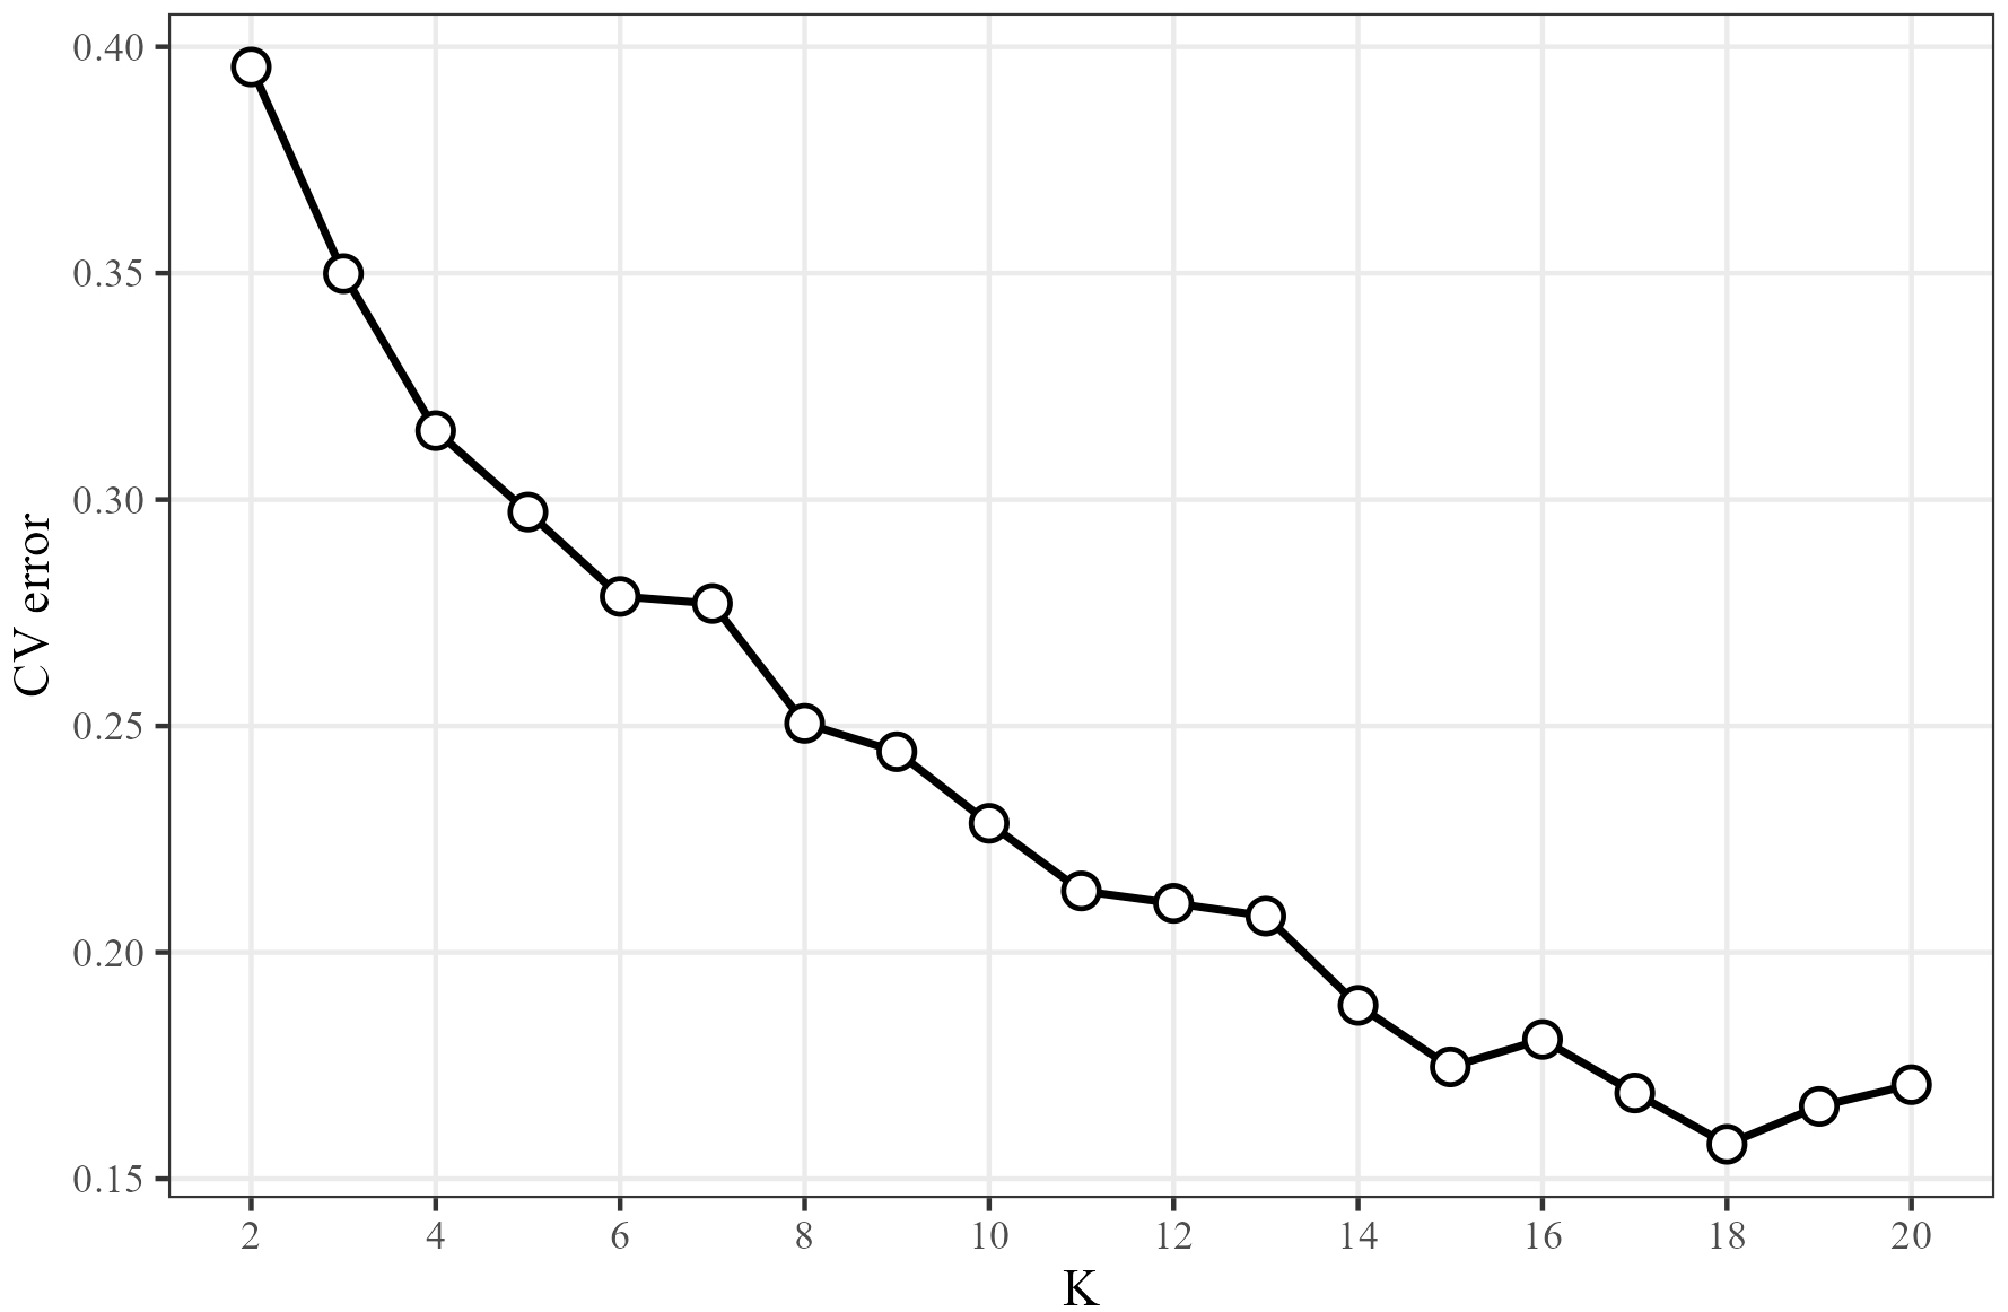
Figure 3.
CV error for different values of K.
-
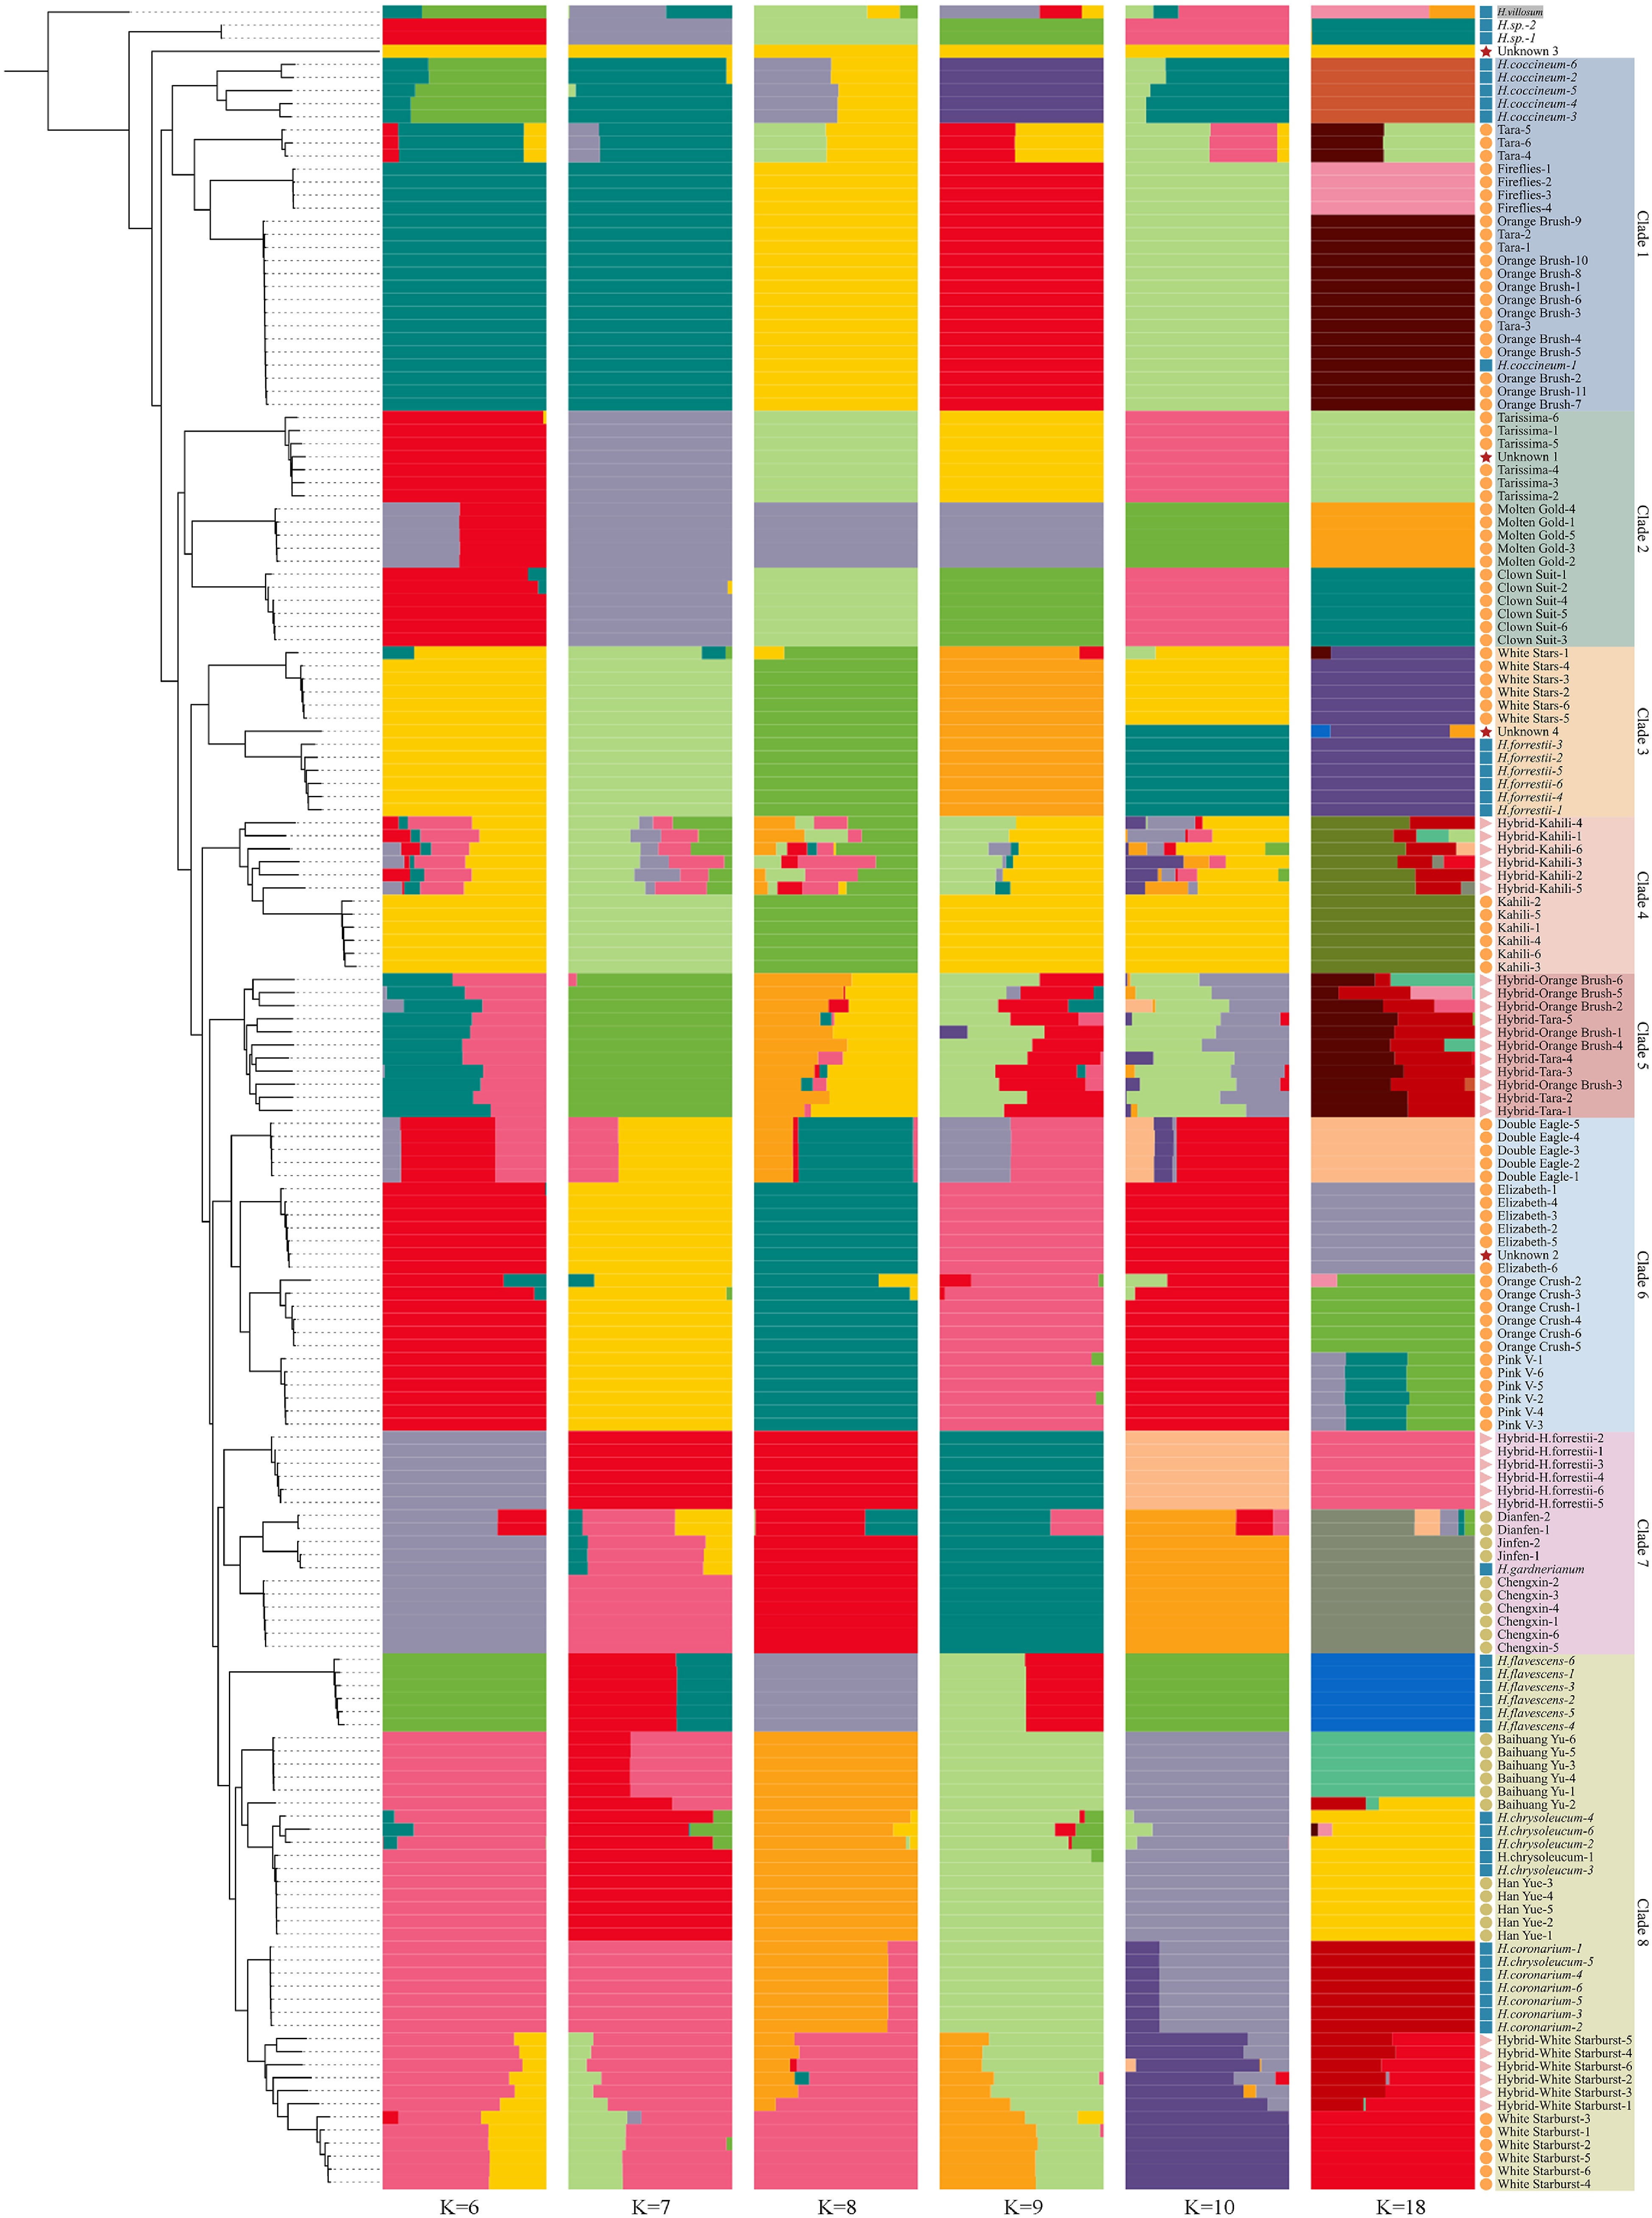
Figure 4.
Admixture results of the 167 Hedychium samples based on 265,365 SNPs after LD pruning. Results for K = 6, 7, 8, 9, 10, and 18 are shown. The sample order follows the NJ tree.
-
P1 P2 P3 D Z-score p-value H. coccineum H. gardnerianum 'Molten Gold' 0.719 20.652 < 0.001 H. forrestii H. coronarium 'Molten Gold' 0.766 12.117 < 0.001 H. coronarium H. gardnerianum 'Fireflies' 0.468 6.578 < 0.001 H. coronarium H. coccineum 'Fireflies' 0.640 10.330 < 0.001 H. chrysoleucum H. coronarium 'White Starburst' 0.356 6.933 < 0.001 H. coronarium H. gardnerianum 'Orange Brush' 0.630 12.761 < 0.001 H. coronarium H. gardnerianum 'Tara' 0.604 11.966 < 0.001 H. forrestii H. coronarium 'Tarissima' 0.552 8.848 < 0.001 Note: Positive D-values indicate excess allele sharing between P3 and P2 relative to P3 and P1 under the reported Dsuite configuration. Significant results were defined as |Z| > 3. These results indicate significant asymmetric allele sharing and should not be interpreted as direct estimates of parental contribution. Table 1.
Representative D-statistic tests showing significant asymmetric allele sharing among selected Hedychium accessions.
-
Unknown accession Compared reference No. of paired tests D profile correlation Mean |ΔD| Median |ΔD| Unknown 1 'Tarissima' 441 0.983439 0.033351 0.027903 Unknown 2 'Elizabeth' 426 0.971047 0.027970 0.017218 Unknown 4 H. forrestii 415 0.966883 0.038125 0.028380 Note: Paired tests were defined as D-statistic tests in which the unknown accession and the compared reference accession occupied the same position in the four-taxon configuration, with the other two taxa identical and in the same order. D profile correlation represents the Pearson correlation between paired D-values. Mean |ΔD| and median |ΔD| indicate the absolute differences between paired D-values. These metrics were calculated from the complete D-statistic result set and were used as descriptive measures of D-statistic profile similarity rather than formal tests of accessions' identity. Detailed paired D-statistic comparisons for Unknown 1, Unknown 2, and Unknown 4 are provided in Supplementary Tables S6, S7, and S8, respectively. Table 2.
D-statistic profile comparisons between unknown accessions and their closest reference accessions.
Figures
(4)
Tables
(2)