-
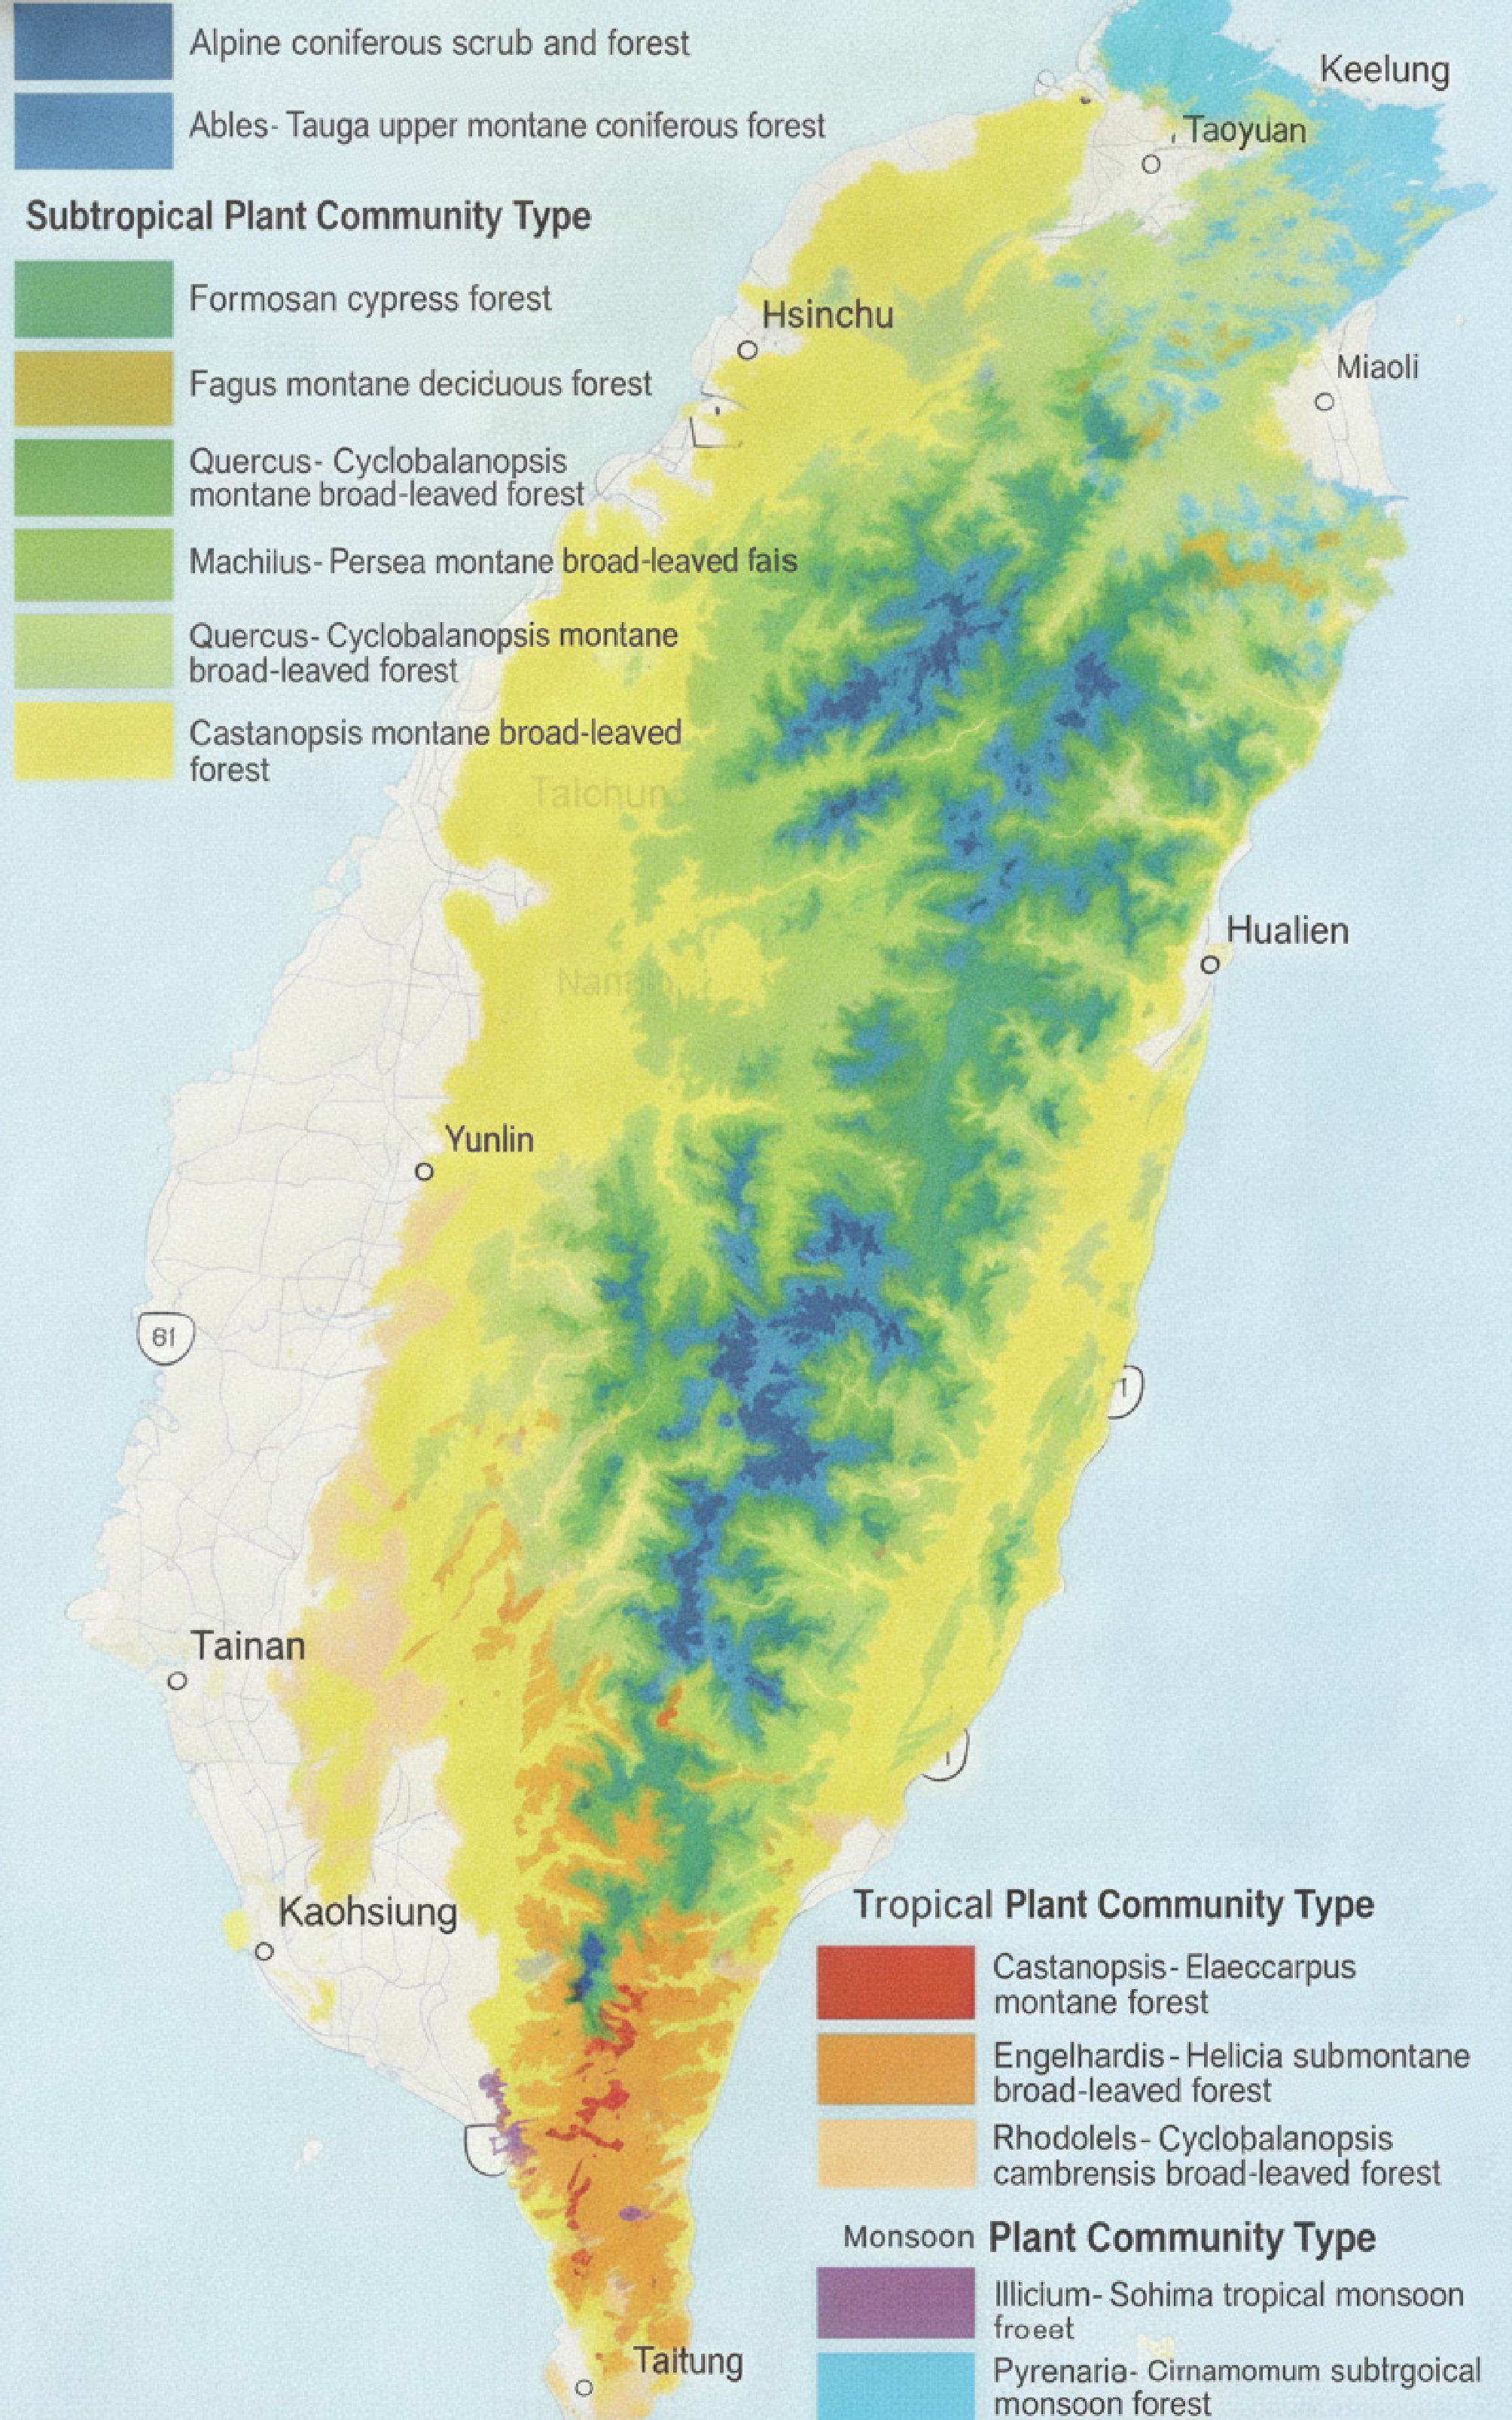
Figure 1.
Distribution of major forest vegetation in China's Taiwan region[4].
-
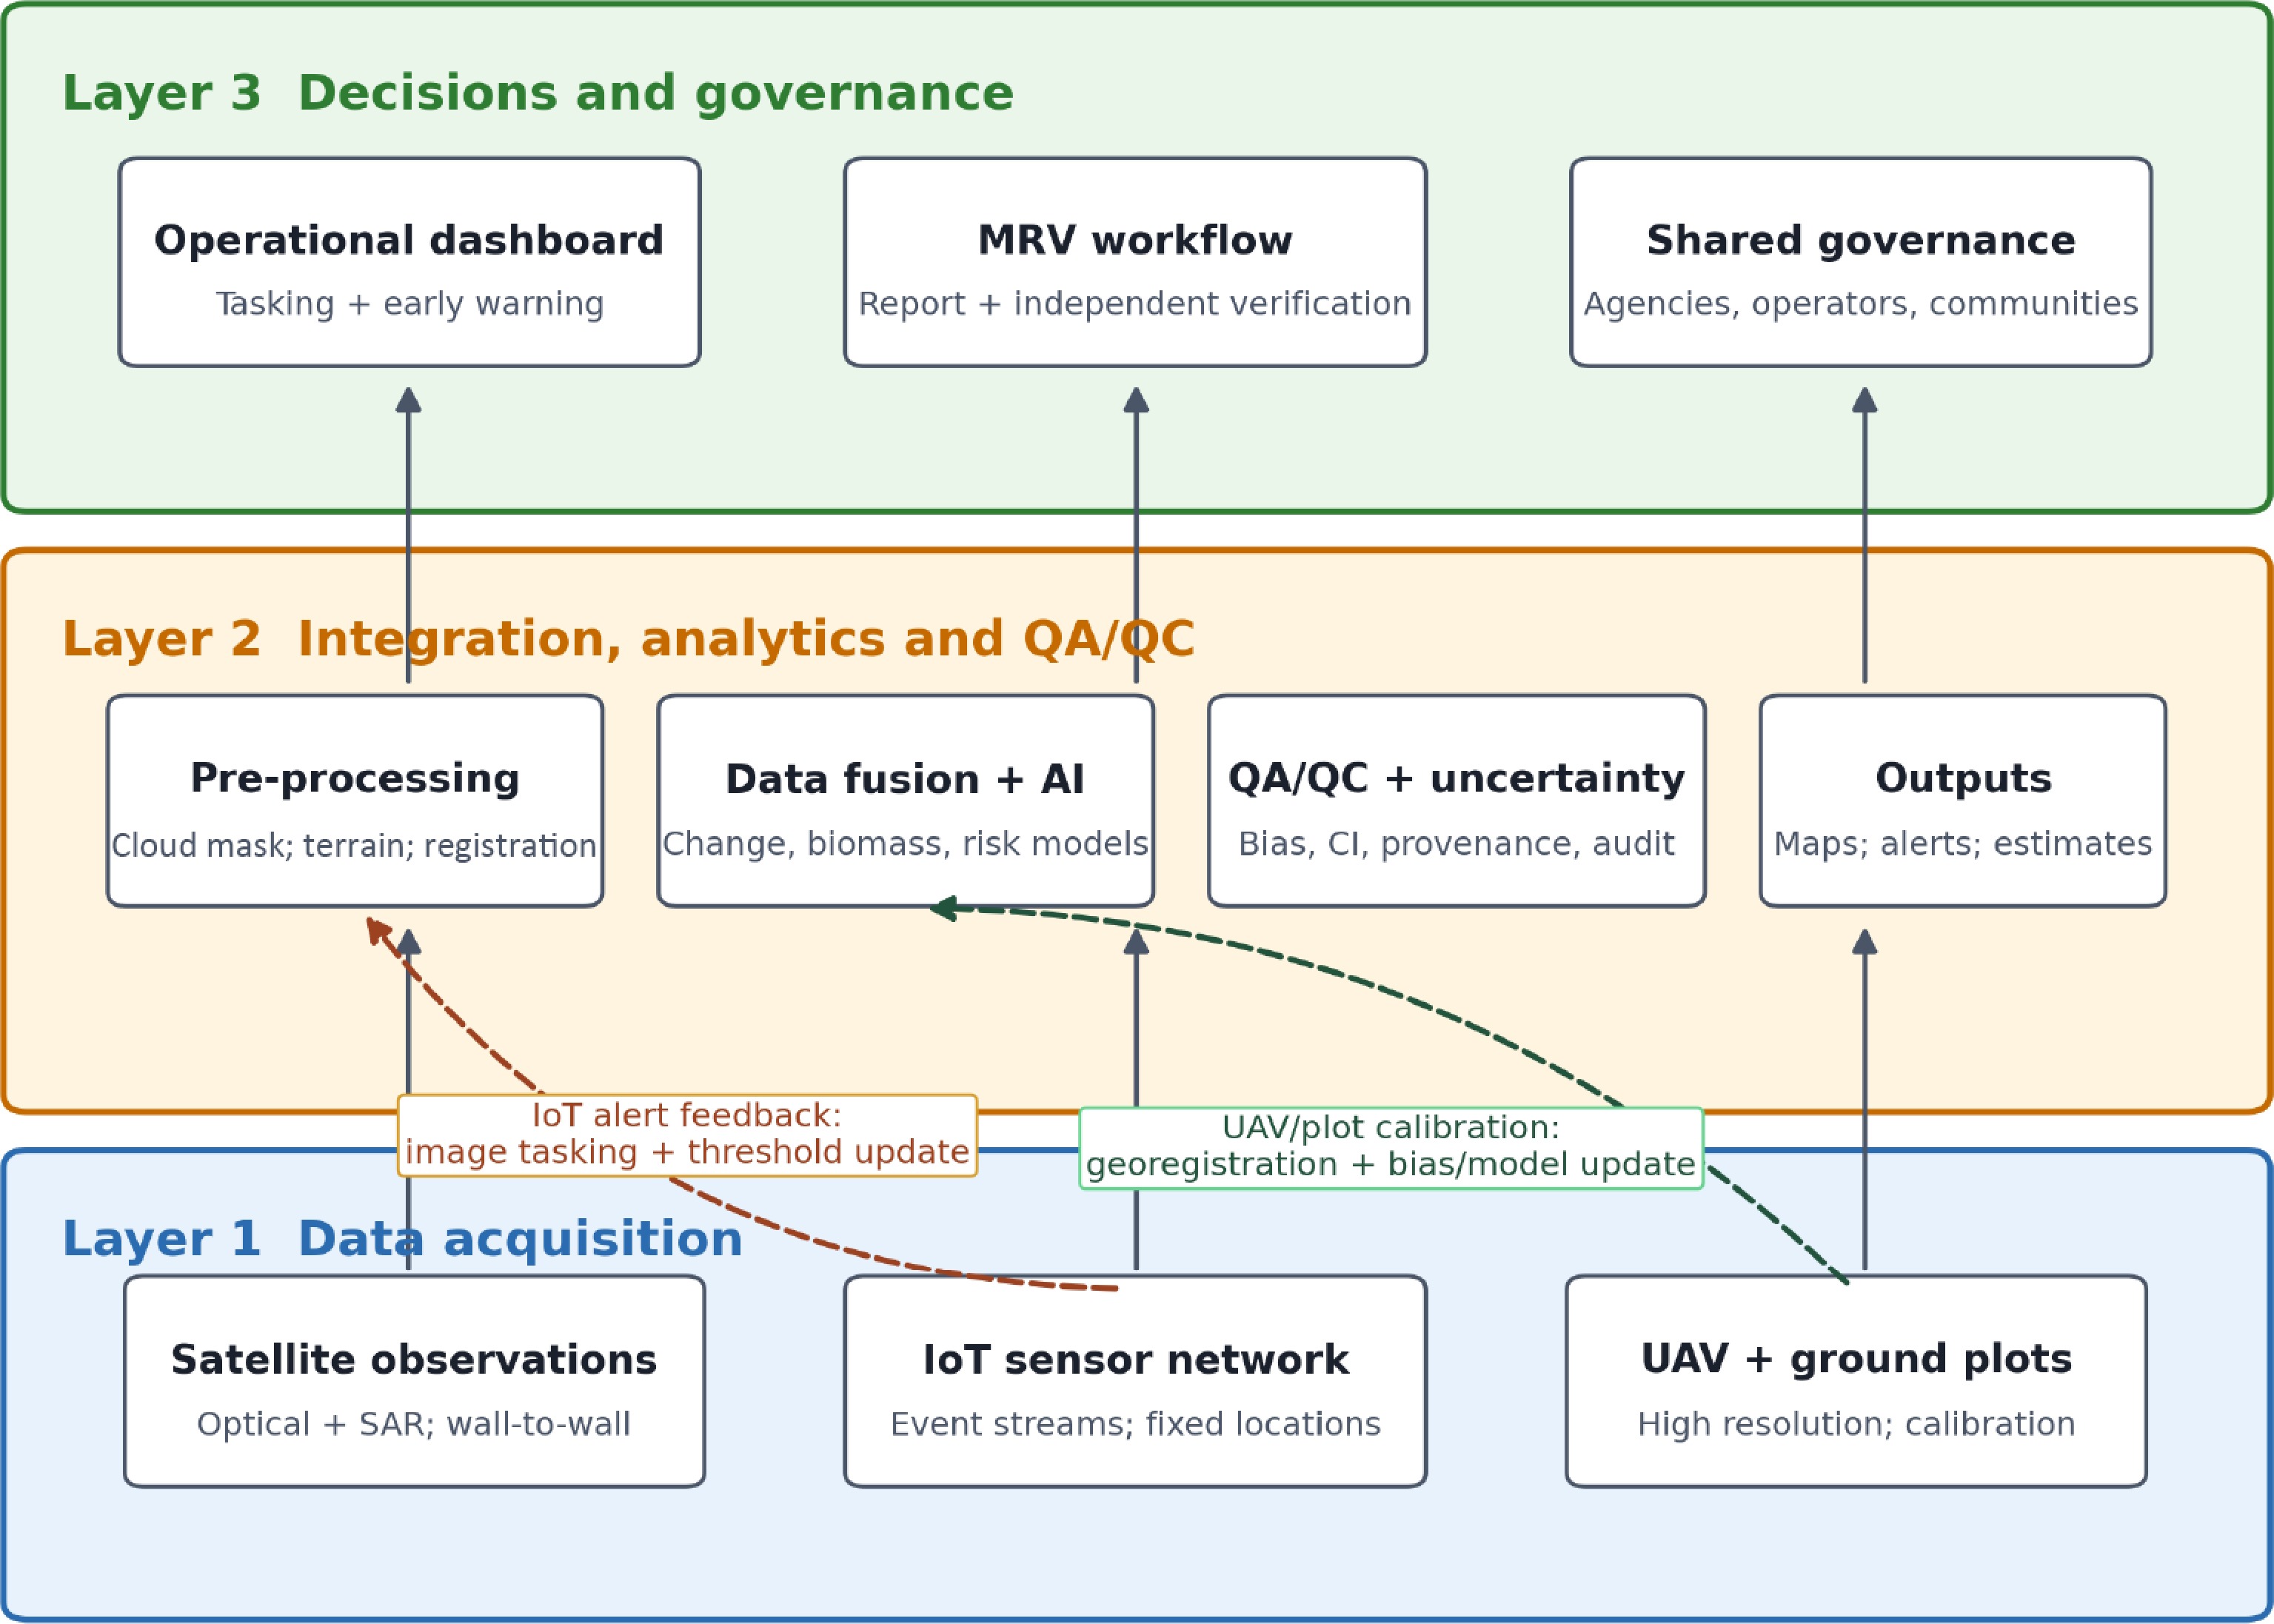
Figure 2.
Integrated three-layer smart-forestry framework with operational and calibration feedback.
-
Region Dominant trajectory Strength Constraint/transferable lesson Europe and North America Sequential: Plot inventories → remote sensing/LiDAR → AI and operational services Long validation heritage Interoperability and user uptake remain uneven; retain plot-based calibration[6,12,13] Japan and South Korea Policy- and sector-led integration of machinery, remote sensing, and disaster analytics Public-program alignment Terrain and workforce constraints favor targeted automation and shared infrastructure[14,15] Southeast Asia Project-based national inventories and remote-sensing platforms Rapid coverage of heterogeneous forests Connectivity and institutional capacity require open tools and regional training[16] China's Taiwan region Parallel pilots of satellite/NTN IoT, UAVs, and AI Fast functional complementarity Cloud, relief, fragmented data governance, and limited field benchmarks require staged validation Patterns are nonexclusive interpretive syntheses, not rankings. Table 1.
Interpretive comparison of regional smart forestry deployment patterns.
-
Case Pathway and inclusion basis Evidence used Enterprise internal test indicators Validation boundary A AI/natural asset carbon software; documented partnerships Public corporate/partner/
policy + EID-AAccuracy/F1; processing; coverage; carbon error; cost No independent audit; market share and MRV compliance were unverified B Third-generation partnership project (3GPP) NTN/IoT connectivity; institutional pilot Public corporate/partner/
government + EID-BAccuracy/F1; latency; sensor coverage; cost; staffing No common-site replication; interoperability unverified C Fixed-wing composite UAVs; mature commercial hardware Public corporate/
certification + EID-CAccuracy/F1; area per flight; efficiency; carbon error; cost No common-site replication or independent audit EID-A, EID-B, and EID-C denote confidential enterprise-provided internal datasets for Cases A–C. Aggregated results are reported; proprietary underlying records are withheld. A coded source register can be supplied to the editor under confidentiality. Table 2.
Case selection and evidence register.
-
Metric Case A: AI classification Case B: IoT monitoring Case C: UAV survey Primary task Vegetation species classification Environmental anomaly detection Aerial forest mapping Measured overall accuracy 88.0%–93.2% 89.5%–92.5% 86.2%–91.7% Measured F1 score 0.91 0.86 0.90 Processing / transmission speed 2.4 frames/s (satellite imagery) 15-s sensor-to-cloud latency 120 ha/flight hour Coverage per unit 500 ha/satellite scene 200 ha/sensor-node cluster 120 ha/fixed-wing flight Enterprise-reported improvement +38% accuracy vs. traditional remote sensing 72% lower data latency vs. manual survey 8.5× survey efficiency vs. ground survey Observed operational limitation 25% cloud-affected data loss Sensor-node battery degradation Mountain flight restrictions Source: Confidential internal data from the enterprises, EID-A, EID-B, and EID-C, were supplied to the authors. Values are enterprise-reported field test results and were not independently audited; the protocols were not standardized across cases. These indicators are descriptive and noncomparative; they were produced under different test conditions and should not be read as a direct performance ranking among the three pathways. Table 3.
Enterprise-provided field test performance results for the three cases.
-
Performance dimension Case A: AI + satellite Case B: IoT network Case C: UAV survey Conventional ground survey Initial survey/deployment 3–5 days 1–2 days 8–12 days 30–45 days Area coverage (ha/day) 200–330 NA, continuous 80–125 22–33 Tree species accuracy 93.2% N/A 91.7% 95.0% (limited sample) Carbon stock error ± 8.5% N/A ± 6.2% ± 5.0% (ground truth) Real-time monitoring No: batch Yes: continuous No: campaign No Wildfire-detection latency Hours to days < 15 min Hours: post-flight Hours to days Annual cost per 1,000 ha (USD) 18,000–25,000 35,000–50,000 first year; 12,000–18,000 thereafter 22,000–30,000 45,000–60,000 Personnel 2–3 technicians 1–2 technicians 3–4 operators 6–8 surveyors Cloud/weather impact High: 25% data loss None for ground sensors Moderate: flight restrictions None Source: EID-A–EID-C. Enterprise comparisons used a nominal 1,000-ha deployment basis; the conventional baselines were supplied with the internal data. Results were not produced by one common-site trial and should not be interpreted as inferential rankings. The conventional ground survey baseline represents typical industry-reported ranges for subtropical montane terrain; it was not measured in a trial that was co-located with the three cases. Cross-column comparisons are descriptive only; the four columns draw on different data sources and test conditions. Table 4.
Enterprise-provided operational results for nominal 1,000-ha deployment comparisons.
-
Dimension Case A: AI platform Case B: NTN IoT Case C: UAV platform Data acquisition Satellite/UAV/ground inputs Fixed environmental sensors UAV-borne imaging and LiDAR Connectivity Cloud data ingestion Long Range (LoRa)-type local links + terrestrial/NTN backhaul Command, control, and post-flight transfer Analytics Classification, change, carbon estimation Rules/cloud anomaly detection Photogrammetry; optional downstream AI Decision support Maps and candidate reports Near-real-time alerts High-resolution survey products Governance integration Potential data platform Pilot interfaces across institutions Procurement and aviation permitting Potential MRV input Monitoring/estimation input only Environmental evidence input Calibration/validation evidence input Performance evidence Enterprise internal field tests; no independent audit Enterprise internal field tests;
no common-site replicationEnterprise internal field tests;
no independent auditAuthor-judged TRL 5–6 6–7 8–9 for base hardware; 6–7 for integrated forestry use TRL is an author interpretation based on deployment evidence, not a measured outcome; it is analytically separate from the enterprise-reported results in Tables 3−4. Table 5.
Cross-case analytical matrix and evidence status.
-
Case Strength/opportunity Weakness/threat Mitigation path A Scalable analytics; demand for credible carbon information Black box risk; unverified methodology compliance Ground plots, uncertainty reporting, data lineage, independent verification, open export B Persistent remote connectivity; event warning Single-provider, battery, and authorization risk Multioperator 3GPP NTN; terrestrial/LoRa store-and-forward; domestic systems where authorized; replaceable power C Endurance and flexible payloads; precision mapping Composite supply, operator cost, flight restrictions Dual/local composite sourcing; modular payload bays and connectors; repairable spares; documented safety case Cross-cutting Multilayer fusion and policy demand Data silos, surveillance,
platform lock-inOpen application programming interfaces/portability; role-based access; community participation; procurement exit clauses Table 6.
SWOT characterization and targeted mitigation.
-
Layer/issue Testable proposition (not a standard) Validation design Linked action Satellite observation H1: ≥ 1 cloud-usable optical or SAR observation every ≤ 10 days in May–October Log usable scenes by elevation and forest type Shared multisensor tasking and cross-agency catalog UAV calibration H2: Ground-sampling distance ≤ 10 cm and horizontal RMSE ≤ 20 cm Independent checkpoints under slope/
canopy strataShared service subsidy; common survey and flight safety protocol IoT alerting H3: ≥ 95% of priority alerts delivered within 15 min; monthly uptime ≥ 95% Timestamped logs across monsoon and typhoon conditions Open protocols; multi-operator NTN; store-and-forward fallback AI/carbon estimation H4: relative RMSE ≤ 20%; bias and 95% uncertainty interval reported Independent plots across elevations and forest types Regional standard group; IPCC-aligned QA/QC; third-party verification Governance Metadata, audit logs, role-based access, and API conformance Interoperability, security, and user audits FNCA–local bureau data protocol; operator subsidies; community governance H1–H4 are deliberately falsifiable independent-validation hypotheses, not adopted regulatory thresholds. The 25% cloud-affected data loss in Table 3 is retained only as an internal field-test result from Case A; it is not attributed to the FNCA or generalized to the region. Table 7.
Proposed independent validation benchmarks and linked governance actions.
Figures
(2)
Tables
(7)