












-
Forests cover about 31% of global land and underpin climate regulation, biodiversity, and livelihoods[1]. In China's Taiwan region, the fourth forest resource survey of the Forestry and Nature Conservation Agency (FNCA) reported 2,197,090 ha of forest and 60.71% cover for the 2008–2014 inventory period[2]. The 2050 net-zero transition roadmap of China's Taiwan region identifies natural carbon sinks as a strategic pathway[3]. Steep relief, typhoons, seasonal clouds, and gaps in mountain connectivity make integrated monitoring especially relevant.
As shown in Fig. 1, forest vegetation is concentrated in the central and eastern mountain ranges and varies markedly across elevation zones, whereas agricultural and urban land uses are more prevalent in the western lowlands. To capture this complexity, Lin et al. (2021) used 105 climatic variables within a machine learning framework to model the current distribution of 13 forest types. This spatial heterogeneity reinforces the need for integrated remote sensing, Internet of Things (IoT), and unmanned aerial vehicle (UAV)-based forest monitoring[4].
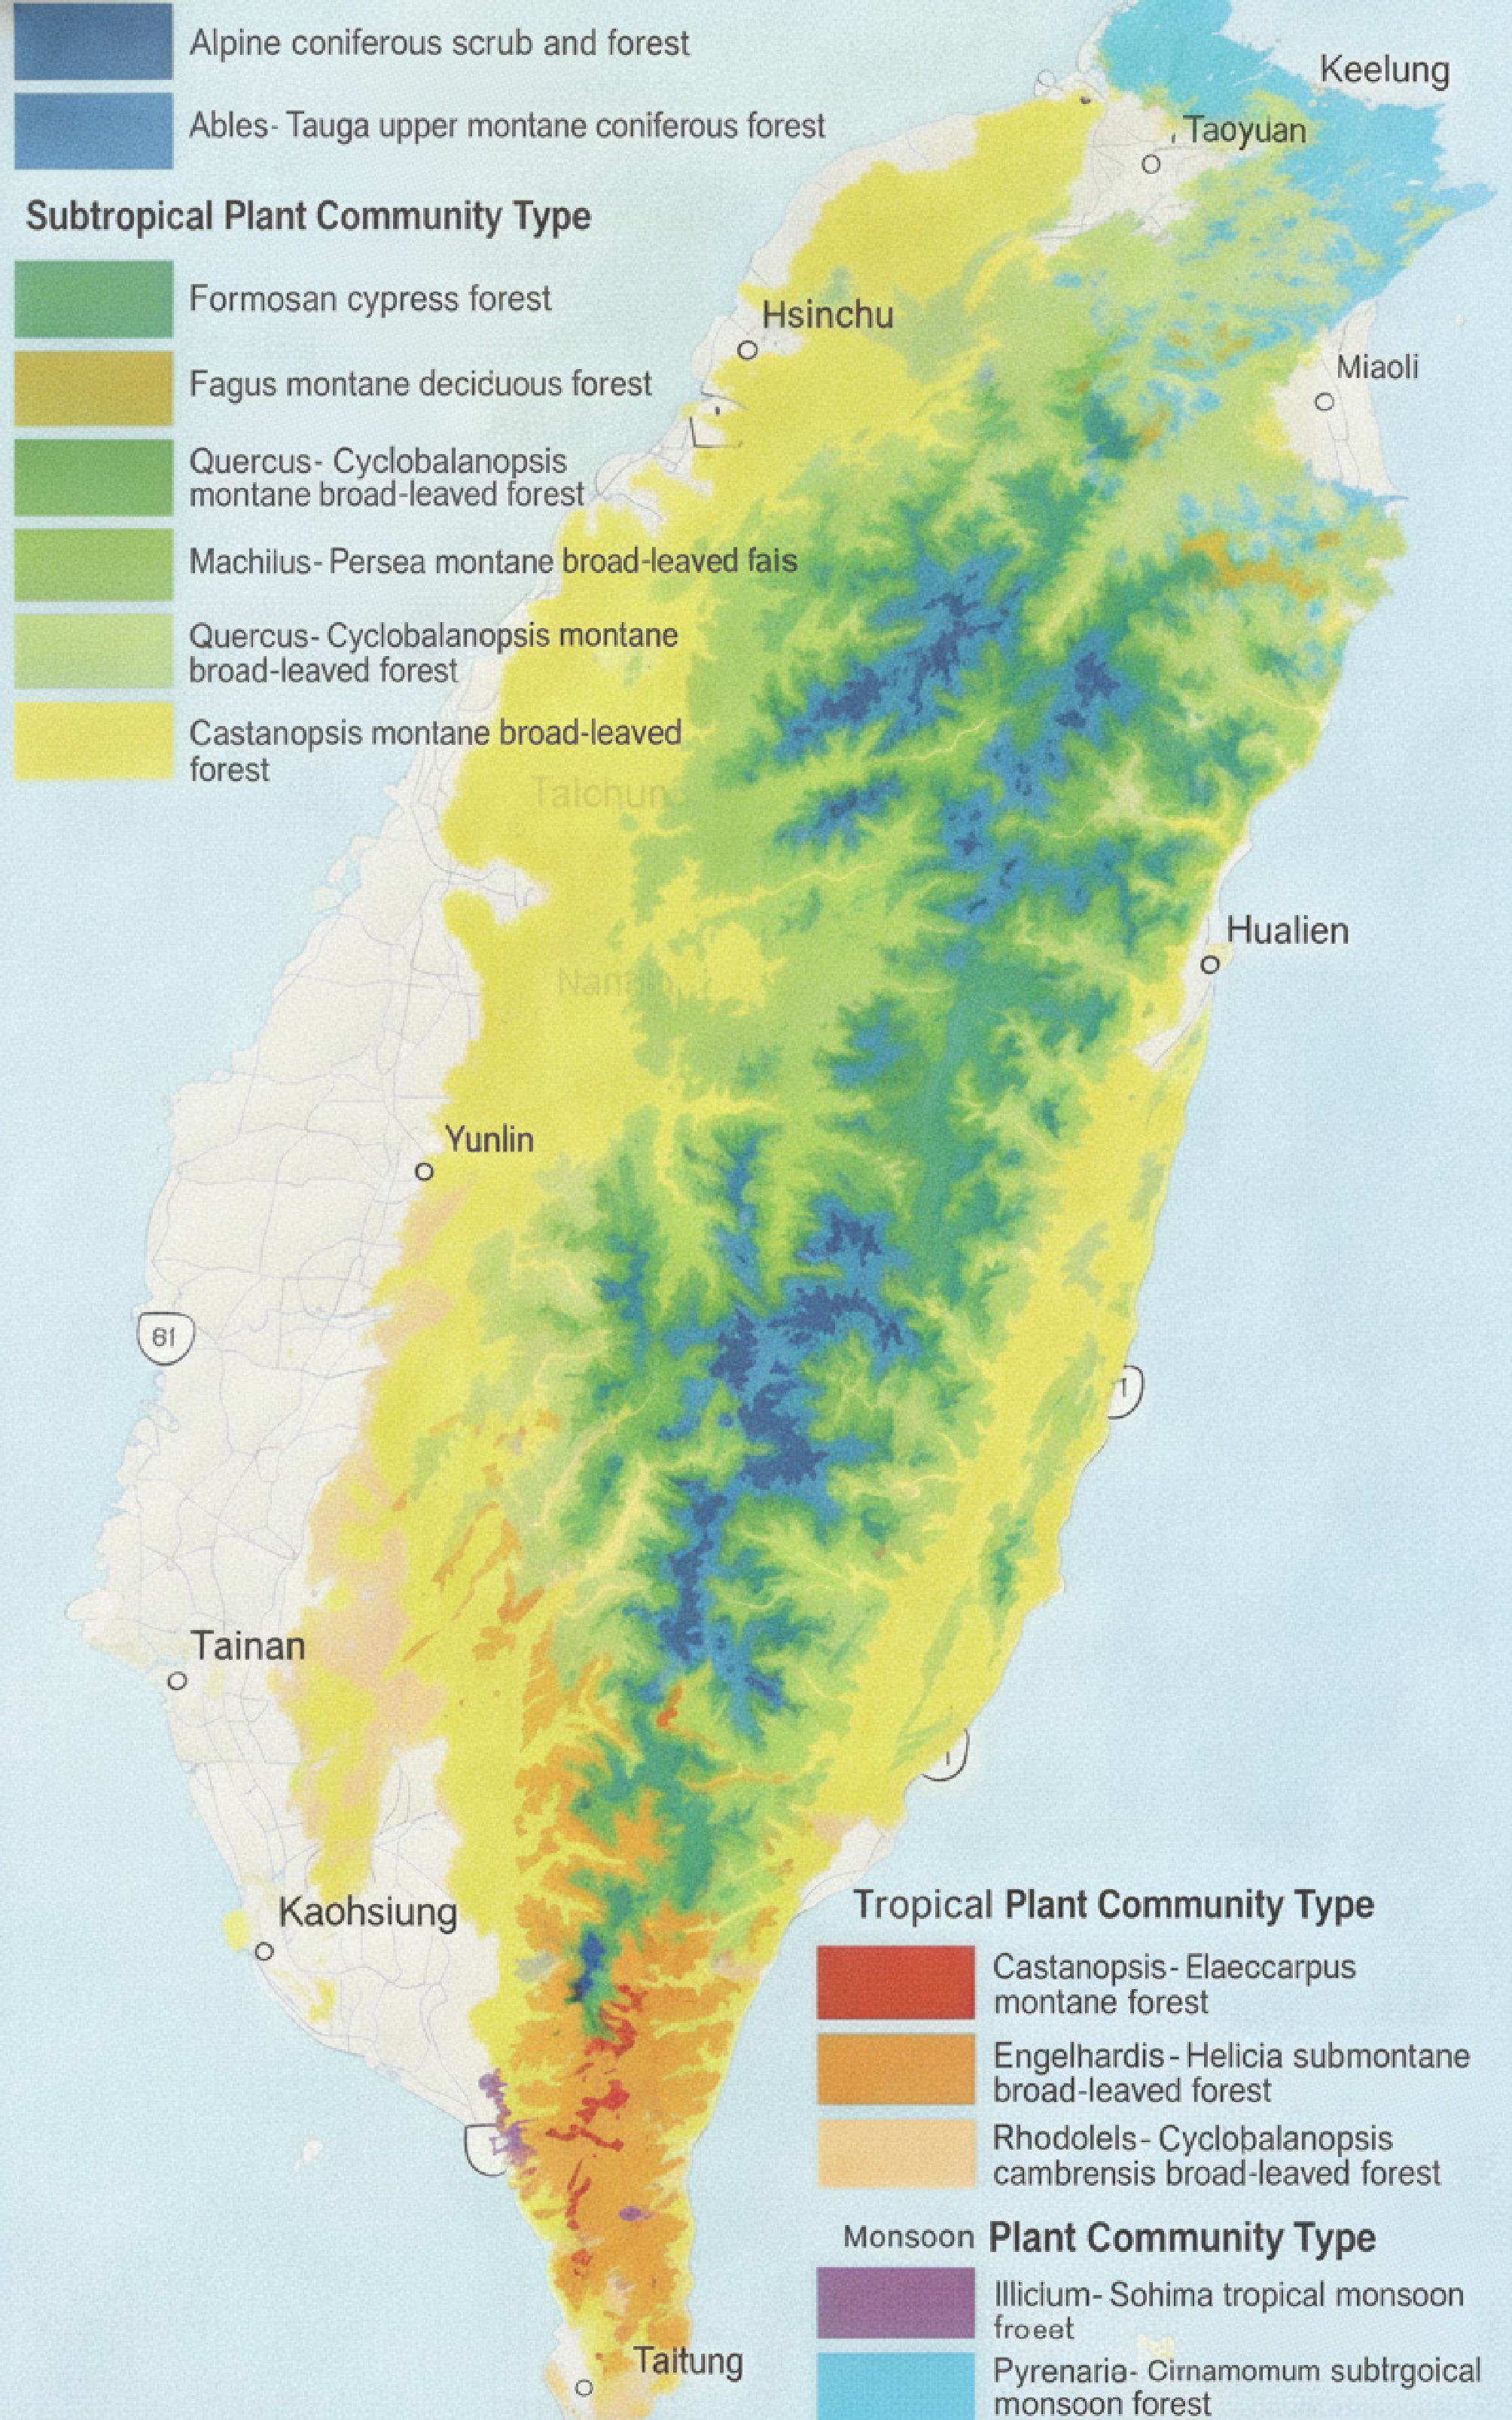
Figure 1.
Distribution of major forest vegetation in China's Taiwan region[4].
Here, smart forestry means the coordinated use of digital sensing, connectivity, analytics, and decision support in forest management. Forest 4.0 is the related cyber-physical and automation paradigm; digital transformation is the broader redesign of organizational processes and governance around digital data[5]. Forest carbon monitoring is the acquisition and estimation component. MRV (measurement, reporting, and verification) denotes the auditable chain for the measurement, reporting, and independent verification of greenhouse gas outcomes; monitoring is an input to that chain, not a synonym for MRV.
The study asks how three complementary enterprise pathways and their company-supplied measurements can be evaluated while distinguishing enterprises' field test evidence from independent validation. It contributes a transparent public/internal evidence protocol, a literature-derived comparison matrix, and an integrated framework with falsifiable technical and governance propositions.
-
Recent work has combined national inventories, satellite sensing, UAVs, light detection and ranging (LiDAR), open benchmark datasets, artificial intelligence (AI), the IoT, and satellite-based nonterrestrial networks (NTNs). Their operational uptake nevertheless depends on validation, interoperability, the users' needs, and governance rather than models' accuracy alone[6−11]. As summarized in Table 1, regional deployment trajectories differ across Europe and North America, Japan and South Korea, Southeast Asia, and China's Taiwan region, revealing distinct strengths, constraints, and transferability conditions. Forest 4.0 studies likewise emphasize integration, but enterprises' case evidence often isolates one technology. We therefore evaluate data acquisition, connectivity, analytics, decision support, governance integration, and potential input to MRV processes as one linked system.
Table 1. Interpretive comparison of regional smart forestry deployment patterns.
Region Dominant trajectory Strength Constraint/transferable lesson Europe and North America Sequential: Plot inventories → remote sensing/LiDAR → AI and operational services Long validation heritage Interoperability and user uptake remain uneven; retain plot-based calibration[6,12,13] Japan and South Korea Policy- and sector-led integration of machinery, remote sensing, and disaster analytics Public-program alignment Terrain and workforce constraints favor targeted automation and shared infrastructure[14,15] Southeast Asia Project-based national inventories and remote-sensing platforms Rapid coverage of heterogeneous forests Connectivity and institutional capacity require open tools and regional training[16] China's Taiwan region Parallel pilots of satellite/NTN IoT, UAVs, and AI Fast functional complementarity Cloud, relief, fragmented data governance, and limited field benchmarks require staged validation Patterns are nonexclusive interpretive syntheses, not rankings. -
From January 2025 to June 2026, the three enterprises also supplied deidentified, aggregated internal field test and operational data on accuracy, F1 score, processing or transmission speed, coverage, efficiency, cost, staffing, and operational constraints. Evidence credibility was prioritized as follows: (1) Standards or government data, (2) peer-reviewed research, (3) independently documented deployments, and (4) the enterprises' public disclosures. Internal measurements were treated as enterprise-reported primary evidence and checked for plausibility against published ranges and documented deployments. The authors conducted no new interviews, test replications, or independent audits of proprietary records; this limitation applies to each quantitative table[17]. Comparable market-share data were unavailable and therefore excluded. Because commercialization was the unit of analysis, universities and state forestry technology agencies served only as corroborating sources. Confidentiality requirements anonymized the enterprises as Cases A–C and removed identifying details. Table 2 summarizes the selection basis, evidence sources, enterprise-provided internal field test indicators, and validation boundaries for each case.
Table 2. Case selection and evidence register.
Case Pathway and inclusion basis Evidence used Enterprise internal test indicators Validation boundary A AI/natural asset carbon software; documented partnerships Public corporate/partner/
policy + EID-AAccuracy/F1; processing; coverage; carbon error; cost No independent audit; market share and MRV compliance were unverified B Third-generation partnership project (3GPP) NTN/IoT connectivity; institutional pilot Public corporate/partner/
government + EID-BAccuracy/F1; latency; sensor coverage; cost; staffing No common-site replication; interoperability unverified C Fixed-wing composite UAVs; mature commercial hardware Public corporate/
certification + EID-CAccuracy/F1; area per flight; efficiency; carbon error; cost No common-site replication or independent audit EID-A, EID-B, and EID-C denote confidential enterprise-provided internal datasets for Cases A–C. Aggregated results are reported; proprietary underlying records are withheld. A coded source register can be supplied to the editor under confidentiality. Case selection
-
The three enterprises were selected through maximum variation purposive sampling. The inclusion criteria were as follows: (1) active commercial status during 2020–2026; (2) one focal technology pathway—AI analytics, NTN/IoT connectivity, or UAV sensing; (3) documented field deployment or institutional cooperation in subtropical montane forests; (4) adequate public and enterprise-provided evidence for the 2020–2026 period; (5) regional relevance to China's Taiwan region; and (6) documented international activity or partnership. Comparable market-share data were unavailable and therefore excluded from the selection criteria. Universities and state forestry technology agencies were excluded as focal cases because the unit of analysis is enterprise-associated commercialization; their records serve only as corroborating sources. The confidentiality requirements communicated by the enterprises prohibit the disclosure of identifying details; the cases are therefore reported as Cases A–C throughout.
Analysis
-
A deductive matrix applied the six literature-derived dimensions to each case, followed by cross-case pattern matching. Enterprise-provided values were retained as supplied and harmonized only by label and unit; no imputation, rescaling, or significance testing was performed. Test sites, periods, sample sizes, and protocols were not uniformly disclosed, so the results are descriptive and do not constitute a standardized head-to-head trial. The technology readiness level (TRL; 1–9) remains the authors' judgment and is separated from the enterprises' measurements. Thresholds H1–H4 are propositions for independent follow-up testing, not regulatory standards.
-
Case A integrates satellite, UAV, geographic, and potential ground data into vegetation, change, and carbon estimation workflows. Case B combines low-power sensors and local aggregation with terrestrial or third-generation partnership project (3GPP) Release 17 narrowband IoT over a NTN backhaul[11]. Case C supplies fixed-wing composite UAV platforms capable of carrying red–green–blue (RGB), multispectral, thermal, or LiDAR payloads. Public records establish the functions and deployment contexts; enterprises' internal data add performance measurements, but neither source stream independently establishes compliance with the carbon credit methodology.
Enterprise-provided field test results
-
Table 3 compares the unaudited, enterprise-provided field test performance of Cases A–C. Because these measurements were not independently verified and the test protocols were not standardized across cases, the values are descriptive and do not constitute a ranked comparison.
Table 3. Enterprise-provided field test performance results for the three cases.
Metric Case A: AI classification Case B: IoT monitoring Case C: UAV survey Primary task Vegetation species classification Environmental anomaly detection Aerial forest mapping Measured overall accuracy 88.0%–93.2% 89.5%–92.5% 86.2%–91.7% Measured F1 score 0.91 0.86 0.90 Processing / transmission speed 2.4 frames/s (satellite imagery) 15-s sensor-to-cloud latency 120 ha/flight hour Coverage per unit 500 ha/satellite scene 200 ha/sensor-node cluster 120 ha/fixed-wing flight Enterprise-reported improvement +38% accuracy vs. traditional remote sensing 72% lower data latency vs. manual survey 8.5× survey efficiency vs. ground survey Observed operational limitation 25% cloud-affected data loss Sensor-node battery degradation Mountain flight restrictions Source: Confidential internal data from the enterprises, EID-A, EID-B, and EID-C, were supplied to the authors. Values are enterprise-reported field test results and were not independently audited; the protocols were not standardized across cases. These indicators are descriptive and noncomparative; they were produced under different test conditions and should not be read as a direct performance ranking among the three pathways. Table 4 presents a descriptive comparison of enterprise-provided operational results for Cases A–C and conventional ground surveys under a nominal 1,000-ha scenario, covering the deployment time, accuracy, monitoring capacity, cost, staffing, and environmental constraints.
Table 4. Enterprise-provided operational results for nominal 1,000-ha deployment comparisons.
Performance dimension Case A: AI + satellite Case B: IoT network Case C: UAV survey Conventional ground survey Initial survey/deployment 3–5 days 1–2 days 8–12 days 30–45 days Area coverage (ha/day) 200–330 NA, continuous 80–125 22–33 Tree species accuracy 93.2% N/A 91.7% 95.0% (limited sample) Carbon stock error ± 8.5% N/A ± 6.2% ± 5.0% (ground truth) Real-time monitoring No: batch Yes: continuous No: campaign No Wildfire-detection latency Hours to days < 15 min Hours: post-flight Hours to days Annual cost per 1,000 ha (USD) 18,000–25,000 35,000–50,000 first year; 12,000–18,000 thereafter 22,000–30,000 45,000–60,000 Personnel 2–3 technicians 1–2 technicians 3–4 operators 6–8 surveyors Cloud/weather impact High: 25% data loss None for ground sensors Moderate: flight restrictions None Source: EID-A–EID-C. Enterprise comparisons used a nominal 1,000-ha deployment basis; the conventional baselines were supplied with the internal data. Results were not produced by one common-site trial and should not be interpreted as inferential rankings. The conventional ground survey baseline represents typical industry-reported ranges for subtropical montane terrain; it was not measured in a trial that was co-located with the three cases. Cross-column comparisons are descriptive only; the four columns draw on different data sources and test conditions. The reported measurements indicate different operational advantages: Case A emphasizes scalable classification and carbon estimation, Case B minimizes alert latency in low-connectivity areas, and Case C accelerates high-resolution mapping. Case A's 93.2% classification result and Case C's 8.5× efficiency gain fall within ranges reported in recent forest-related AI and UAV literature, providing a plausibility check rather than independent replication[6,7].
Cross-case comparison
-
As shown in Table 5, the comparison indicates complementarity rather than a single superior case. Case A is analytics-rich but validation-dependent; Case B addresses the connectivity bottleneck but introduces operator and power dependencies; and Case C provides calibration-grade spatial detail but remains campaign-based and regulation-sensitive. Integration therefore shifts the principal bottleneck from sensing to standards, data provenance, and governance.
Table 5. Cross-case analytical matrix and evidence status.
Dimension Case A: AI platform Case B: NTN IoT Case C: UAV platform Data acquisition Satellite/UAV/ground inputs Fixed environmental sensors UAV-borne imaging and LiDAR Connectivity Cloud data ingestion Long Range (LoRa)-type local links + terrestrial/NTN backhaul Command, control, and post-flight transfer Analytics Classification, change, carbon estimation Rules/cloud anomaly detection Photogrammetry; optional downstream AI Decision support Maps and candidate reports Near-real-time alerts High-resolution survey products Governance integration Potential data platform Pilot interfaces across institutions Procurement and aviation permitting Potential MRV input Monitoring/estimation input only Environmental evidence input Calibration/validation evidence input Performance evidence Enterprise internal field tests; no independent audit Enterprise internal field tests;
no common-site replicationEnterprise internal field tests;
no independent auditAuthor-judged TRL 5–6 6–7 8–9 for base hardware; 6–7 for integrated forestry use TRL is an author interpretation based on deployment evidence, not a measured outcome; it is analytically separate from the enterprise-reported results in Tables 3−4. Strategic analysis
-
Table 6 summarizes the case-specific SWOT profiles and corresponding mitigation strategies. The principal opportunity is an interoperable service ecosystem rather than dominance by a single vendor, whereas the main risk is dependency shifting from sensor or satellite providers to proprietary analytics and reporting platforms.
Table 6. SWOT characterization and targeted mitigation.
Case Strength/opportunity Weakness/threat Mitigation path A Scalable analytics; demand for credible carbon information Black box risk; unverified methodology compliance Ground plots, uncertainty reporting, data lineage, independent verification, open export B Persistent remote connectivity; event warning Single-provider, battery, and authorization risk Multioperator 3GPP NTN; terrestrial/LoRa store-and-forward; domestic systems where authorized; replaceable power C Endurance and flexible payloads; precision mapping Composite supply, operator cost, flight restrictions Dual/local composite sourcing; modular payload bays and connectors; repairable spares; documented safety case Cross-cutting Multilayer fusion and policy demand Data silos, surveillance,
platform lock-inOpen application programming interfaces/portability; role-based access; community participation; procurement exit clauses -
Fig. 2 links acquisition, analytics, and decisions. Two explicit feedback paths are essential: real-time IoT alerts reprioritize image tasking and change-detection thresholds; UAV and ground-plot data update georegistration, bias correction, and model calibration. Thus, the analytical layer is recalibrated rather than treated as a one-way black box.
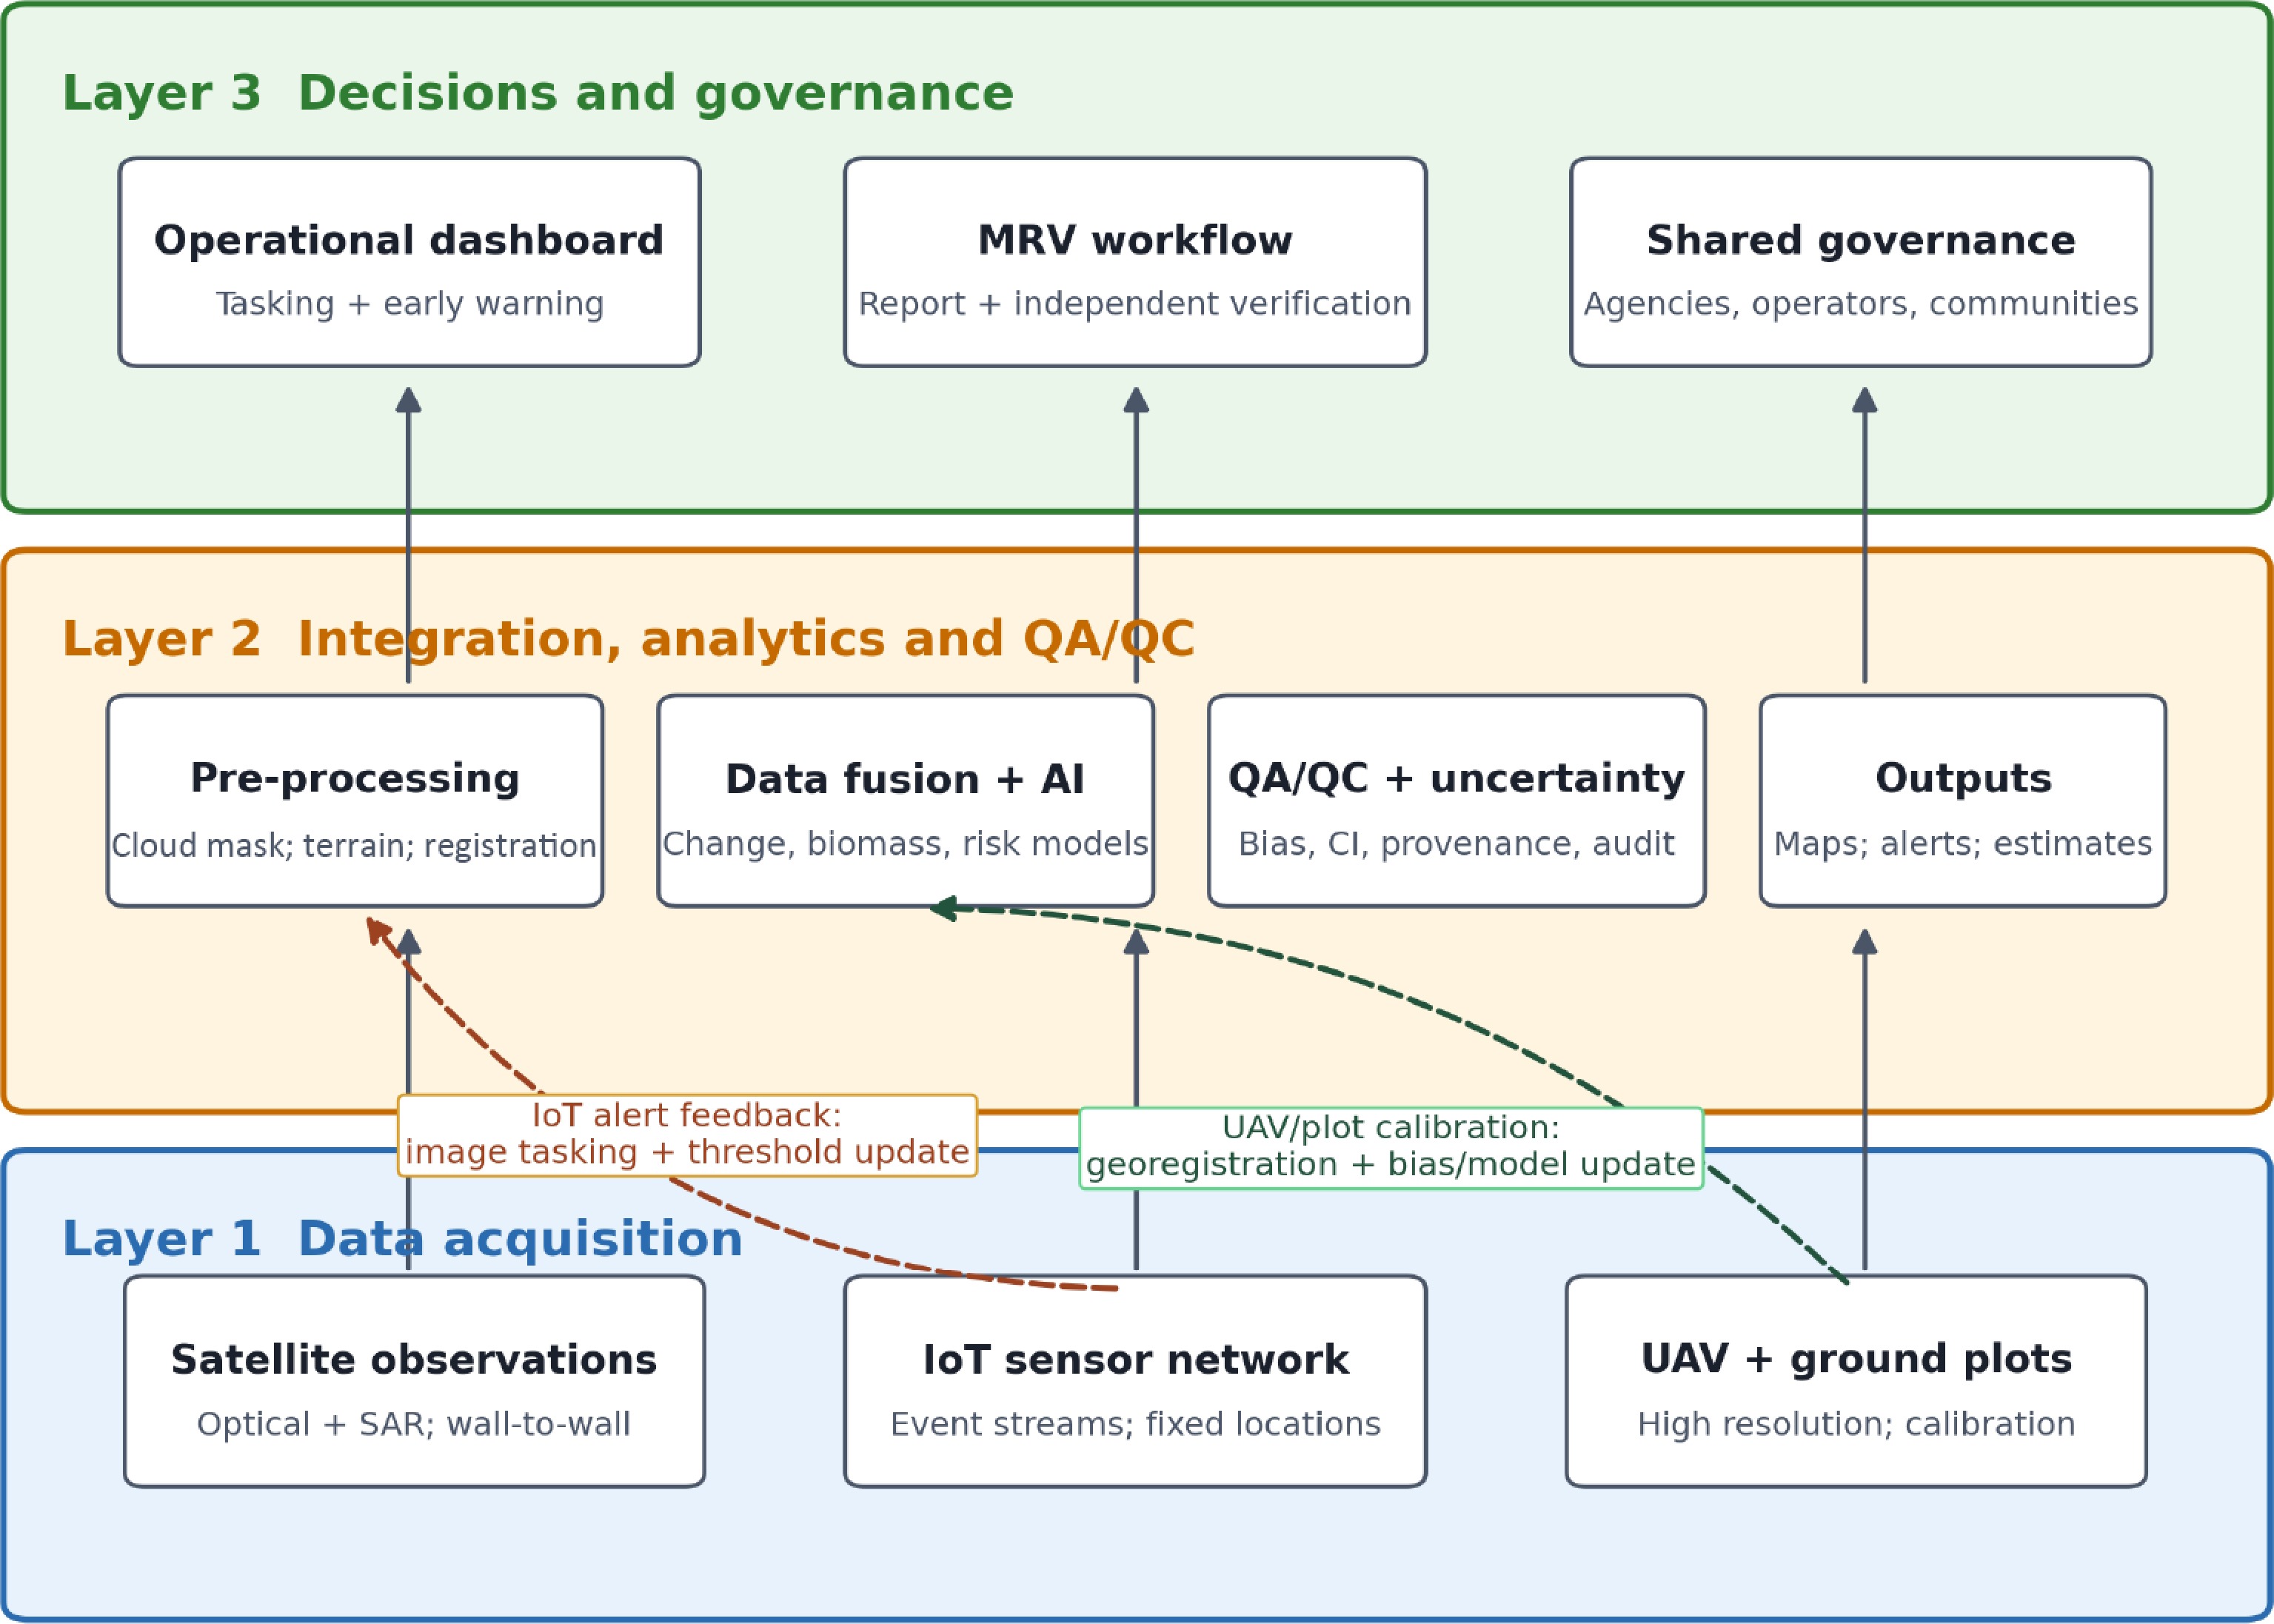
Figure 2.
Integrated three-layer smart-forestry framework with operational and calibration feedback.
Table 7 uses synthetic aperture radar (SAR), quality assurance and quality control (QA/QC), root mean square error (RMSE), application programming interface (API), and Intergovernmental Panel on Climate Change (IPCC) terminology. All quantitative indicators from the three cases are unaudited, enterprise-reported field-test results; they were not independently replicated or standardized and should not be interpreted as a performance ranking.
Table 7. Proposed independent validation benchmarks and linked governance actions.
Layer/issue Testable proposition (not a standard) Validation design Linked action Satellite observation H1: ≥ 1 cloud-usable optical or SAR observation every ≤ 10 days in May–October Log usable scenes by elevation and forest type Shared multisensor tasking and cross-agency catalog UAV calibration H2: Ground-sampling distance ≤ 10 cm and horizontal RMSE ≤ 20 cm Independent checkpoints under slope/
canopy strataShared service subsidy; common survey and flight safety protocol IoT alerting H3: ≥ 95% of priority alerts delivered within 15 min; monthly uptime ≥ 95% Timestamped logs across monsoon and typhoon conditions Open protocols; multi-operator NTN; store-and-forward fallback AI/carbon estimation H4: relative RMSE ≤ 20%; bias and 95% uncertainty interval reported Independent plots across elevations and forest types Regional standard group; IPCC-aligned QA/QC; third-party verification Governance Metadata, audit logs, role-based access, and API conformance Interoperability, security, and user audits FNCA–local bureau data protocol; operator subsidies; community governance H1–H4 are deliberately falsifiable independent-validation hypotheses, not adopted regulatory thresholds. The 25% cloud-affected data loss in Table 3 is retained only as an internal field-test result from Case A; it is not attributed to the FNCA or generalized to the region. MRV, policy, and ethical governance
-
A carbon platform becomes MRV-ready only when its estimates enter a documented chain with approved boundaries and baselines, ground calibration, uncertainty and QA/QC, reporting controls, and independent verification. IPCC guidance requires transparency, consistency, comparability, completeness, accuracy, and uncertainty assessments[18]. Verra and Gold Standard additionally require the applicable methodology, in addition to leakage and permanence treatment, safeguards, and third-party validation/verification[19,20]. Neither public sources nor the enterprise's internal measurements establish that Case A satisfies these regimes; the manuscript therefore makes no compliance claim.
Three policy responses follow directly from the barriers: (1) An FNCA–local environmental bureau protocol for metadata, access roles, APIs, and incident sharing; (2) a regional subtropical smart forestry standards group led by the forestry authority with academia, operators, and communities; and (3) capital and shared-service subsidies for small forest operators deploying mountain IoT and UAV systems. Ethical safeguards must address forest data sovereignty; meaningful participation by Indigenous communities including free, prior, and informed consent where applicable; privacy and surveillance; UAV flight safety; cybersecurity; and commercial lock-in[21].
Transferability and research priorities
Short term
-
Independently replicate the enterprise-reported results under common protocols for monsoon, typhoon, steep slope, and high-elevation conditions and publish a subtropical benchmark dataset.
Medium term
-
Compare China's mainland subtropical mountain forests, China's Taiwan region, Japan, South Korea, and Southeast Asia using common dimensions and uncertainty reporting.
Long term
-
Study institutional arrangements for carbon market MRV standardization, cross-border interoperability, and interdisciplinary forestry plus AI education. The parallel deployment model is transferable only after ecological, legal, infrastructure, and community adaptation.
-
The three anonymized pathways form a complementary sensing-to-governance system: UAVs and plots calibrate spatial evidence, the IoT sustains event awareness, and AI platforms integrate data for decisions and potential pre-MRV monitoring and reporting support. Enterprise-provided field test data indicate meaningful gains in classification, latency, and survey efficiency, although the nonstandard protocols and the absence of an independent audit limit direct ranking and generalization. By separating public facts, enterprise measurements, author-judged TRL, and independent-validation hypotheses, the revised Perspective offers a more reproducible basis for smart forestry policy and future field validation in subtropical montane regions.
-
This study used public documents and deidentified enterprise-provided internal operational and field-test data. It involved no human participants or personally identifiable information; institutional ethical approval was therefore not required. Internal data were handled under the enterprises' confidentiality restrictions and are reported only in aggregated form. During revision, the authors used OpenAI ChatGPT (accessed 6 August 2026) for language refinement, structural editing, and enhancement of the figure and layout. The authors reviewed and edited all assisted content, verified its accuracy, and take full responsibility for the integrity and originality of the manuscript. No AI tool is credited as an author.
-
The authors confirm their contributions to the paper as follows: conceptualization, data curation, formal analysis, writing – original draft: Zhang Y, Chen MC, Yang Q; methodology, supervision, project administration: Zhang Y, Chen MC; writing – review and editing: Chen MC, Yang Q; validation: Yang Q. All authors reviewed the results and approved the final version of the manuscript.
-
All cited public sources are listed below, and aggregated enterprise-provided internal field test results are reported in Tables 2−4. The underlying EID-A–EID-C datasets are not publicly available because they contain proprietary operational information subject to enterprise confidentiality restrictions. A coded source register can be provided to the editor, and further access may be considered by the corresponding author subject to enterprise authorization.
-
The authors declare that they have no conflict of interest.
- Copyright: © 2026 by the author(s). Published by Maximum Academic Press, Fayetteville, GA. This article is an open access article distributed under Creative Commons Attribution License (CC BY 4.0), visit https://creativecommons.org/licenses/by/4.0/.
-
About this article
Cite this article
Zhang Y, Chen MC, Yang Q. 2026. AI-enabled smart forestry technologies for sustainable forest management in China's Taiwan Region: an evidence-triangulated multicase perspective. Smart Forestry 1: e018 doi: 10.48130/smartfor-0026-0015 

AI-enabled smart forestry technologies for sustainable forest management in China's Taiwan Region: an evidence-triangulated multicase perspective
- Received: 15 July 2026
- Revised: 30 August 2026
- Accepted: 07 September 2026
- Published online: 10 October 2026
Abstract: Smart forestry combines digital sensing, connectivity, analytics, and decision support, yet evidence of their deployment in subtropical montane forests by enterprises remains fragmented. This Perspective examines three anonymized enterprises in China's Taiwan region representing artificial intelligence-enabled natural asset analytics (Case A), satellite nonterrestrial network-based Internet of Things connectivity (Case B), and fixed-wing unmanned aerial vehicle sensing (Case C). A bilingual desk review of peer-reviewed and public institutional, partner, and corporate materials from January 2020 to June 2026 was triangulated with deidentified internal field test and operational data supplied by the three enterprises. The authors did not independently repeat or audit the enterprises' tests. Unaudited enterprise-reported results include classification accuracy of 88.0%–93.2% (F1 = 0.91) for Case A, an anomaly detection accuracy of 89.5%–92.5% (F1 = 0.86) for Case B with 15-s sensor-to-cloud latency, and a mapping accuracy of 86.2%–91.7% (F1 = 0.90) of Case C with 120 ha surveyed per flight hour. Cross-case analysis shows complementary roles across acquisition, connectivity, analytics, decisions, governance integration, and readiness for measurement, reporting, and independent verification. Because the test protocols were not standardized across the enterprises, the measurements support a descriptive comparison rather than a statistical ranking. We propose independently testable benchmarks and pair governance barriers with data-sharing, standardization, and subsidy measures.
-
Key words:
- Smart forestry /
- Artificial intelligence /
- Nonterrestrial network /
- Unmanned aerial vehicle /
- Forest carbon /
- MRV