-
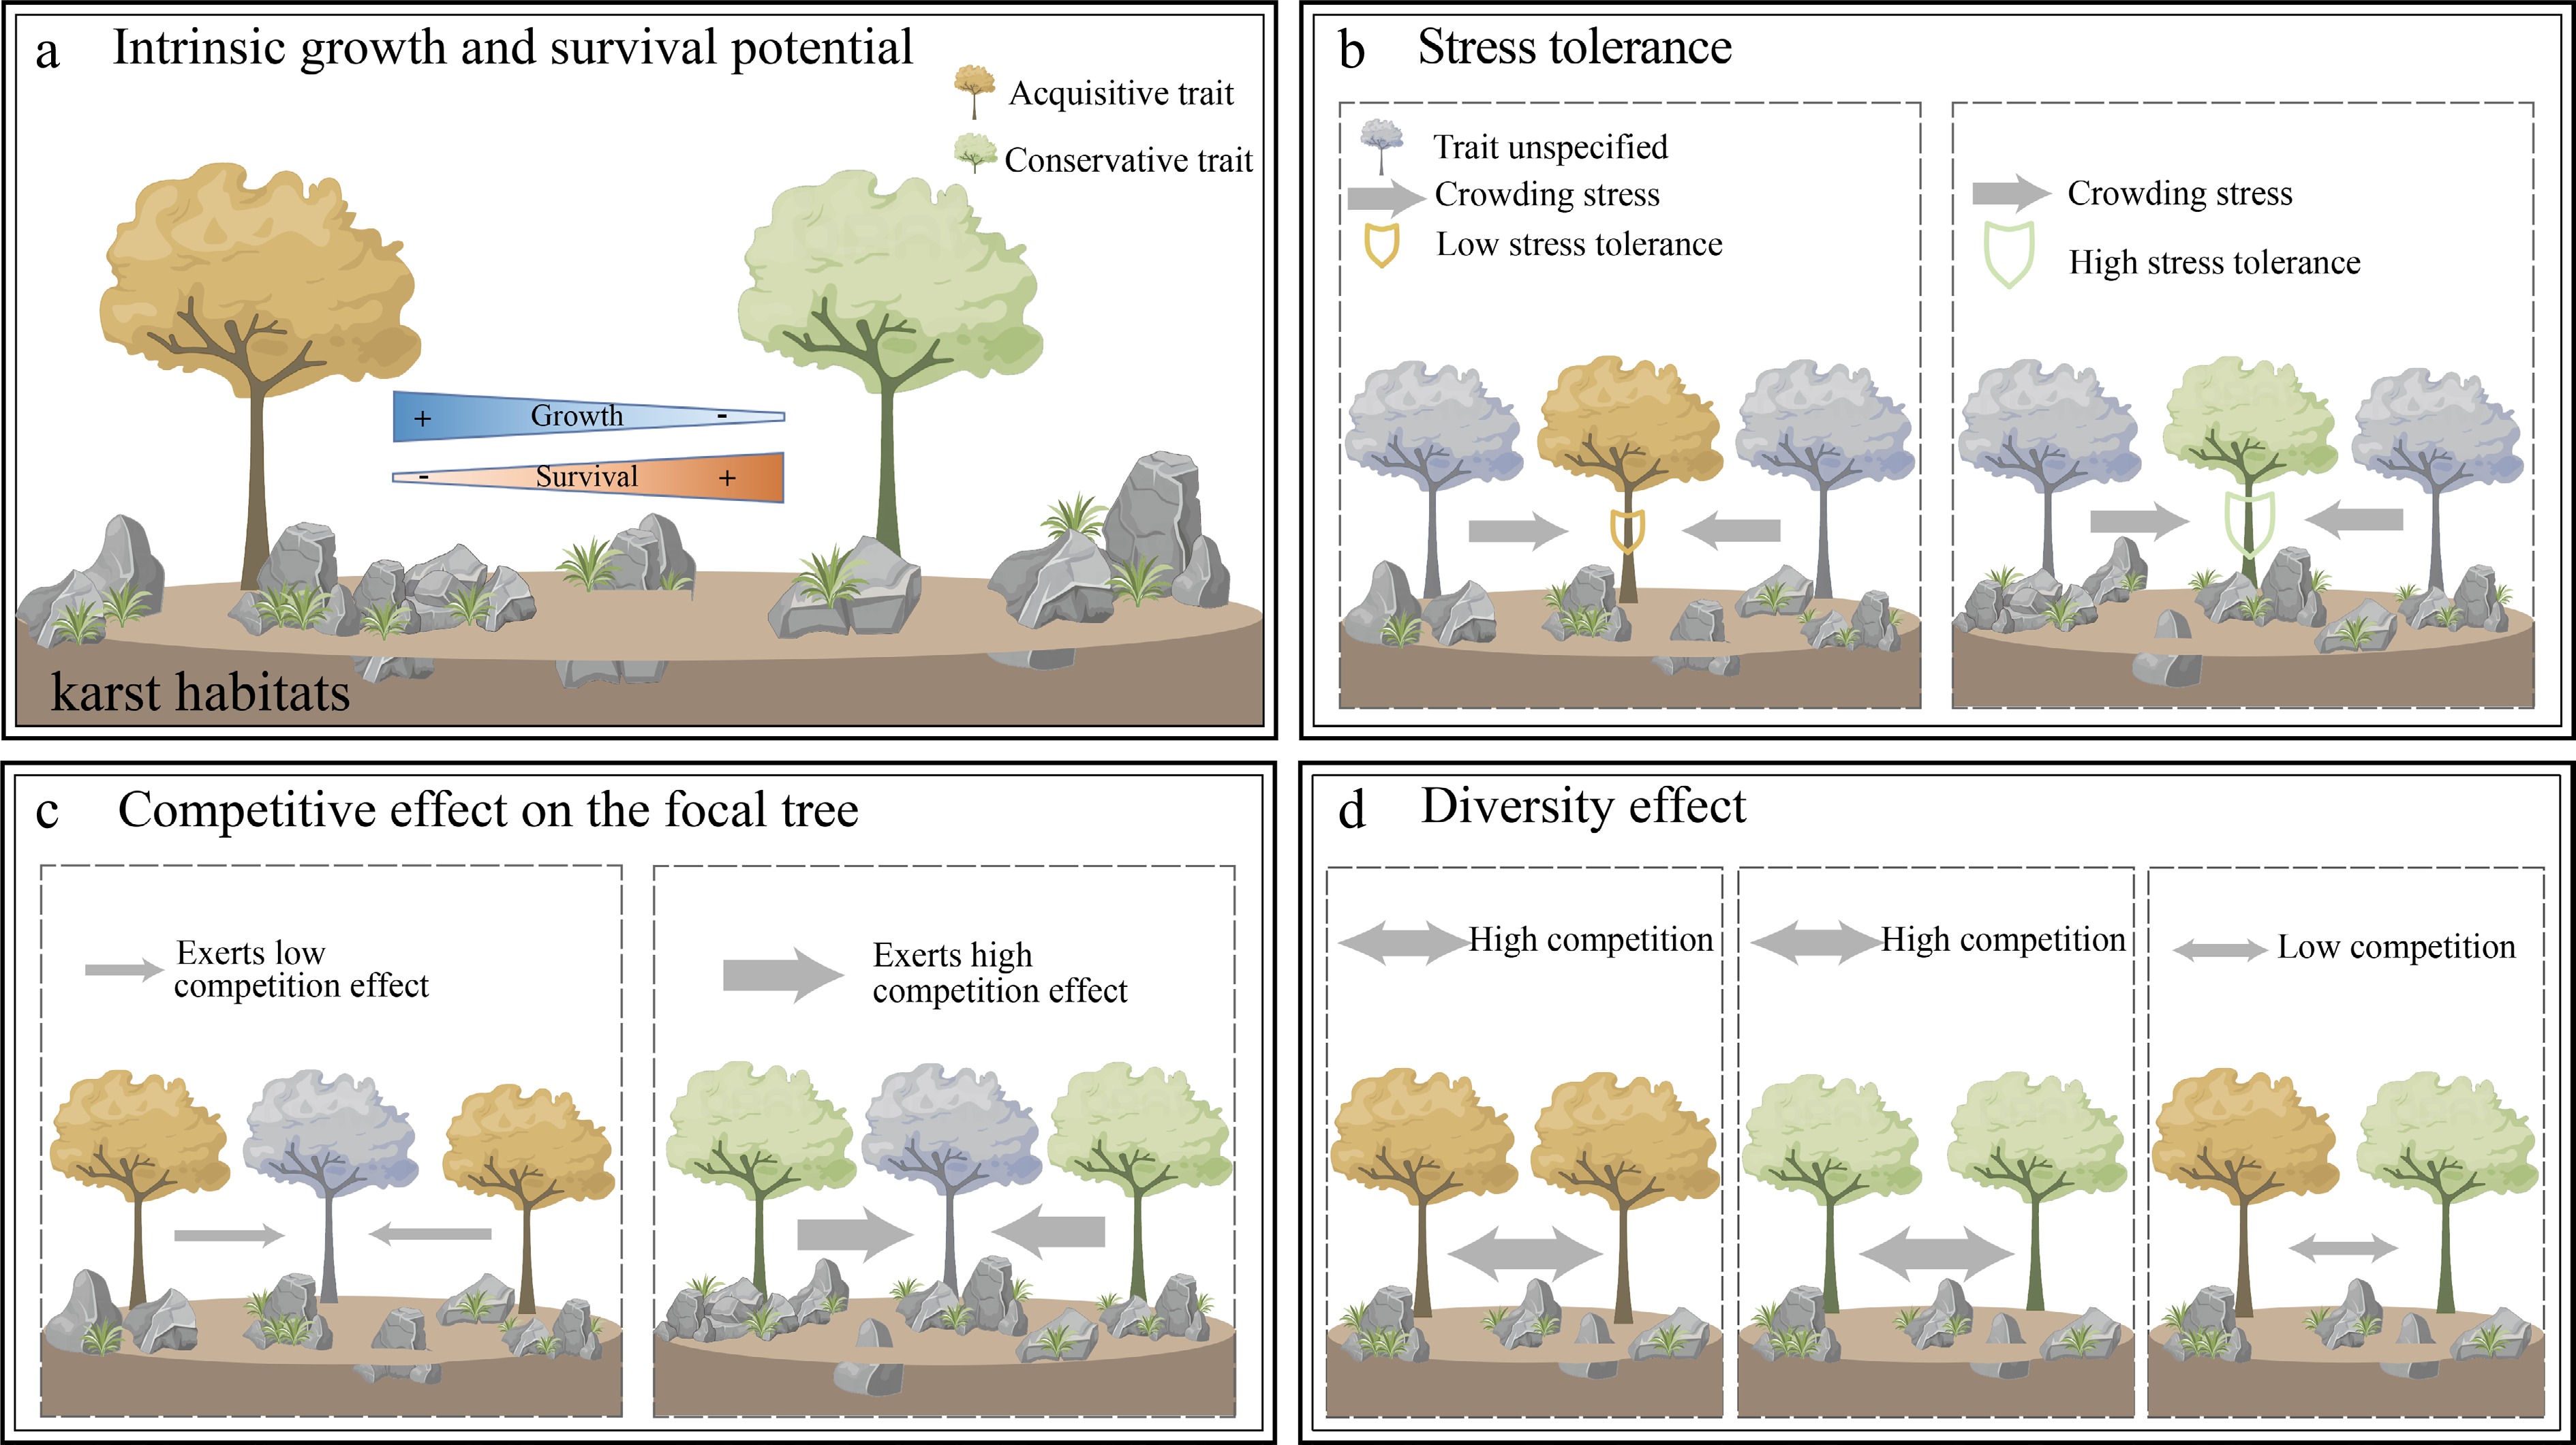
Figure 1.
Conceptual hypotheses linking functional traits to tree growth performance, survival, and neighborhood interactions (building on trait-related processes described by Lasky et al.[6] and Kunstler et al.[20]). (a) Intrinsic growth and survival potential. Species with acquisitive traits (yellow) are expected to be associated with faster growth but lower survival rates, whereas species with slow-growing, conservative traits (green) exhibit higher survival rates. (b) Stress tolerance (crowding). Species with conservative strategies have greater tolerance to neighbor crowding than acquisitive species, regardless of neighbor trait identity (gray trees). (c) Competitive effects on the focal tree. Species with conservative strategies are hypothesized to be associated with stronger and potentially more persistent negative neighborhood effects on focal trees. (d) Diversity effect. Neighborhood trait diversity/dissimilarity is hypothesized to be associated with improved focal-tree performance, potentially through reduced resource-use overlap and complementarity. The gray arrows indicate the hypothesized direction and relative strength of neighborhood effects, and the shield symbol indicates the focal tree's tolerance to stress. Trait categories (acquisitive vs conservative) represent contrasting resource-use strategies, such as variations in wood density or SLA.
-
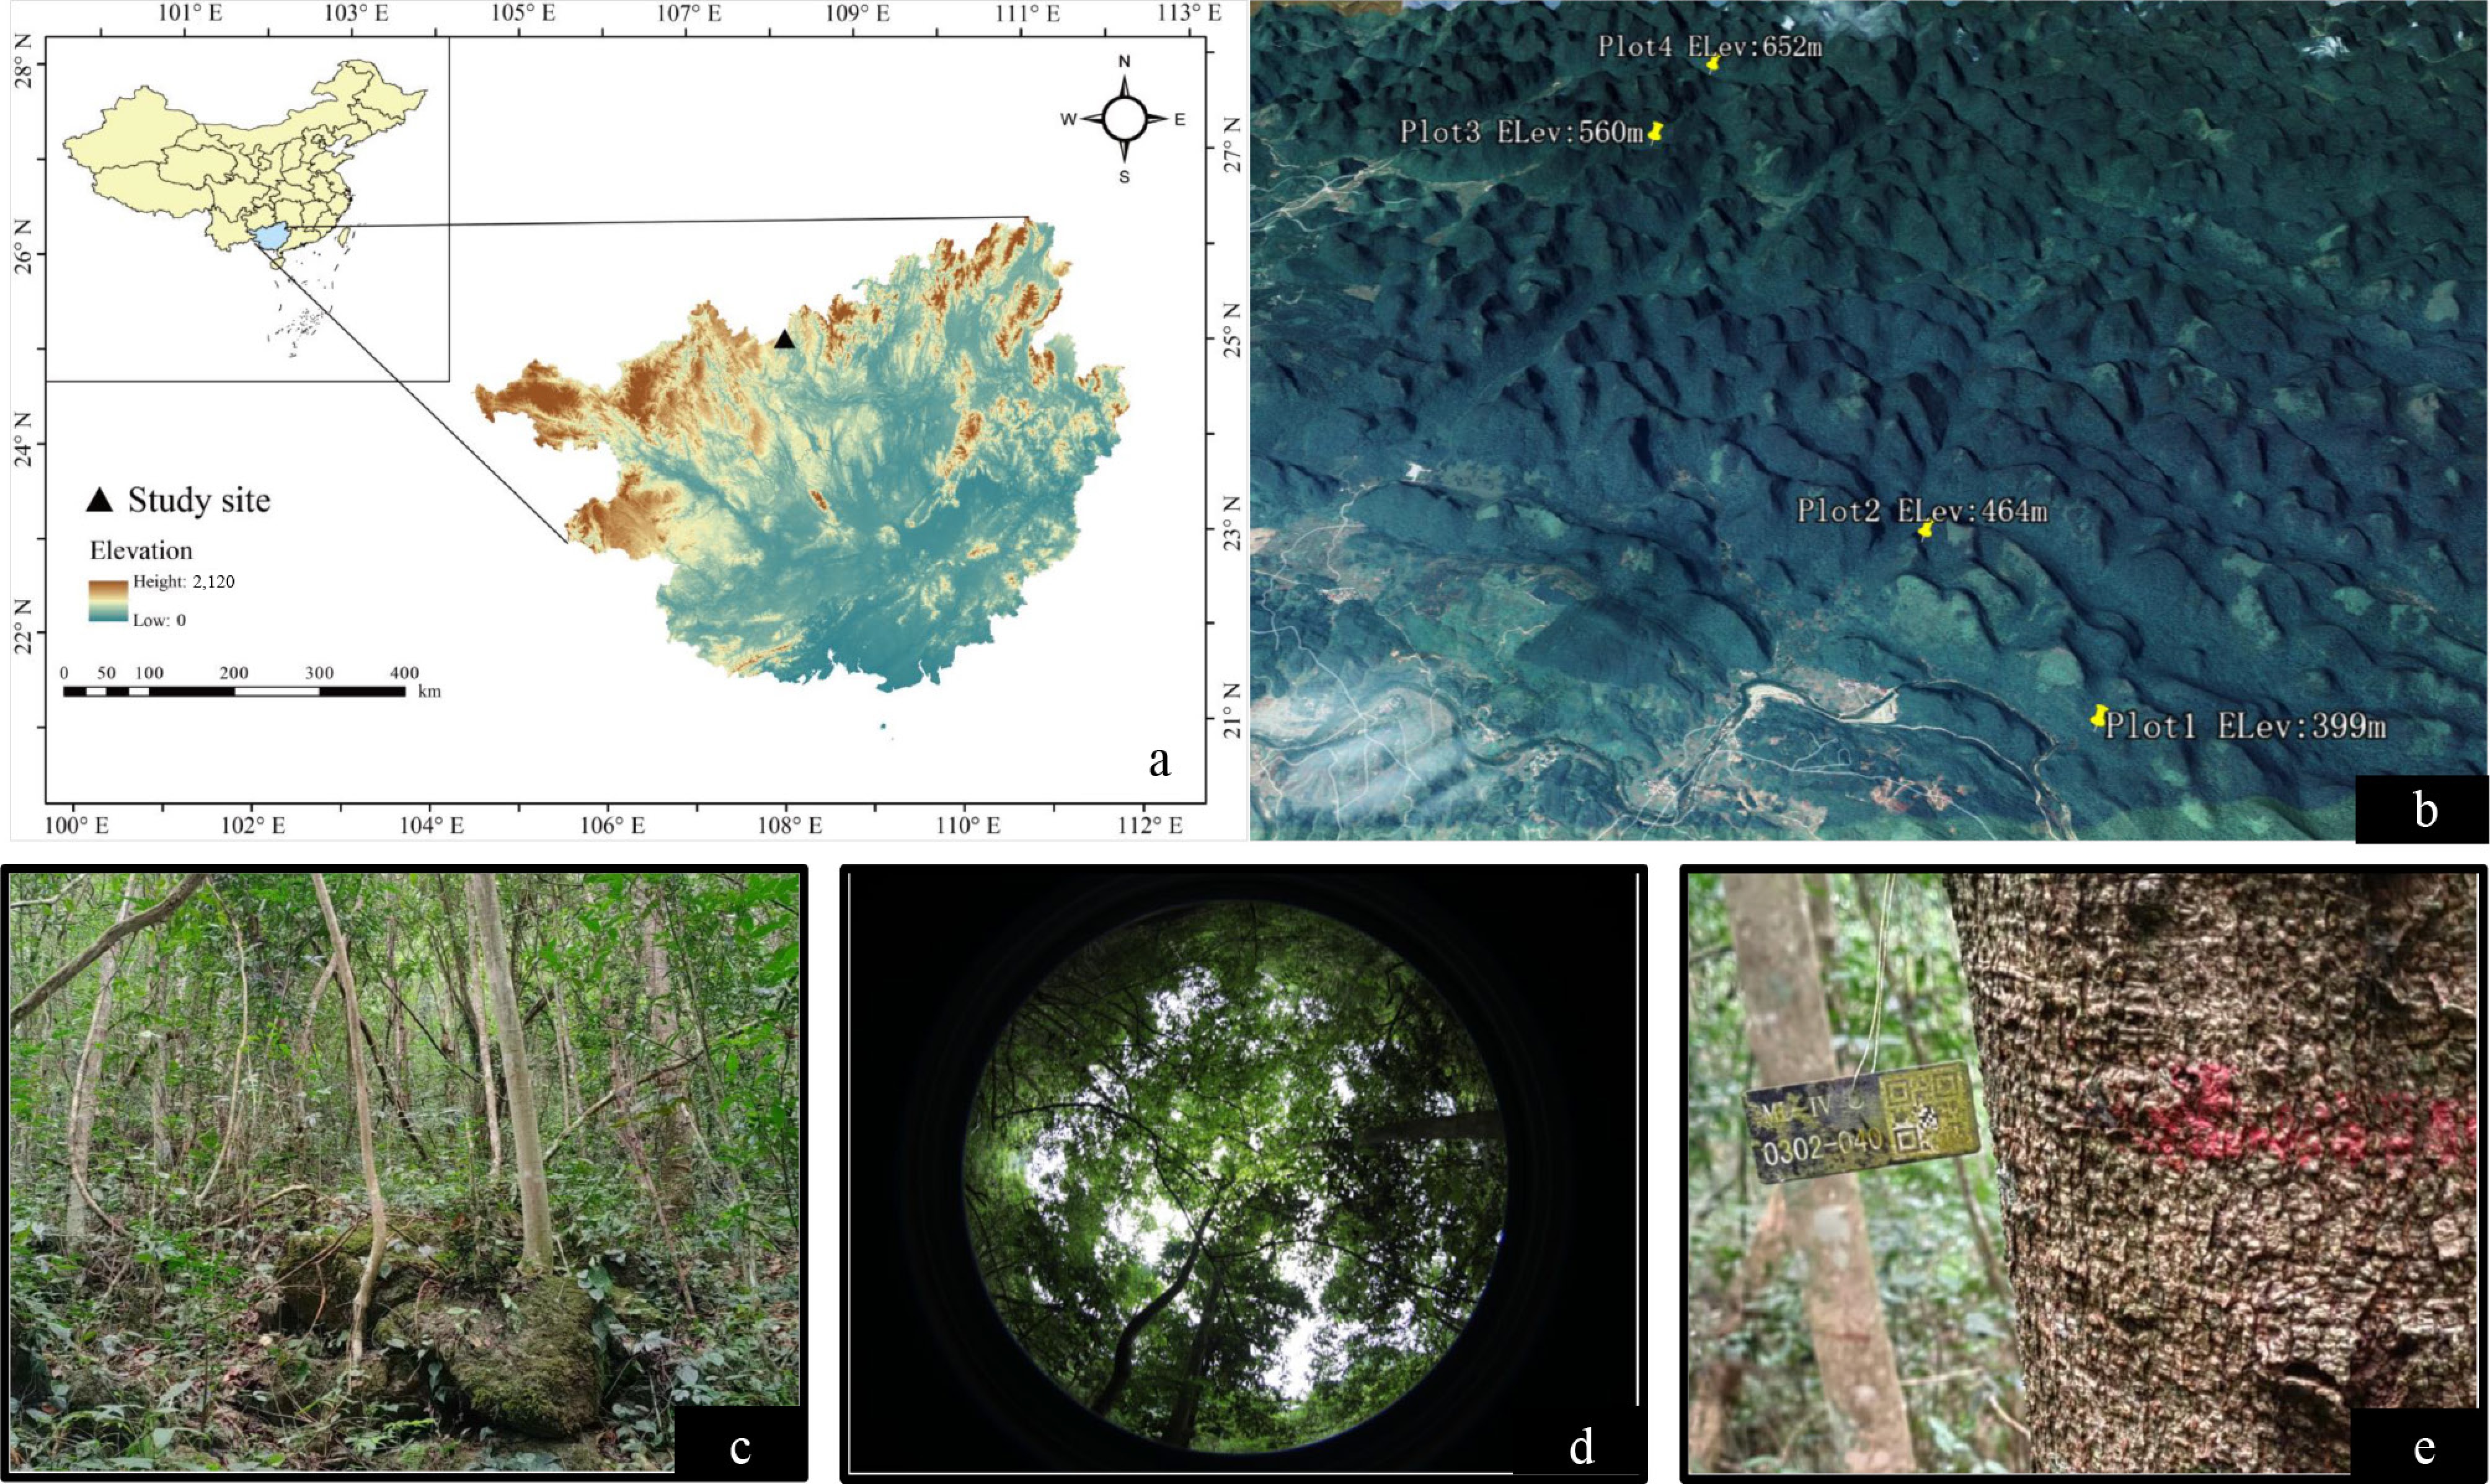
Figure 2.
(a) Map of China and the Guangxi Zhuang Autonomous Region showing the location of the study site (Map source: National Geomatics Center of China; the map was prepared by the authors in R); (b) landscape of the studied karst forest showing the locations and mean elevations of the four established plots; (c) typical topographic characteristics of karst landscapes, with exposed rocky outcrops and fissures where tree roots extend deeply for establishment; (d) fisheye lens view of the forest canopy illustrating canopy structure and light conditions; and (e) a red paint mark applied to each tree for monitoring DBH increments.
-
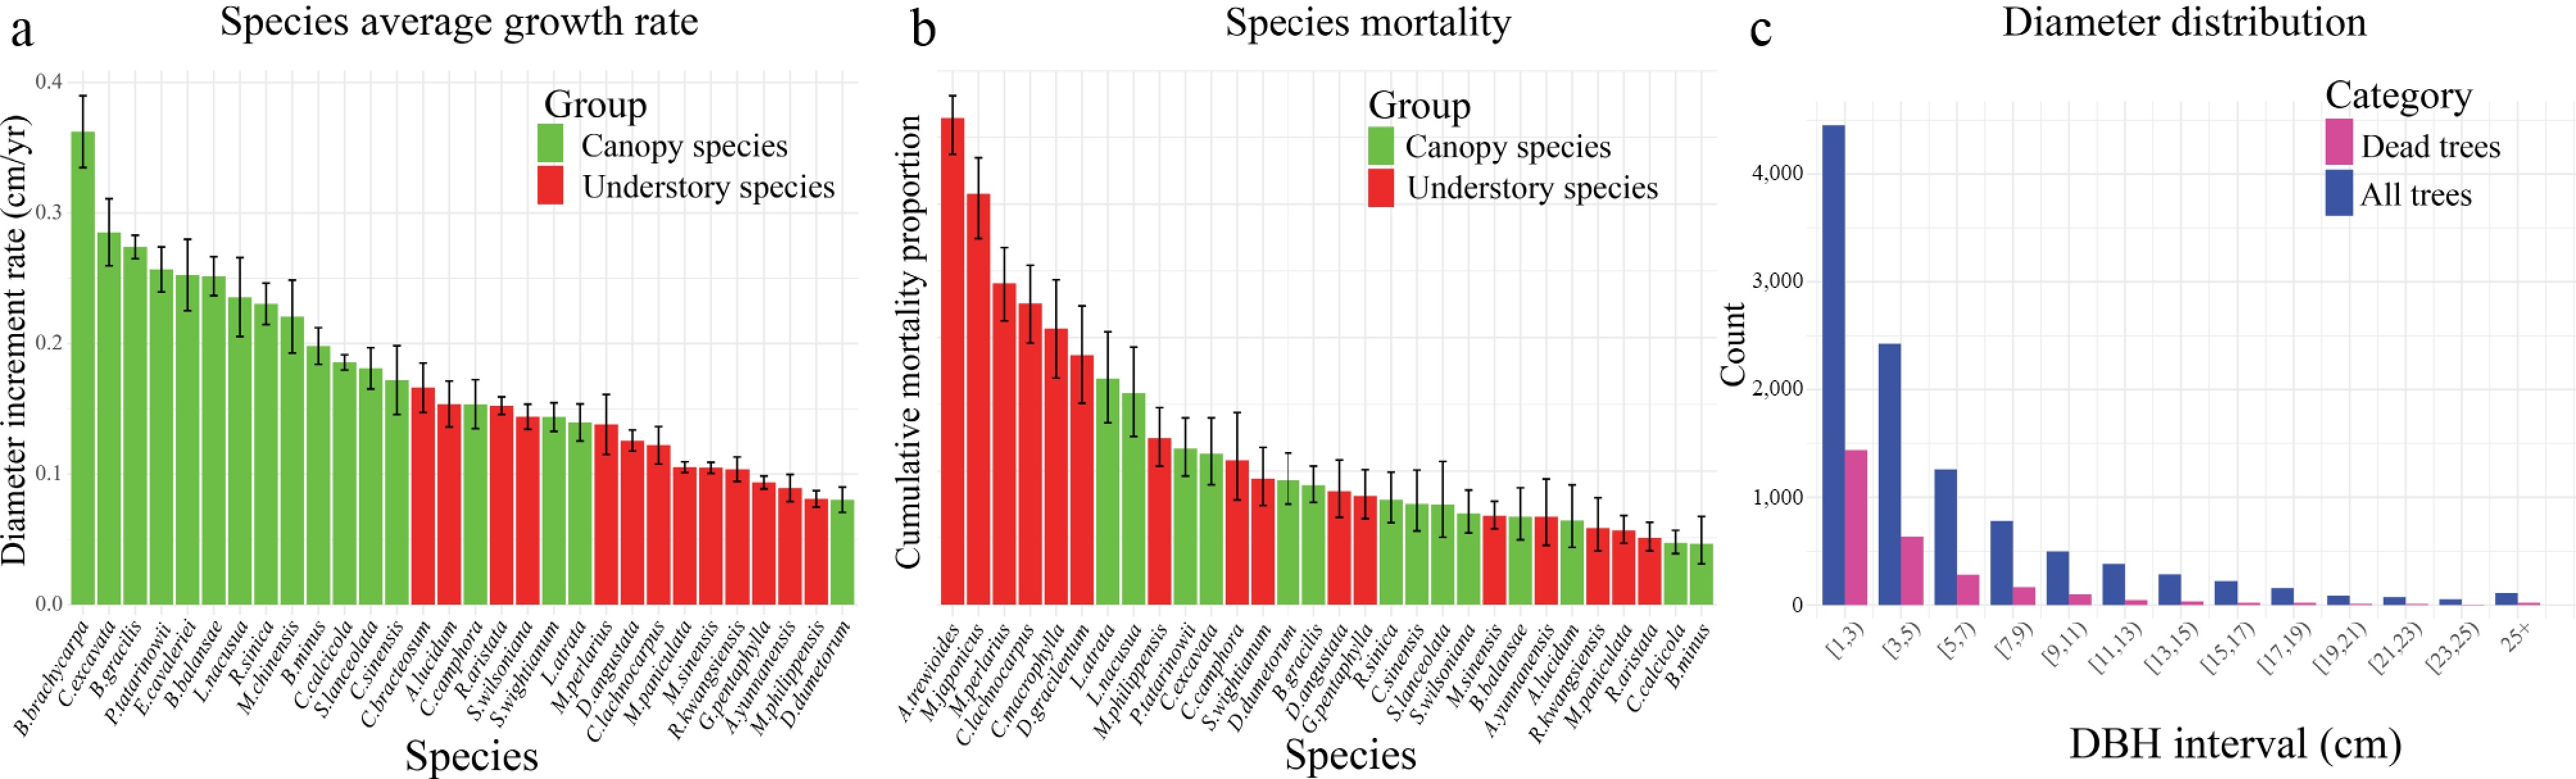
Figure 3.
General growth and mortality characteristics of different tree species and sizes in the studied forest. (a) Mean DBH increment rate with standard error bars, and (b) cumulative mortality proportion over the 6-year monitoring period with Wilson binomial confidence intervals for the most abundant species, with canopy species shown in green and understory species in red. (c) DBH class distributions for all individuals measured at the initial inventory (blue) and for trees that died during the monitoring period (purple).
-
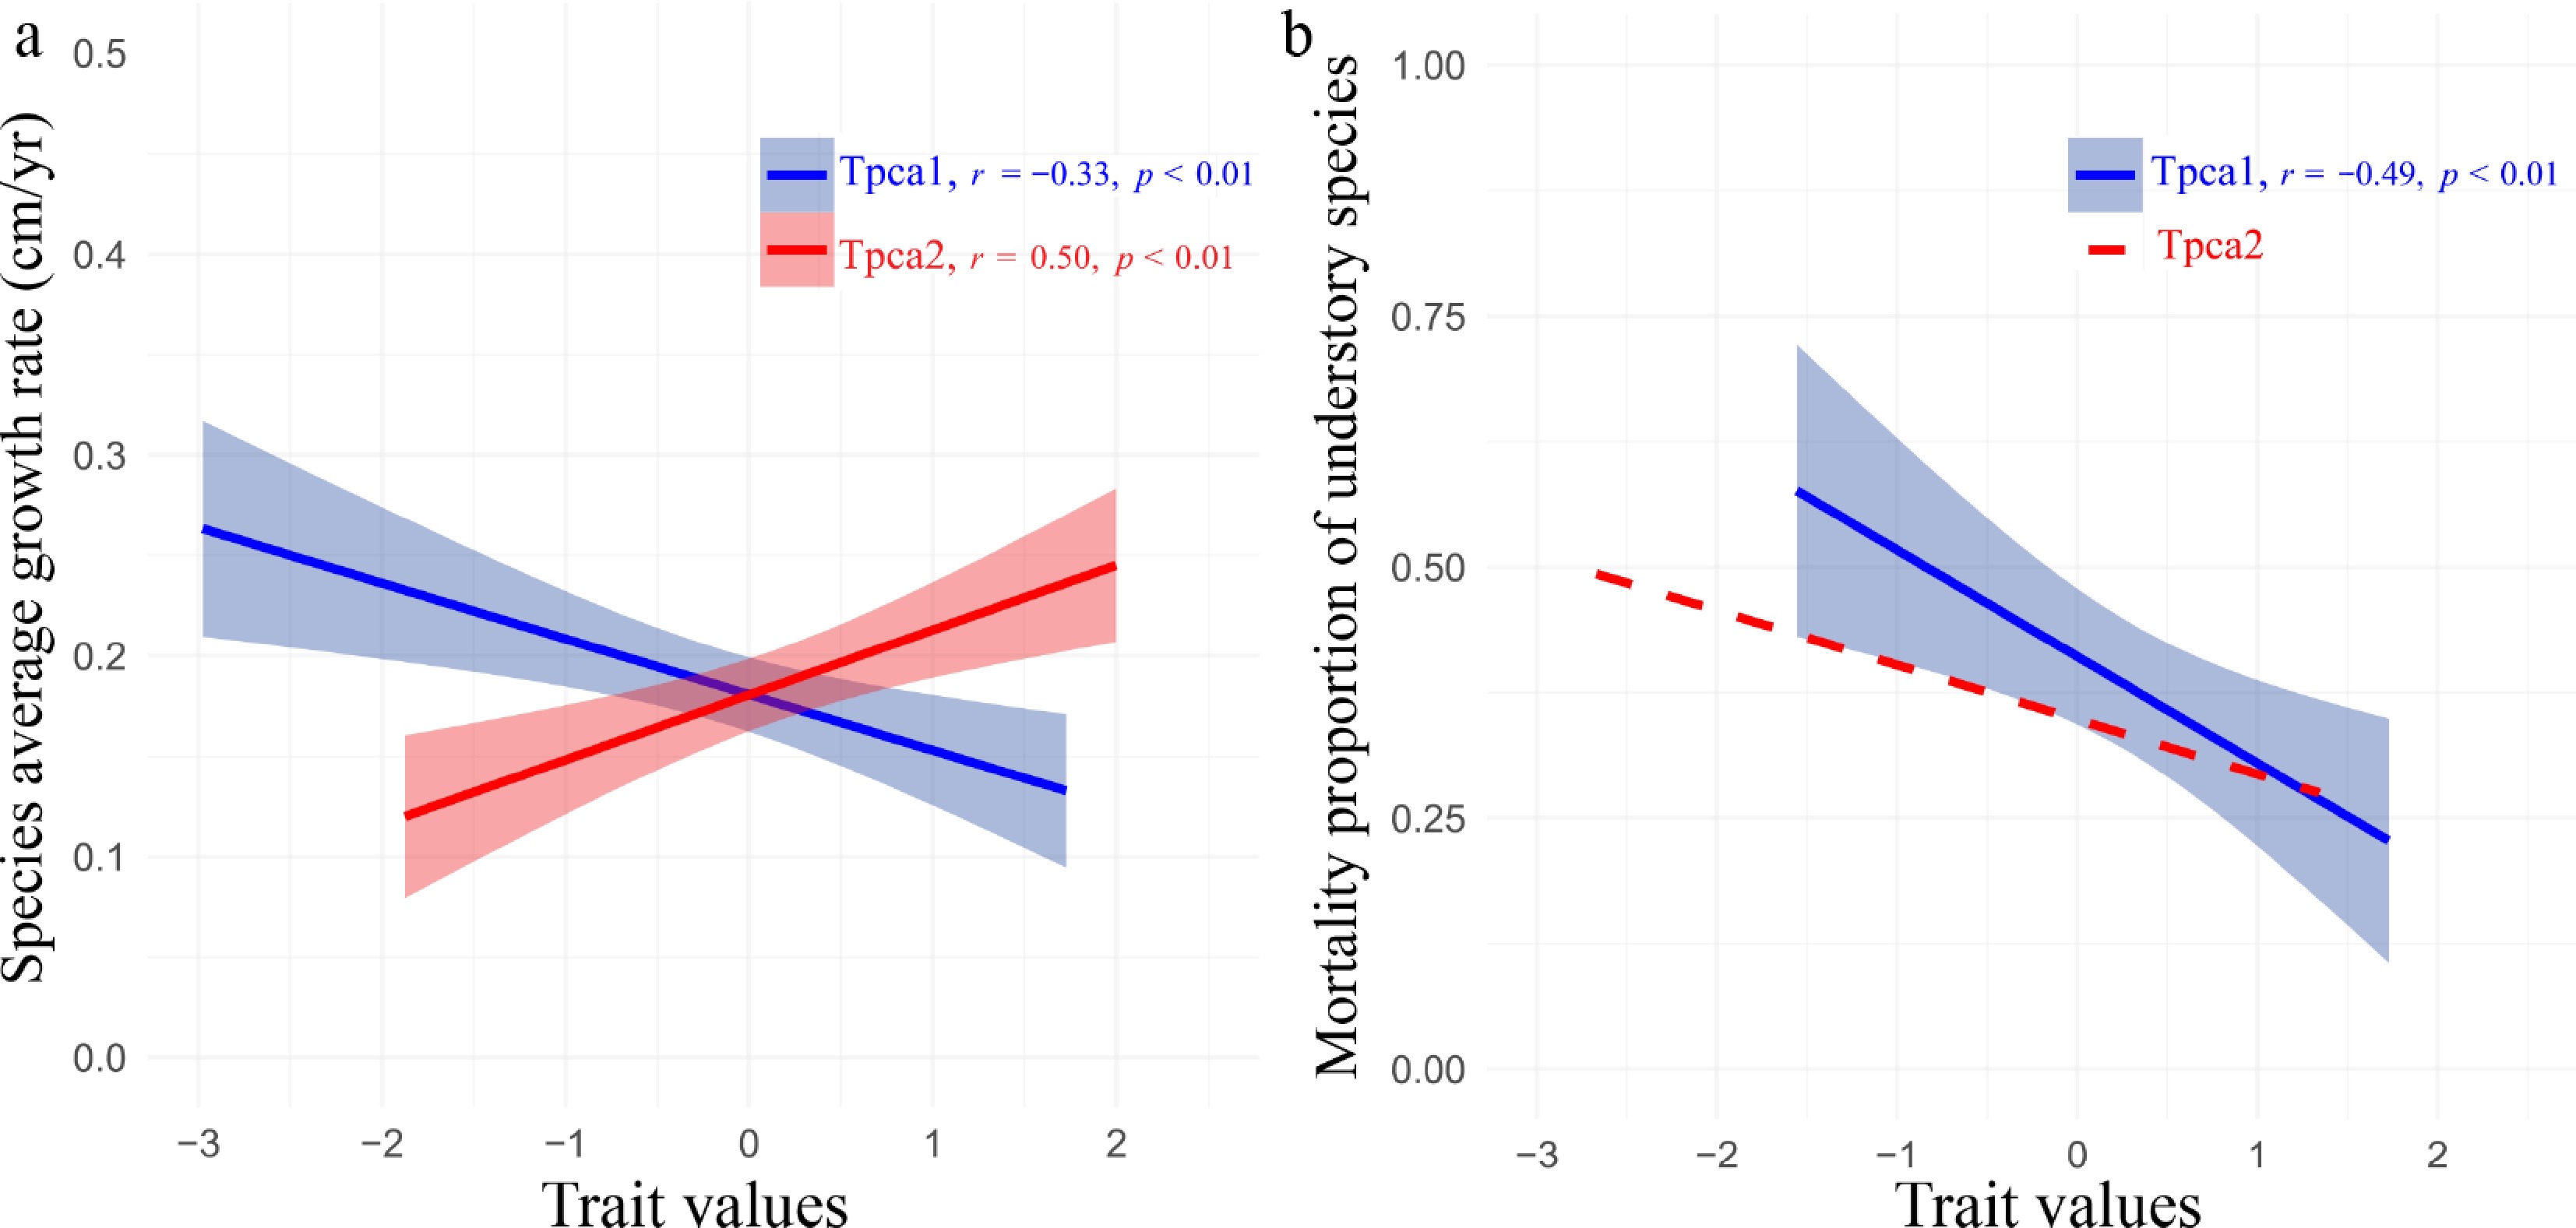
Figure 4.
(a) Relationship between functional traits and species' mean growth rates, and (b) the cumulative mortality proportion of understory species. Tpca1 and Tpca2 represent composite traits derived from PCA, with standardized values. The solid lines denote statistically significant relationships.
-
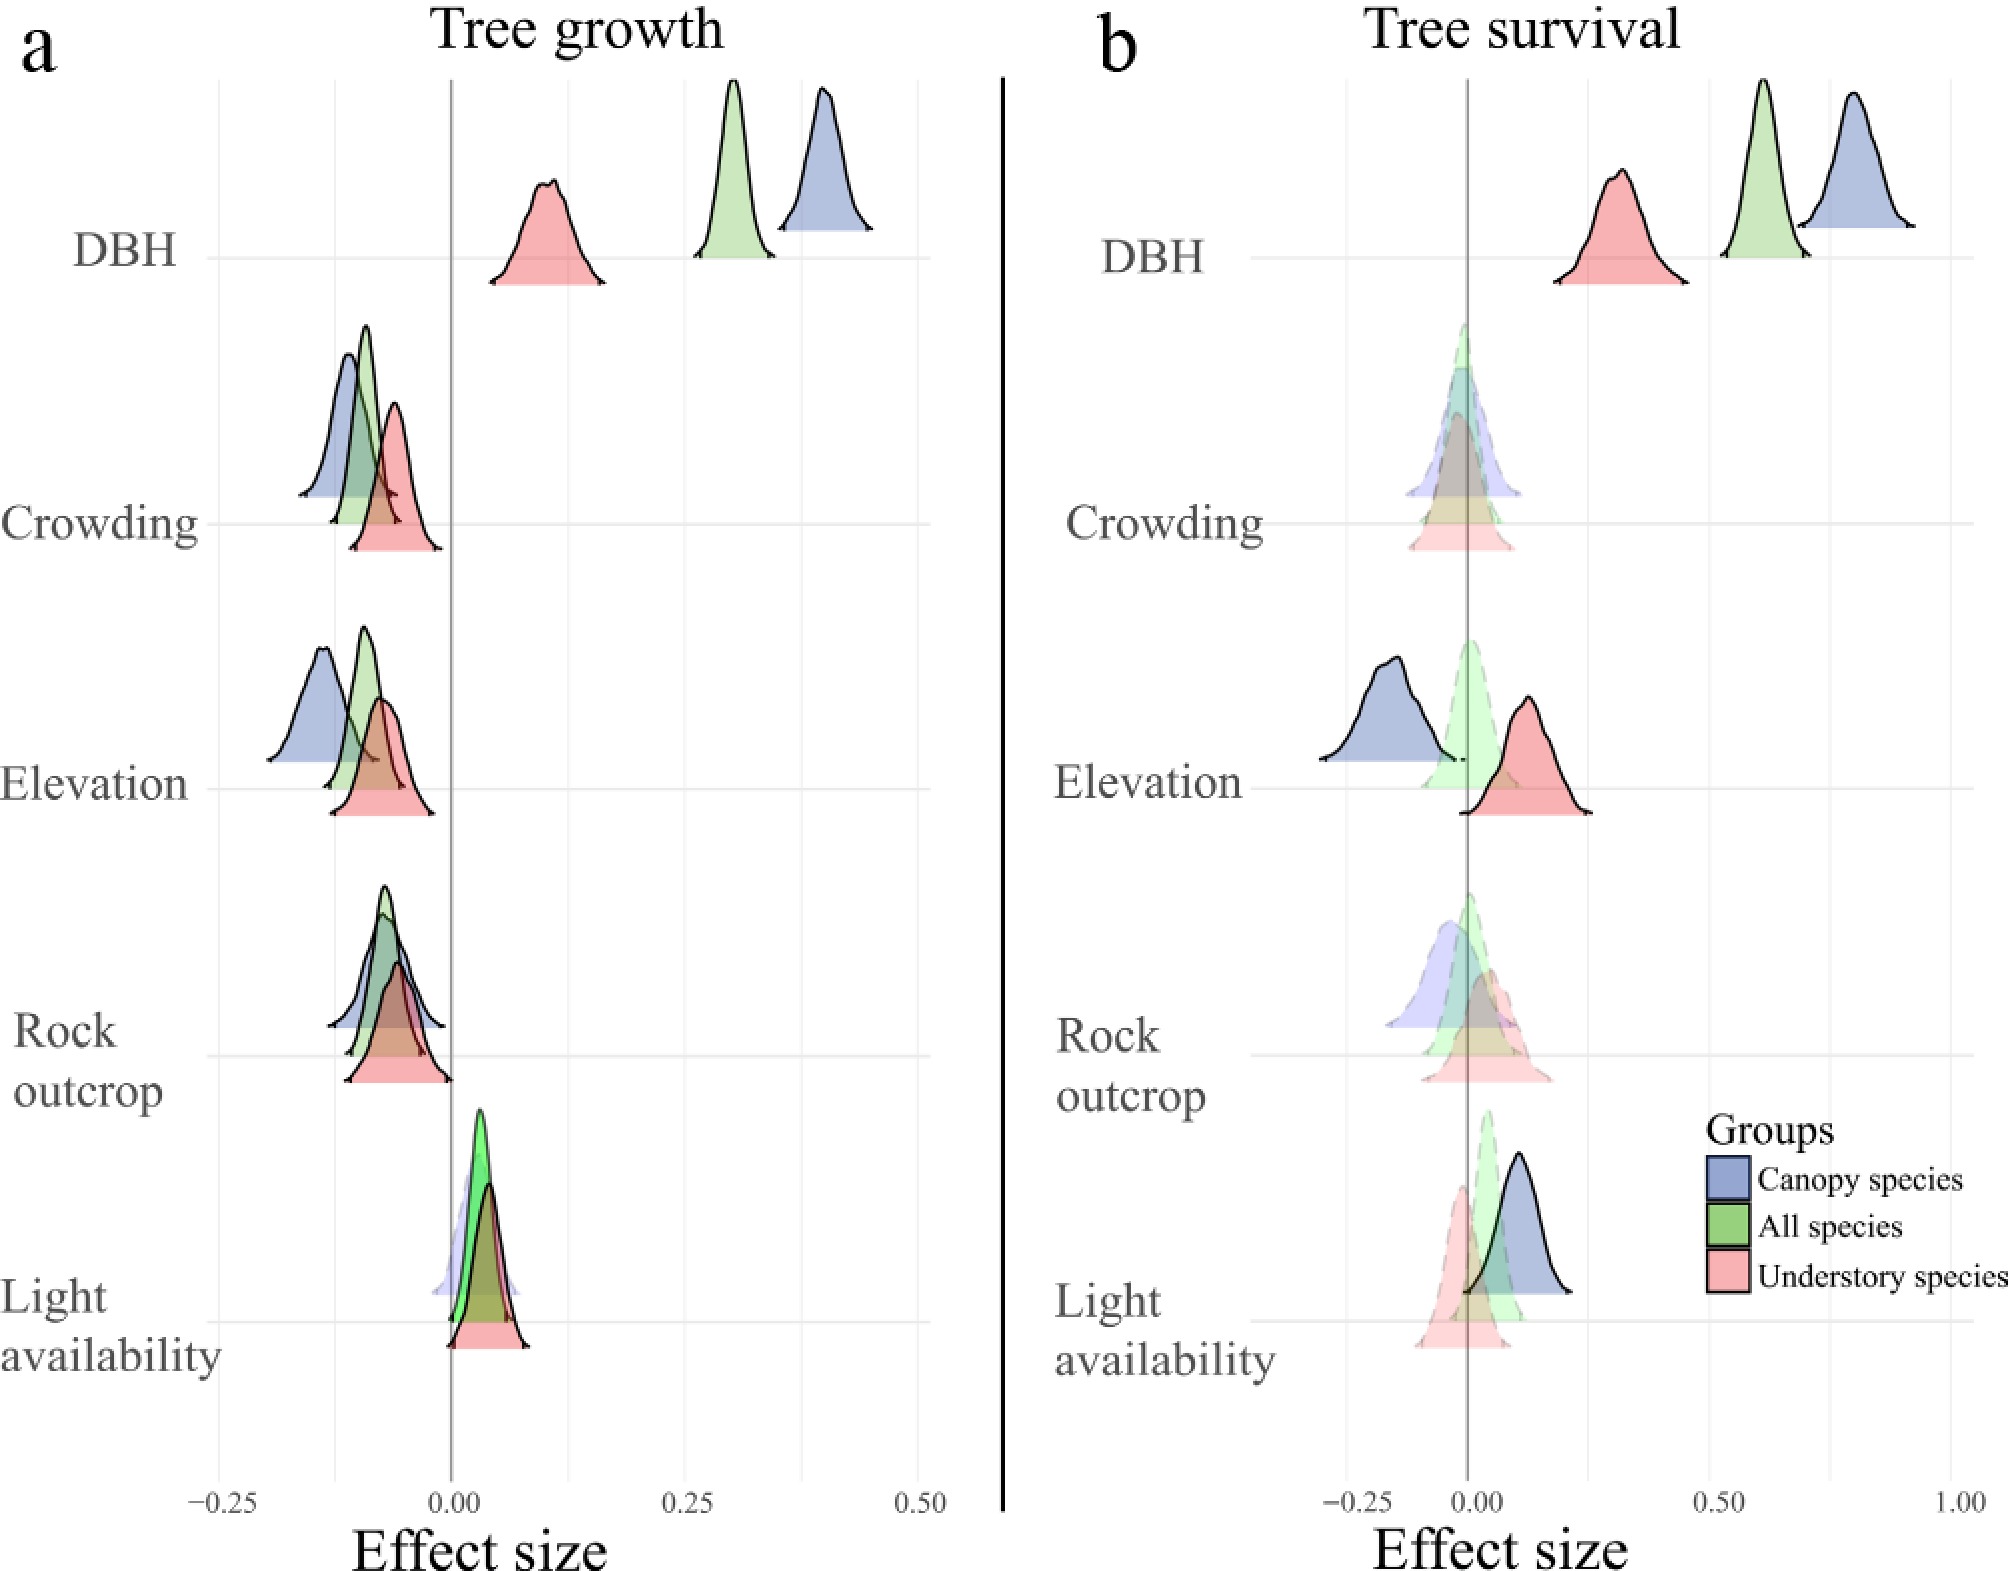
Figure 5.
Standardized effects of tree size, neighborhood crowding, and environmental factors on (a) individual tree growth and (b) survival likelihood in Model 4. The effect sizes are shown for all species (green), canopy species (purple), and understory species (light red). The solid distribution curves indicate factors with significant effects, as determined by a 99% credible interval. Only environmental variables with significant influences are presented in the figure.
-
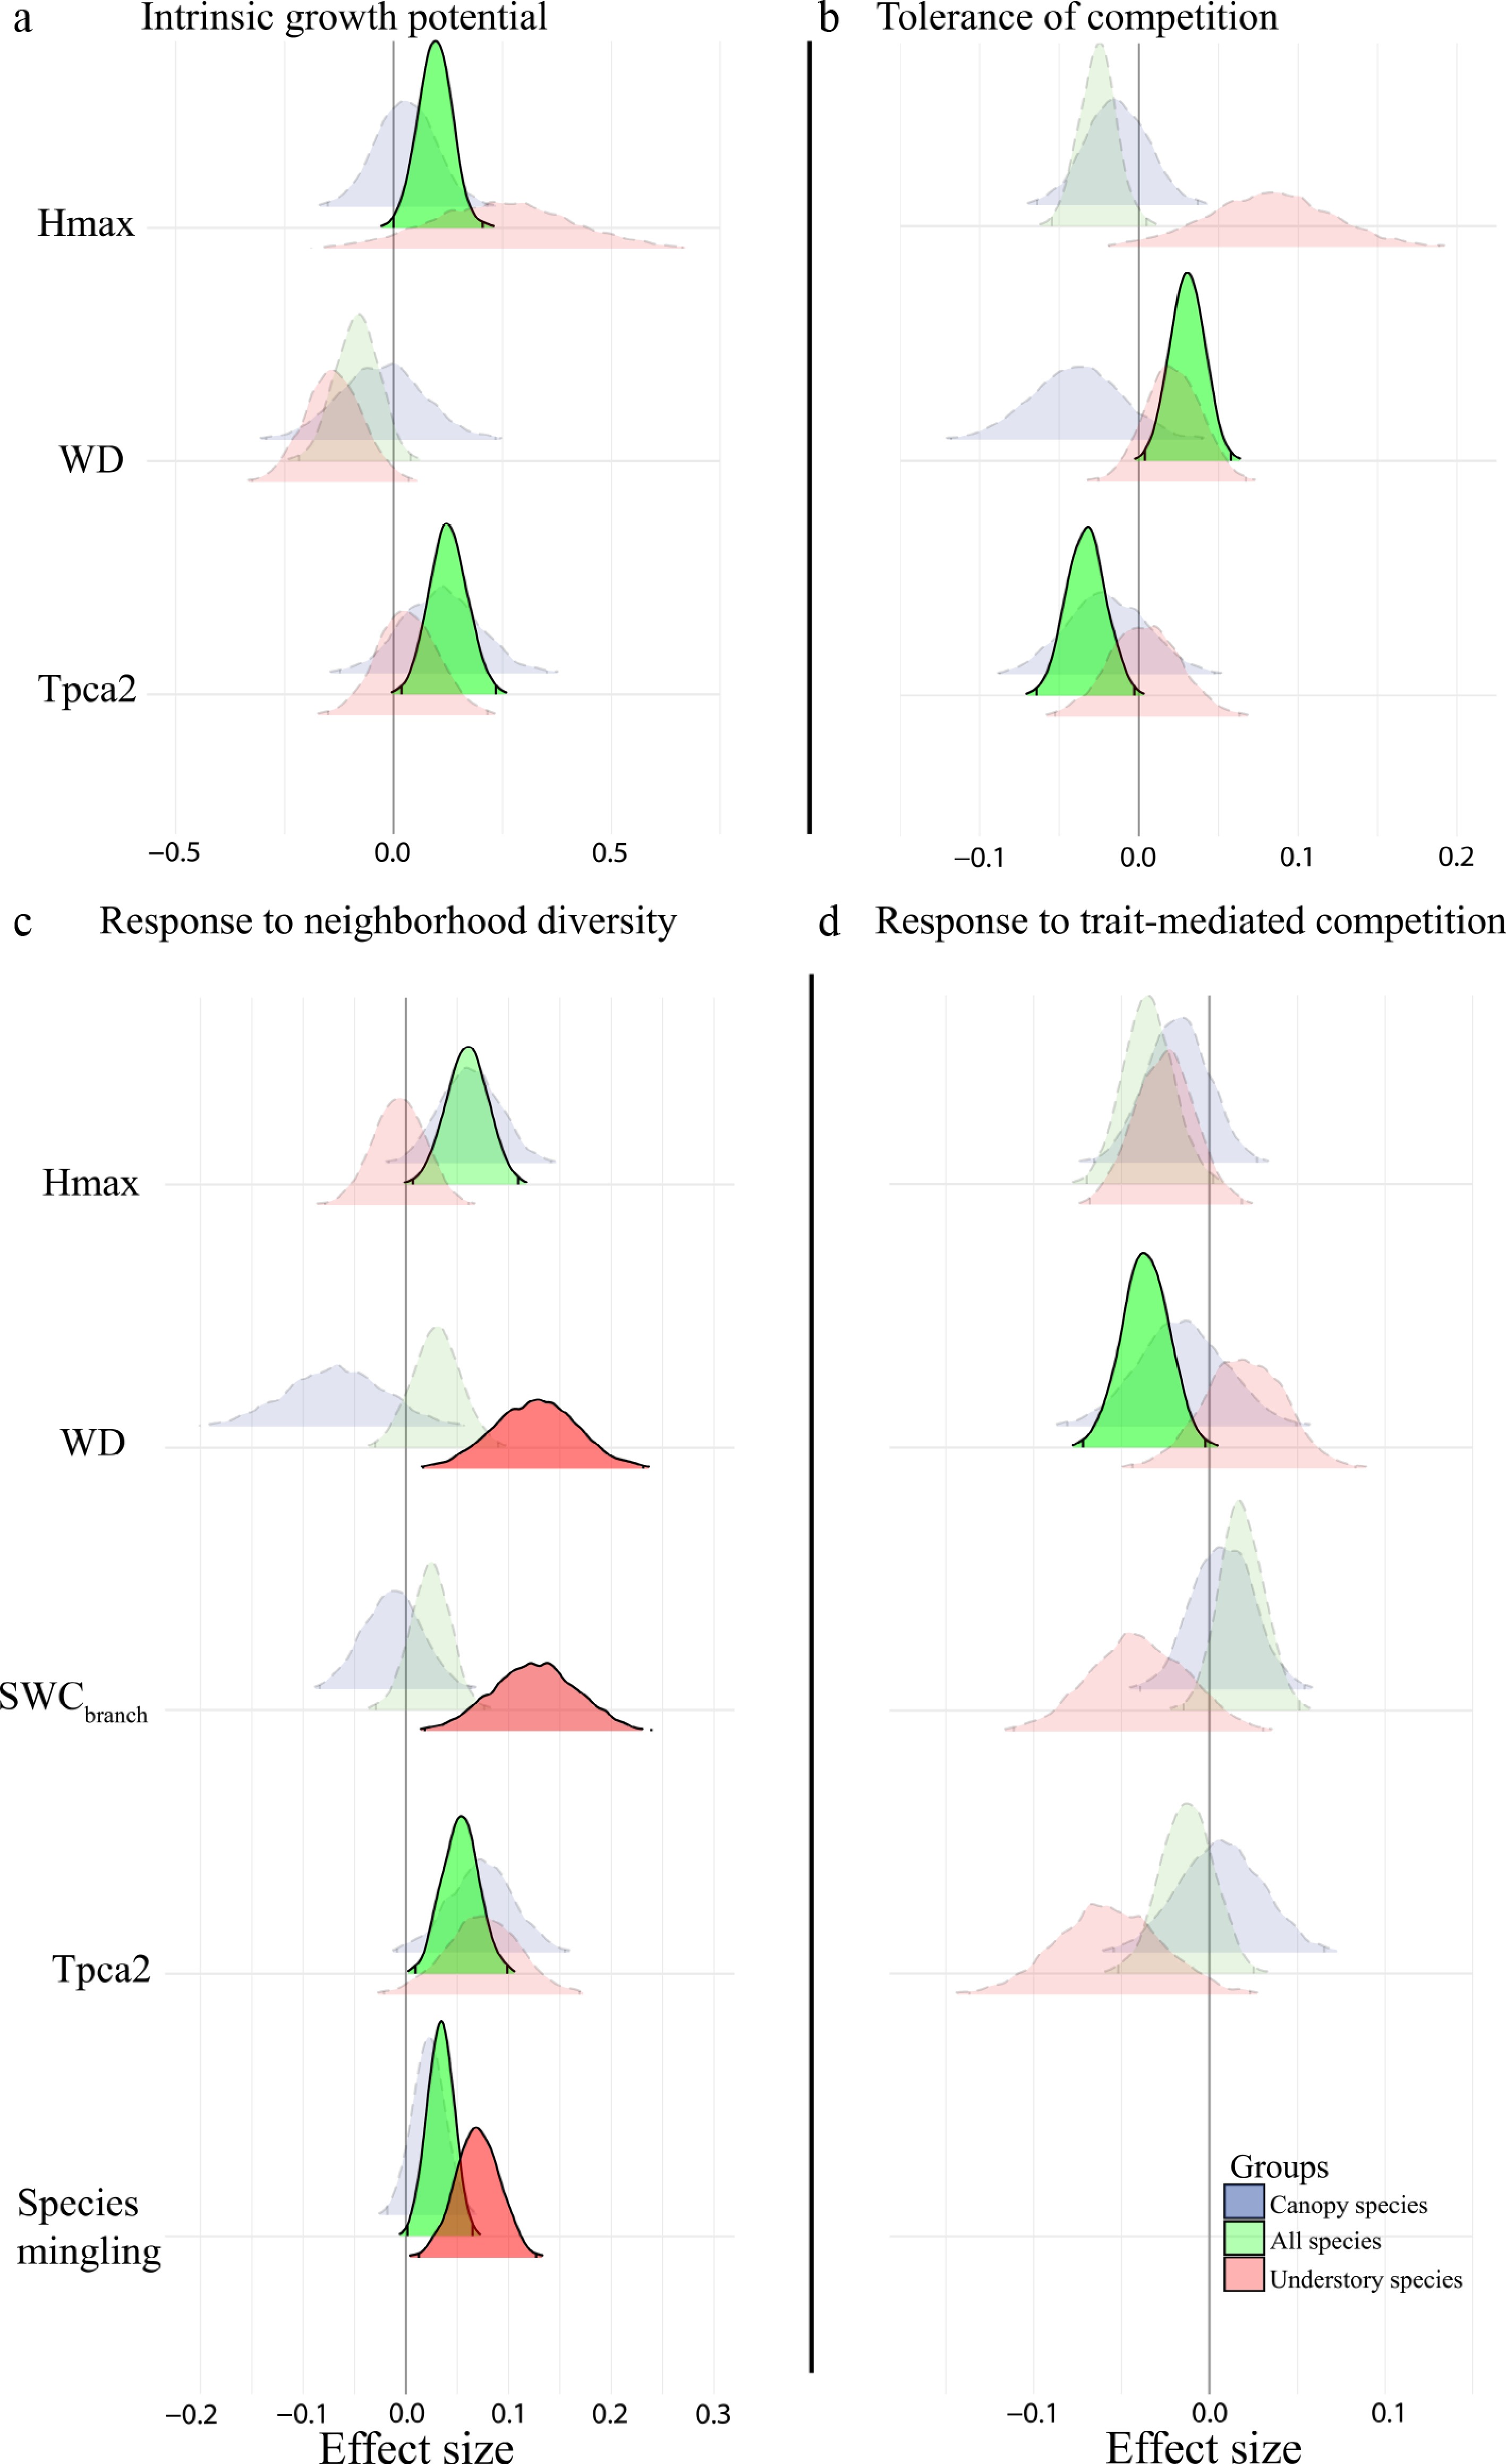
Figure 6.
Standardized effects of different traits and species mingling on tree growth. (a) Effects on species' intrinsic growth potential. (b) Effects on tolerance to neighborhood crowding. (c) Neighborhood trait dissimilarity and species mingling. (d) Trait-mediated competitive effects from neighbors. Positive values in (a)–(c) indicate positive effects on growth or crowding tolerance, whereas negative values in (d) indicate stronger competitive effects that tend to reduce focal tree growth. Each trait was evaluated separately in the model. Effect sizes are shown for all species (green), canopy species (purple), and understory species (light red). Traits with non-significant effects (based on 99% credible intervals) are not shown.
-
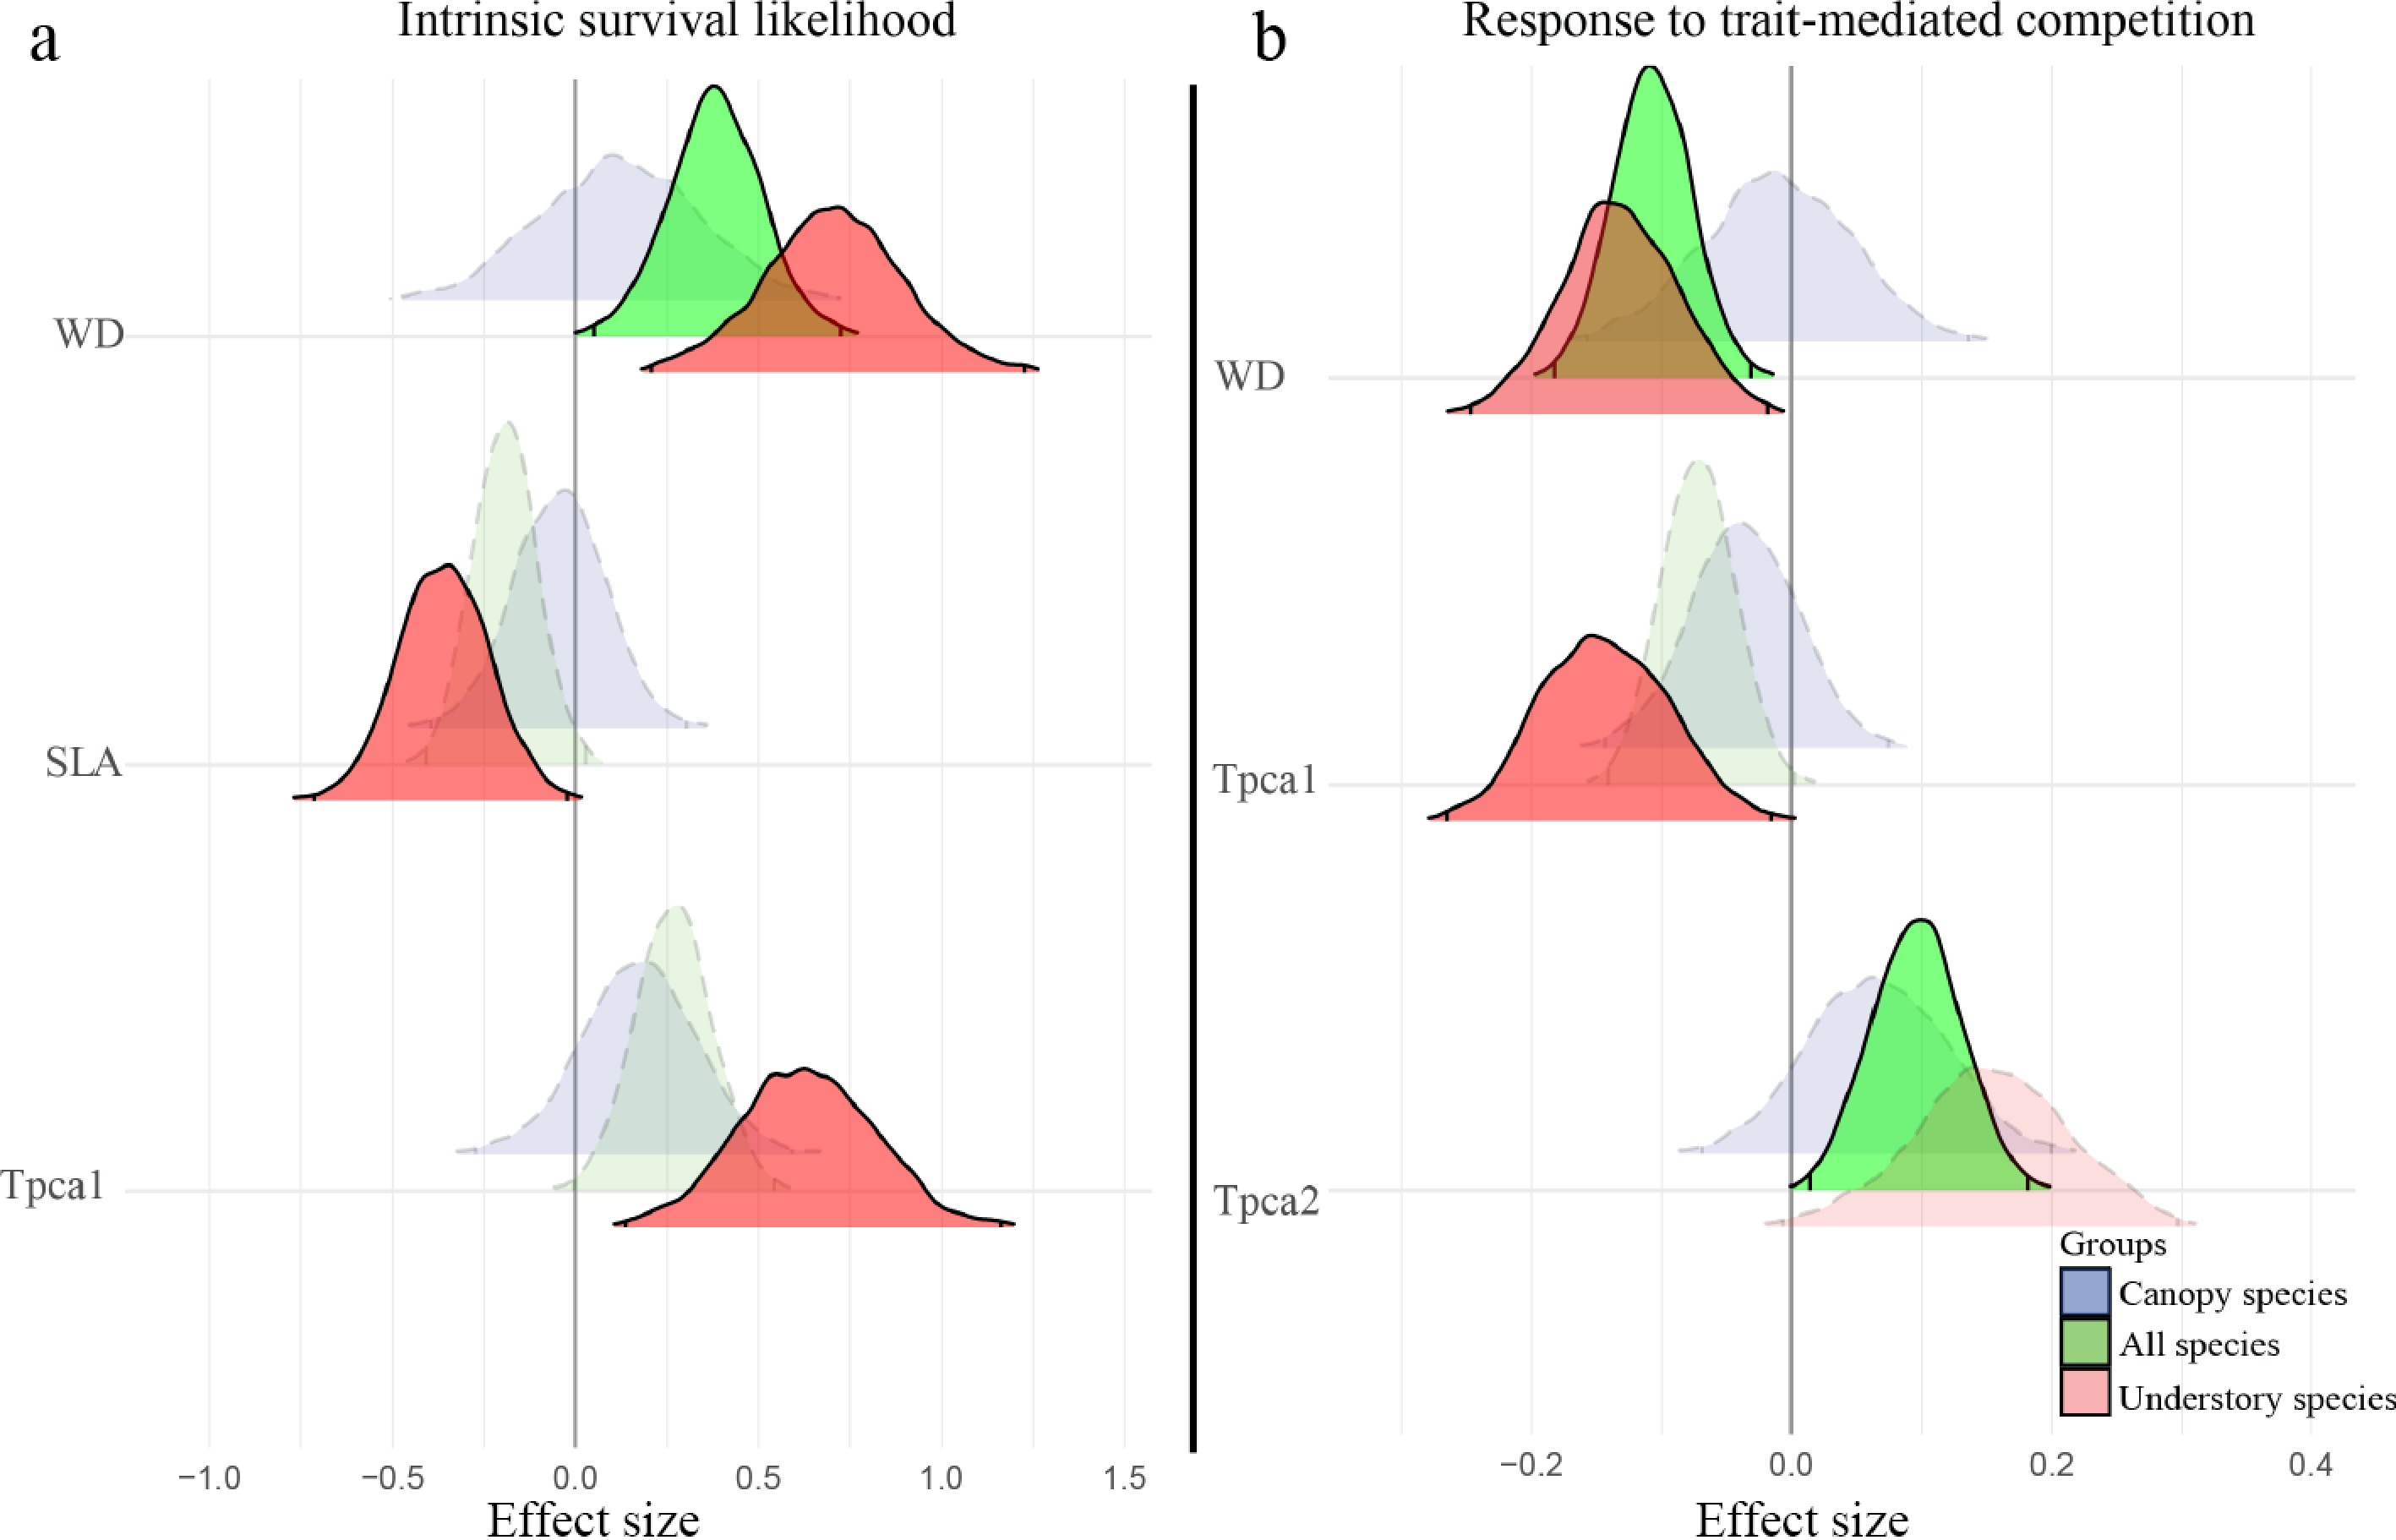
Figure 7.
Standardized effects of functional traits on tree survival. (a) Species' intrinsic survival probability. (b) Trait-mediated competitive effects from neighbors. Positive values in (a) indicate higher survival probability, whereas negative values in (b) indicate stronger negative effects that tend to reduce focal tree survival. Each trait was evaluated separately in the model. Effect sizes are shown for all species (green), canopy species (purple), and understory species (light red). Traits with non-significant effects (based on 99% credible intervals) are not shown.
Figures
(7)
Tables
(0)