














-
Understanding the mechanisms underlying the dynamics of tree growth and mortality is fundamental to forest ecology and management practices[1,2]. Tree development is influenced by inherent traits such as morphological and physiological characteristics and by local environmental conditions, including biotic stressors (e.g., neighborhood interactions, pests, and diseases) and abiotic factors (e.g., the availability of light and soil nutrients)[3,4]. Exploring these combined internal and external effects through an individual-based approach facilitates a more complete understanding and prediction of individual tree growth and survival[5,6]. Despite substantial progress in individual-based studies of tree demography, how trait-related trade-offs, neighborhood interactions, and fine-scale environmental constraints jointly influence tree growth and survival remains insufficiently understood in species-rich forests, especially in habitats under strong edaphic stress.
Karst areas are characterized by exposed bedrock, sparse and unevenly distributed soil, along with weak soil water and nutrient conservation capacity[7,8]. These extreme conditions make forest ecosystems fragile and selective, contributing to demographic filtering by generating differences among species in growth and survival, which may in turn be associated with functional traits related to resource acquisition, tissue construction, and water storage. Studies have indicated that, despite these challenges, karst forests exhibit species diversity comparable to that of other non-karst ecosystems[9,10]. Therefore, the combination of high species diversity and pronounced environmental stress in karst forests provides a useful context for examining trait-related demographic responses that may inform local community assembly.
In species-rich tropical and subtropical forests, tree life histories are highly variable among species[3,11]. Understanding such interspecific variation in tree growth and survival is a central research objective in demographic modeling and in elucidating the mechanisms underlying species coexistence[12,13]. Over the past few decades, functional ecology has promoted a shift from trait-implicit approaches to trait-based frameworks[14], with the aim of linking measurable traits to variation in plant resource acquisition strategies and adaptive responses. For example, the leaf economics spectrum (LES) and wood economics spectrum (WES) suggest that species with acquisitive traits, such as higher specific leaf area (SLA), lower wood density, and greater nutrient demand, tend to show greater growth potential than species with conservative traits, but also tend to have shorter lifespans and lower resistance to stress because of reduced investment in structural construction and defense (Fig. 1a, b)[15,16]. These fundamental theories in trait-based ecology have been widely explored, yet empirical evidence has thus far shown inconsistencies and uncertainties[17]. Although the predictive power of functional traits varies among forest types and traits examined[18], readily measurable traits (referred to as soft traits) remain widely used in theoretical ecology and applied forestry[19,20] and provide a useful basis for developing hypotheses about interspecific variation in demographic performance.
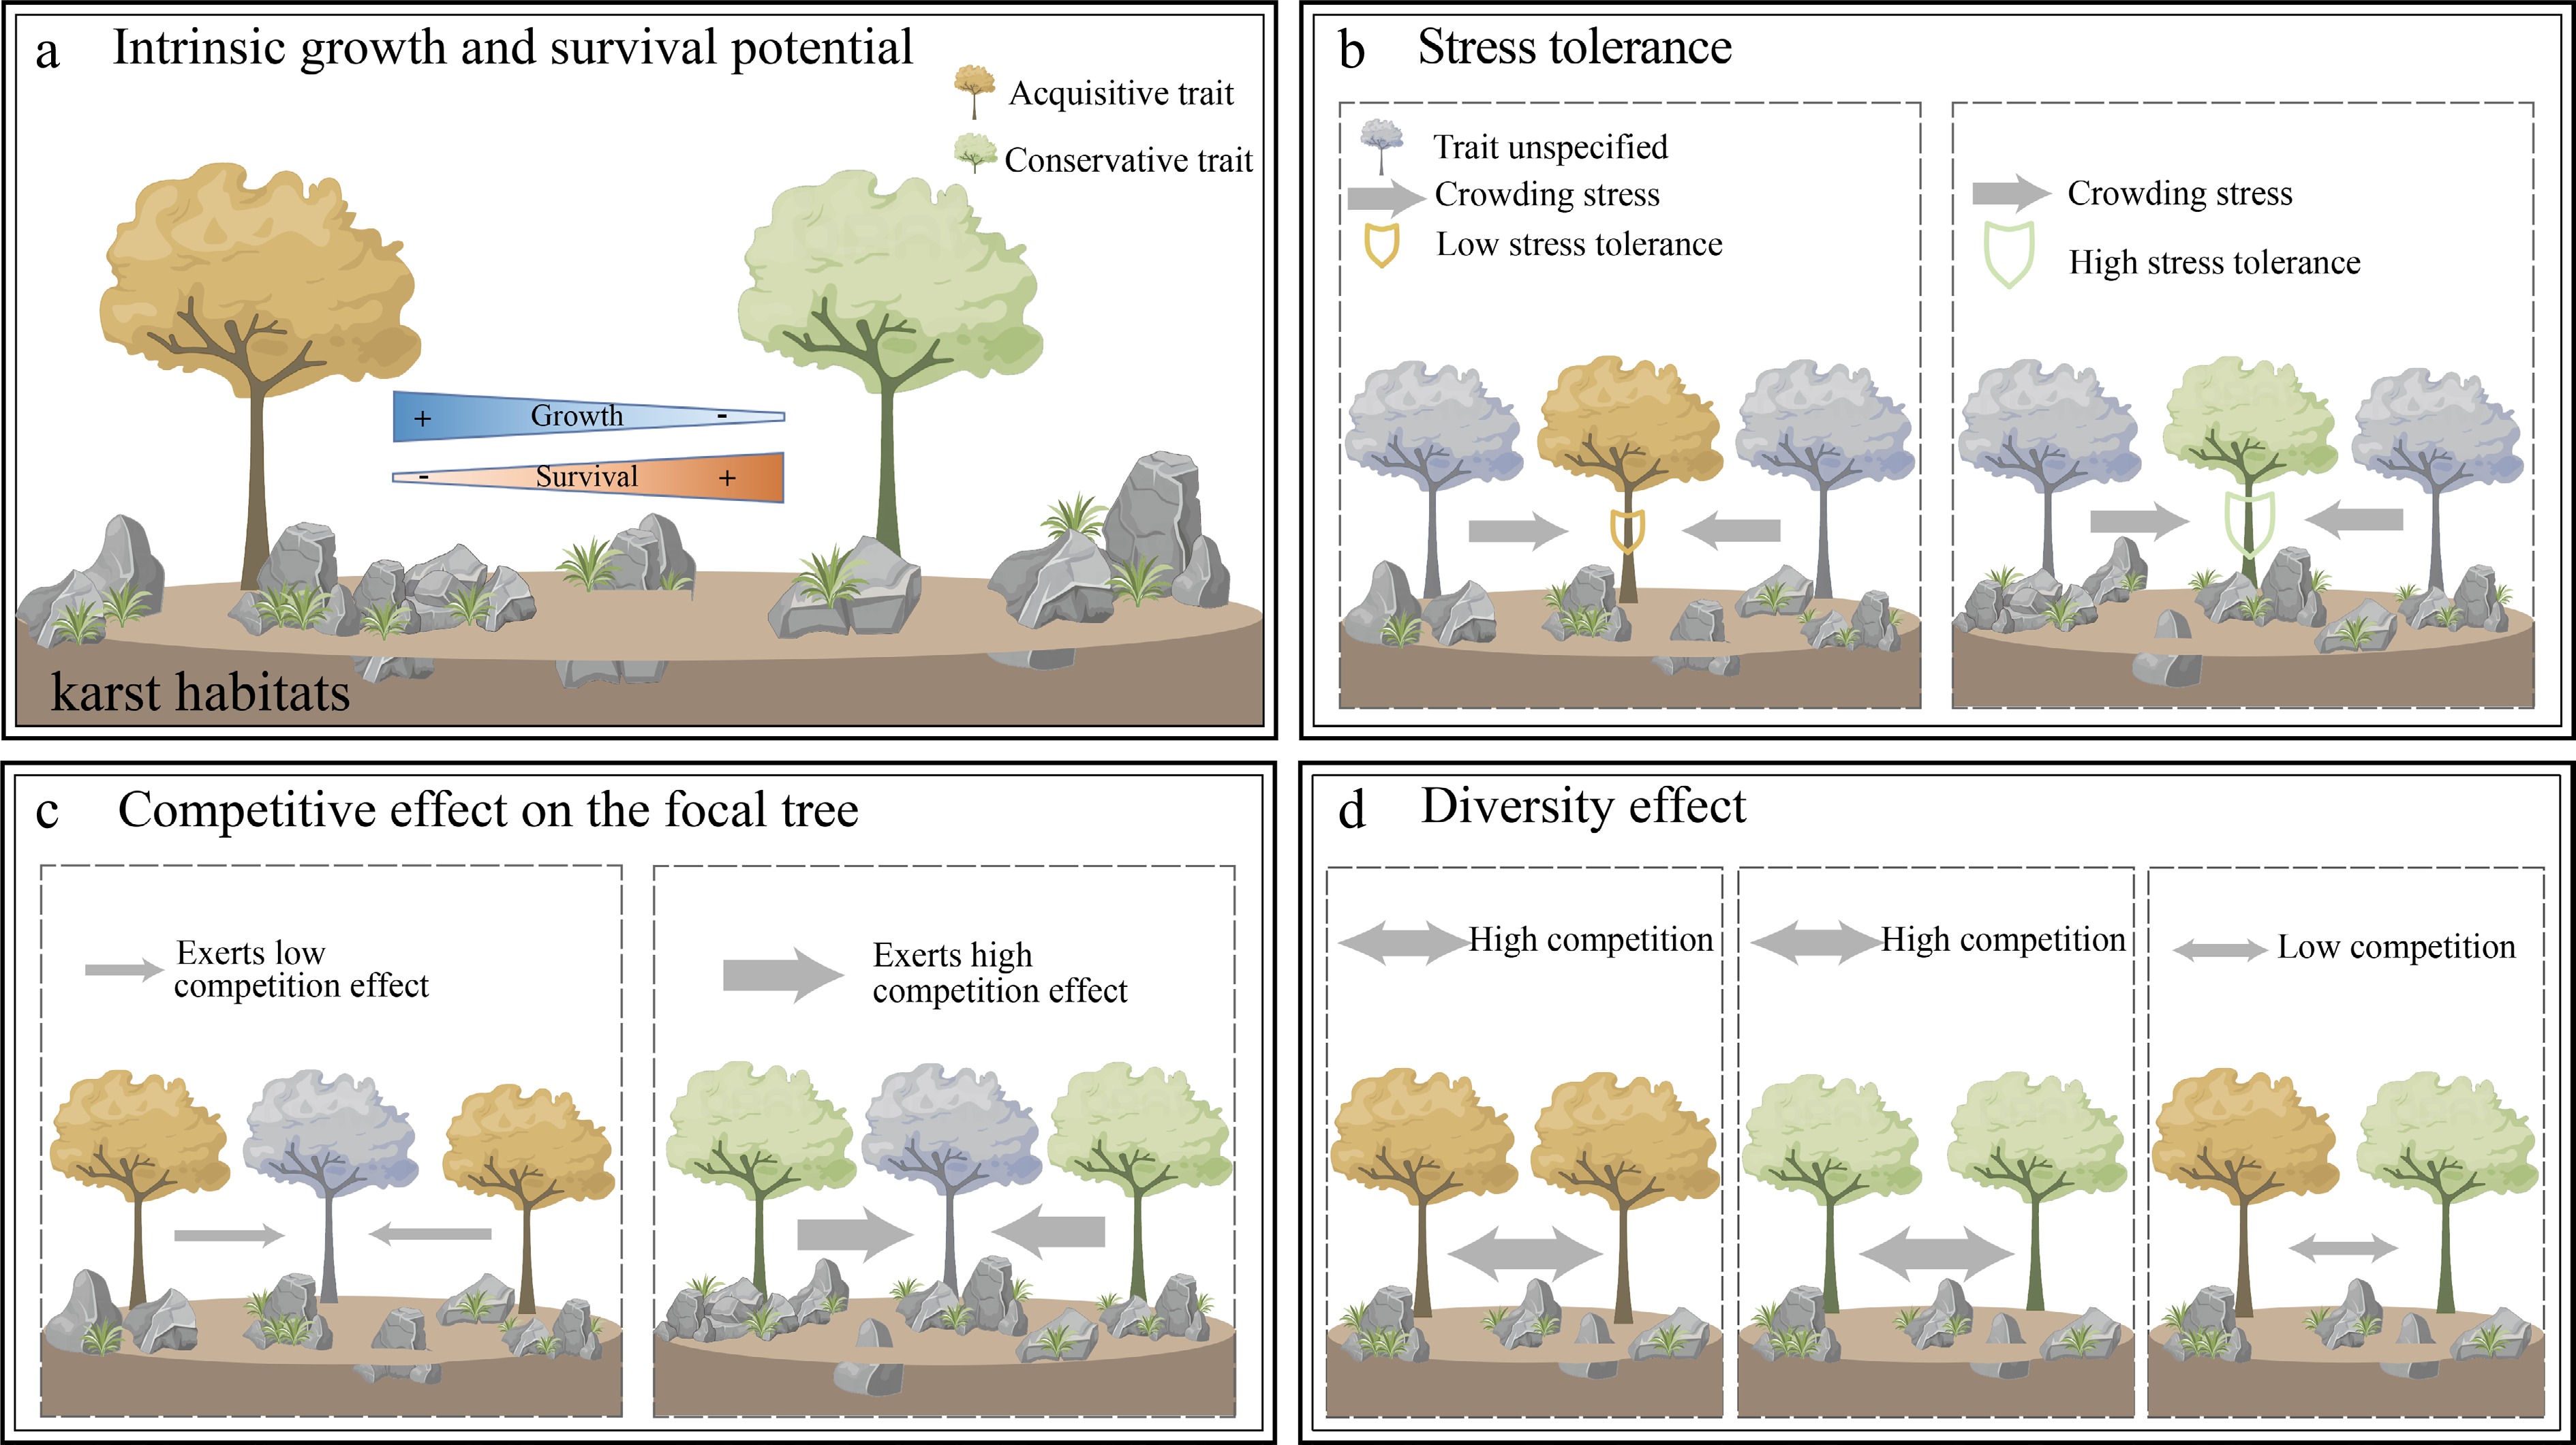
Figure 1.
Conceptual hypotheses linking functional traits to tree growth performance, survival, and neighborhood interactions (building on trait-related processes described by Lasky et al.[6] and Kunstler et al.[20]). (a) Intrinsic growth and survival potential. Species with acquisitive traits (yellow) are expected to be associated with faster growth but lower survival rates, whereas species with slow-growing, conservative traits (green) exhibit higher survival rates. (b) Stress tolerance (crowding). Species with conservative strategies have greater tolerance to neighbor crowding than acquisitive species, regardless of neighbor trait identity (gray trees). (c) Competitive effects on the focal tree. Species with conservative strategies are hypothesized to be associated with stronger and potentially more persistent negative neighborhood effects on focal trees. (d) Diversity effect. Neighborhood trait diversity/dissimilarity is hypothesized to be associated with improved focal-tree performance, potentially through reduced resource-use overlap and complementarity. The gray arrows indicate the hypothesized direction and relative strength of neighborhood effects, and the shield symbol indicates the focal tree's tolerance to stress. Trait categories (acquisitive vs conservative) represent contrasting resource-use strategies, such as variations in wood density or SLA.
Beyond their influence on intrinsic performance and general stress tolerance, trait-mediated trade-offs also extend to shaping the manifestation and strength of interactions among neighboring trees. Owing to differences in investment in crown architecture and structural reinforcement, species may differ in their capacity to exert and maintain persistent competitive effects on neighboring trees[21,22], providing a basis for trait-related differences in neighborhood competitive effects (Fig. 1c). At the same time, intense neighborhood competition may favor positive effects of trait differences through several possible mechanisms, such as niche partitioning[12], reduced host-specific enemy pressure[23,24], and facilitative interactions[25,26]. Thus, a greater mixture of traits among neighboring individuals (trait diversity) may be associated with improved tree development (Fig. 1d). These two potentially concurrent ecological processes—trait-related competitive differences and diversity-related neighborhood effects—may jointly shape tree interactions, and their relative importance may depend on the type and severity of resource limitation[27]. In karst forests, such context dependence may be particularly important because of the strong edaphic constraints and fine-scale habitat heterogeneity. Many previous studies have focused on examining the positive effects of local diversity on individual development and forest productivity[28,29], whereas the role of trait-related hierarchical competition effects has remained relatively underexplored. In highly stressful yet species-rich karst ecosystems, how these trait-mediated tree interactions influence tree growth and survival remains an insufficiently explored question.
In stratified natural forests, species occupying different vertical layers typically exhibit distinct life-history strategies and growth trajectories, shaped by heterogeneous vertical environmental conditions and resource-use strategies[30,31]. For example, in early successional tropical forests, pioneer canopy species are commonly large-statured, light-demanding, deciduous, and acquisitive in terms of resource use[21,32], relying on rapid height growth and high responsiveness to resource availability. Thus, their development is generally more sensitive to initial size and environmental stressors, including light availability, neighborhood crowding, and soil gradients. In contrast, understory species, which often adopt a more conservative strategy, tend to optimize resource use efficiency and may respond more consistently to biotic and abiotic factors[33,34]. In addition to differences in life-history and resource-use strategies, differences in tree size distribution may further complicate the demographic contrasts between canopy and understory species. Canopy species are frequently subjected to intense environmental filtering during the seedling stage, resulting in a lower density of small individuals and a stable cohort of large surviving trees[35,36]. Conversely, high shade tolerance in understory species allows the accumulation of abundant small-diameter individuals, yet these individuals often suffer high short-term mortality due to intense competition in the understory. These distinct differences in stature, size distribution, and resource-use strategy suggest that understory and canopy species may differ substantially in their growth and survival responses to explanatory factors, thereby motivating separate analyses for the two broad stature groups in the demographic models.
In this study, we monitored the growth and mortality of individual trees in a species-rich karst forest in southern China. Under resource-limited karst conditions, restricted rooting space and unstable soil-water availability shape species' ecological strategies through coordinated adjustments in light utilization, tissue construction, hydraulic efficiency, and stress resilience. We therefore focused on five key functional traits linked to tree growth and survival: species maximum height (Hmax, reflecting species stature and light access potential), specific leaf area (SLA, indicating photosynthetic efficiency and leaf construction costs), wood density (WD, reflecting wood structure investment, aspects of hydraulic functioning related to embolism resistance), leaf dry matter content (LDMC, complementing SLA by representing leaf construction investment and tissue toughness), and branch saturated water content (SWCbranch, reflecting branch water storage potential under water stress). Together, these traits represent several major aboveground functional dimensions relevant to tree demographic performance, while adaptation to karst water and nutrient limitations involves a broader range of functional dimensions[37], including belowground resource acquisition, xylem hydraulics, and leaf nutrient use. Using an individual-based modeling approach, we examined how the studied functional traits, neighborhood spatial structures, and environmental variables jointly influence tree growth and survival. Guided by the conceptual framework shown in Fig. 1 and the trait-based expectations outlined above, we hypothesized that interspecific differences in growth and fitness would be associated with functional traits; acquisitive species may show greater growth potential but lower survival likelihood than species with more conservative traits (Fig. 1a), and may also exhibit reduced tolerance to crowding and weaker competitive effects on neighboring individuals (Fig. 1b, c). We further hypothesized that, while low resource availability and neighborhood crowding are key stressors in karst habitats, neighborhood diversity—in terms of either species or functional trait diversity—may help mitigate competition and improve focal tree performance (Fig. 1d). Finally, we expected that the relative importance of these trait-mediated effects, neighborhood interactions, and environmental factors would differ between canopy and understory species, resulting in contrasting growth and survival responses.
-
The forest monitoring plots are located in the Mulun National Nature Reserve (25°06'09'' N−25°12'25'' N, 107°53'29'' E−108°05'42'' E), a mid-subtropical area in Huanjiang County, Guangxi Zhuang Autonomous Region, China (Fig. 2). The reserve has an area of 10,829.7 ha and contains a mixed evergreen and deciduous broad-leaved forest under a typical warm and humid subtropical climate. Karst peak clusters and depressions, consisting of limestone, are typical terrain features in the forest. The elevation ranges from 250 to 1,028 m above sea level. On the basis of the climate dataset provided by Peng et al.[38], the mean annual temperature during 2015–2017 was estimated to be 18.2 °C, and the average annual precipitation ranged from 1,185 to 1,354 mm across elevations. The rainy season lasts from April to October, accounting for 72% to 80% of the total annual rainfall. The forest has a vegetation cover of 95.4%[39], though understory tree density is relatively low compared to other subtropical non-karst forests. The dominant tree species include Pteroceltis tatarinowii Maxim., Boniodendron minus (Hemsl.) T. Chen., Radermachera sinica (Hance) Hemsl., and Tarenna depauperata Hutchins. Forests in the reserve have been strictly protected since 1990, with logging completely prohibited. The forest dynamics are considered to be driven by small-scale natural processes, and the current forests exhibit typical secondary characteristics after decades of natural regeneration.
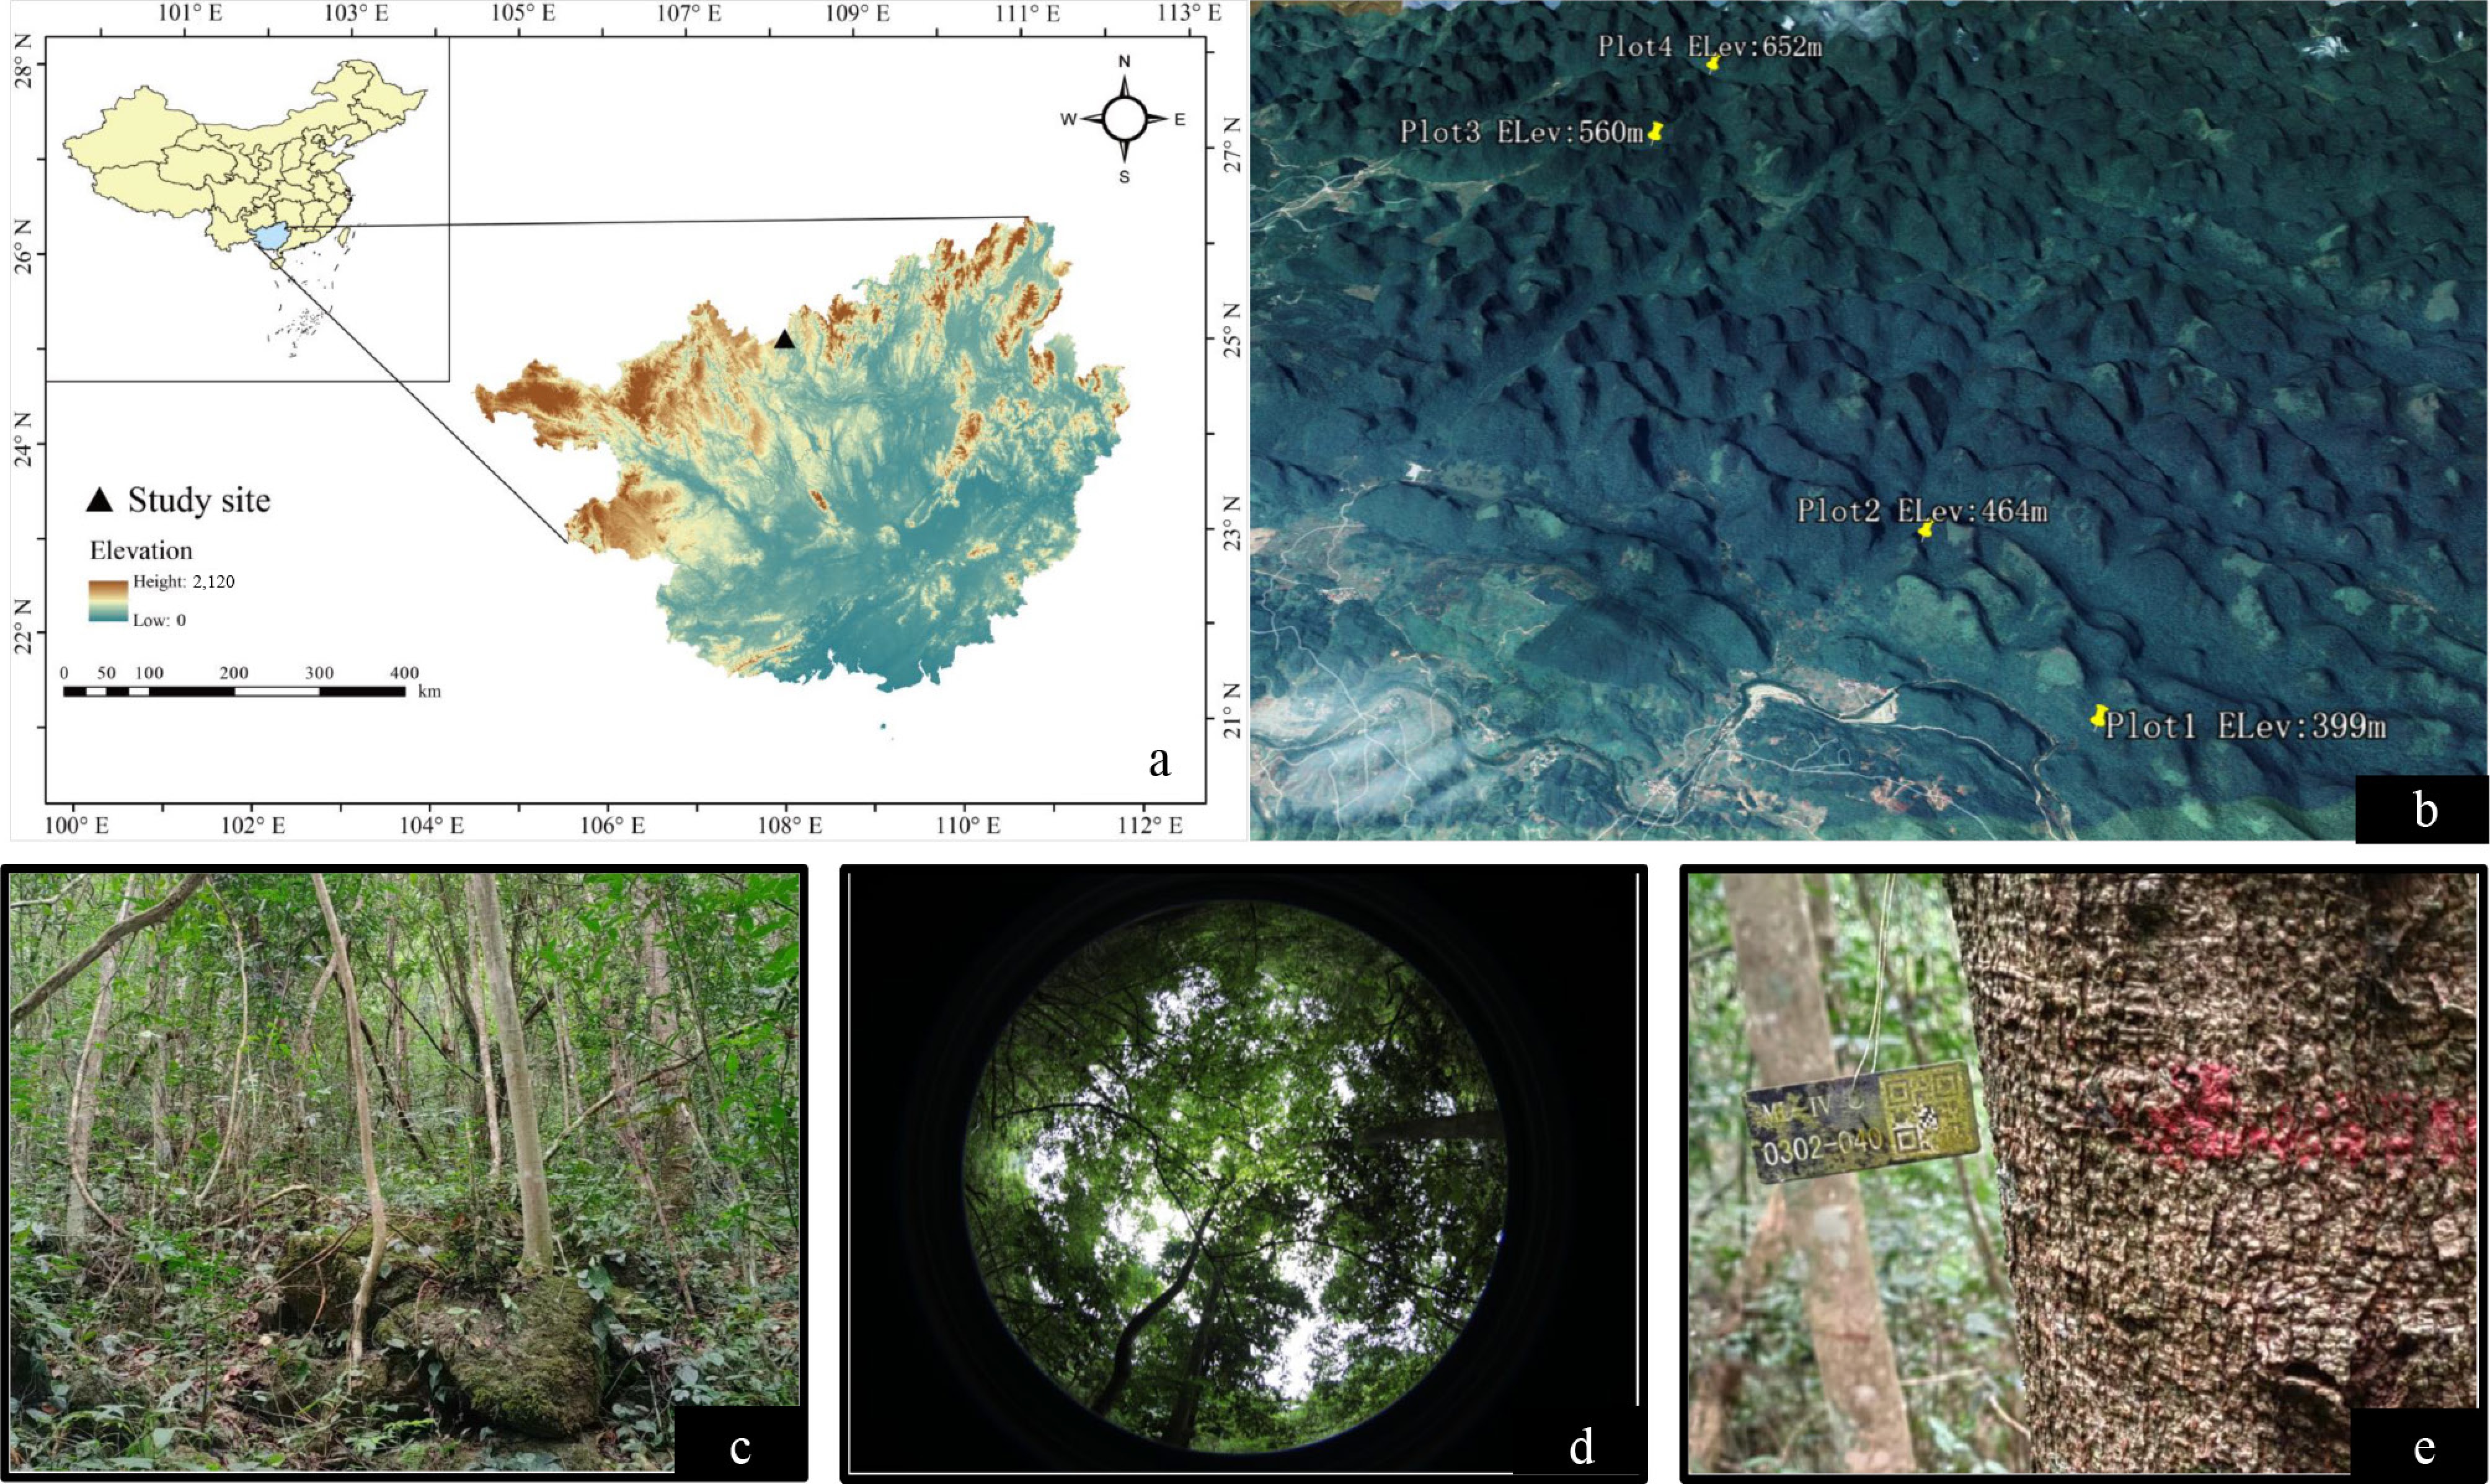
Figure 2.
(a) Map of China and the Guangxi Zhuang Autonomous Region showing the location of the study site (Map source: National Geomatics Center of China; the map was prepared by the authors in R); (b) landscape of the studied karst forest showing the locations and mean elevations of the four established plots; (c) typical topographic characteristics of karst landscapes, with exposed rocky outcrops and fissures where tree roots extend deeply for establishment; (d) fisheye lens view of the forest canopy illustrating canopy structure and light conditions; and (e) a red paint mark applied to each tree for monitoring DBH increments.
In 2017, four spatially separate 1-ha (100 m × 100 m) monitoring plots at different elevations (ranging from 364–693 m) were established following the CTFS Global Forest Biodiversity Monitoring protocol. All the trees and shrubs with a diameter at breast height (DBH) ≥ 1 cm were tagged, numbered, and mapped, and their species and DBH were identified and recorded. In 2023, we remeasured the tagged individuals in these plots and recorded their DBH and survival status. During the initial survey in 2017, a red paint mark was applied along the DBH circumference of each tree to ensure that subsequent DBH measurements were taken at the same position, which minimized measurement errors in DBH increments. If substantial discrepancies in DBH readings between the two surveys were found, we conducted a detailed check and remeasurement.
Measurements of environmental factors
-
Topographic factors, including elevation and slope, were calculated for each 20 m × 20 m subplot within the forest plots. The elevation at the center of each quadrat was determined from the coordinates of the four corners by kriging interpolation. Slope was determined as the average inclination angle derived from elevation differences among the four corner points of each quadrat and was therefore used to represent broad quadrat topography. Rock outcrop coverage was calculated based on actual terrain conditions. During field surveys, the positions and areas of rock outcrops within each 20 m × 20 m quadrat were manually delineated on printed maps using tree coordinates as a spatial reference. The delineated maps were subsequently scanned into PDF files, which were further processed and converted into vector graphics using ImageJ software to calculate the outcrop coverage rate (%) for each quadrat. Soil depth was measured at five points along the diagonal and at the center of each quadrat, avoiding rock outcrops. A steel rod was driven into the ground until it hit belowground rock, and the depth was recorded with a measuring tape to determine the average soil depth.
Light conditions were measured using an EOS 80D single-lens reflex camera (Canon, Tokyo, Japan) with a Sigma 4.5 mm F2.8 EXDC fisheye lens converter (Sigma Corporation, Kawasaki, Kanagawa, Japan). The camera was positioned 2 m above the ground on a tripod and aligned toward the north using a compass. In each quadrat, we took three hemispherical canopy images at each quarter point and the midpoint on the diagonal line of each quadrat, yielding a total of 15 images per quadrat. Photographs were taken at sunrise or sunset on sunny days to avoid direct sunlight. We analyzed the images using Hemiview 2.1 software to calculate the visible sky index (VisSky, the proportion of the sky visible through the canopy) and leaf area index (LAI). Given that these two indices were highly correlated (r = −0.8), we performed a principal component analysis (PCA) and used the first principal component (accounting for 90.6% of the variance) as a composite indicator of light conditions in each quadrat. Higher values indicated greater canopy openness and light availability (higher VisSky and lower LAI). These measured environmental variables represent the general topographic, substrate, and light conditions at the 20 m × 20 m subplot scale.
Measurements of functional traits
-
For each species, 5–10 healthy, mature individuals were selected across the four plots for trait measurements, depending on species occurrence and availability. For each sampled tree, we collected 2−3 branches (150–200 cm long) from the crown using a telescopic pruner extendable to 25 m. Subsequently, approximately 40–50 cm sunlit branch sections with mature and healthy leaves were cut and gently placed into opaque, labelled plastic bags to prevent light exposure. The cut ends of the branches were then immersed in a water bucket, and samples were kept in the dark for 12 h before laboratory processing. This process minimized desiccation before WD and SWCbranch measurements. For each individual, 20–30 leaves were taken for leaf trait measurements. We used a leaf area meter (LI-3000A; LI-COR, Lincoln, NE, USA) to measure leaf area, and the leaves were then dried at 70 °C for 72 h to obtain dry mass. For wood density (WD, g cm−3) measurements, we cut a 5 cm branch segment, removed the pith and bark using a knife, and determined the sample volume using the water displacement method. The wood samples were then placed in an oven and dried at 70 °C for 72 h to obtain dry mass. We computed specific leaf area (SLA, cm2 g−1) as leaf area divided by leaf dry mass; LDMC as the ratio of dry mass to fresh mass; and WD as the dry mass divided by sample volume. Saturated water content (SWCbranch, g g−1) of the sapwood was calculated as the ratio of water mass to dry mass of sapwood. Maximum height (Hmax) represents species-level stature; for common species, Hmax was estimated from the heights of the 4–5 largest trees (based on DBH) across the four plots using a Haglöf ultrasonic hypsometer, and for rare species with insufficient individuals, we referred to the Flora of Guangxi as a supplement to determine Hmax. Leaf and wood trait values were averaged at the species level for subsequent analyses because our objective was to link interspecific trait variation to differences in demographic performance; intraspecific trait variation was not examined here. Therefore, individuals of the same species were assigned the same species-level mean trait values in the demographic models. The estimated trait effects mainly reflect associations between interspecific functional strategies and individual demographic performance and should not be interpreted as effects of individual-level trait variation.
To capture the dominant patterns of trait variation influencing tree development, we conducted a PCA of the above five functional traits and used the first two principal axes to summarize the major dimensions of interspecific variation. The complete PCA loadings and explained variance are presented in Supplementary Table S1. The first two PCA components explained 76% of the variance in the trait space. PCA1, accounting for 51% of the total variance, was determined primarily by WD (r = 0.85) and LDMC (r = 0.68) and was negatively related to SLA (r = −0.69) and SWCbranch (r = −0.87). This axis can be interpreted as a composite gradient associated with a relatively conservative strategy, particularly with respect to hydraulic functioning. Meanwhile, PCA2, contributing 25% of the total variance, was highly correlated with Hmax (r = 0.72) and LDMC (r = 0.61), and can be interpreted as a composite trait related to species stature and leaf investment strategy.
A total of 232 tree species were identified in the four 1-ha plots, and most of them were rare species. Of these, we measured the leaf and wood functional traits of 85 species. A general summary of the characteristics of these species is presented in Supplementary Table S2. For the remaining 147 rare species, which accounted for only 8% (1,065) of all individuals, their leaf and wood traits were estimated using the funspace R package[40] based on phylogenetically related species. The PCA scores for these rare species were then derived by projecting their predicted trait values onto the PCA loadings established from the 85 measured species. Individuals of these rare species with estimated traits were not included as focal trees but were treated as neighbors in the analysis. A sensitivity analysis excluding neighbors with predicted trait values produced consistent estimates for the key effects, with the main conclusions remaining unchanged. The tree species were classified into canopy and understory species for further analysis based on species-level Hmax and average diameter, where species with an Hmax larger than 15 m and an average DBH greater than 7 cm were grouped as canopy species (Supplementary Table S2). The thresholds result in a clear separation in species stature between canopy and understory species (Supplementary Fig. S1).
Measurements of neighborhood effects
-
Neighborhood crowding, species diversity, trait-induced competitive stress, and trait differences were tested in tree demographic models. Nearest neighbors were identified as the trees located within 10 m of each focal tree; this distance is considered to capture a majority of influences on an individual from its neighbors and is widely applied in neighborhood effect analysis[6]. We also conducted a sensitivity analysis using neighborhood radii from 5 to 15 m, and found that the estimated crowding effect became relatively stable from about 8 m onward, suggesting that a 10 m radius is appropriate. With respect to edge effects, because using the buffer zone method would exclude far more trees in separate plots than in a single, contiguous plot, we applied an edge-correction reflection method to account for incomplete neighborhoods near the boundaries of each plot[41].
The neighborhood crowding index for a focal tree was calculated as the sum of the sizes of each neighbor divided by the distance between them[42,43]. This DBH/distance-based crowding index was applied for its simplicity and its independence of focal tree size, which reduces potential confounding between the effects of neighborhood crowding and focal tree size in the multiple regression model. However, given that asymmetric competition between trees is prevalent in structurally complex forests and is influenced by crown overlap, spatial canopy shading among neighboring trees, or vertical stratification, this index cannot fully represent such competition and should be interpreted as a general measure of neighborhood crowding:
$ NC_i=\sum\limits_{j=1}^{n_i}\dfrac{dbh_j}{dist_{i,j}}\, $ (1) where, disti,j is the distance between a reference tree i and its neighbor j; and where, ni is the total number of neighbors considered.
We used the neighborhood species mingling approach to characterize the local species composition around a focal tree. The species mingling index quantifies the mean heterospecific fraction of individuals among the nearest neighbors of a given tree[44,45]. Previous studies have used the original form of this index to quantify forest stand spatial structure characteristics[46], whereas we computed the mingling effects by weighting each neighboring tree according to its DBH and the inverse of its spatial distance to the focal tree[47]. The weighting approach underscores the influence of larger and spatially closer trees on the focal tree's neighborhood species diversity:
$ {M}_{i}=\sum\limits_{j=1}^{{n}_{i}}{\boldsymbol{I}}_{ij}\cdot {w}_{ij} $ (2) where, Mi is the weighted species mingling of a focal tree i; Iij is the indicator function which returns 1 if the species identity of the nearest neighbor j is different from that of the focal tree, and 0 otherwise. wij denotes the weight of neighboring tree j with respect to focal tree i, where larger and spatially closer j are assigned greater weights.
In addition to species mingling, we calculated the average phylogenetic distance between each focal tree and its heterospecific neighbors to examine the effects of species composition and evolutionary diversity. Pairwise phylogenetic distances were weighted by the DBH of neighboring trees and inversely by their spatial distance to the focal tree. Phylogenetic relatedness was assessed via the Angiosperm Phylogeny Group IV (APG IV) classification system. Phylogenetic dissimilarities between species pairs were calculated using the R package 'V.PhyloMaker' based on their taxonomic names[48]. For species not included, we assigned them to closely related species within the same genus or family:
$ PhyloDiff_i=\sum\limits_{j\in H}^{ }\, PD_{ij}\cdot w_{ij}\ $ (3) where, PhyloDiffi is the average phylogenetic dissimilarity between a focal tree and its heterospecific neighboring trees. PDij is the phylogenetic distance between a focal tree i and its heterospecific neighbor tree j.
Similar to the assessment of species diversity effects, we quantified two trait-based neighborhood indices: a neighborhood trait-mediated competitive effect (TCi, trait composition or competition), representing the weighted dominance of a given trait in the neighborhood, and a neighborhood dissimilarity index (TDi), representing the weighted mean trait difference between the focal tree and its neighbors. Both were quantified by substituting Iij into Eq. (2) with Tj (the trait value of the neighboring tree j) or
$ \left| {T}_{i}-{T}_{j}\right| $ Individual-based growth and survival models
-
Tree growth rate was measured as the annual DBH increment over the 6-year monitoring period. We used absolute growth as the response variable because relative growth rate generally declines with tree size and may partly confound interspecific comparisons[49]. Individuals with non-positive diameter increments in our repeated censuses may reflect a mixture of true growth cessation, stem shrinkage, and measurement uncertainty; therefore, we did not include those individuals as focal trees in the growth analysis, but still retained them as neighbors when calculating neighborhood indices. Accordingly, the growth analyses represent surviving trees with detectable positive DBH growth and do not extend to the full population of surviving trees. For multi-stemmed trees, only the main stem was considered in the calculations. Tree survival status was coded as 0 for trees that died during the monitoring period and 1 otherwise. We used a generalized linear hierarchical model framework to analyze the growth and survival of individuals, following previous studies[6,20,47]. Before model fitting, all continuous explanatory variables were standardized to a mean of zero and a standard deviation of one to facilitate comparison of effect sizes among predictors. Our modeling consisted of two main stages. First, we established a baseline model to explore how tree size, neighborhood crowding, and environmental factors affect tree growth or survival (Eq. [4]). Species were included as a random intercept to capture species-specific baseline variation in growth or survival. After additionally evaluating models including plot as a random intercept, we retained species as the random intercept in the main analyses because of the limited number of plots and the potential overlap between plot-level variation and measured environmental gradients, particularly elevation:
$ {Y}_{is}={\beta }_{0s}+{\beta }_{1}\log ({\text{DBH}}_{0})+{\beta }_{2}\log (Crowding)+{\boldsymbol{\beta }}_{\mathbf{3}}\mathrm{Env}+{\epsilon }_{is} $ (4) where, Y depends on the type of response variable: for tree growth (G), Y is expressed as log(ΔDBH) with
$ {\epsilon }_{is}\sim \mathcal{N}\left(0,\ {\sigma }^{2}\right) $ $ \log(\dfrac{{p}_{i}}{1-{p}_{i}}) $ We subsequently examined the four trait-mediated ecological processes by adding different traits and neighborhood indices to the baseline model (Eq. [4]), resulting in Eq. (5). These model components correspond to the main processes illustrated in Fig. 1a–d, namely intrinsic demographic performance, tolerance to crowding, trait-mediated competitive effects of neighbors, and diversity-related neighborhood effects. (1) Trait-mediated species performance (β0): species traits were used to explain the variation in the intercept term, representing a species' intrinsic potential for growth or survival (Fig. 1a; Eq. [6]); (2) Trait-mediated crowding tolerance (β2): this captures how the trait value of the focal species (Ts) influences its tolerance to neighborhood crowding (Fig. 1b; Eq. [7]); (3) Trait-mediated competition effects (TC, β4): this term reflects whether specific traits of neighboring trees intensify or reduce competition on the focal tree (Fig. 1c). Positive values of β4 indicate that dominance of a trait in the neighborhood reduces competition effects on the focal tree, while negative values indicate that specific trait values in the neighborhood can intensify competitive pressure; and (4) Neighborhood dissimilarity/diversity effects (TD, β5): if neighborhood competition is alleviated by diversity effects, significant positive values of β5 are expected (Fig. 1d)[6,20]. In addition, we explored the influence of species mingling or neighborhood phylogenetic diversity by directly incorporating them into the baseline model (Eq. [4]).
$ {Y}_{is}={\beta }_{0s}+{\beta }_{1}\log ({\text{DBH}}_{0})+{\beta }_{2}\log (Crowding)+{\boldsymbol{\beta }}_{\mathbf{3}}\mathrm{Env}+{\beta }_{4}TC+{\beta }_{5}TD+{\epsilon }_{is} $ (5) To link species traits to intrinsic performance potential, we modeled the random intercepts as a function of focal species' trait Ts:
$ \beta_{0s}=\gamma_{00}+\gamma_{01}\, T_s+u_{0s},\quad u_{0s}\sim\mathcal{N}\left(0,\tau^2\right) $ (6) Trait-mediated crowding tolerance (i.e., an interaction between the focal species' trait and crowding) was represented by allowing the crowding slope to vary with Ts:
$ \beta_2=\gamma_{20}+\gamma_{21}T_s $ (7) Each trait was evaluated separately in the growth and survival models. To examine potential differences among strata, the models were fitted separately for all species, canopy species, and understory species. Given the analyses conducted for different traits and strata, we focused primarily on consistent patterns in coefficient estimates across related analyses. We examined the potential collinearity between the two neighborhood trait indices, TC and TD, and identified a moderate correlation (r = 0.6) when they were calculated based on Hmax for understory species; therefore, we examined the effects of TD and TC independently for Hmax in understory species in Model 5. Collinearity was further assessed for the fitted models using the check_collinearity function in the R package performance, with all VIFs below 5. The β parameters were estimated in a Bayesian framework. Fixed effects were assigned normal priors with mean 0 and standard deviation 100, intercepts were assigned normal priors with mean 0 and standard deviation 10, and the standard deviation of the random effect was assigned a half-Cauchy prior with scale 2. The models were fitted using a Markov chain Monte Carlo (MCMC) sampling approach with 2,000 iterations and four chains. Model convergence was assessed using R-hat, bulk effective sample size (Bulk ESS), tail effective sample size (Tail ESS), and divergent transitions. All models showed satisfactory convergence, with maximum R-hat values of 1.00–1.01, minimum Bulk ESS ≥ 367, minimum Tail ESS ≥ 625, and no divergent transitions. For robust parameter estimation, we modeled tree growth for species with more than 20 growth records and measured functional traits. Survival analysis included species with a minimum of 20 individuals and at least 6 mortality records because species with very few or no deaths provide limited information for estimating species-level survival differences in hierarchical logistic models and may lead to unstable parameter estimates.
-
At the community level, the mean annual basal area increment (BAI) and DBH increment were 1.4 cm2 and 0.13 cm, respectively. Tree growth rate showed significant variation among species. Of the most abundant species, annual DBH increments ranged from 0.36 cm/yr for Bauhinia brachycarpa to 0.08 cm/yr for Diospyros dumetorum. Canopy species exhibited greater DBH accumulation than understory species (Fig. 3a). Cumulative mortality proportions also differed substantially among species, with the highest being 0.91 for Alchornea trewioides, while the lowest was 0.11 for Boniodendron minus over the 6-year monitoring period. The three species with the highest cumulative mortality proportions were all understory species (Fig. 3b). The majority of mortality occurred among smaller trees, particularly those with a DBH ranging from 1 to 7 cm (Fig. 3c), accounting for approximately 80% of all tree mortality.
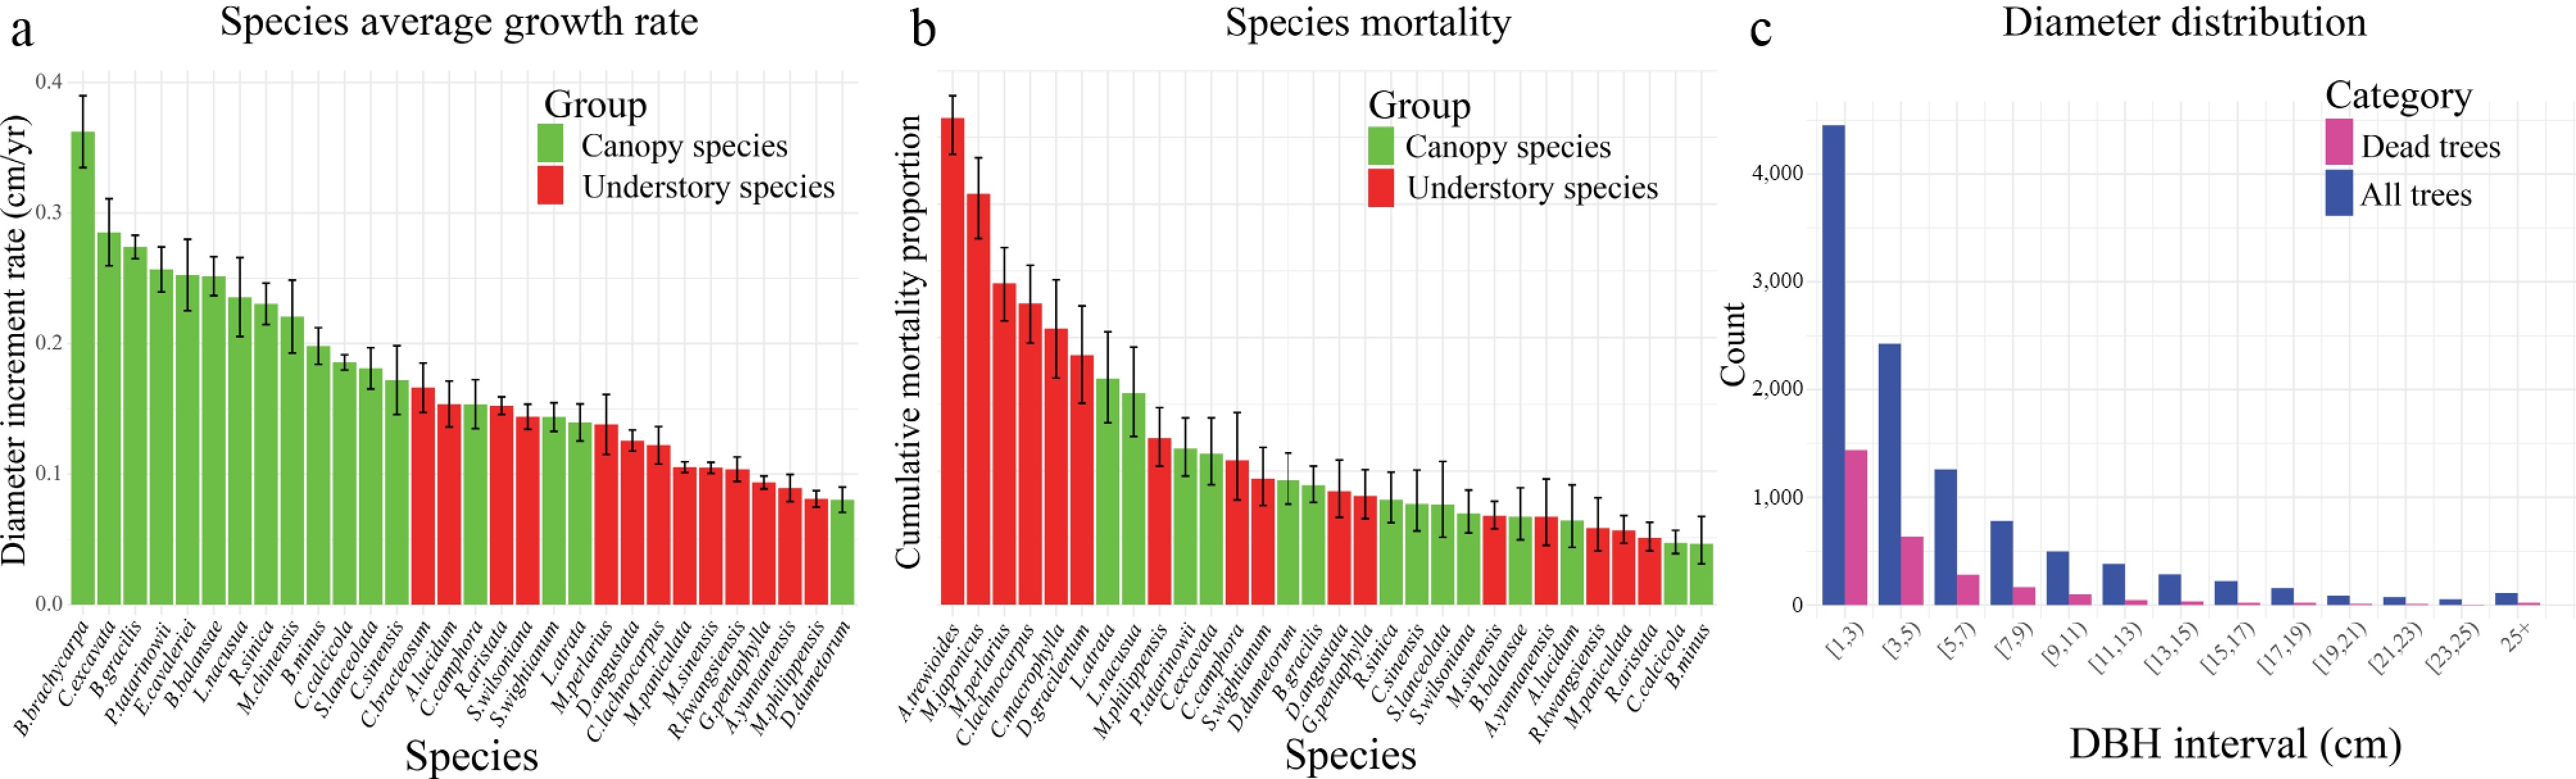
Figure 3.
General growth and mortality characteristics of different tree species and sizes in the studied forest. (a) Mean DBH increment rate with standard error bars, and (b) cumulative mortality proportion over the 6-year monitoring period with Wilson binomial confidence intervals for the most abundant species, with canopy species shown in green and understory species in red. (c) DBH class distributions for all individuals measured at the initial inventory (blue) and for trees that died during the monitoring period (purple).
Interspecific variation explained 15.3% of the total variation in individual growth rates and 15.5% of the variation in survival probabilities. An interspecific growth–mortality trade-off was observed and was associated with species functional traits. As shown in Fig. 4, among understory species, species with greater Tpca1 had lower mean growth rates and lower cumulative mortality proportions, consistent with its role in reflecting a resource-conservative strategy. Meanwhile, Tpca2 showed a highly significant positive correlation with mean species growth rate, suggesting that higher values of this composite axis were associated with greater growth performance.
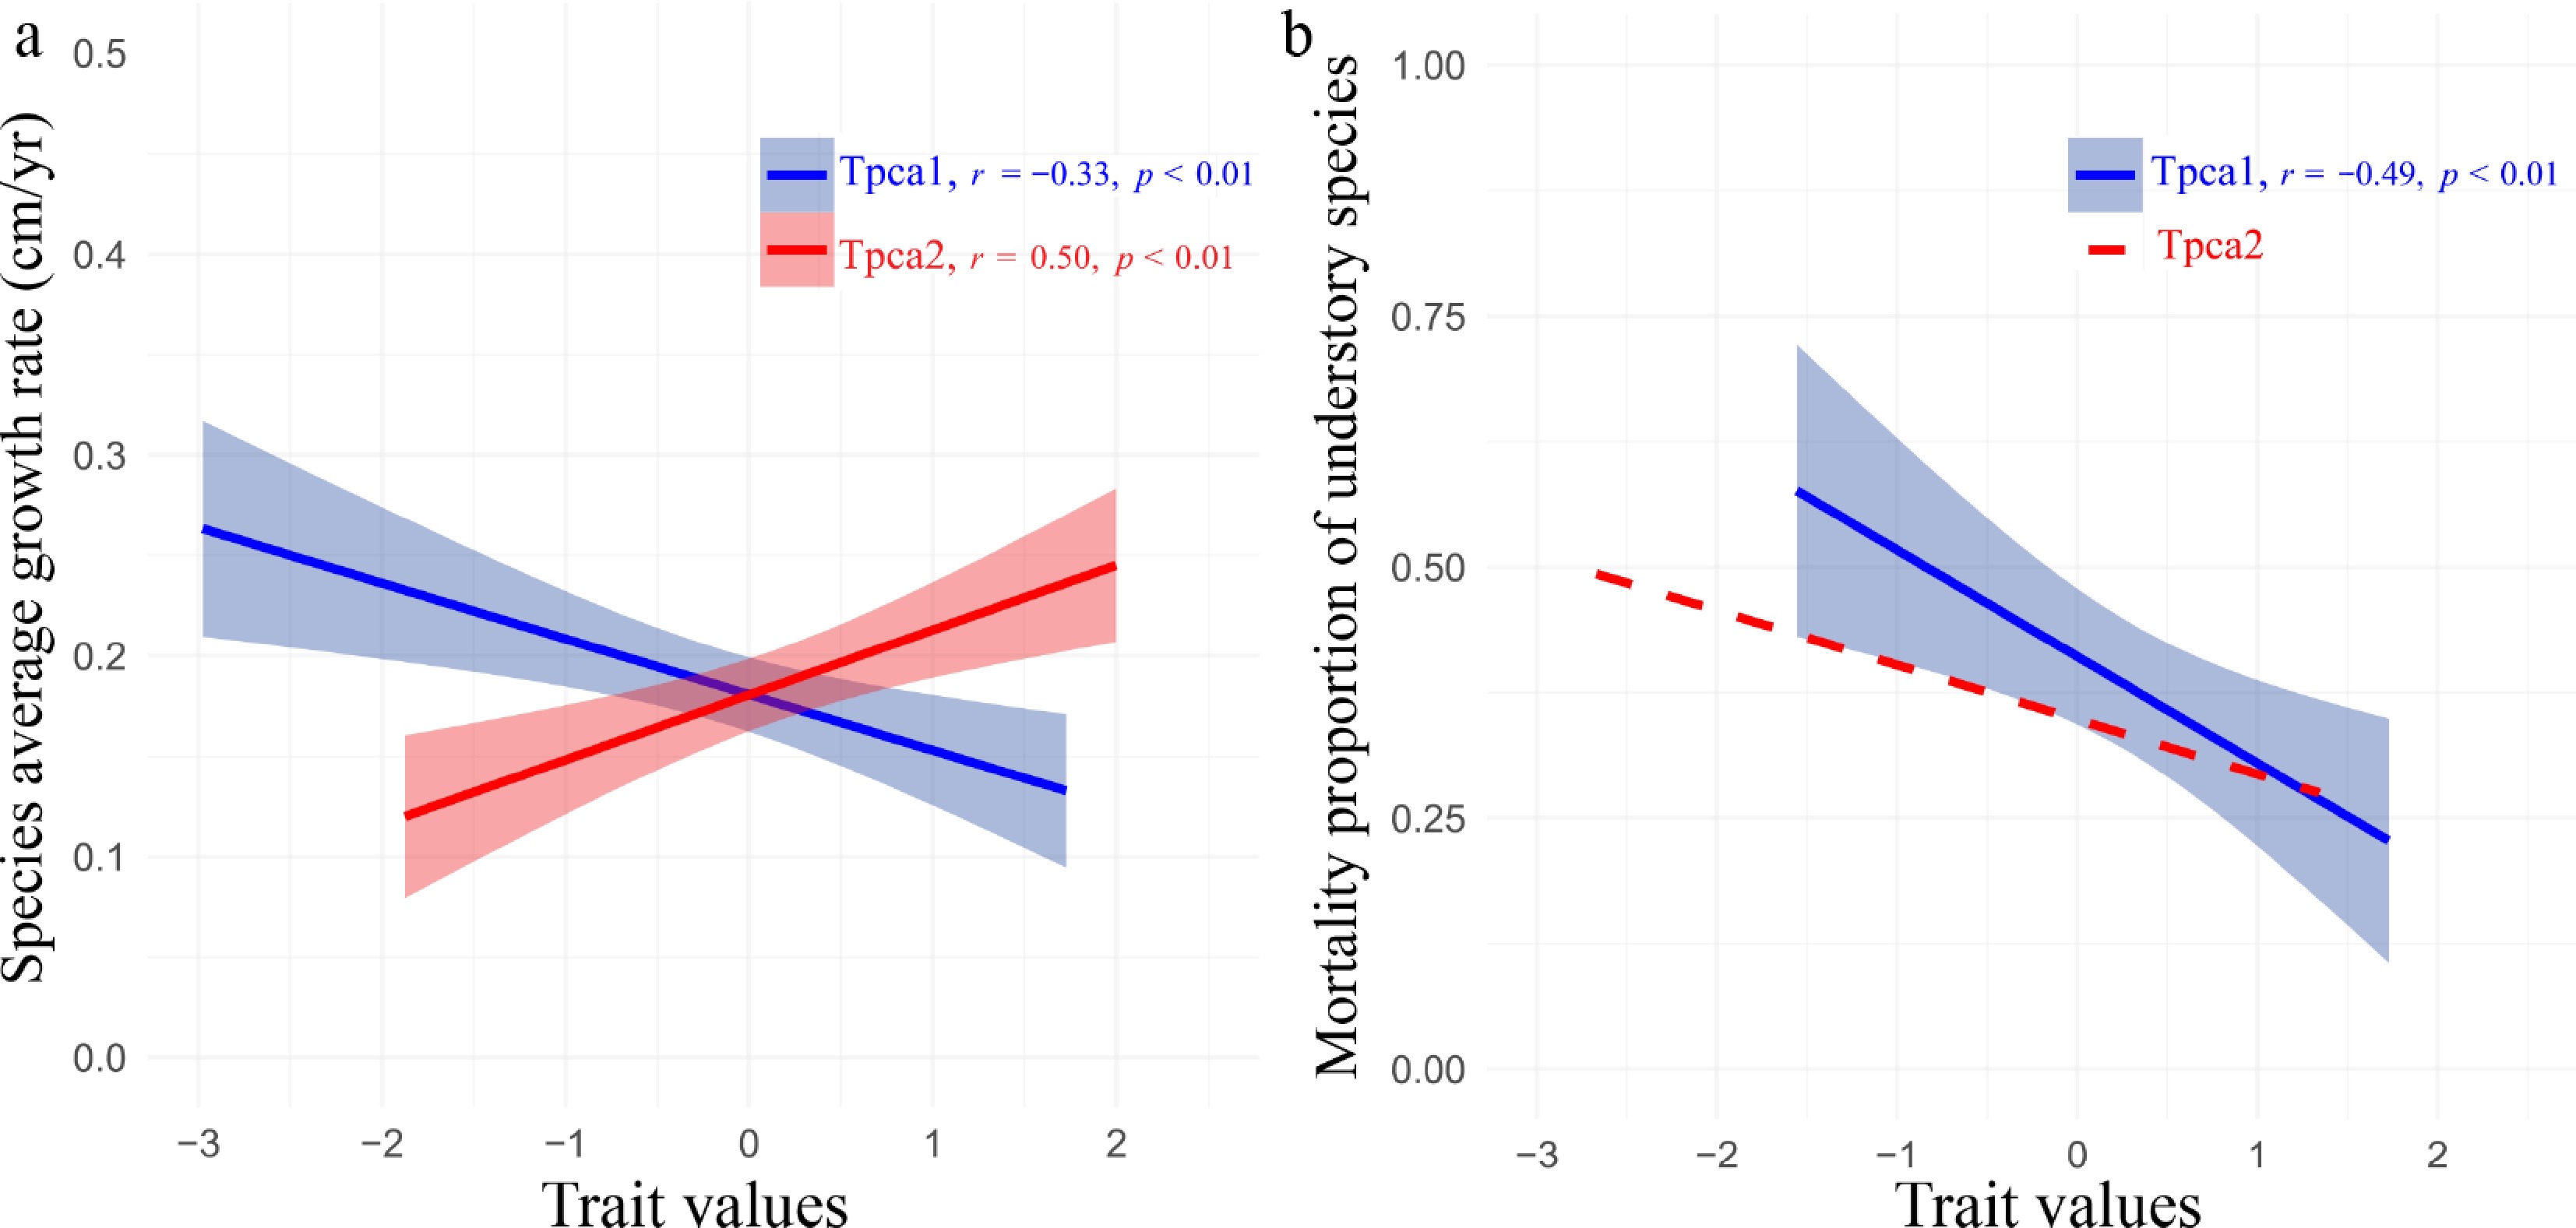
Figure 4.
(a) Relationship between functional traits and species' mean growth rates, and (b) the cumulative mortality proportion of understory species. Tpca1 and Tpca2 represent composite traits derived from PCA, with standardized values. The solid lines denote statistically significant relationships.
Explanatory factors for individual tree growth
-
Tree DBH was the most influential factor associated with tree diameter growth, with a larger estimated effect size for canopy than for understory species (Fig. 5a). Neighborhood crowding was significantly negatively associated with growth. Among environmental variables, tree growth was negatively associated with elevation and rock outcrop cover and positively associated with light availability at the community level. The positive association with light availability was stronger for understory species, whereas no significant association was detected for canopy species. Compared with canopy species, understory species showed smaller estimated coefficients for tree size, crowding, and elevation, but a larger positive coefficient for light availability (Fig. 5a). These relationships should be interpreted as applying to surviving trees with detectable positive DBH growth.
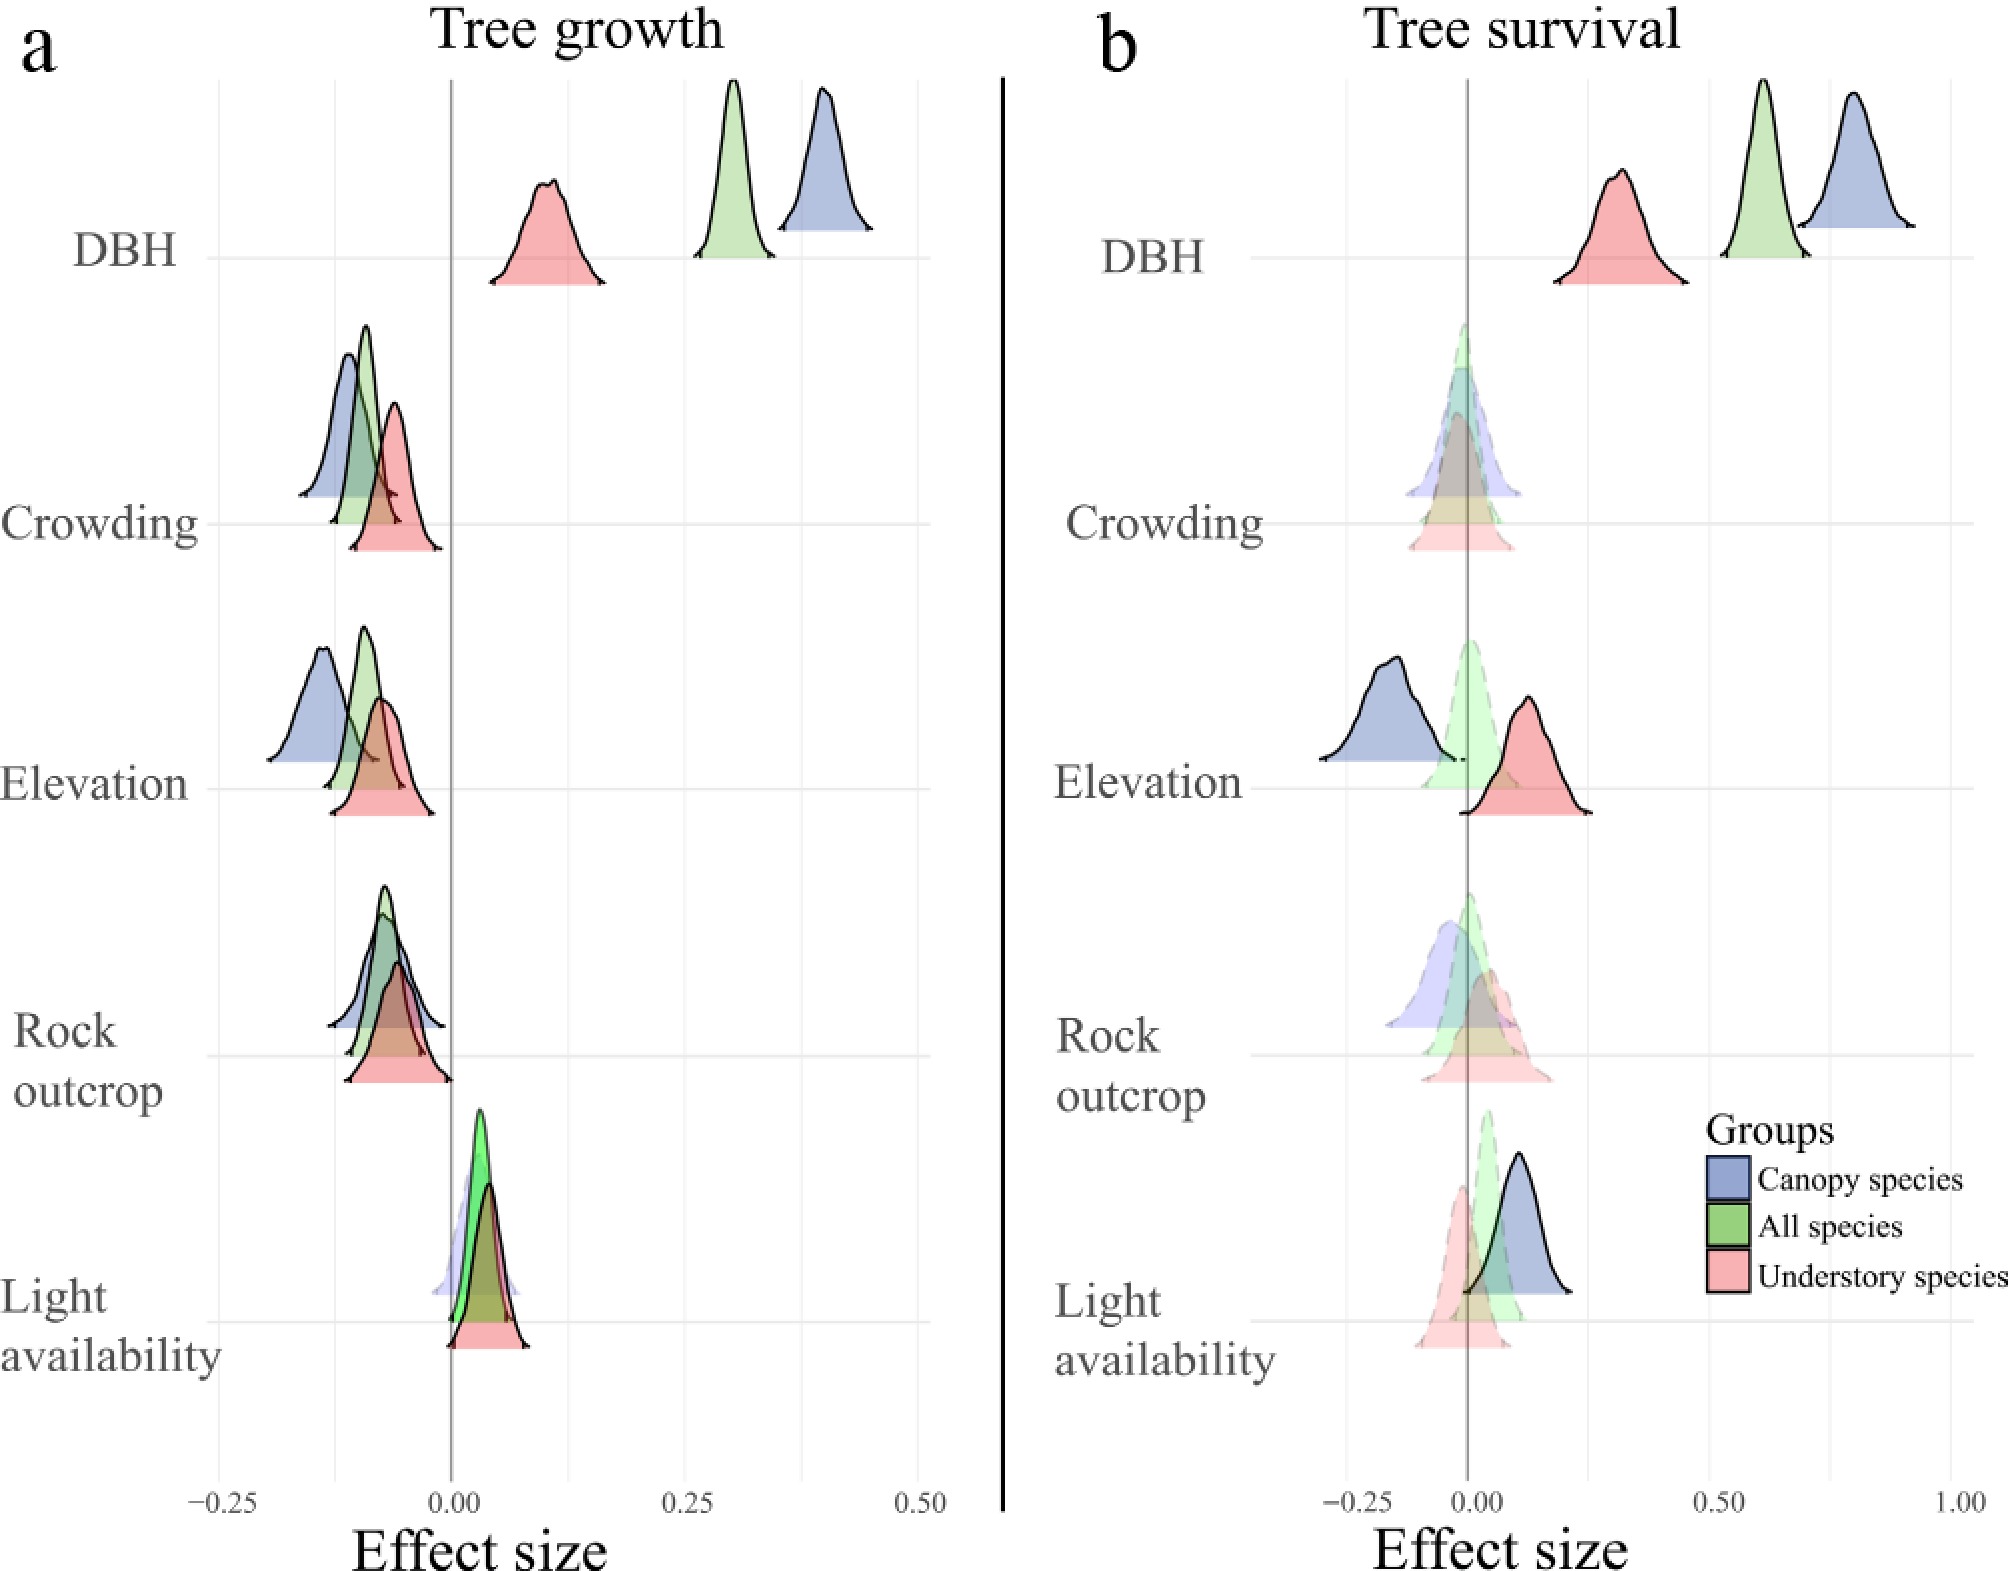
Figure 5.
Standardized effects of tree size, neighborhood crowding, and environmental factors on (a) individual tree growth and (b) survival likelihood in Model 4. The effect sizes are shown for all species (green), canopy species (purple), and understory species (light red). The solid distribution curves indicate factors with significant effects, as determined by a 99% credible interval. Only environmental variables with significant influences are presented in the figure.
Regression results from the trait-based individual growth model (Model 5) revealed that species with greater Hmax or Tpca2 had greater growth potential (positive effects on β0s; Fig. 6a). However, Tpca2 was significantly associated with greater susceptibility to neighborhood crowding (negative effects on β2; Fig. 6b); Hmax also had a weak negative effect on β2 (95% credible interval; Supplementary Table S3). WD was not directly correlated with intrinsic growth rate but had evident positive effects on the crowding tolerance of a focal tree (positive effects on β2). These patterns were evident only for the combined data of all individuals, suggesting that the trade-off between intrinsic growth rate and resistance to crowding primarily occurred across species at the community level.
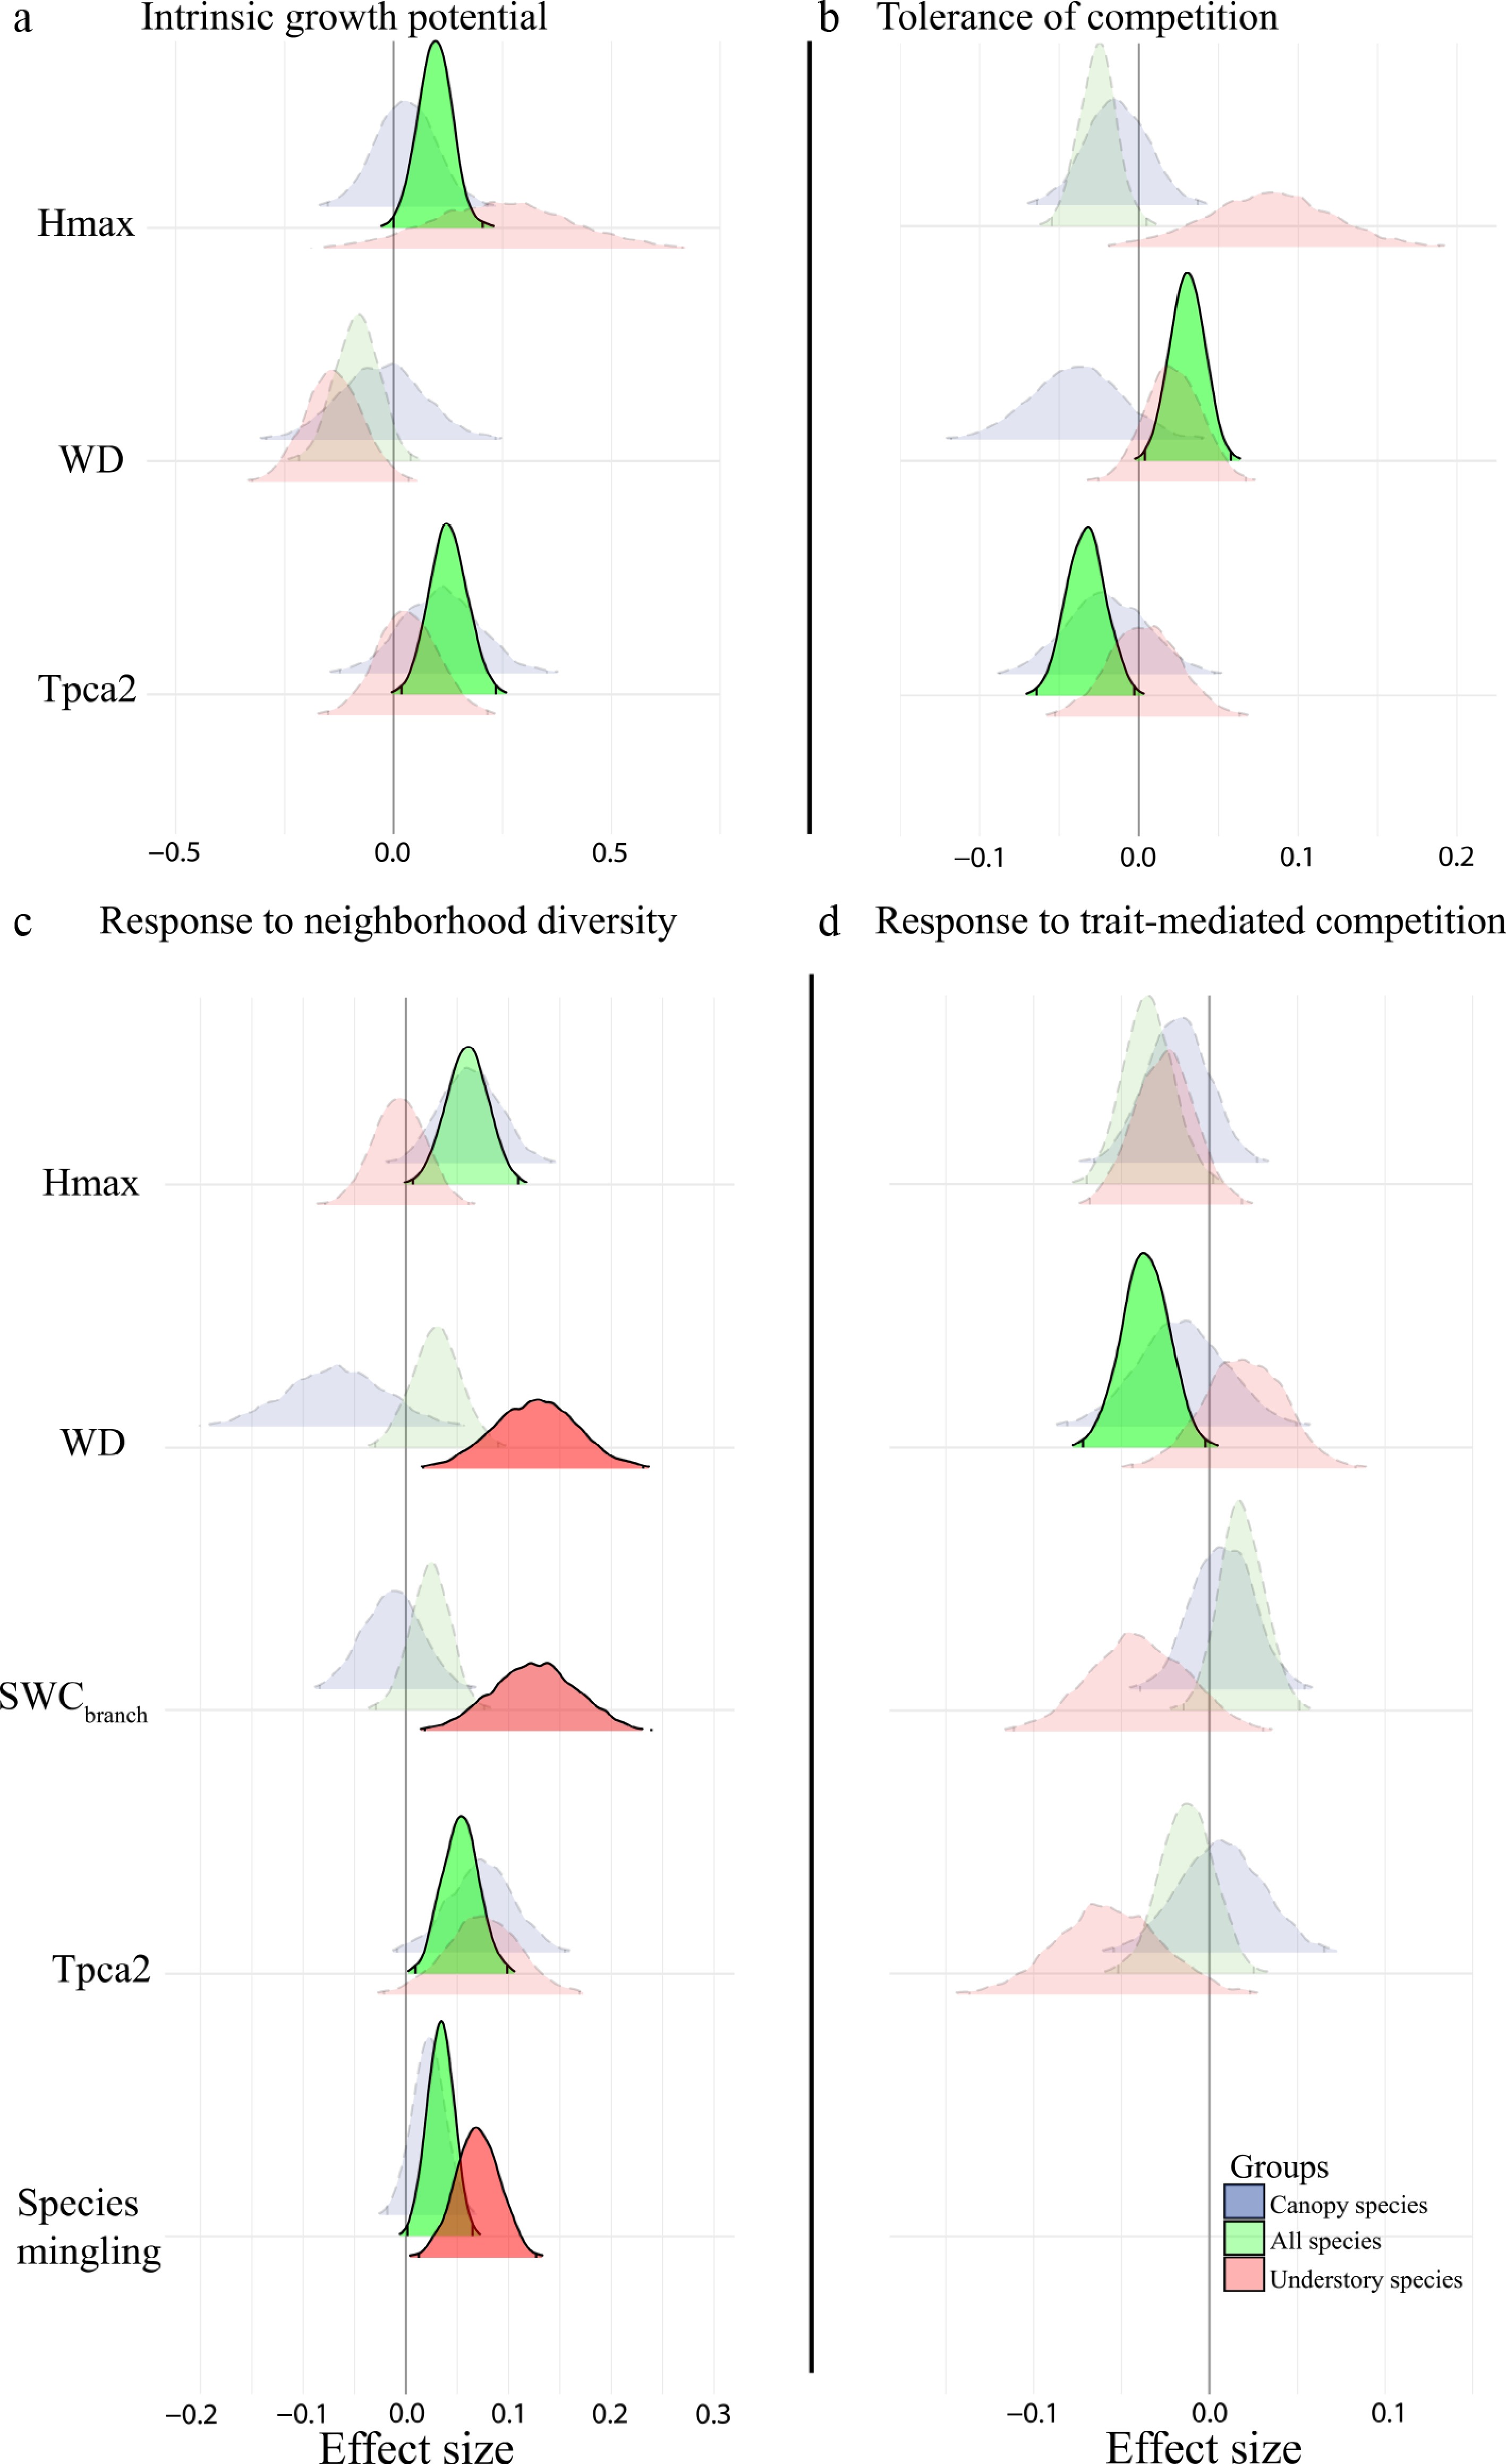
Figure 6.
Standardized effects of different traits and species mingling on tree growth. (a) Effects on species' intrinsic growth potential. (b) Effects on tolerance to neighborhood crowding. (c) Neighborhood trait dissimilarity and species mingling. (d) Trait-mediated competitive effects from neighbors. Positive values in (a)–(c) indicate positive effects on growth or crowding tolerance, whereas negative values in (d) indicate stronger competitive effects that tend to reduce focal tree growth. Each trait was evaluated separately in the model. Effect sizes are shown for all species (green), canopy species (purple), and understory species (light red). Traits with non-significant effects (based on 99% credible intervals) are not shown.
In terms of trait-based neighborhood effects (Fig. 6c, d), a significant competitive effect (β4) was found only for WD, indicating that increased dominance of neighborhood WD decreased the growth of focal trees (Fig. 6d). Compared with competitive effects mediated by specific traits, greater neighborhood trait dissimilarity in Hmax, WD, SWCbranch, and Tpca2 was positively associated with focal tree growth (Fig. 6c). Notably, significant positive effects of WD and SWCbranch were detected only in understory species, whereas canopy species exhibited no significant responses to trait dissimilarity. Additionally, increased neighborhood species mingling positively influenced growth for all species combined and for understory species (Fig. 6c). When only heterospecific neighbors were considered, phylogenetic dissimilarity did not significantly affect growth (not shown), and positive trait dissimilarity effects were detected only for Hmax and SWCbranch (Supplementary Fig. S2), suggesting that diversity effects might be more related to reduced competition among conspecific neighbors.
Explanatory factors for individual tree survival
-
Similar to growth, tree size (DBH) was strongly correlated with tree survival probability, with a larger estimated coefficient for canopy species (Fig. 5b). Neighborhood crowding was not significantly correlated with survival probability of either canopy or understory species. Elevation showed contrasting associations with survival likelihood between canopy and understory species, with a negative association for canopy species and a positive association for understory species. Greater light availability was positively associated with survival only in canopy species (Fig. 5b).
Among the traits, WD was positively correlated with species' intrinsic survival probability, indicating that species with greater wood density had higher baseline survival rates. This relationship was particularly pronounced for understory species but not detected in canopy species. Conversely, greater SLA was linked to a lower likelihood of survival for understory species. The composite trait Tpca1 likewise showed a strong positive association with tree survival (Fig. 7a; Supplementary Table S4).
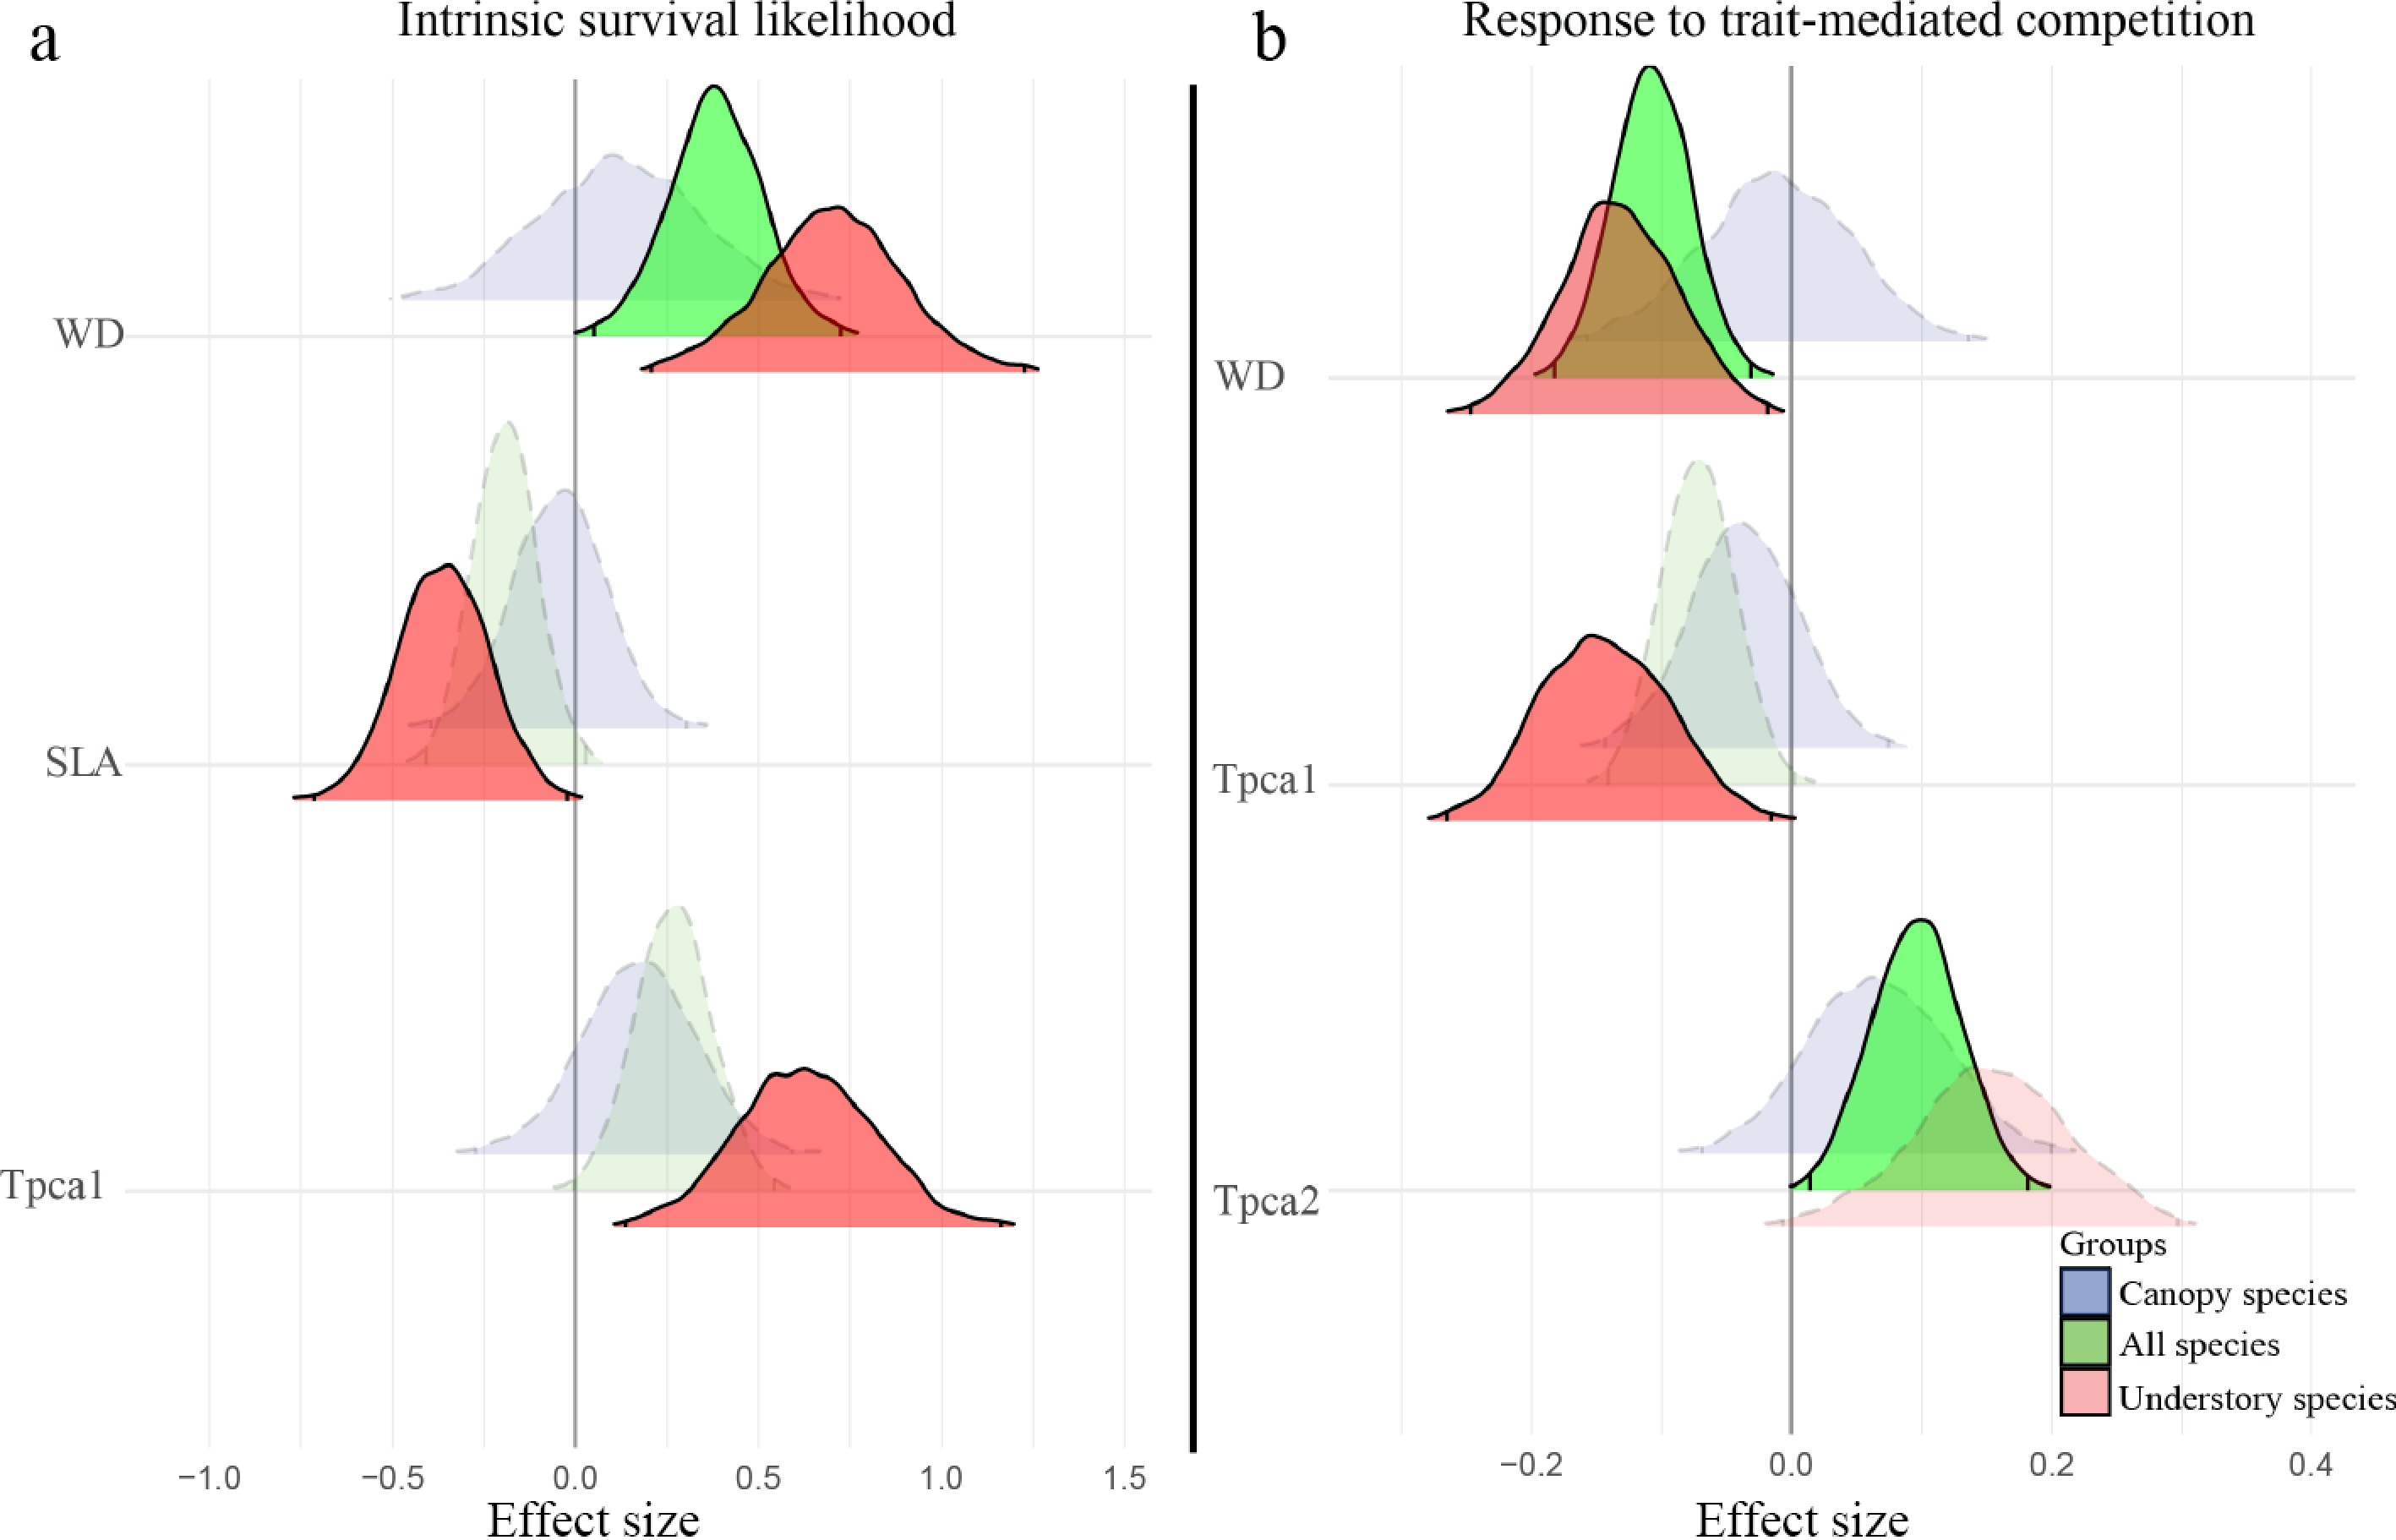
Figure 7.
Standardized effects of functional traits on tree survival. (a) Species' intrinsic survival probability. (b) Trait-mediated competitive effects from neighbors. Positive values in (a) indicate higher survival probability, whereas negative values in (b) indicate stronger negative effects that tend to reduce focal tree survival. Each trait was evaluated separately in the model. Effect sizes are shown for all species (green), canopy species (purple), and understory species (light red). Traits with non-significant effects (based on 99% credible intervals) are not shown.
Compared with species mingling or trait dissimilarity effects, trait-mediated neighborhood competition showed more consistent associations with tree survival, particularly among understory species (Fig. 7b). The increasing dominance of neighborhood WD or Tpca1 significantly decreased the survival likelihood of focal trees, while greater neighborhood Tpca2 had a positive effect on survival, indicating that distinct neighborhood competition effects were exerted by traits favoring resource-conservative strategies (e.g., high WD and Tpca1) and traits associated with growth efficiency (e.g., Tpca2). An analysis focusing on heterospecific neighbors revealed similar patterns of neighborhood trait competition effects (Supplementary Fig. S3).
-
Our analysis of demographic data from 12,363 trees across 79 focal species within a karst forest ecosystem revealed that multiple factors, including environmental conditions, interspecific variation, and neighborhood interactions, were associated with individual tree growth and survival. By applying a trait-based approach, we identified links between functional traits and interspecific demographic trade-offs and neighborhood effects, which may contribute to local community structure and assembly. These associations also differed between growth and survival and between canopy and understory species, highlighting the context dependence of tree demographic responses in karst forests.
Tree size-dependent variation in forest demographic dynamics
-
Compared with other non-karst forests in subtropical and tropical regions[50,51], the studied forest has a comparable growth rate and a higher mortality rate. Both secondary forest characteristics and habitat filtering may contribute to the high dynamism in this forest. Ecologists have hypothesized that forests in early developmental stages are initially dominated by fast-growing, shade-intolerant species that rapidly colonize the habitat and then are gradually replaced by shade-tolerant species with better defense strategies as succession progresses and competition intensifies[20,52]. In addition, extreme habitat conditions may further contribute to habitat filtering and species turnover, potentially favoring specialist species adapted to environmental constraints. The high mortality rate observed in this forest is consistent with such demographic filtering.
Under these forest and habitat conditions, initial DBH was the most influential factor for predicting tree growth and survival. This reinforces the key insight that tree size, which integrates individuals' past resource acquisition, current vigor, and future performance, should be explicitly accounted for in forest demographic models. For example, prior studies have shown that functional trait variation often covaries with tree size[31,53], and hence neglecting tree size in dynamic models may overemphasize the importance of functional traits in predicting tree growth or forest productivity. In addition, the separate models showed larger estimated DBH effects on growth and survival for canopy species than for understory species. Although initial DBH was included in all models, it may not fully account for biological differences associated with ontogenetic stage and species-specific size distributions. Accordingly, the observed demographic contrasts may reflect both size-related responses and broader life-history differences between the two strata, with canopy species generally adopting a more resource-acquisitive strategy and understory species relying more on conservative, slow-growth strategies under resource limitation (Supplementary Fig. S1b)[54,55]. Because trees with non-positive diameter increments were excluded, the growth models mainly represent individuals with measurable positive growth and may not fully capture the persistence of slow-growing, suppressed understory trees. Despite this limitation, the distinct slopes of the explanatory variables further emphasize the need for tailored demographic models for the two species groups in future studies, as their model parameters can differ substantially.
Functional trait-mediated interspecific trade-offs
-
The studied traits proved to be useful predictors for both species-level (Fig. 4) and individual-based (Figs. 6, 7) growth and survival models. A key component of trait-based plant ecology is the assumption that functional traits can be translated into trade-offs between species with higher growth rates under high resource availability and those with lower growth rates but higher survival under increased competitive stress[3,14,20]. In the overall models, greater Tpca2, which can be interpreted as a composite trait related to species stature and fast growth, was associated with greater growth potential but lower tolerance of competition in the overall growth model and weaker competitive effects on neighboring trees in the survival model. In contrast, greater WD or Tpca1 and lower SLA were associated with greater intrinsic survival probability, especially in the understory species group. Greater WD was also associated with increased tolerance to competition (Fig. 6b) and competitive effects on neighboring trees (Figs. 6d, 7b). These findings are generally consistent with the predictions of the leaf and wood economics spectra (LES and WES)[15,16,56]. Using plot data spanning global forest biomes, Kunstler et al.[20] reported that WD and SLA generally mediate trade-offs between tree growth and competitive performance. Evidence from tropical dry forests also indicates that tree drought strategies are multidimensional and span an acquisitive–conservative continuum[57]. Our results from both growth and survival analyses suggest that conservative–acquisitive trait trade-offs may also be evident and readily detected in this karst forest, although direct comparison with non-karst forests was beyond the scope of this study. Our findings are consistent with karst-specific studies suggesting that strong edaphic stress and environmental filtering in karst forests often favor conservative strategies, thereby providing relevant ecological context for understanding the trait-mediated patterns observed in our study[58,59]. Nevertheless, intraspecific trait variation associated with tree size, phenotypic plasticity, and fine-scale environmental heterogeneity may be particularly important in karst habitats and may contribute to unexplained variation in individual growth and survival. Therefore, future studies incorporating individual-level trait measurements across tree sizes and microhabitats may help further clarify the mechanisms underlying karst adaptation and growth-survival trade-offs.
In the survival model of understory species, we found that trait–survival associations were more consistently detected, with WD being particularly important; its effect on survival was greater than that of tree size. One possible explanation is that most dead trees are small individuals (Fig. 3c), which may have restricted rooting zones and limited access to water and soil nutrients in rock fissures. Under such conditions, the positive association between WD and survival may be particularly pronounced in understory species (most of which are small trees), as greater WD is commonly associated with greater mechanical safety, resistance to water stress, and potentially greater resistance to biotic damage such as pathogens or herbivores[60]. Overall, the aboveground traits measured here captured important dimensions of survival strategies in understory species, but tree survival in karst environments involves multiple functional dimensions. Future studies that incorporate belowground traits, such as root architecture, rooting-depth plasticity, and belowground water acquisition capacity, would help provide a more complete understanding of survival patterns and the underlying ecological processes.
It is worth noting that significant trait–mortality associations were not detected in the canopy-species models over the present census interval. This should not be interpreted as evidence that these pioneer species have inherently superior survival capabilities compared with more conservative understory species. One possible explanation is that stronger habitat filtering may occur earlier in the life cycle of canopy species, eliminating a large proportion of individuals before they reach the sapling threshold[32,36]. This interpretation is also consistent with our finding that the number of canopy species individuals per quadrat was significantly associated with rock outcrop cover and steep slope, whereas no such significant associations were detected for understory species (Supplementary Fig. S4a–S4d). Given the lack of seedling stage data and the relatively short monitoring period, trait–mortality relationships may have remained undetectable among canopy species in our study, particularly if survival differences in canopy trees emerge over longer timescales than captured by the present 6-year census[3,35].
Neighborhood crowding and species diversity
-
Neighborhood crowding significantly reduced tree growth but showed no detectable effect on mortality (Fig. 5). This discrepancy may be because tree growth is more responsive to crowding within the short monitoring period, whereas mortality is a delayed process that may not be fully captured by the crowding index, particularly for large-sized trees. In addition, the simplified DBH/distance-based index may incompletely represent asymmetric competition for canopy space, which could also weaken the detected relationship between crowding and mortality. However, our results further revealed that focal tree survival was significantly influenced by the trait composition and values of neighborhood trees, particularly by the wood density of neighbors (Fig. 7b), suggesting that the survival process is less responsive to the overall crowding or abundance of local competitors but more to the abundance of competitors with specific traits. Neighborhood species mingling had pronounced positive effects on growth, but this positive association was not observed when heterospecific diversity alone was considered, as quantified by the phylogenetic distances between the focal tree and its heterospecific neighbors. This suggests that the positive effect of species mingling is more consistent with reduced local conspecific crowding (i.e., a dilution effect) than with complementarity per se, potentially through weaker competition for similar resources and lower pressure from host-specific natural enemies, such as shared pathogens and insect herbivores, consistent with the Janzen–Connell hypothesis[47,61]. Beyond these biotic mechanisms, habitat partitioning and non-random spatial aggregation may also contribute to this association, because local species composition and focal tree growth may both covary with unmeasured microsite conditions.
Relative importance of trait-mediated competition and diversity effects
-
At the neighborhood scale examined here, the relative importance of trait-mediated neighborhood competition and diversity effects largely depended on the demographic process, the specific trait, as well as the canopy layer considered. For growth, neighborhood trait diversity (Hmax, WD, SWCbranch, and Tpca2) showed consistently positive associations (Fig. 6c), whereas only neighbor WD exerted a significant competitive effect (a negative effect on focal growth). In contrast, survival showed more consistent associations with trait-mediated competitive effects than with diversity effects. Higher neighborhood WD or Tpca1 was associated with lower focal tree survival, whereas higher neighborhood Tpca2 was associated with greater survival (Fig. 7b). These patterns indicate stronger negative neighborhood associations when conservative trait values were more dominant in the neighborhood, but they do not demonstrate that species with conservative traits are intrinsically stronger competitors, because neighborhood trait composition may also covary with neighbor size, canopy position, rooting environment, or other unmeasured characteristics. The negligible effects of diversity on tree survival found in our study align with previous experimental evidence, which indicates that neighborhood diversity primarily enhances tree growth, with little or no consistent effect on survival[62]. These neighborhood associations may also be modified by rock–soil mosaics and fine-scale resource heterogeneity, and how such heterogeneity further influences tree interactions and species coexistence at broader spatial scales remains an important question for future study.
In the present study, positive neighborhood diversity effects on growth were detected mainly in the understory species models. As the understory species in this forest exhibited a more conservative trait syndrome than canopy species (Supplementary Fig. S1b), this pattern is broadly consistent with previous experimental evidence showing that conservative species can benefit more from neighborhood diversity through niche differentiation and facilitation under strong competitive stress[25]. Additionally, differences in sensitivity to changes in fine-scale microenvironmental heterogeneity should also be considered. Unlike large canopy trees, which develop extensive and stable root systems and prioritize light capture, understory trees are more likely to respond to localized heterogeneous conditions shaped by neighbors with diverse functional traits.
Associations with environmental factors
-
Among the environmental factors examined, elevation, rock outcrop cover, and light exposure were significantly associated with individual growth or survival. Elevation showed significant negative associations with the growth of both canopy and understory tree species. However, it exhibited contrasting relationships with survival in canopy vs understory species, with mortality increasing with elevation in canopy species but decreasing in understory species. Elevation should be interpreted here as a proxy for multiple covarying environmental gradients rather than as a direct causal factor, because soil moisture, nutrient availability, and fine-scale microtopography were not directly measured. Although the reasons behind these contrasting survival responses remain unclear, they may reflect differences in how canopy and understory species respond to habitat variation along the elevational gradient in this karst forest. One possible explanation is that, across forest plots, higher elevations were associated with an increased number of individual trees belonging to canopy species (Supplementary Fig. S4e, S4f). This pattern may be associated with stronger competition, because these canopy species are often characterized by resource-acquisitive traits (Supplementary Fig. S1b), which may have contributed to their lower growth and survival performance. By contrast, the relatively higher survival of understory species at higher elevations may reflect their greater stress tolerance, although the specific mechanisms were not directly tested in this study. Further studies incorporating direct measurements of soil moisture, nutrient availability, and fine-scale microtopography are needed to elucidate how elevation-related habitat variation shapes the composition and coexistence of understory and canopy species in karst forests.
Compared with soil depth, rock outcrop cover showed a stronger association with tree growth. This pattern may reflect the effects of exposed rock and patchily distributed soil on rooting conditions and resource availability in karst forests, although the underlying soil water and nutrient mechanisms were not directly measured. Because light availability is more restricted for understory species than for canopy species, it was positively correlated with the growth of understory trees. On the other hand, we found that light availability was significantly associated with canopy tree survival but was less important for the survival of understory species. This suggests that, in shaded environments, understory species benefit in their growth from light availability, but their survival may depend more strongly on other biotic factors, such as species-specific traits. In contrast, as canopy species in this forest are typically shade intolerant, they often fail to survive in shaded environments[47,63,64], especially among smaller individuals. The environmental variables used here represent broad habitat conditions at the quadrat scale, while some unmeasured local conditions may be shared among trees within the same plots or quadrats, and some residual spatial dependence among trees therefore cannot be completely excluded. Karst forests also contain highly heterogeneous microsites associated with soil pockets, rock fissures, and fine-scale subsurface hydrology. Future studies combining terrestrial laser scanning or other high-resolution LiDAR approaches with direct measurements of soil moisture and subsurface hydrology could better quantify these fine-scale environmental effects.
-
The studied karst forest exhibited pronounced tree dynamics over the 6-year monitoring period, associated with the combined effects of environmental stressors, interspecific variation, and neighborhood interactions. Notably, our results indicate that, under resource-limited karst conditions, species differed in their demographic responses in ways that are consistent with functional trait trade-offs. Species characterized by traits associated with fast-growing strategies exhibited increased growth potential but were more susceptible to the negative effects of neighborhood crowding on growth. In contrast, conservative species with greater wood density and lower SLA were associated with higher survival probability, enhanced tolerance to crowding, and stronger negative effects on their neighbors. Neighborhood species mingling and trait dissimilarity were positively associated with tree growth, whereas survival was more strongly associated with neighborhood trait composition, particularly the dominance of conservative traits such as greater wood density. The mortality patterns observed over the 6-year census interval are consistent with selective filtering at local neighborhood scales. Our study provides insights into the key processes affecting tree dynamics in species-rich karst forests and highlights that their relative importance varies between canopy and understory species and between growth and survival. Future research should leverage large-scale, long-term monitoring datasets to investigate whether these demographic patterns translate into persistent changes in forest structure and tree species composition.
-
The authors confirm their contributions to the paper as follows: conceived the study and developed the experimental design: Wang HX, Cao KF, Li QD; conducted the data analysis, programming, and compilation of results: Wang HX, Li QD; participated in the interpretation and discussion of the results: Wang YQ, Zhu SD, Cao KF; wrote the initial draft of the manuscript: Li QD, Wang HX. All authors reviewed the results and approved the final version of the manuscript.
-
The computational code and data supporting the findings of this study will be made publicly available on Figshare upon publication at https://doi.org/10.6084/m9.figshare.30738584.
-
The authors declare that they have no conflict of interest.
-
accompanies this paper online at: https://doi.org/10.48130/forres-0026-0029.
- Supplementary Table S1 Complete loadings and explained variance of the principal component analysis of five functional traits across 85 species with measured traits.
- Supplementary Table S2 General characteristics of the common species in the study.
- Supplementary Table S3 Trait-mediated effects on growth in model 5 with parameter estimates and credible intervals.
- Supplementary Table S4 Trait-mediated effects on tree survival in model 5 with parameter estimates and credible intervals.
- Supplementary Fig. S1 (A) Distribution of the species-level Composite Stature Index (CSI) and the resulting stratum classification. CSI is defined as the sum of standardized species Hmax and mean DBH (CSI = z(Hmax) + z(mean DBH)), with CSI = 0 corresponding to the overall mean stature across species. The two strata show a clear separation along this stature axis. (B) Violin plot showing the significant difference in the first principal component of traits (Tpca1) between canopy and understory species (p < 0.001). Higher Tpca1 values indicate greater wood density (WD), lower specific leaf area (SLA), and higher leaf dry matter content (LDMC). Only abundant species were included in the figures.
- Supplementary Fig. S2 The standardized effects of neighborhood trait diversity on individual growth.
- Supplementary Fig. S3 The standardized effects of neighborhood competition pressure on focal tree survival mediated by different traits.
- Supplementary Fig. S4 Relationships between log-transformed environmental conditions and the log-transformed number of individuals per 20 m × 20 m quadrat for (a), (c), (e) canopy species and (b), (d), (f) understory species.
- Copyright: © 2026 by the author(s). Published by Maximum Academic Press, Fayetteville, GA. This article is an open access article distributed under Creative Commons Attribution License (CC BY 4.0), visit https://creativecommons.org/licenses/by/4.0/.
-
About this article
Cite this article
Wang HX, Li QD, Wang YQ, Zhu SD, Cao KF. 2026. Functional traits are linked to interspecific trade-offs and neighborhood effects on tree growth and survival in a subtropical karst forest. Forestry Research 6: e030 doi: 10.48130/forres-0026-0029 

Functional traits are linked to interspecific trade-offs and neighborhood effects on tree growth and survival in a subtropical karst forest
- Received: 20 December 2025
- Revised: 14 August 2026
- Accepted: 14 September 2026
- Published online: 12 October 2026
Abstract: Understanding tree demography and community assembly in species-rich forests is fundamental to forest conservation and management. Subtropical karst forests, shaped by intense edaphic constraints and environmental stress, provide a unique system for examining associations of functional traits and neighborhood interactions with tree growth and survival. Using an individual-based modeling approach incorporating species-level mean trait values to characterize interspecific trait variation, we analyzed 6 years of demographic data from 12,363 trees, focusing on 79 species to examine factors associated with individual growth and survival. Tree size was the most important factor associated with both individual diameter growth and survival probability. Across all species, individual growth decreased with elevation and rock outcrop cover but increased with light availability. Despite differences between canopy and understory species groups, analyses based on species-level mean traits showed interspecific trade-offs between species' diameter growth and survival, as well as in their responses to neighborhood crowding. Fast-growing species were more susceptible to crowding effects, whereas conservative species showed lower mean growth rates but greater survival probabilities. Species with denser wood were also more tolerant of crowding and exerted stronger competitive effects on their neighbors. Local species and trait diversity were positively associated with focal tree growth, whereas survival, particularly in understory species, showed more consistent associations with neighborhood trait composition, in line with expectations of a trait-mediated competitive hierarchy. The observed mortality patterns are consistent with the possibility that local mortality filtering may favor stress-tolerant species with conservative traits in karst ecosystems. However, whether the demographic patterns identified here translate into persistent changes in community structure requires longer-term monitoring.