-
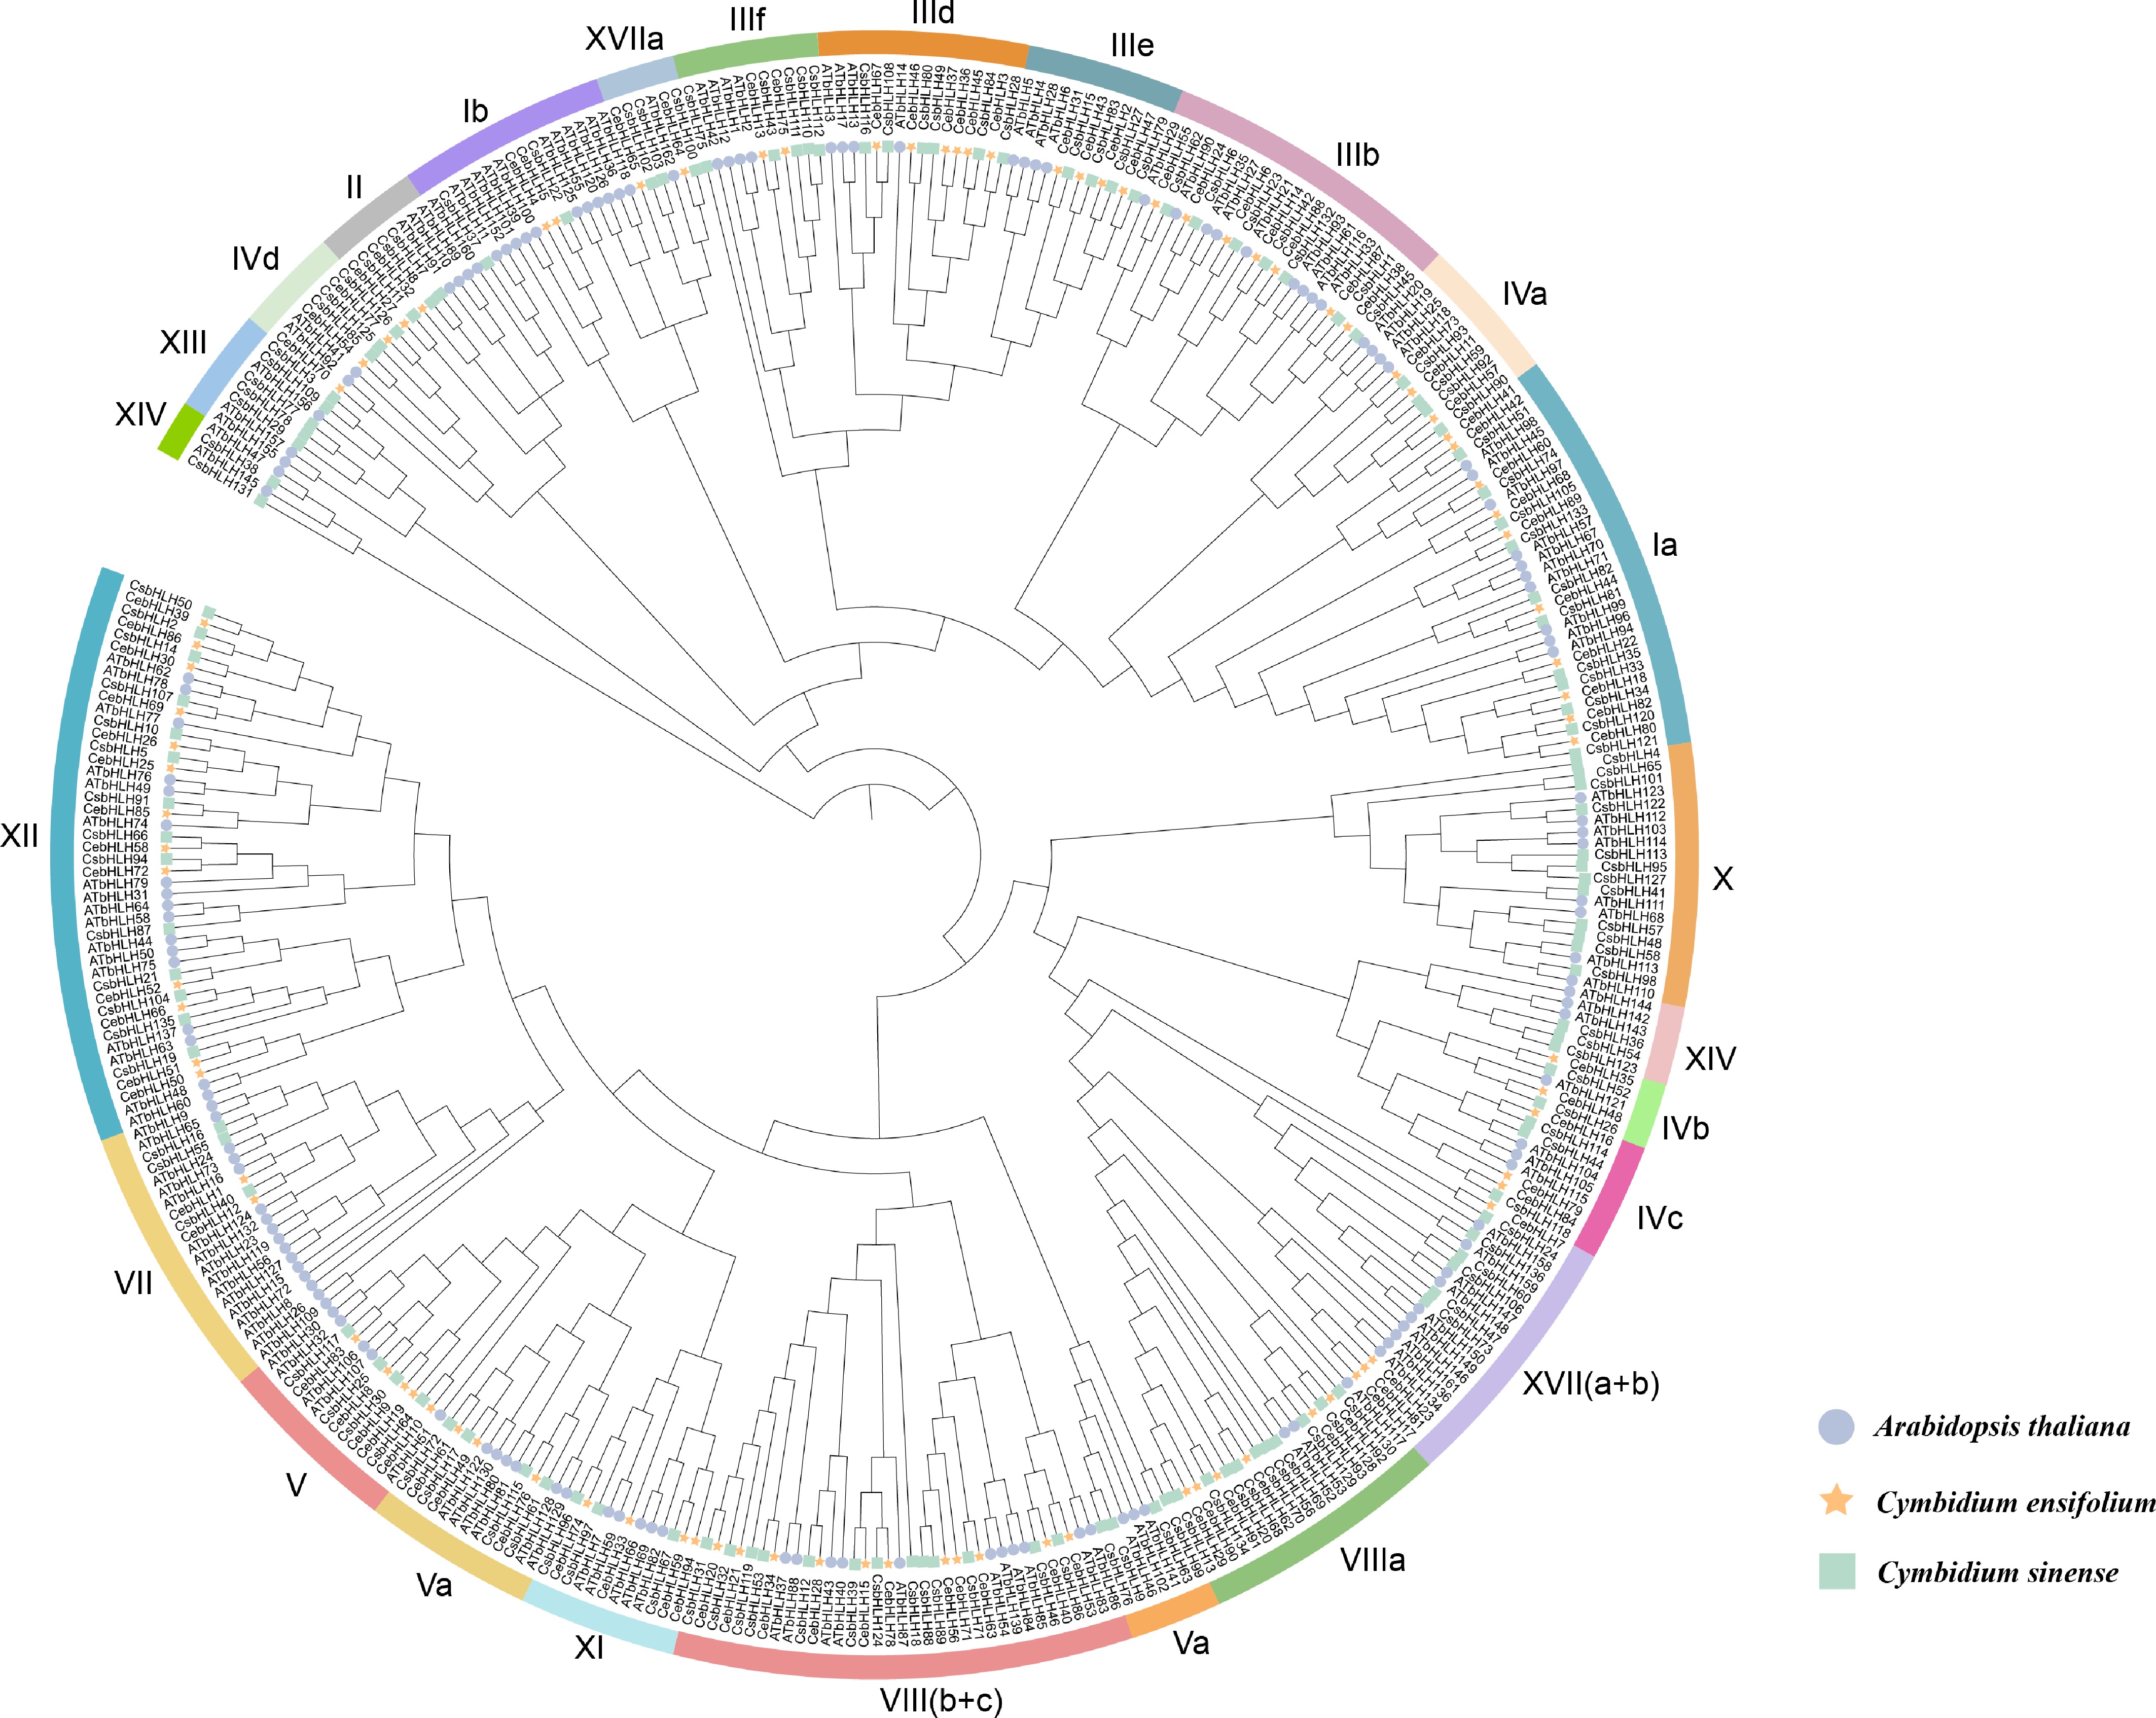
Figure 1.
Comparative phylogeny of bHLH protein families across C. sinense (136), C. ensifolium (94), and A. thaliana (162). Circle: AtbHLHs. Pentagram: CebHLHs. Square: CsbHLHs. Color-coded bands represent the 23 subfamilies.
-
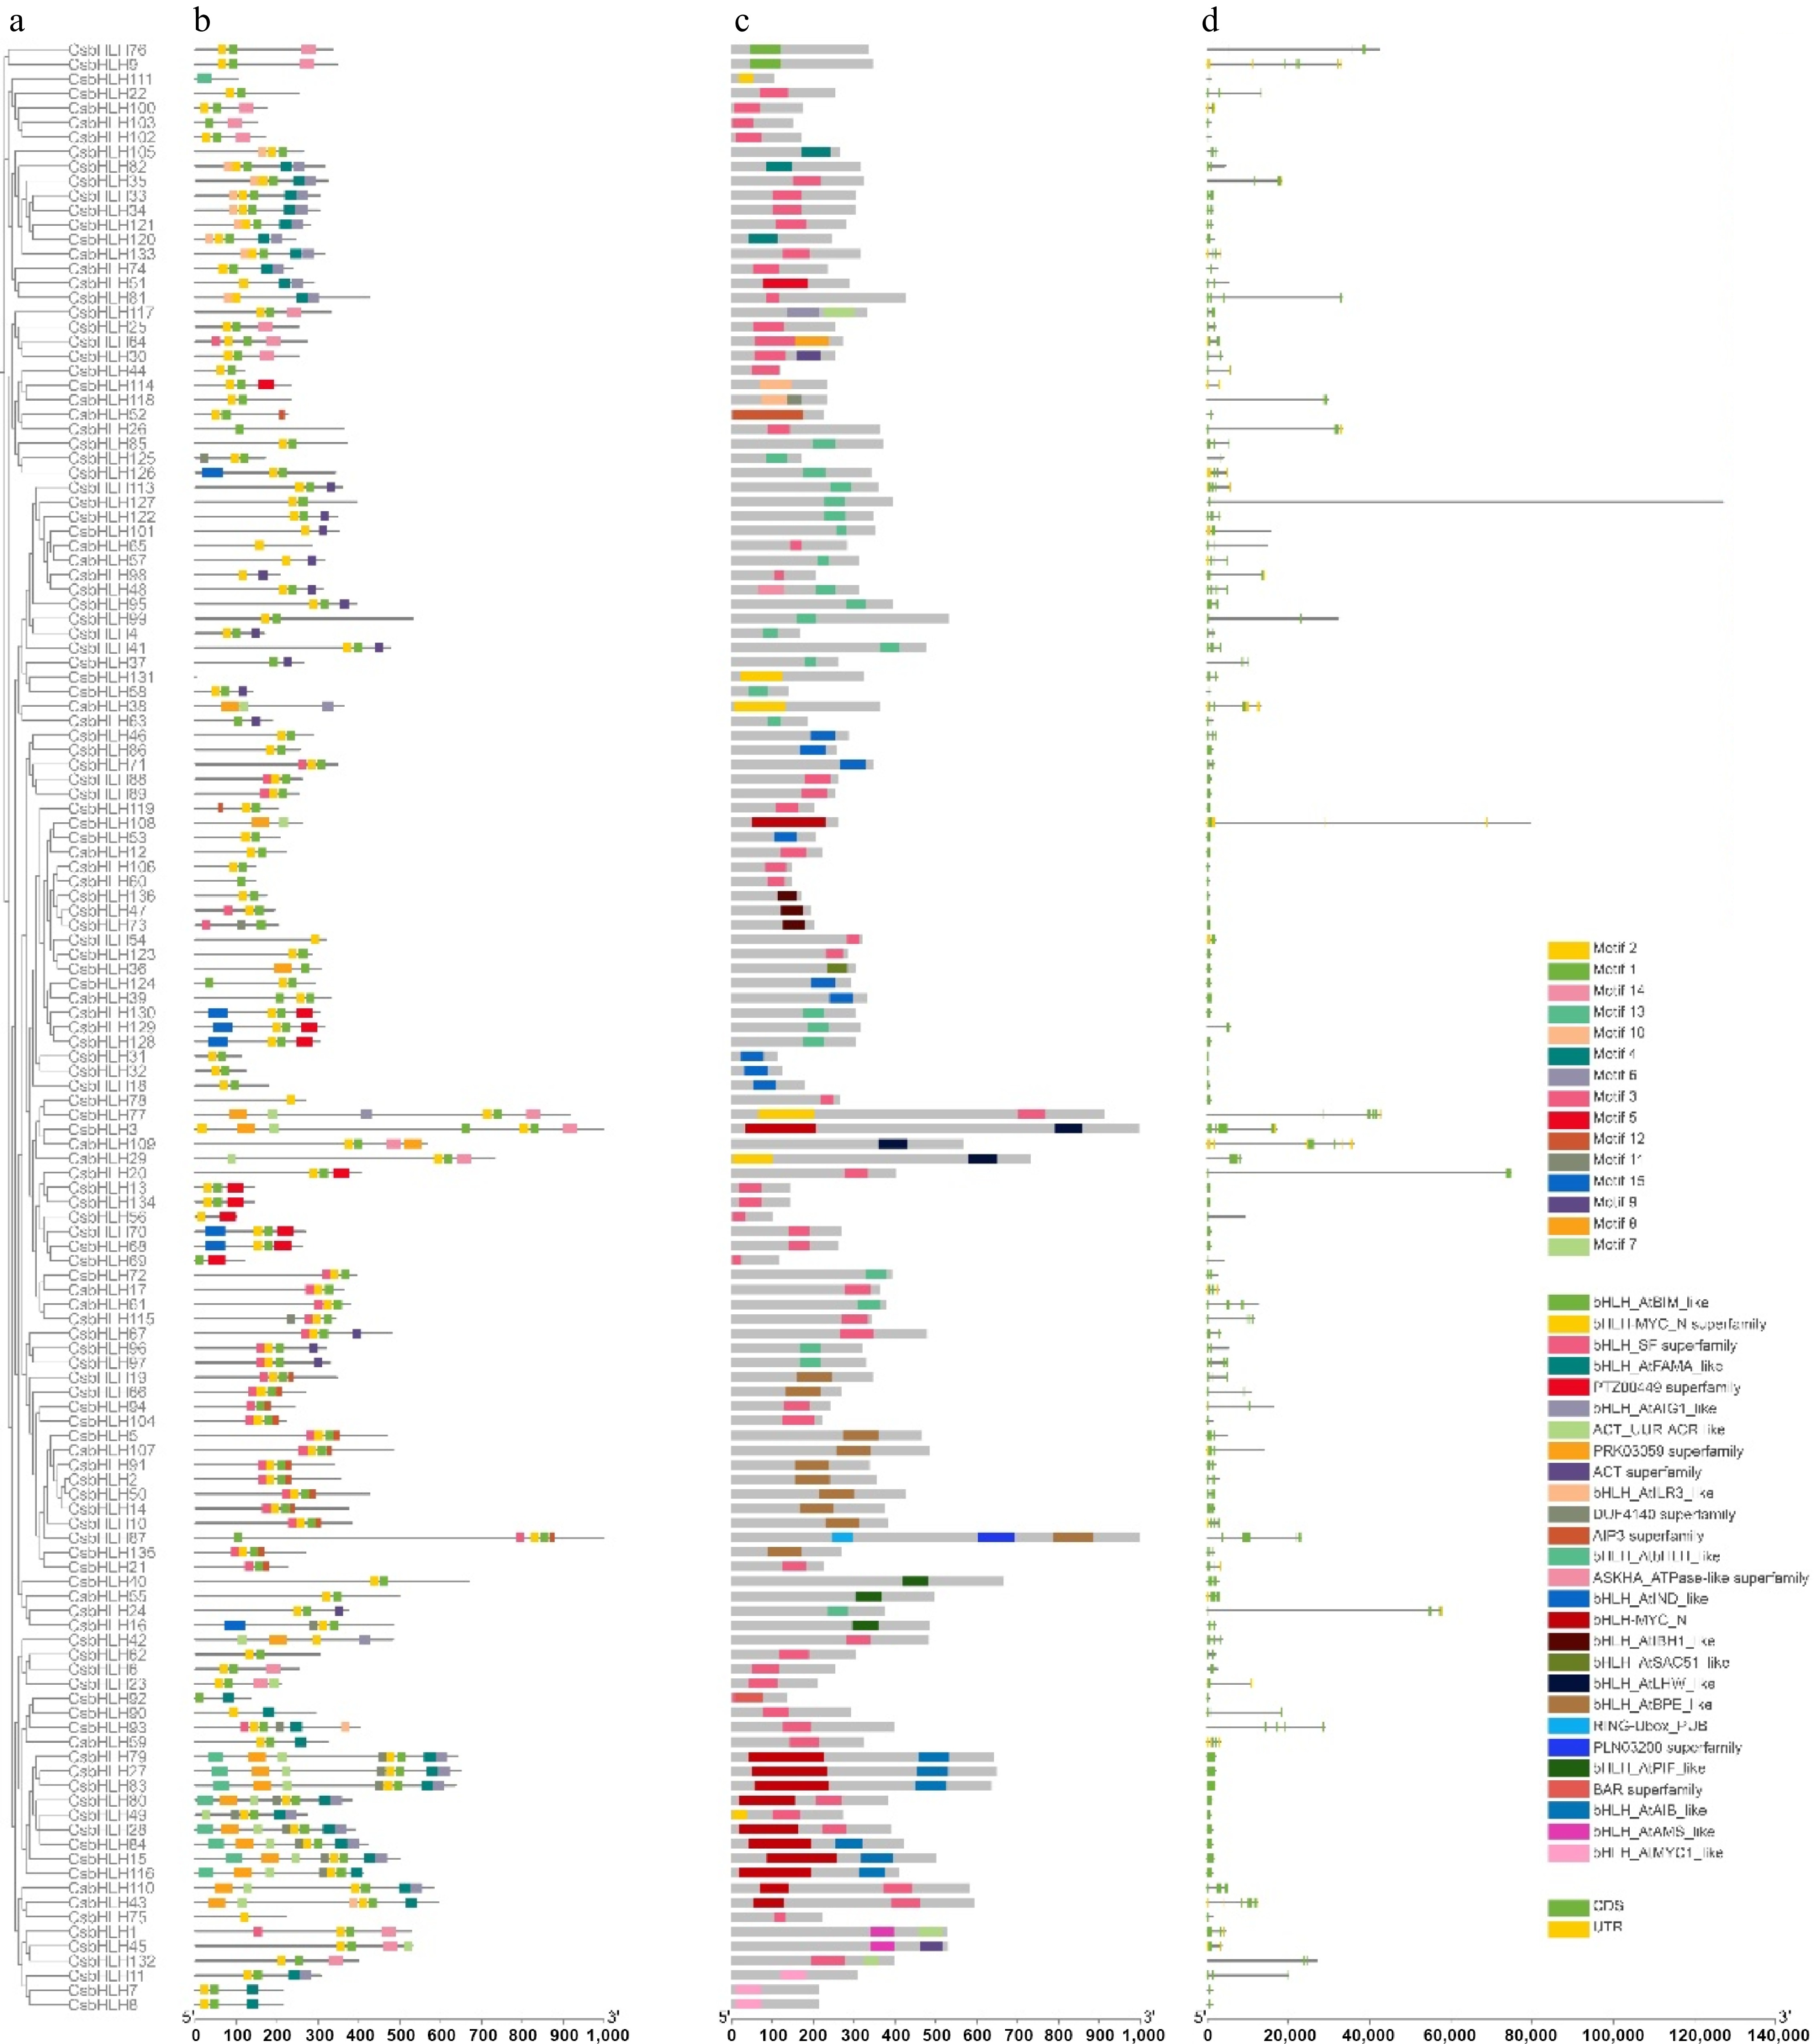
Figure 2.
Motif map, gene structure, and conserved motifs of bHLH gene family members in C. sinense. (a) Motifs of CsbHLHs; (b) domains of CsbHLHs; (c) gene structure of CsbHLHs. The legend is on the right.
-
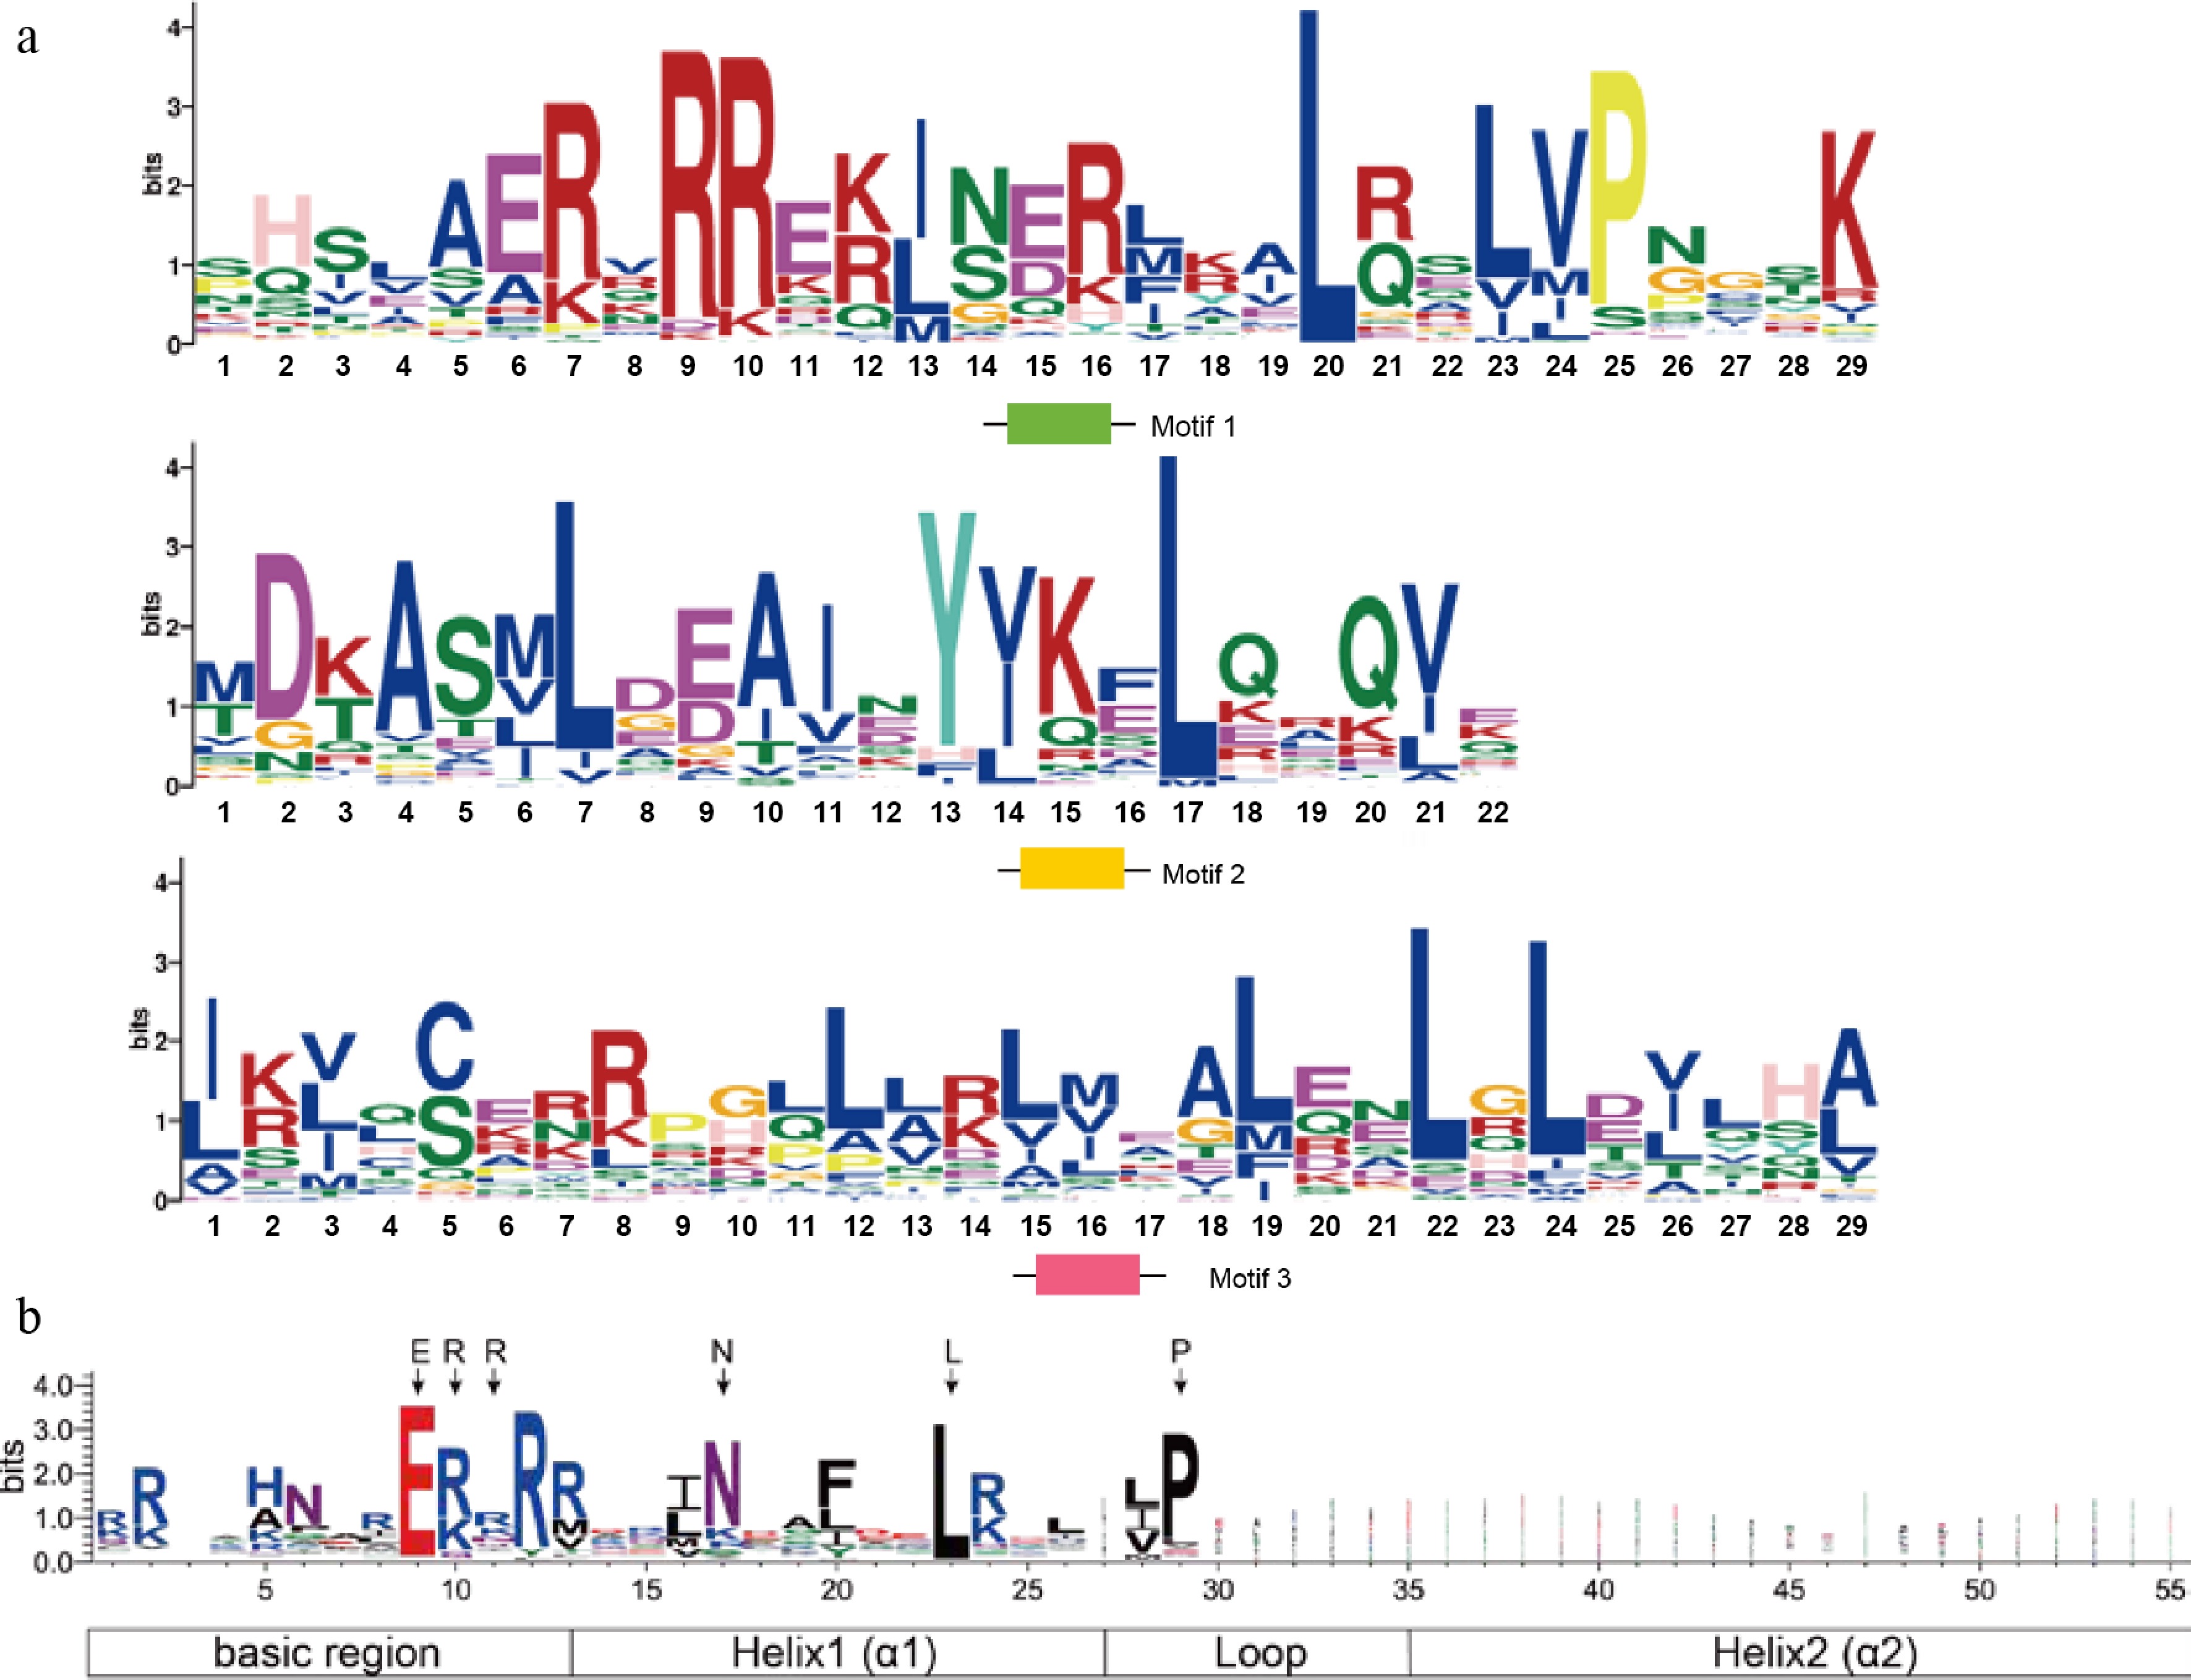
Figure 3.
Sequence logo analysis of conserved motifs in C. sinense bHLH proteins. (a) Sequence logos of the major conserved motifs identified by MEME analysis, highlighting conserved residues within the bHLH domain. (b) Sequence logo of the representative bHLH domain, showing the characteristic basic region and helix-loop-helix structure.
-
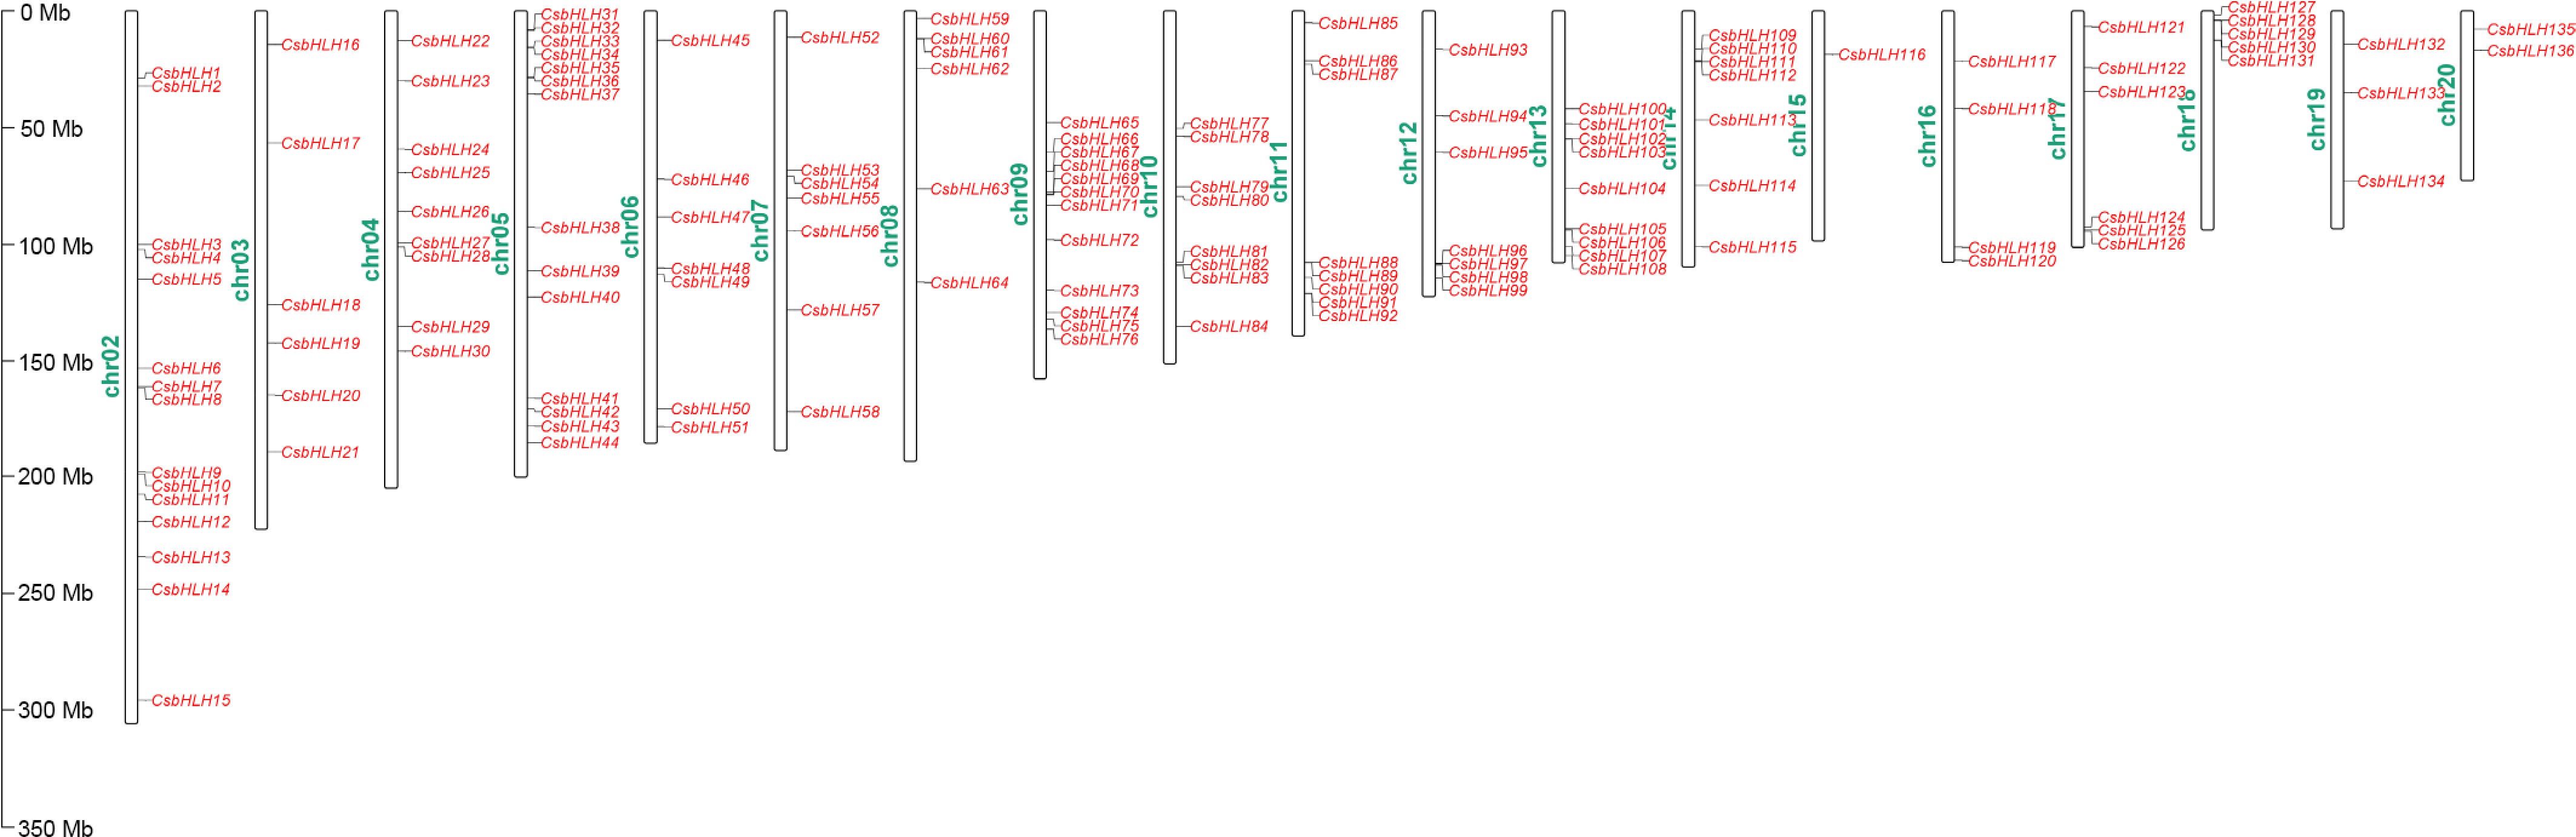
Figure 4.
Distributions of 136 CsbHLHs on chromosomes.
-
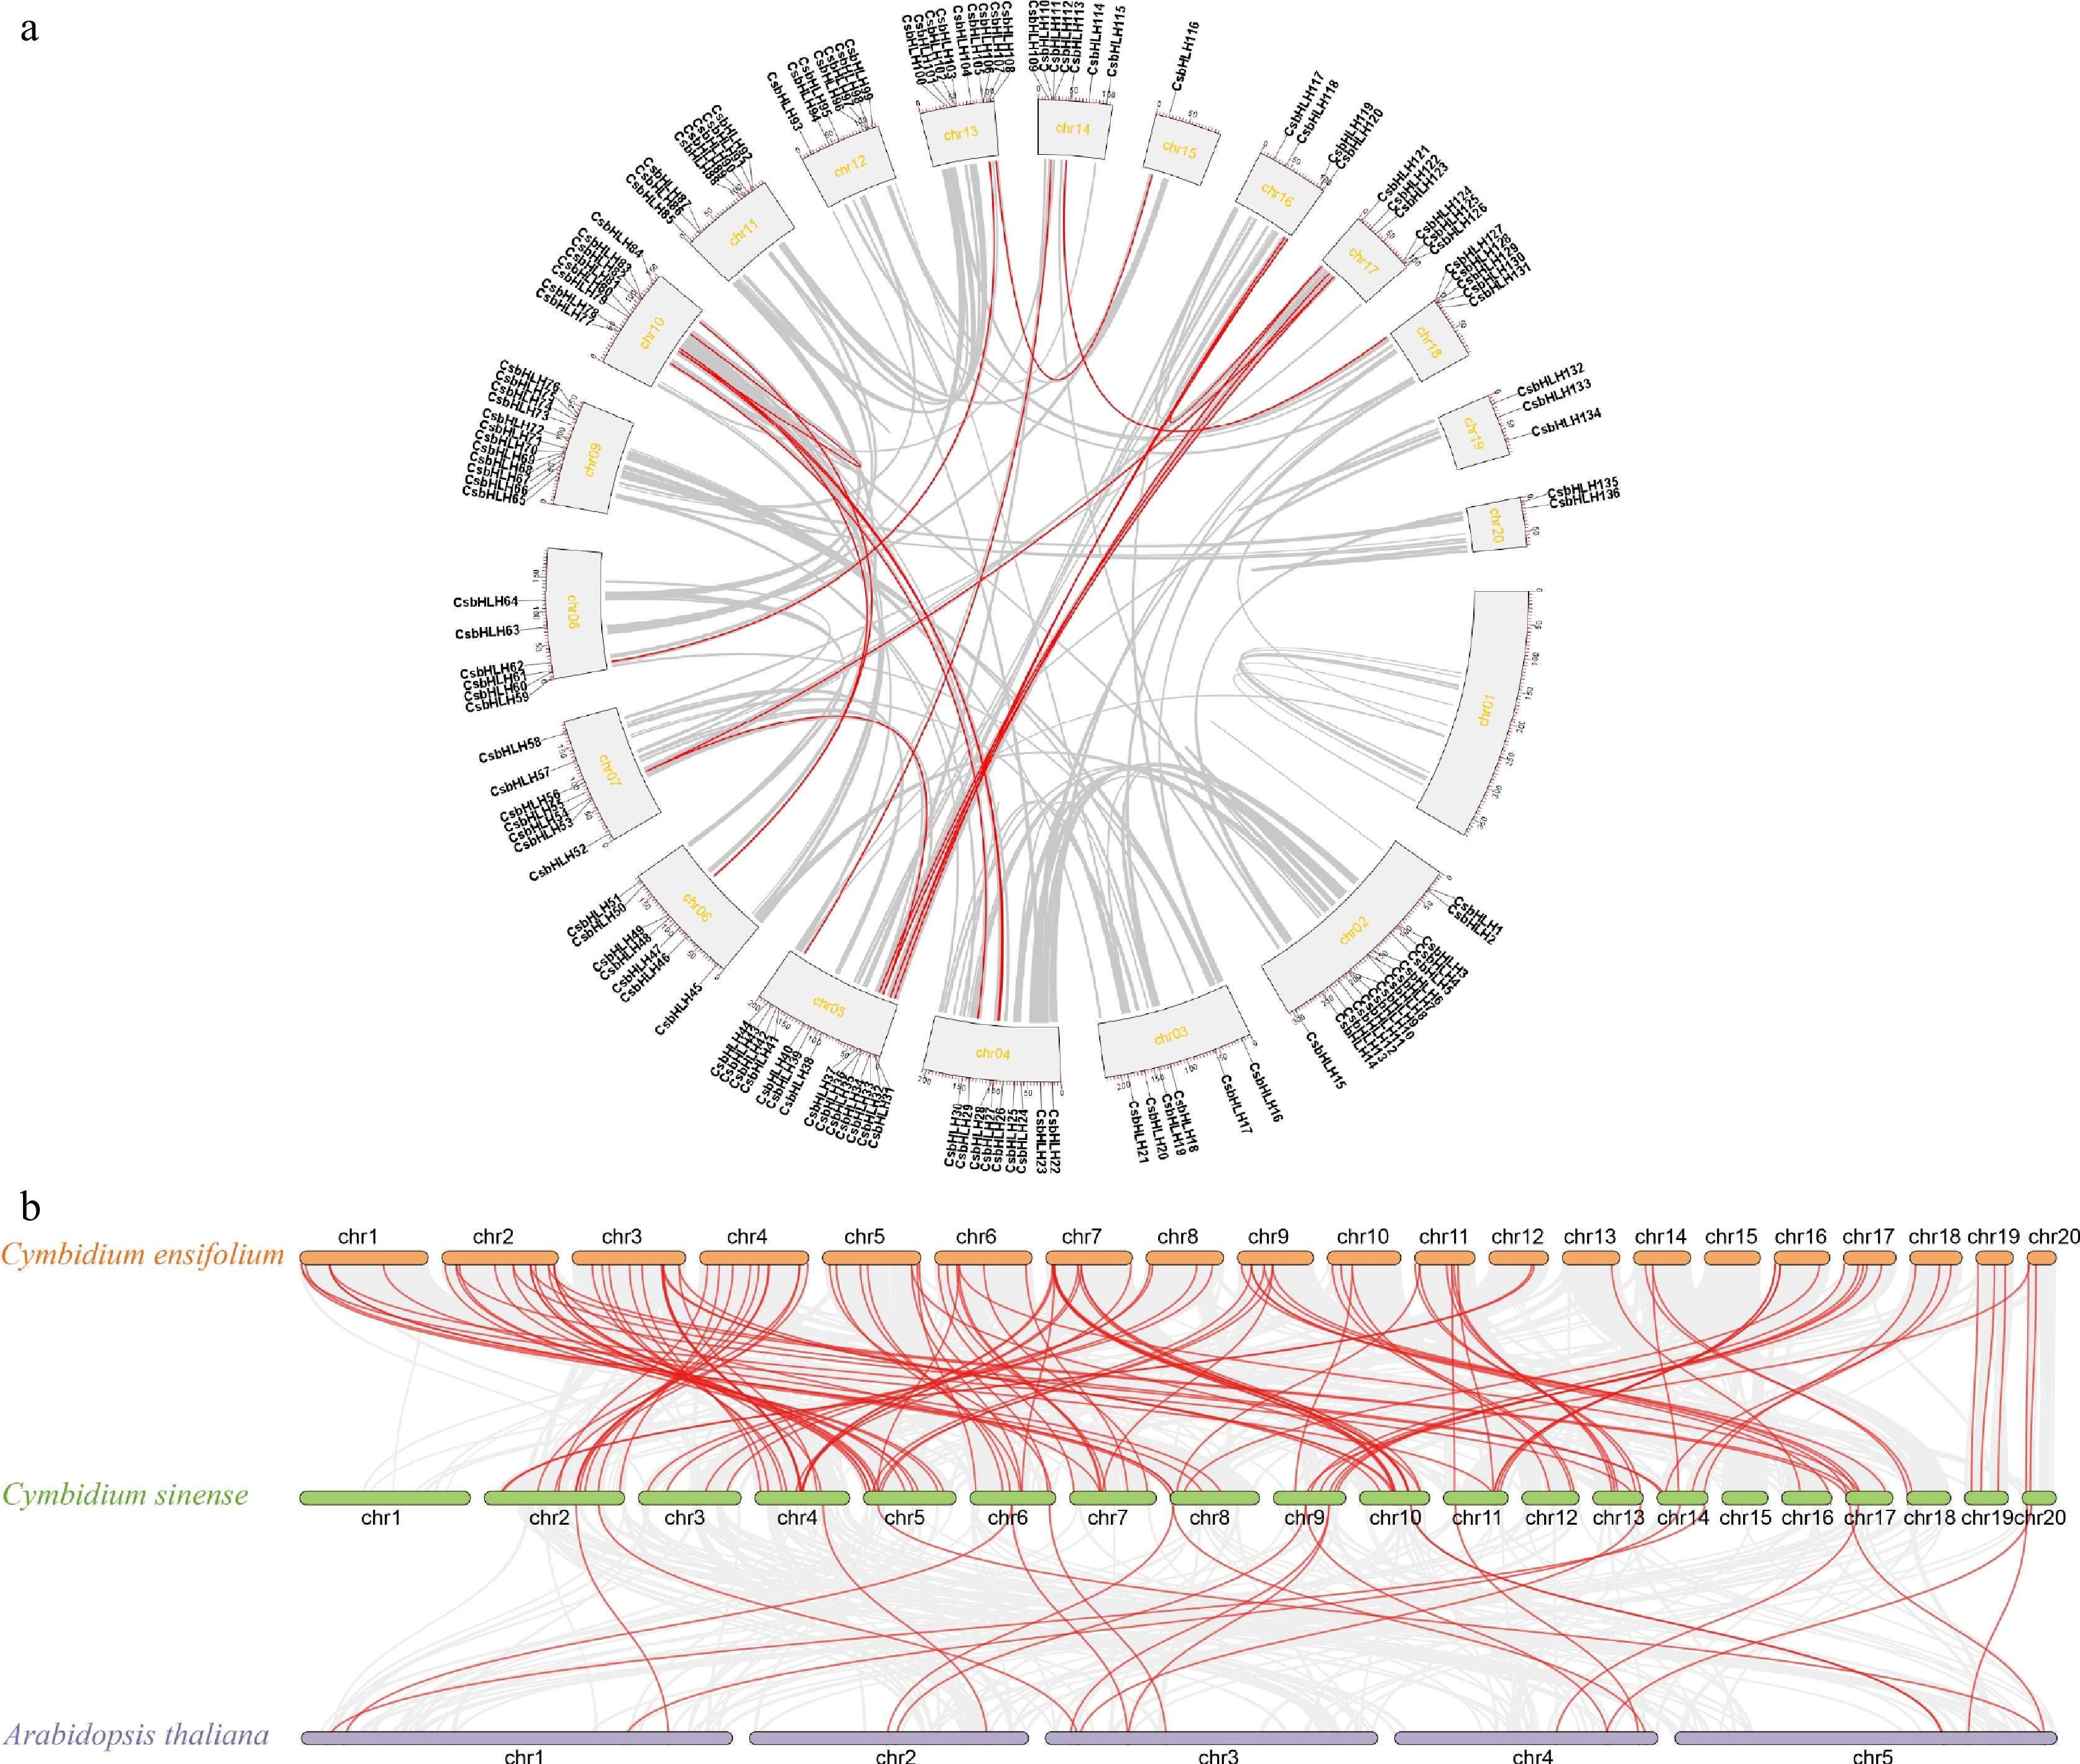
Figure 5.
Synteny analysis of CsbHLH genes within C. sinense and among C. sinense, C. ensifolium, and A. thaliana. (a) Intraspecific synteny analysis of CsbHLH genes in C. sinense. (b) Interspecific synteny analysis of bHLH genes among C. sinense, C. ensifolium, and A. thaliana.
-
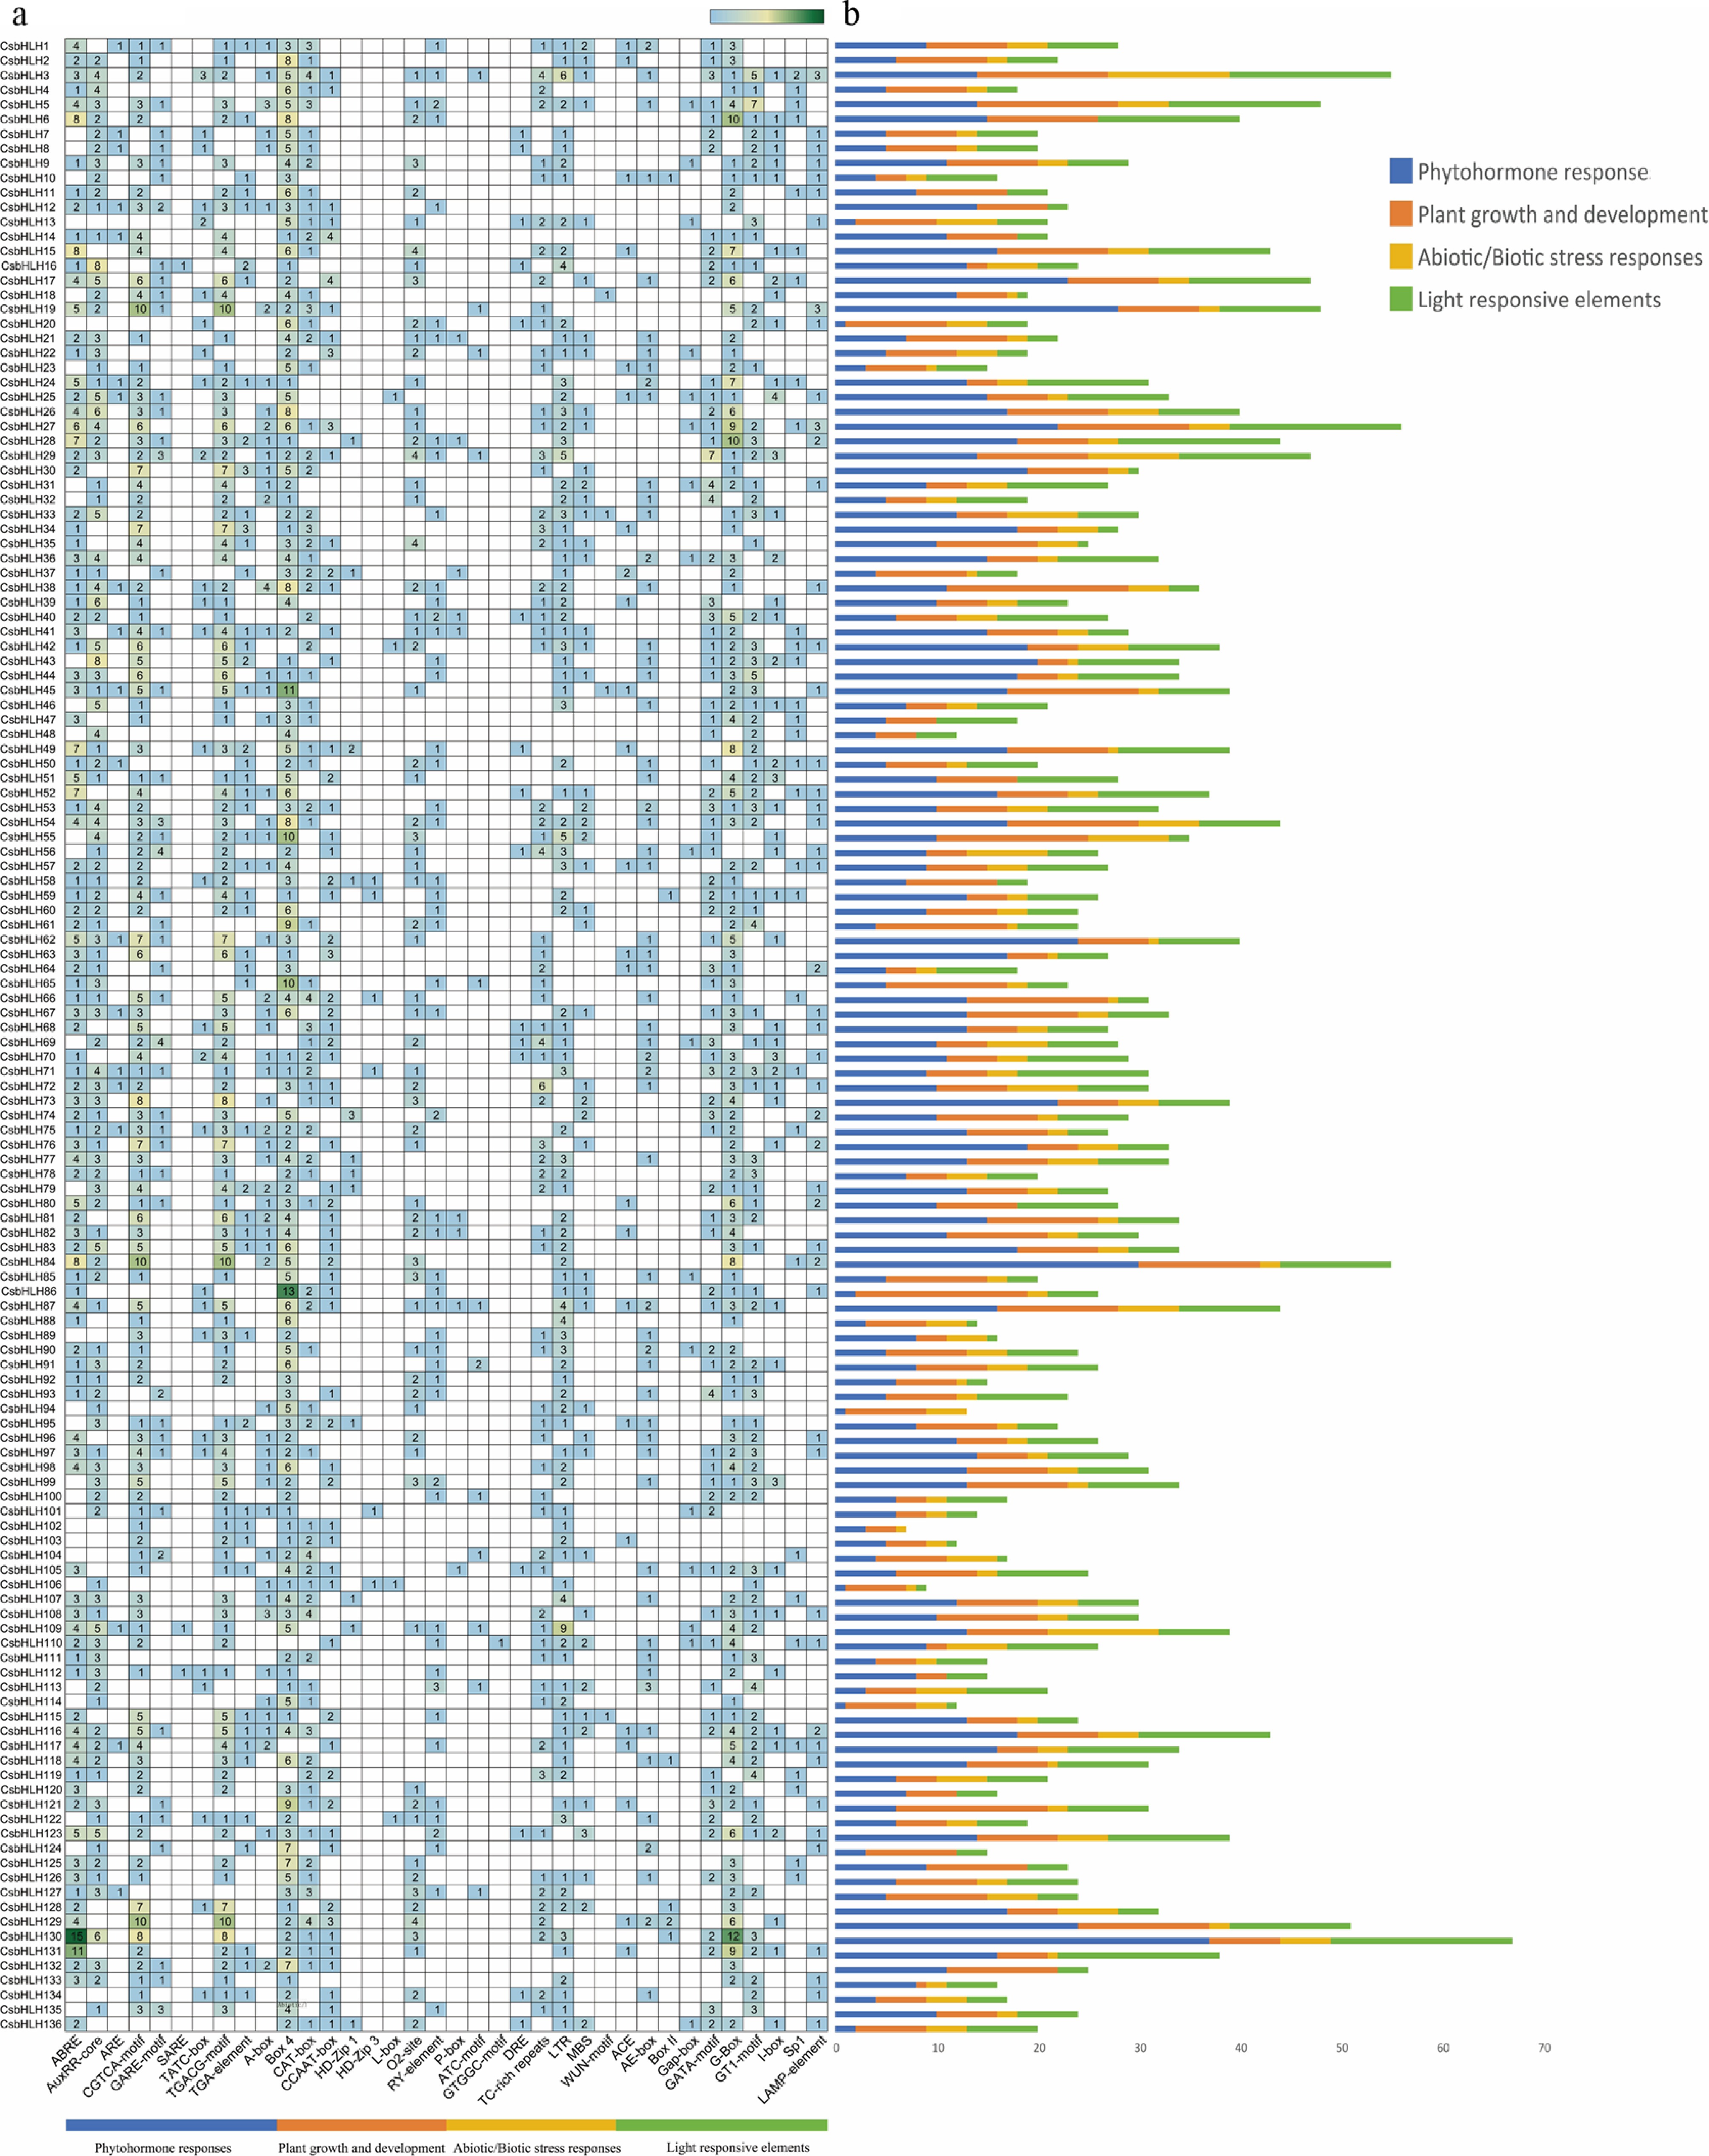
Figure 6.
Promoter cis-element profiling of CsbHLHs. (a) Census of cis-elements in CsbHLHs. (b) The four major cis-element categories are color-coded: blue (phytohormone responses), green (light-responsive elements), orange (plant growth and development), and yellow (abiotic/biotic stress responses).
-
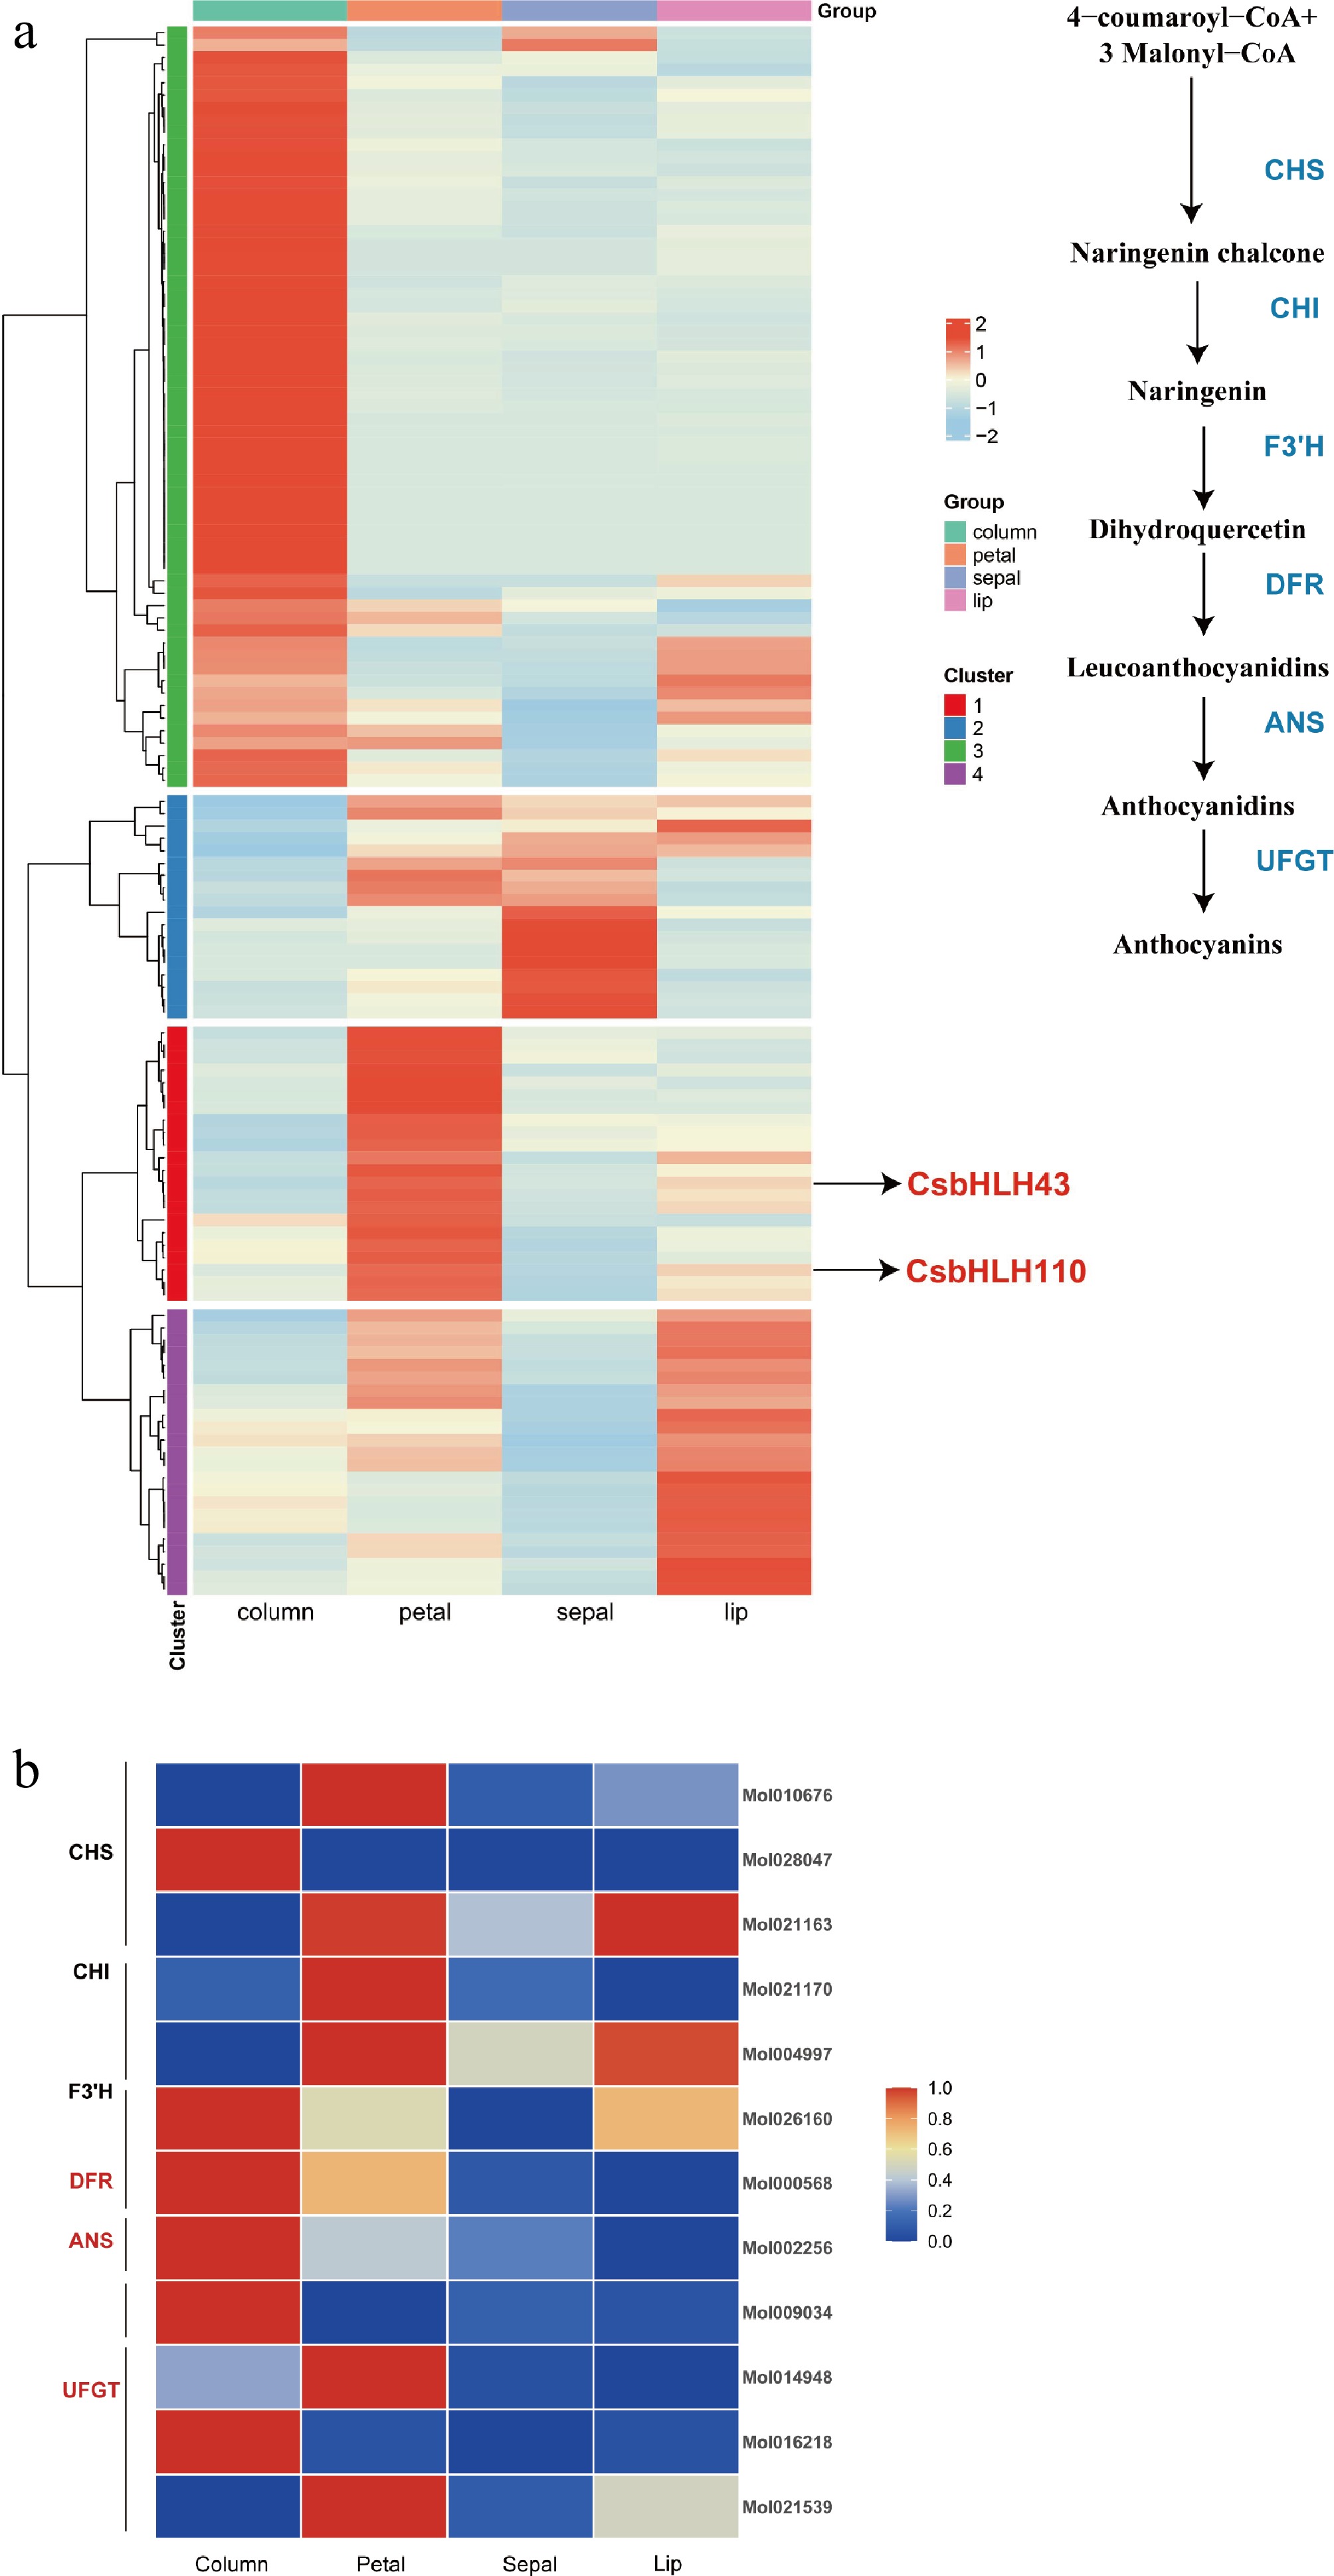
Figure 7.
Expression analysis of bHLH transcription factors and representative flavonoid biosynthesis-related genes. (a) Expression heatmap of bHLH transcription factors across different floral organs. (b) Expression of flavonoid biosynthesis genes.
-
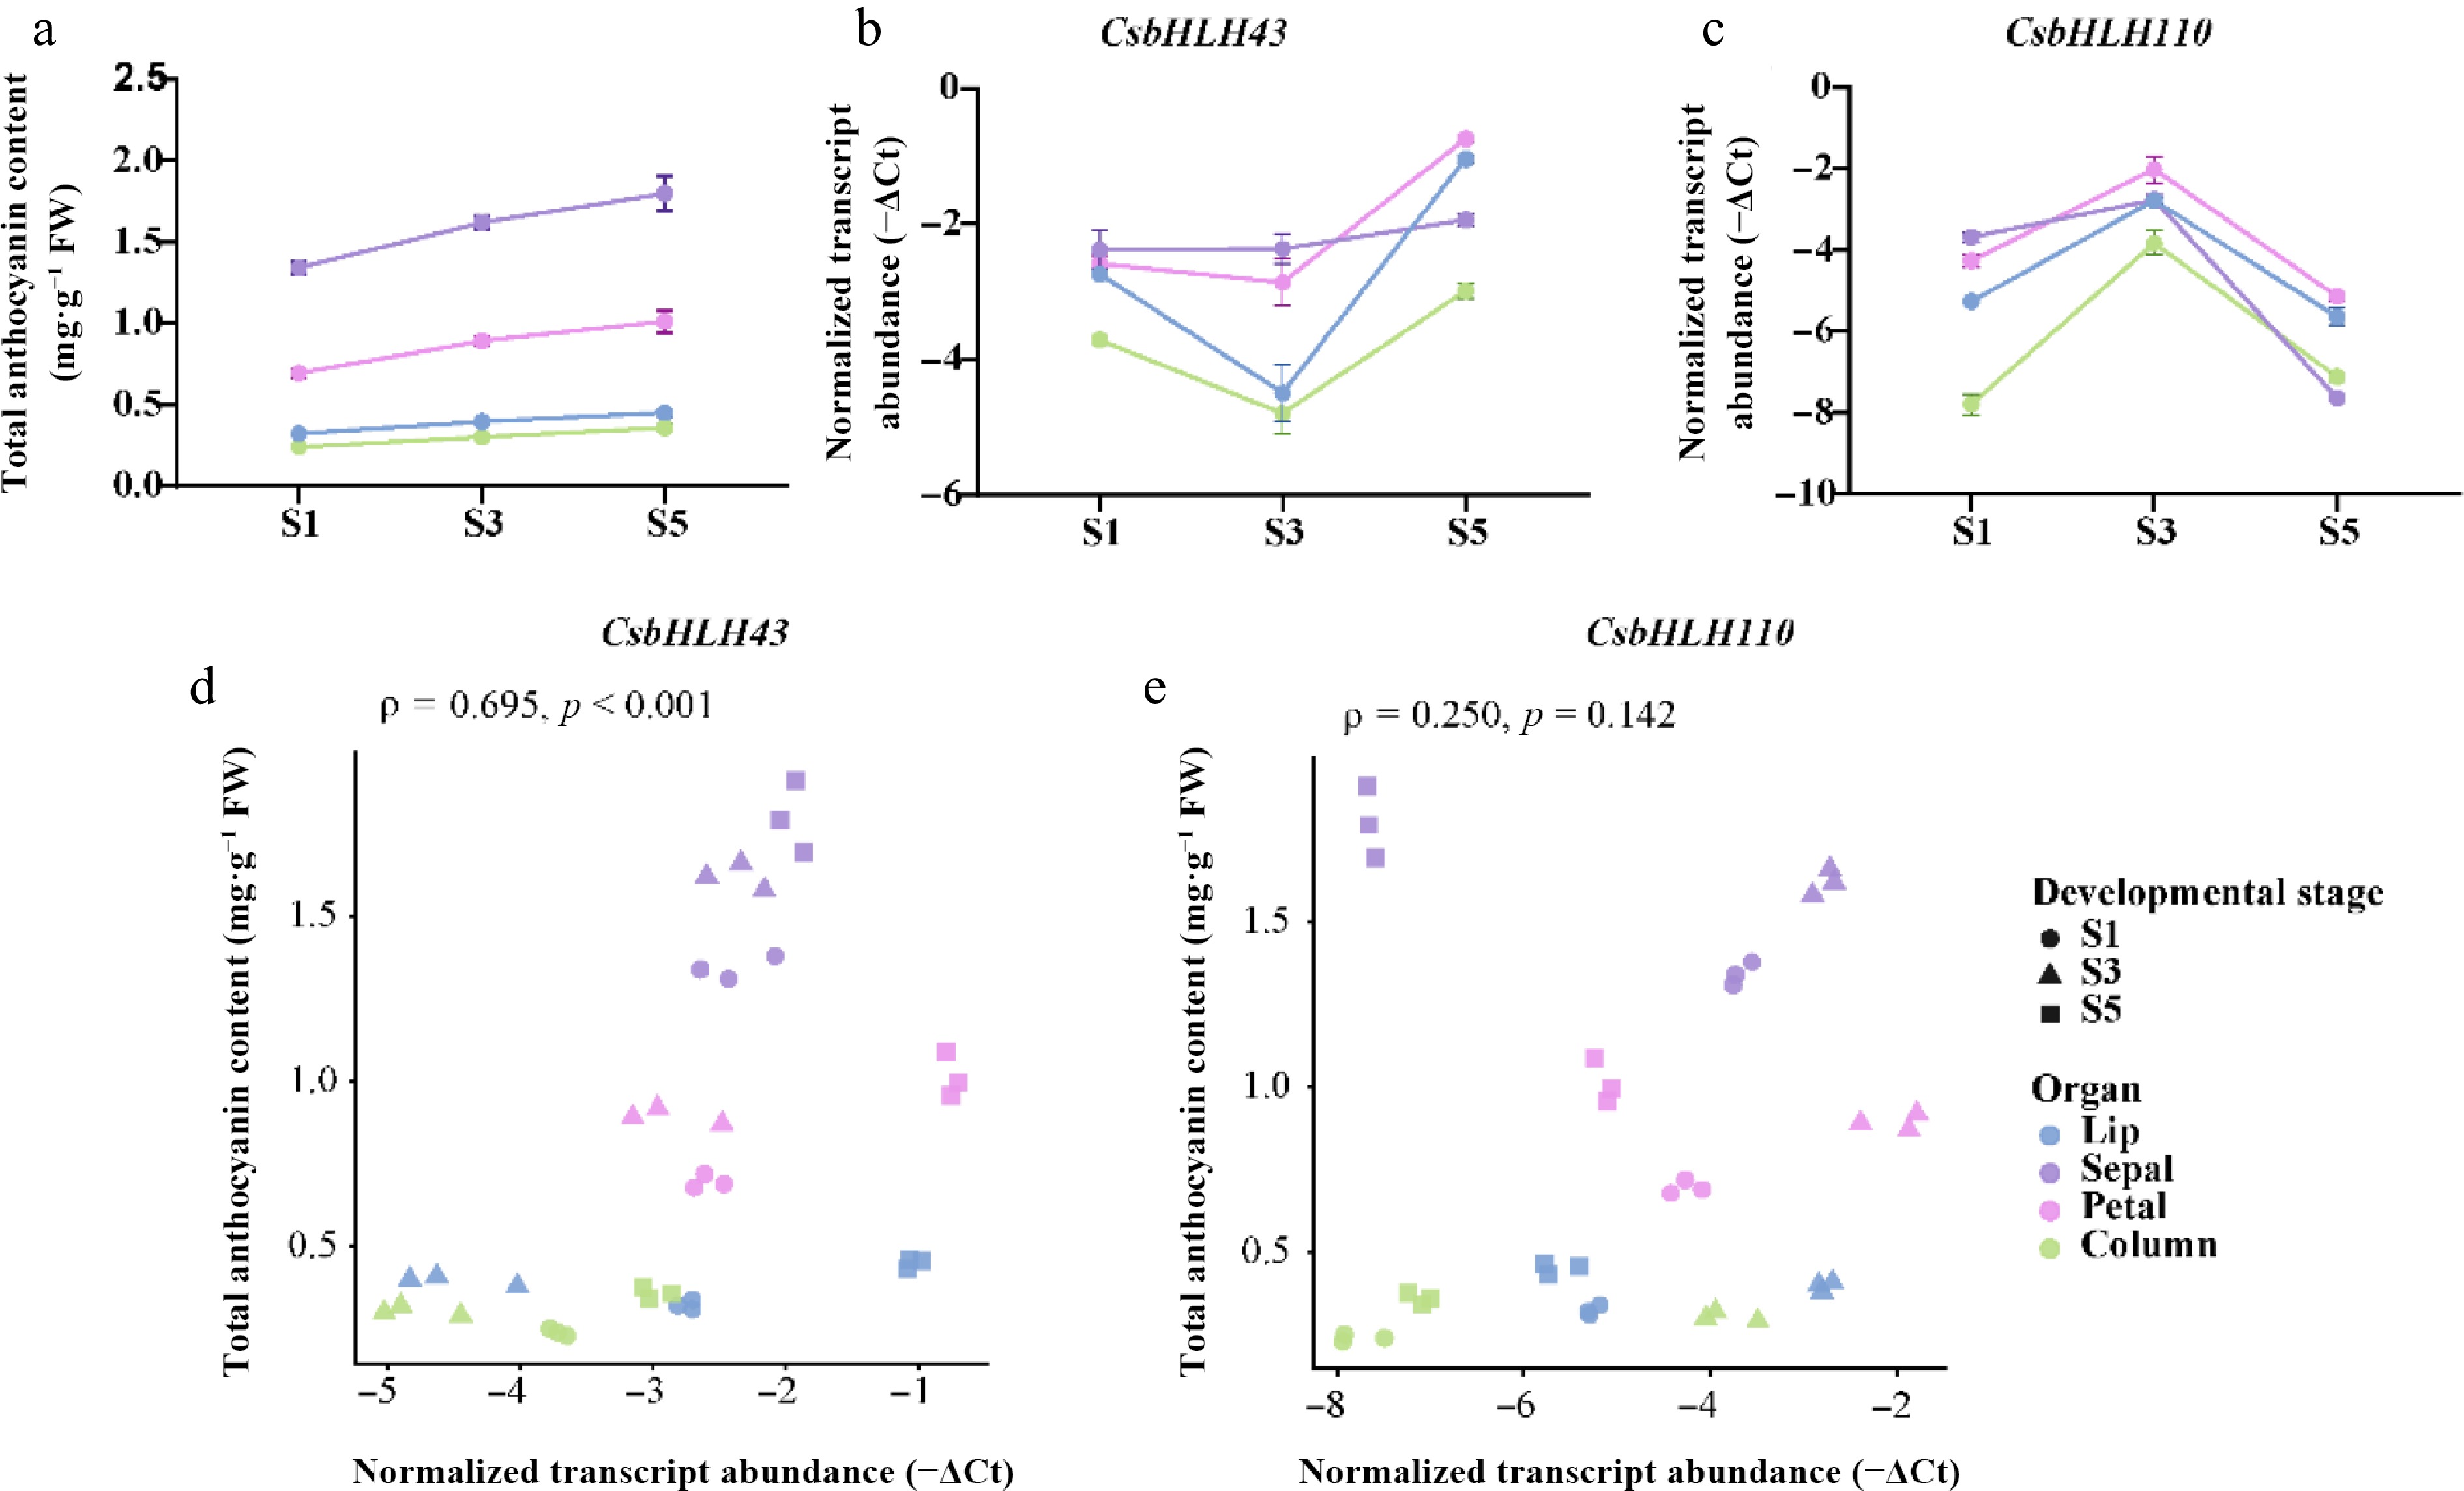
Figure 8.
Developmental changes in anthocyanin content and expression of candidate CsbHLH genes. (a) Total anthocyanin content in four floral organs at S1, S3, and S5. Transcript abundance of (b) CsbHLH43 and (c) CsbHLH110, expressed as −ΔCt values, with higher values indicating greater transcript abundance. Values in (a)–(c) are means ± SD of three biological replicates. (d), (e) Spearman correlations between anthocyanin content and transcript abundance across 36 biological samples.
-
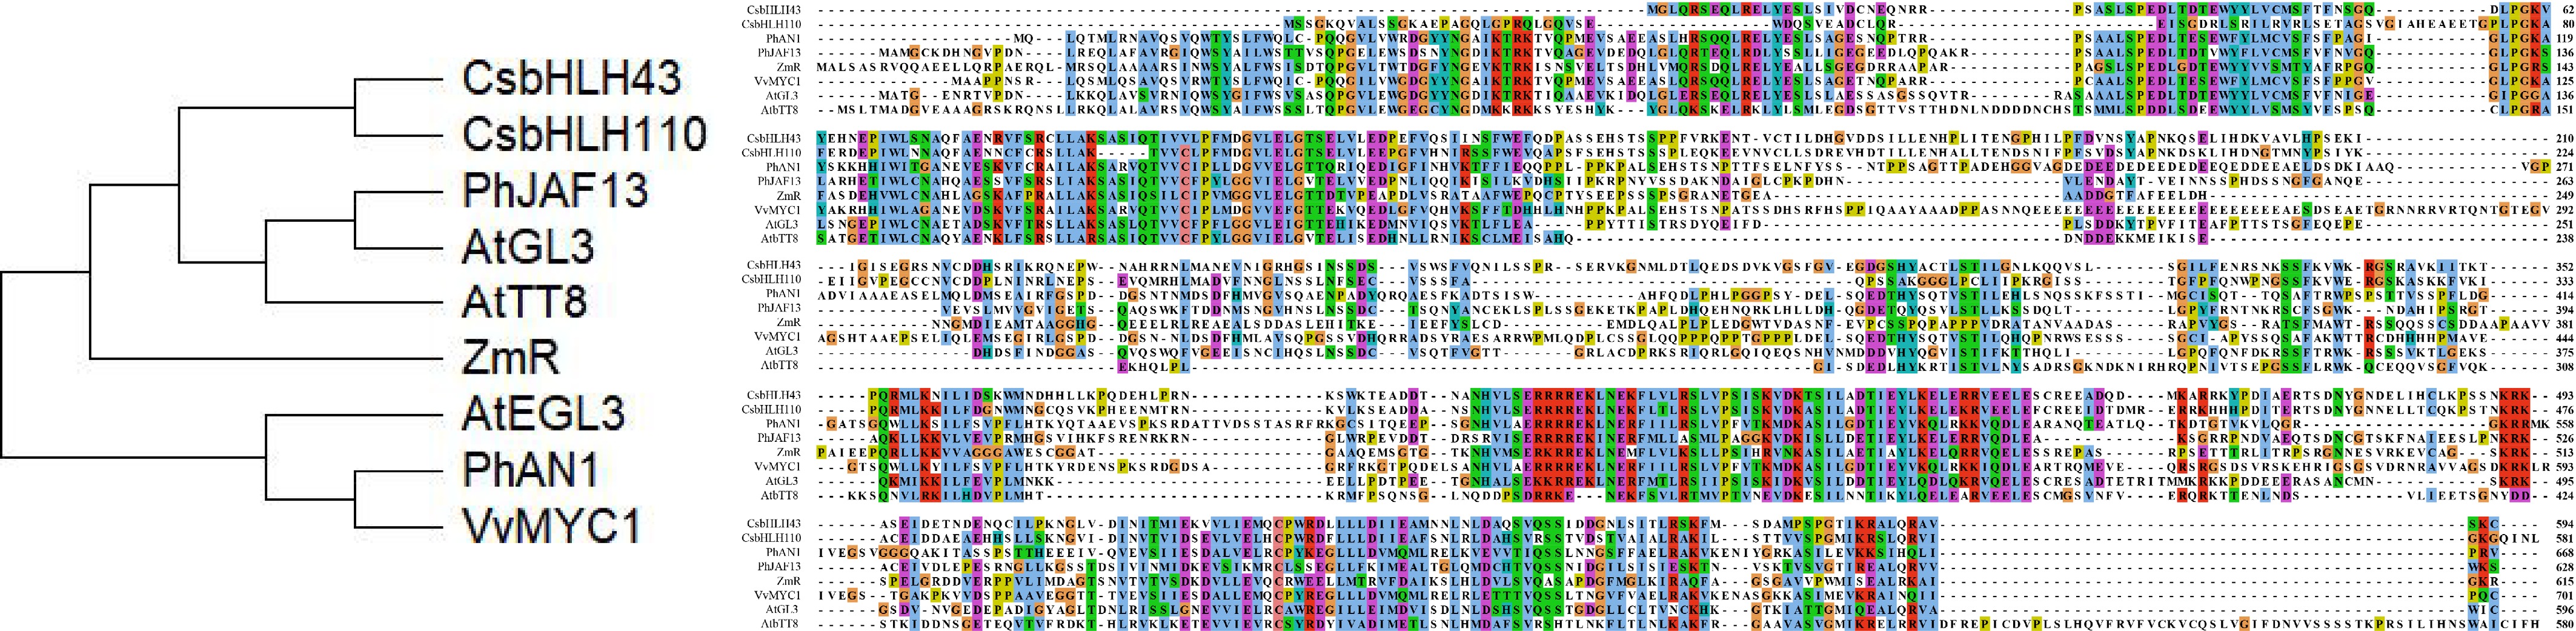
Figure 9.
Phylogenetic analysis and conserved domain alignment of candidate CsbHLHs. Multiple sequence alignment of CsbHLH43 and CsbHLH110 with bHLH amino acid sequences from other species: At: A. thaliana (AtGL3, AT5G41315; AtEGL3, AT1G63650; AtTT8, AT4G09820), Ph: Petunia hybrida (PhJAF13, AAC39455.1; PhAN1, AAG25928.1), Zm: Zea mays (ZmR, NP_001105339.2), Vv: Vitis vinifera (VvMYC1, ACC68685.1).
-
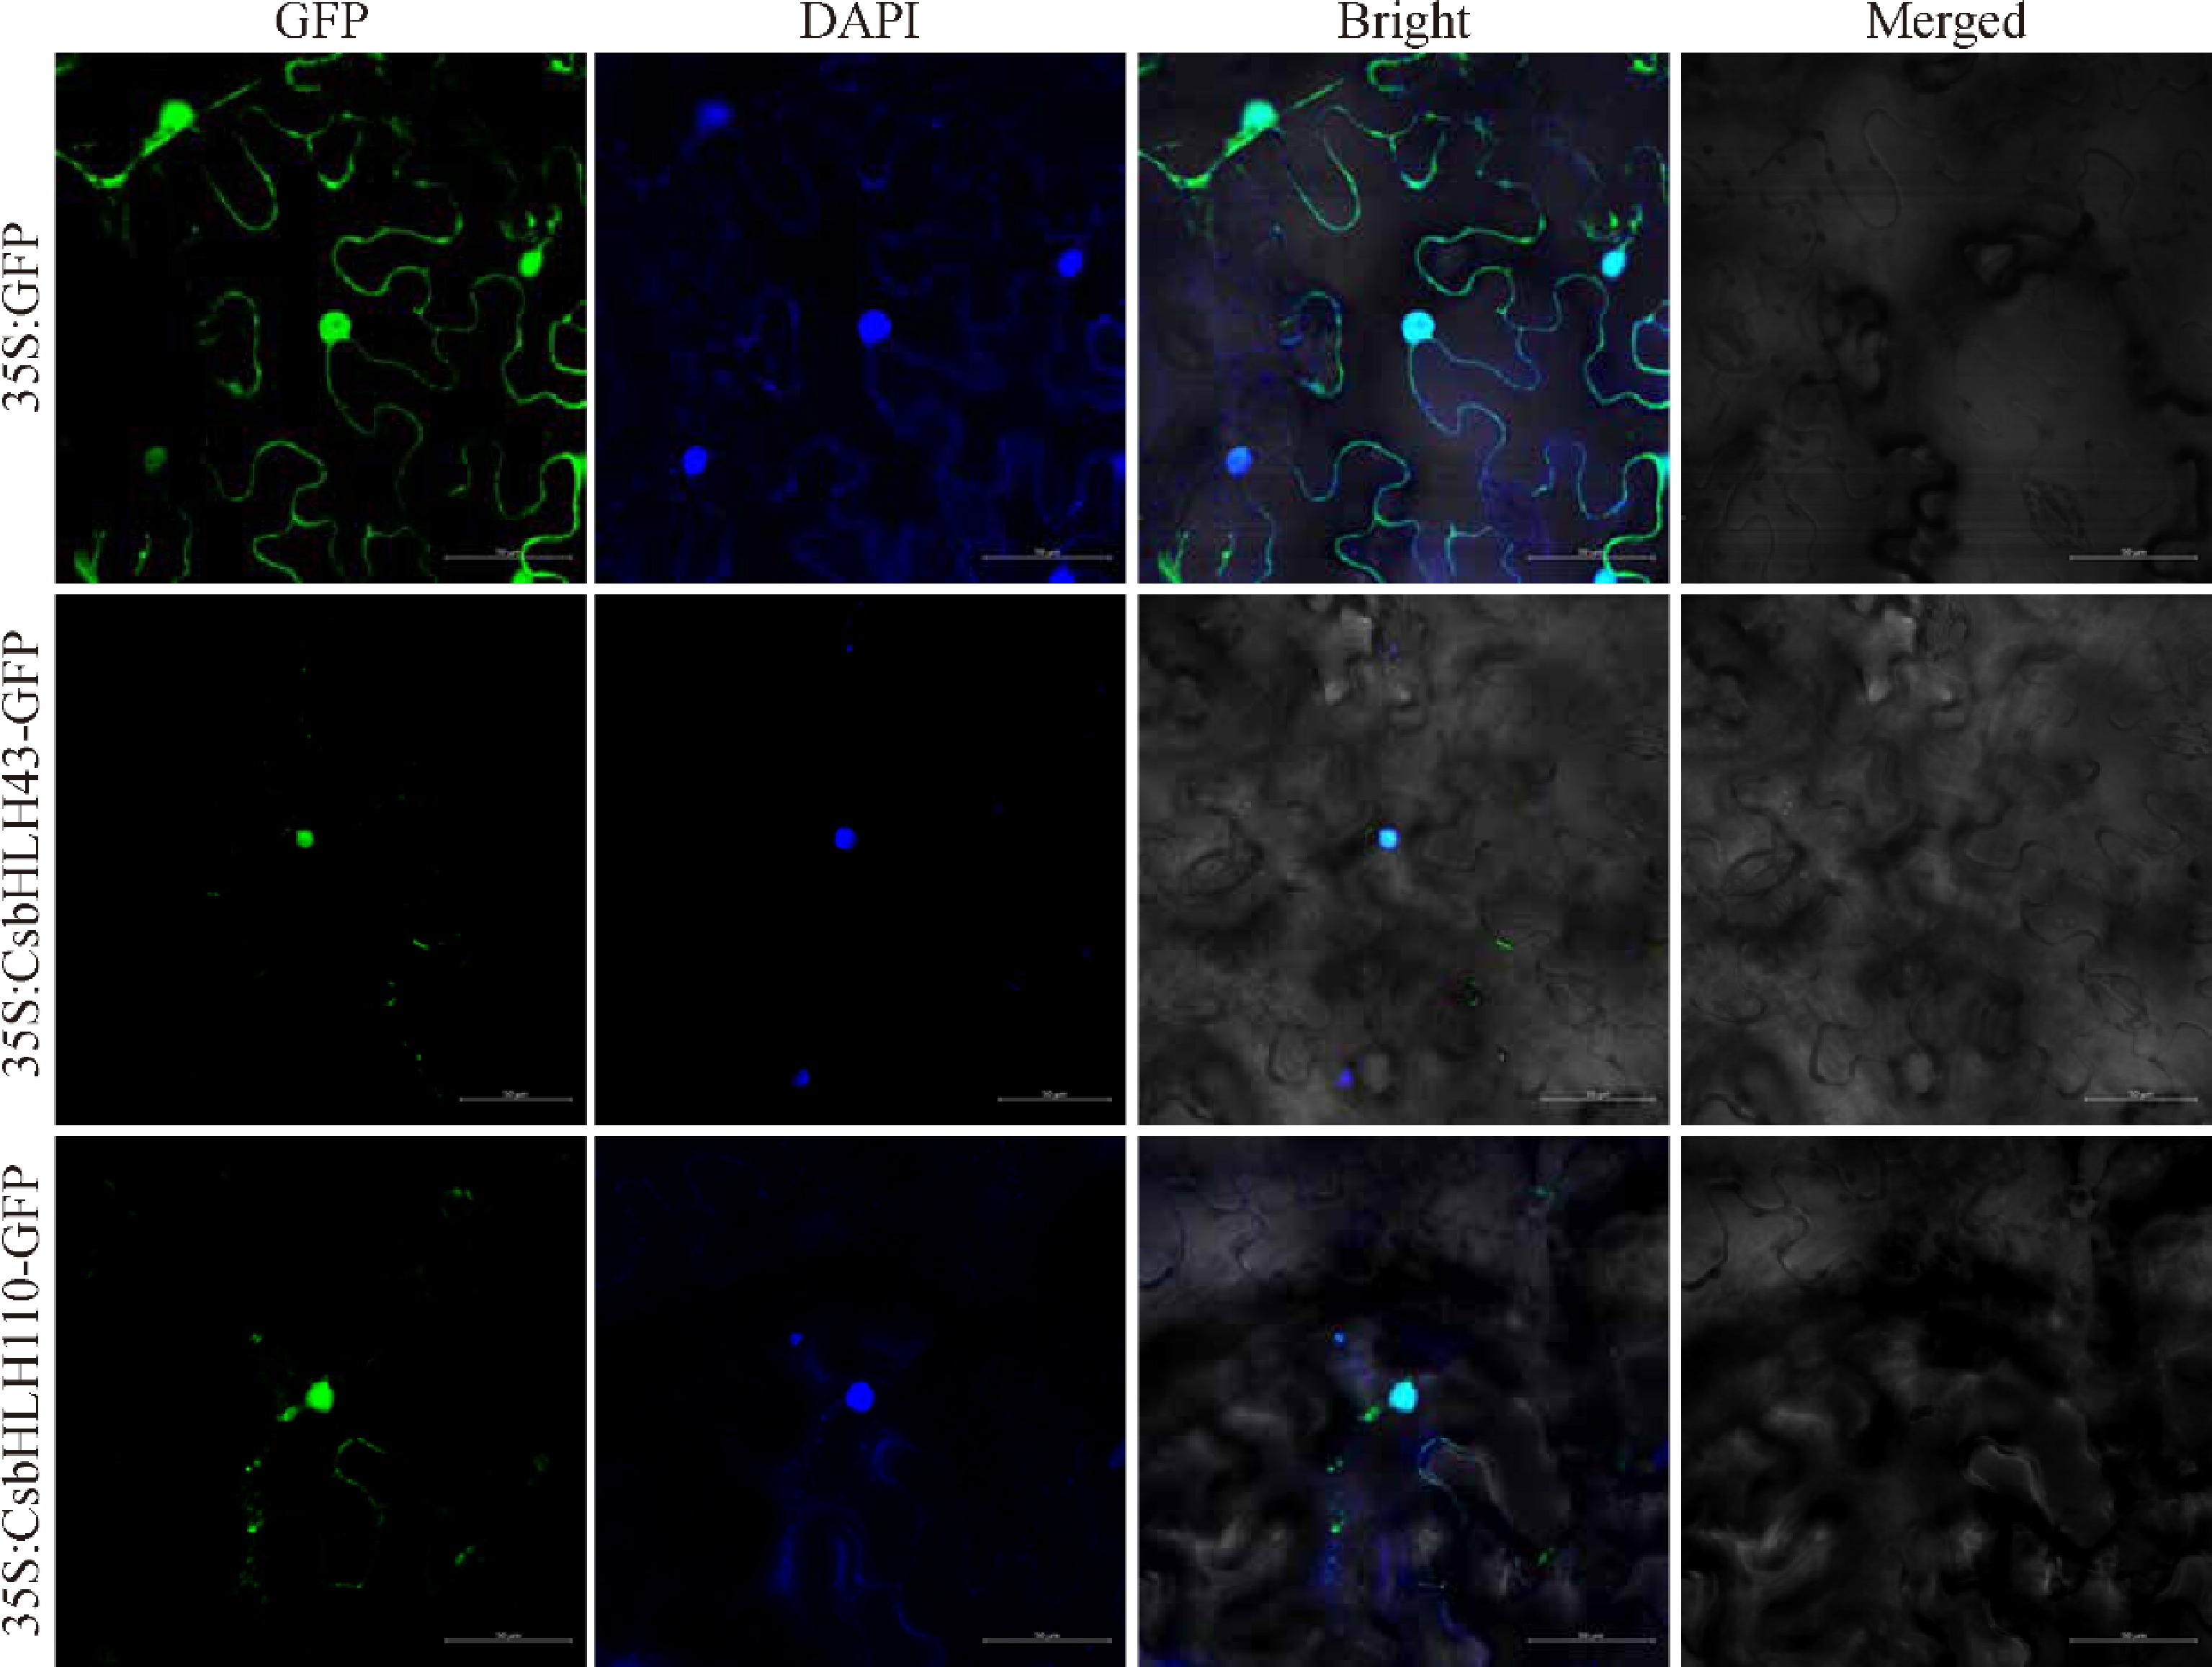
Figure 10.
Subcellular localization of CsbHLH43 and CsbHLH110. CsbHLH43-GFP and CsbHLH110-GFP fusion proteins were transiently expressed in N. benthamiana leaves. GFP signals were predominantly detected in the nucleus, as evidenced by their colocalization with DAPI staining. Bright-field images provide cellular context, and merged panels integrate the GFP, DAPI, and bright-field channels. Scale bar = 50 μm.
Figures
(10)
Tables
(0)