-
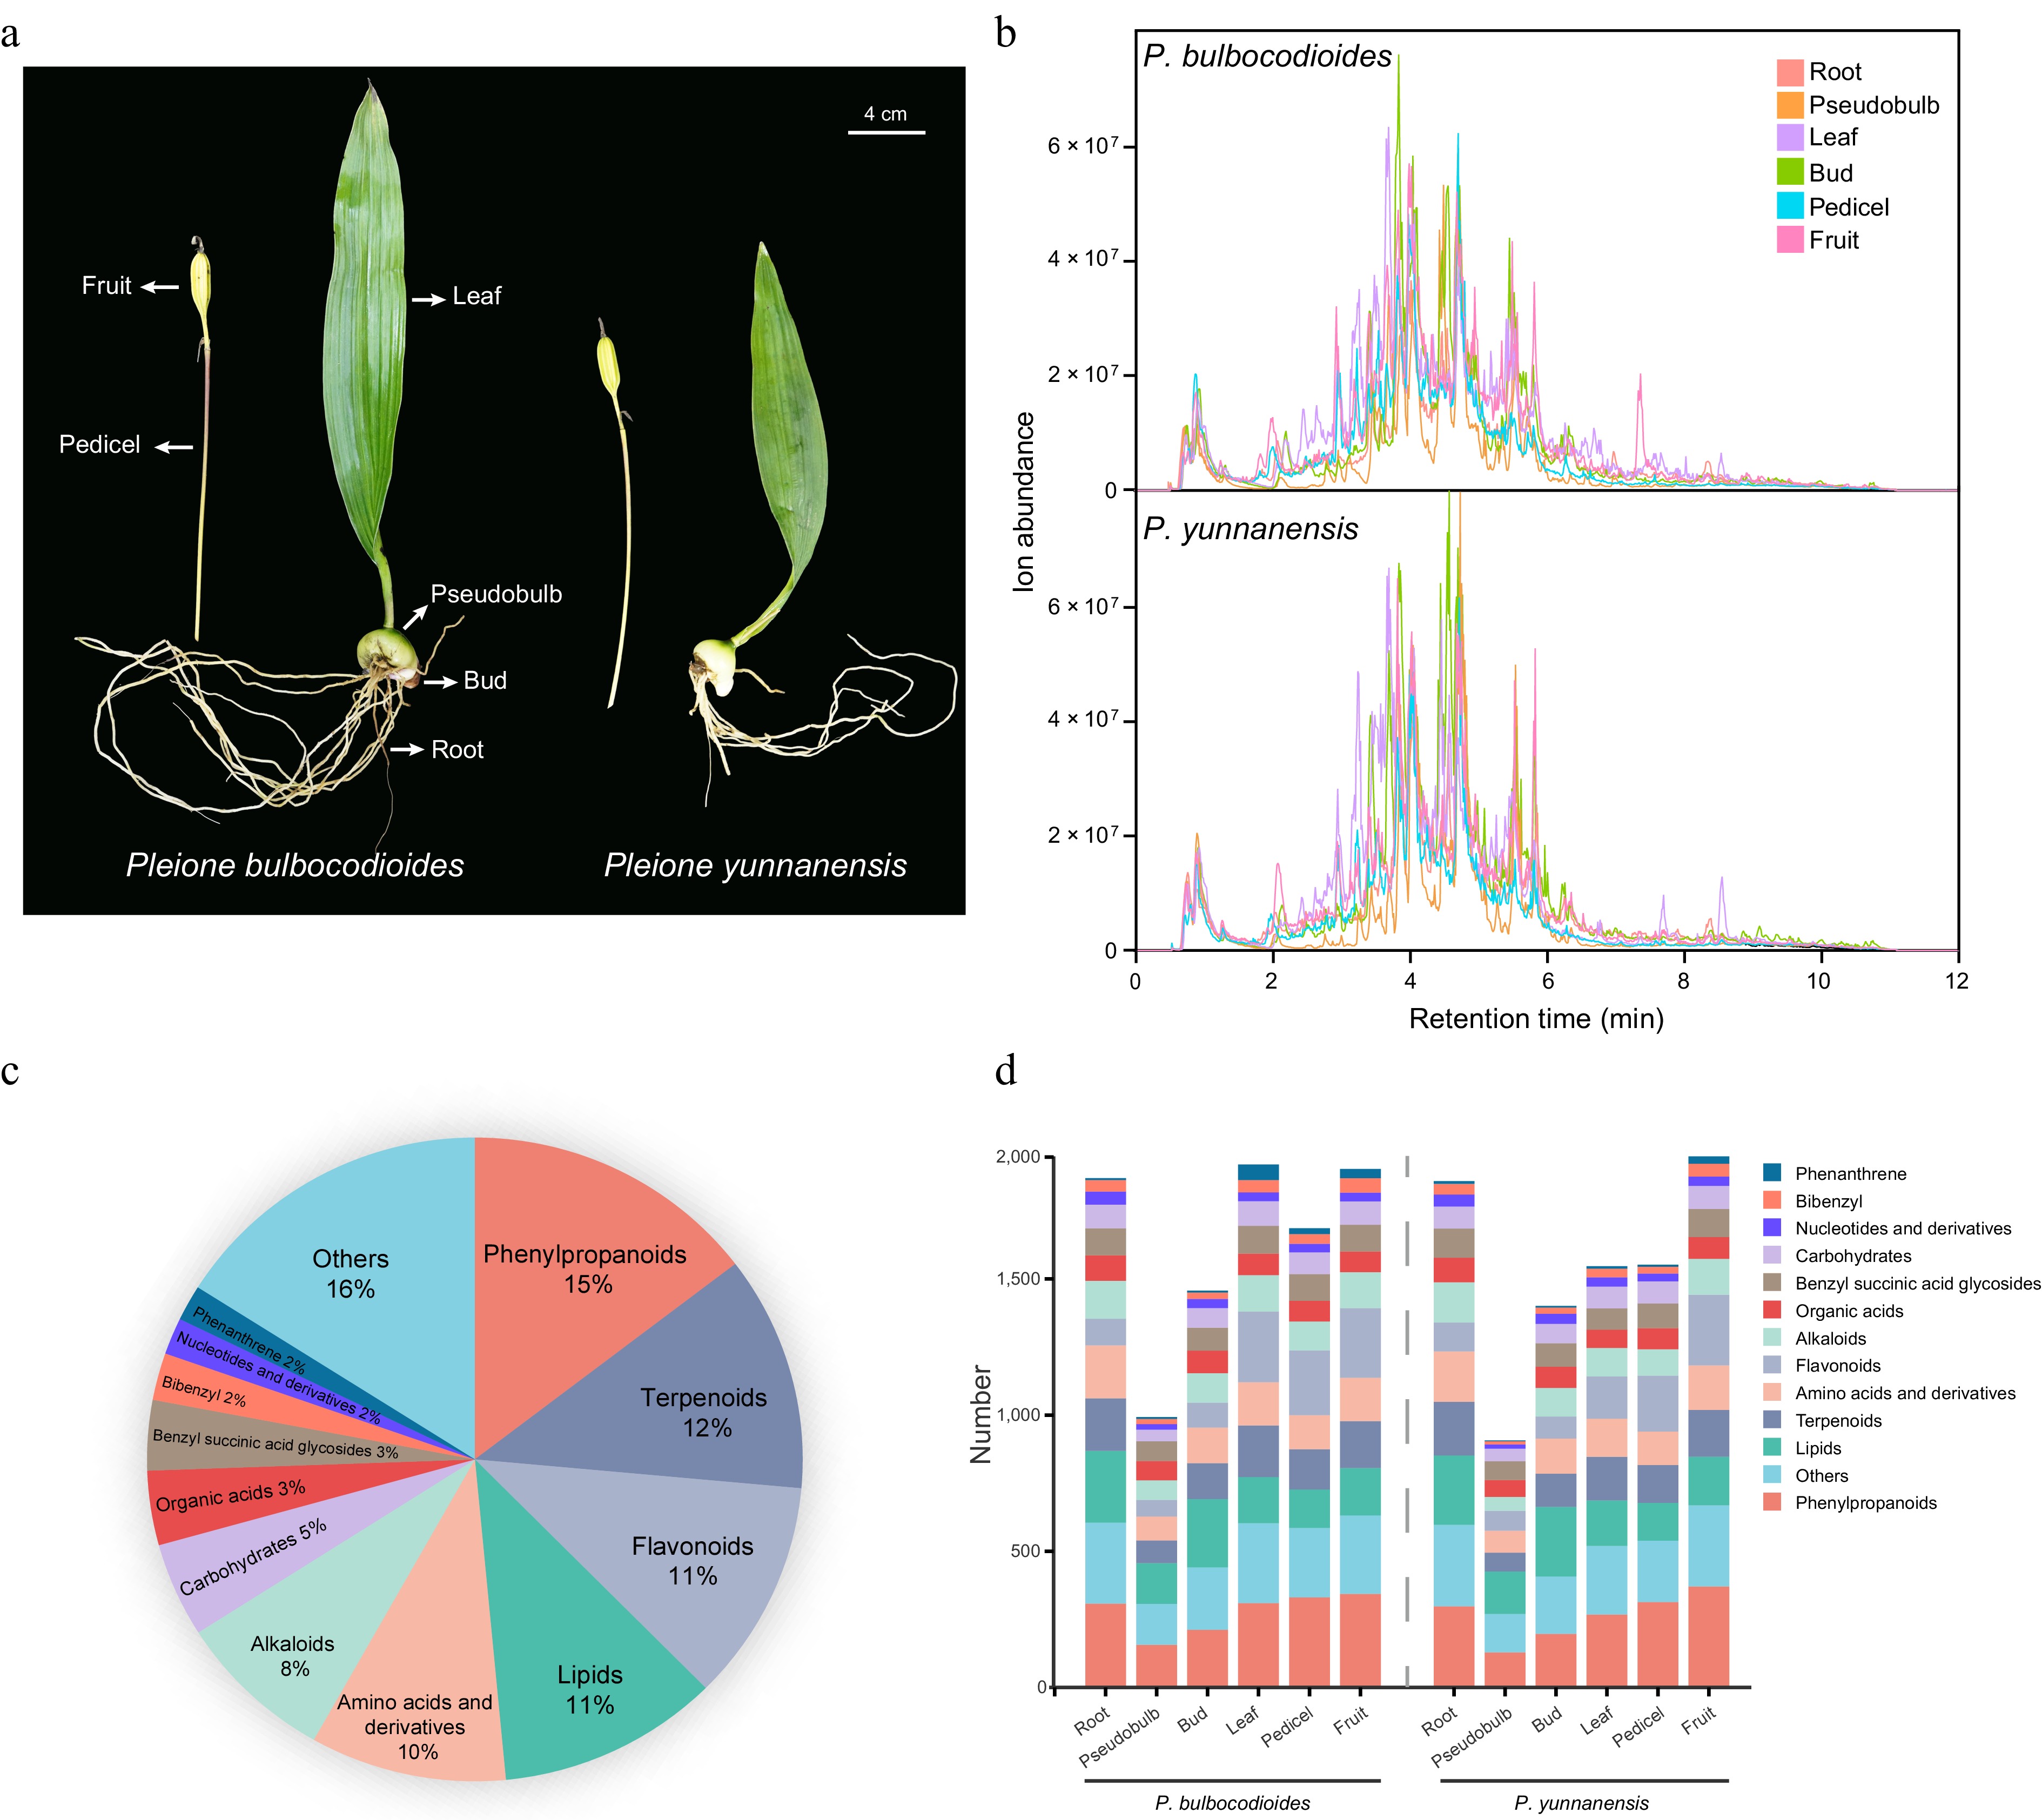
Figure 1.
Comprehensive metabolomic profiling of the two Pleione species. (a) Photographs of P. bulbocodioides and P. yunnanensis whole plants. (b) Representative TICs of different tissues from the two species, acquired by UPLC-QTOF-MS/MS in negative ionization mode. (c) Pie chart showing the classification and relative proportions of all annotated metabolites. (d) Distribution of annotated metabolites in each tissue of the two species.
-
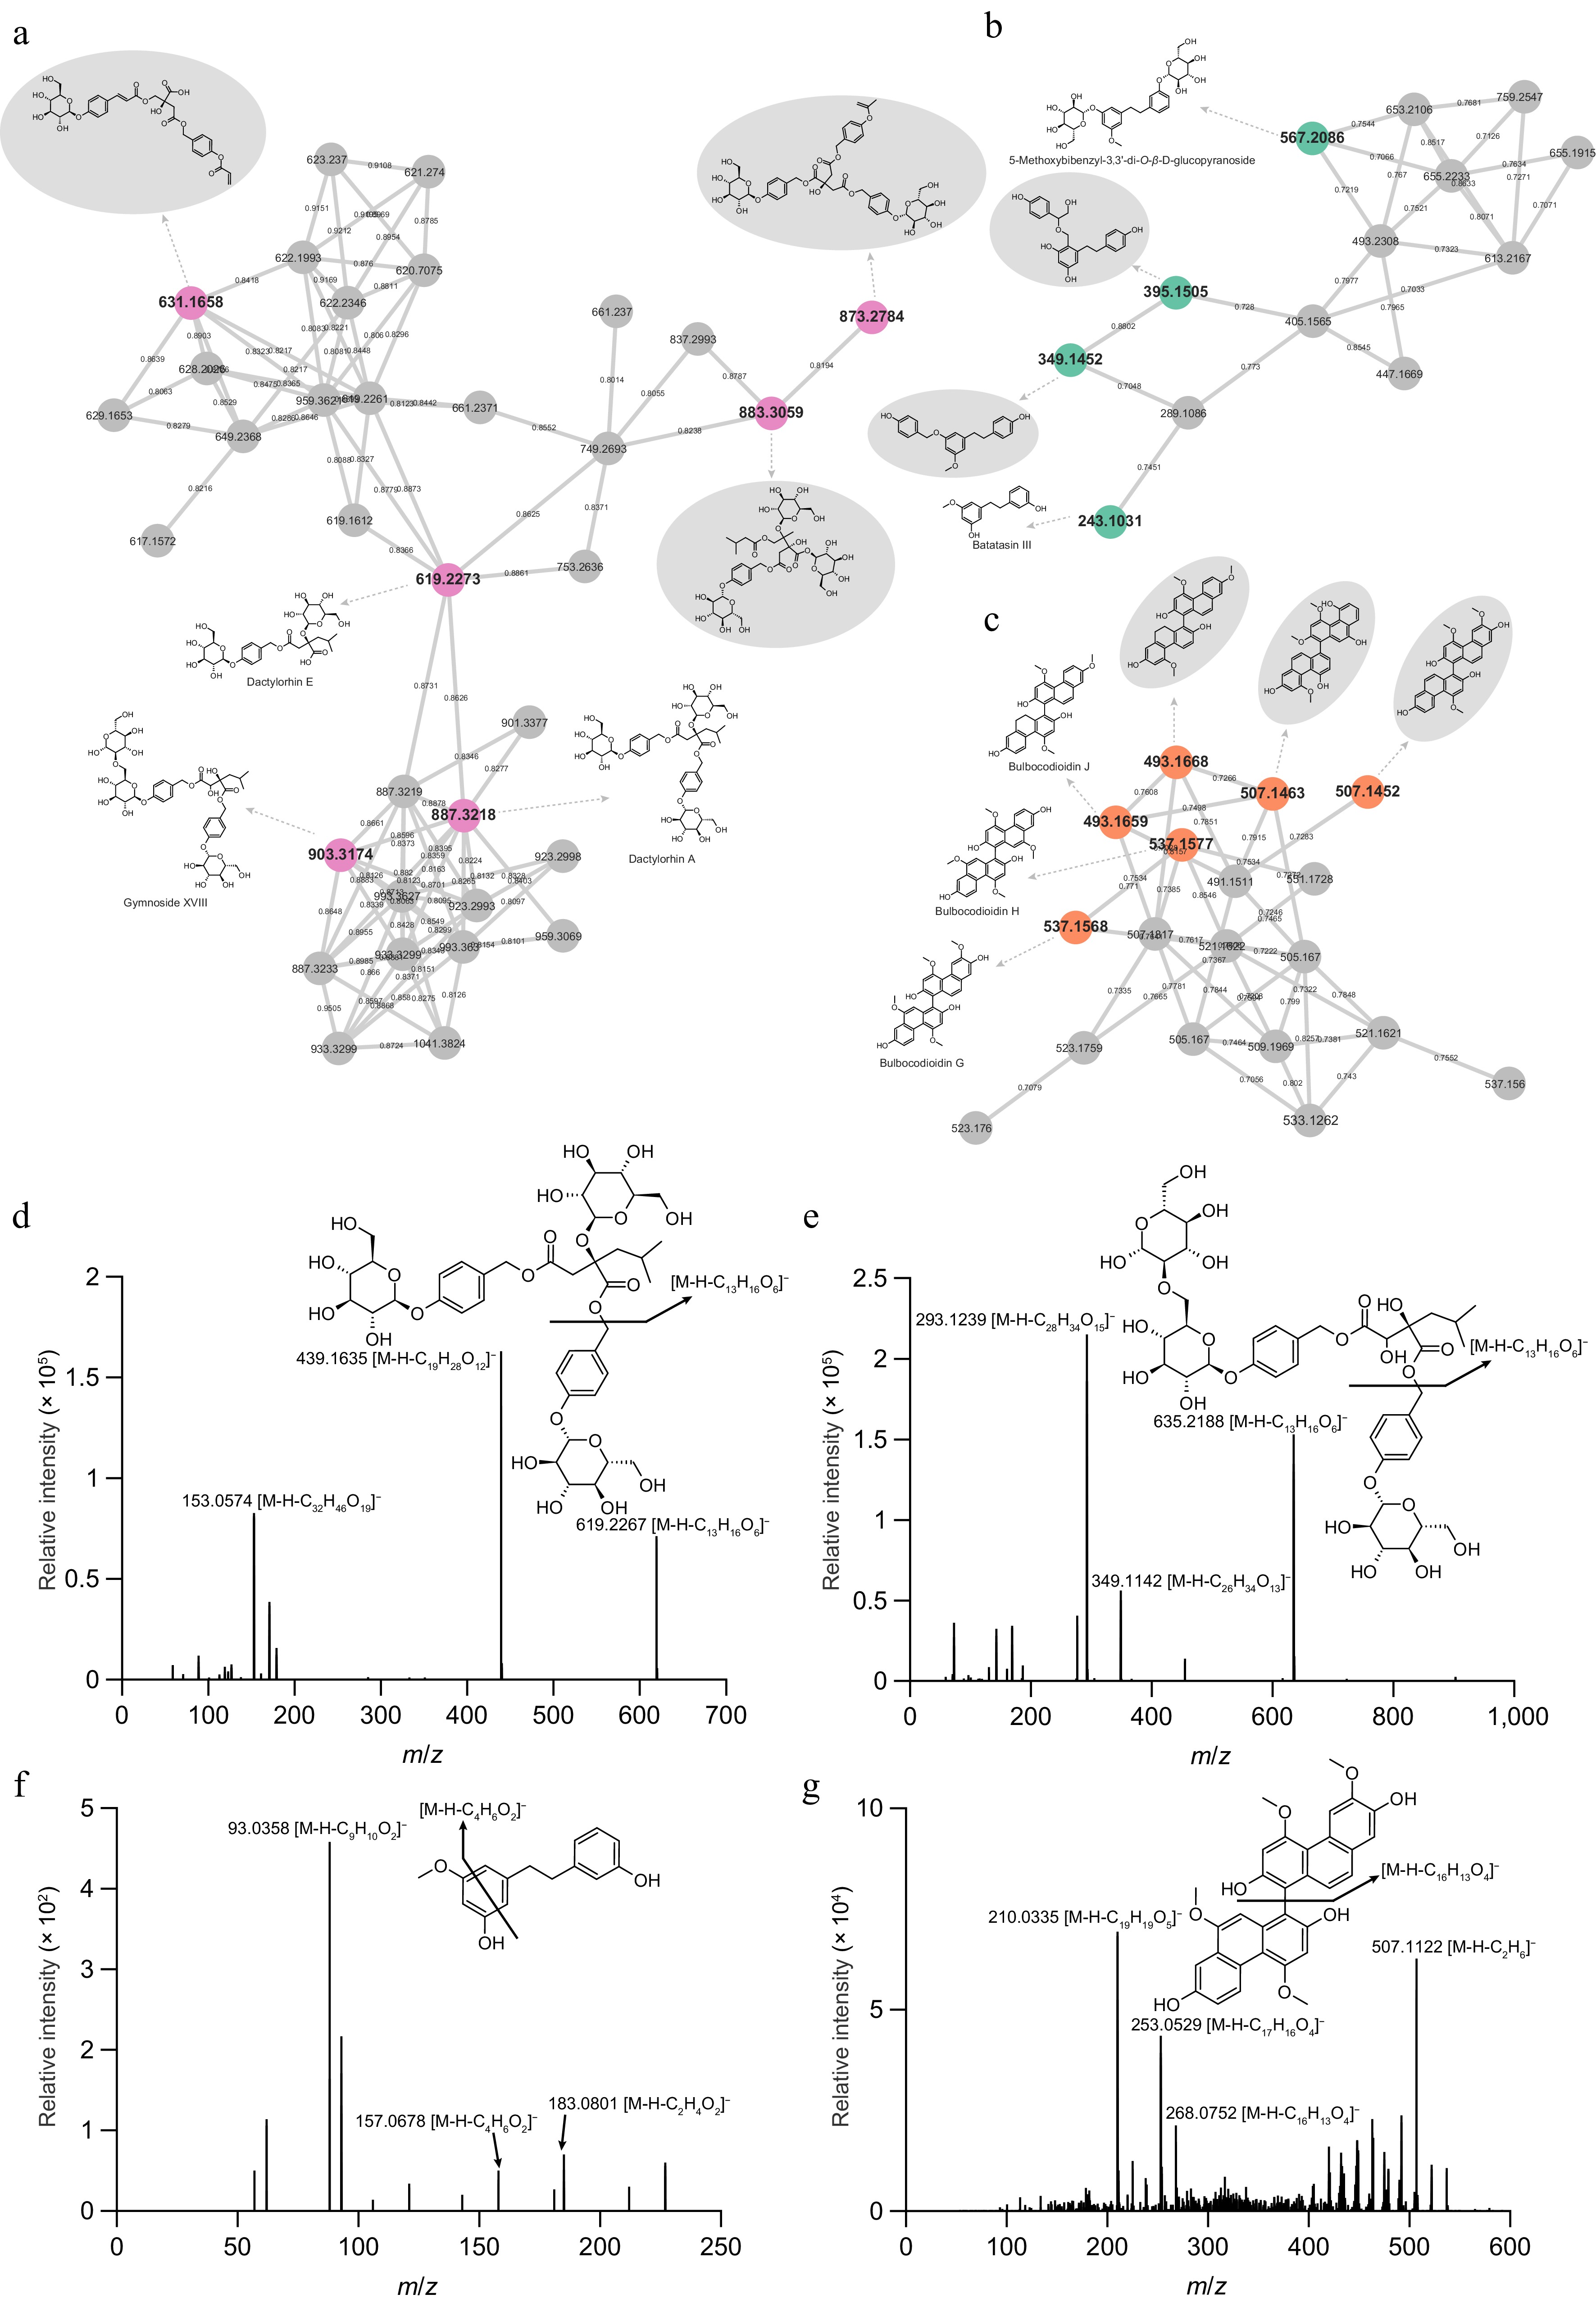
Figure 2.
Feature-based molecular networking-assisted annotation of three characteristic compound classes. Molecular networks of (a) benzyl succinic acid glycosides, (b) bibenzyls, and (c) phenanthrenes, extracted from the global network shown in Supplementary Fig. S1. Nodes represent individual metabolites, and edges indicate MS/MS spectral similarity (cosine score). Representative MS/MS spectra and fragmentation pathways of diagnostic ions acquired in negative ionization mode: (d) dactylorhin A (m/z 887.3218 [M-H]−), (e) gymnoside XVIII (m/z 903.3174 [M-H]−), (f) batatasin III (m/z 243.1031 [M-H]−), and (g) bulbocodioidin G (m/z 537.1568 [M-H]−).
-
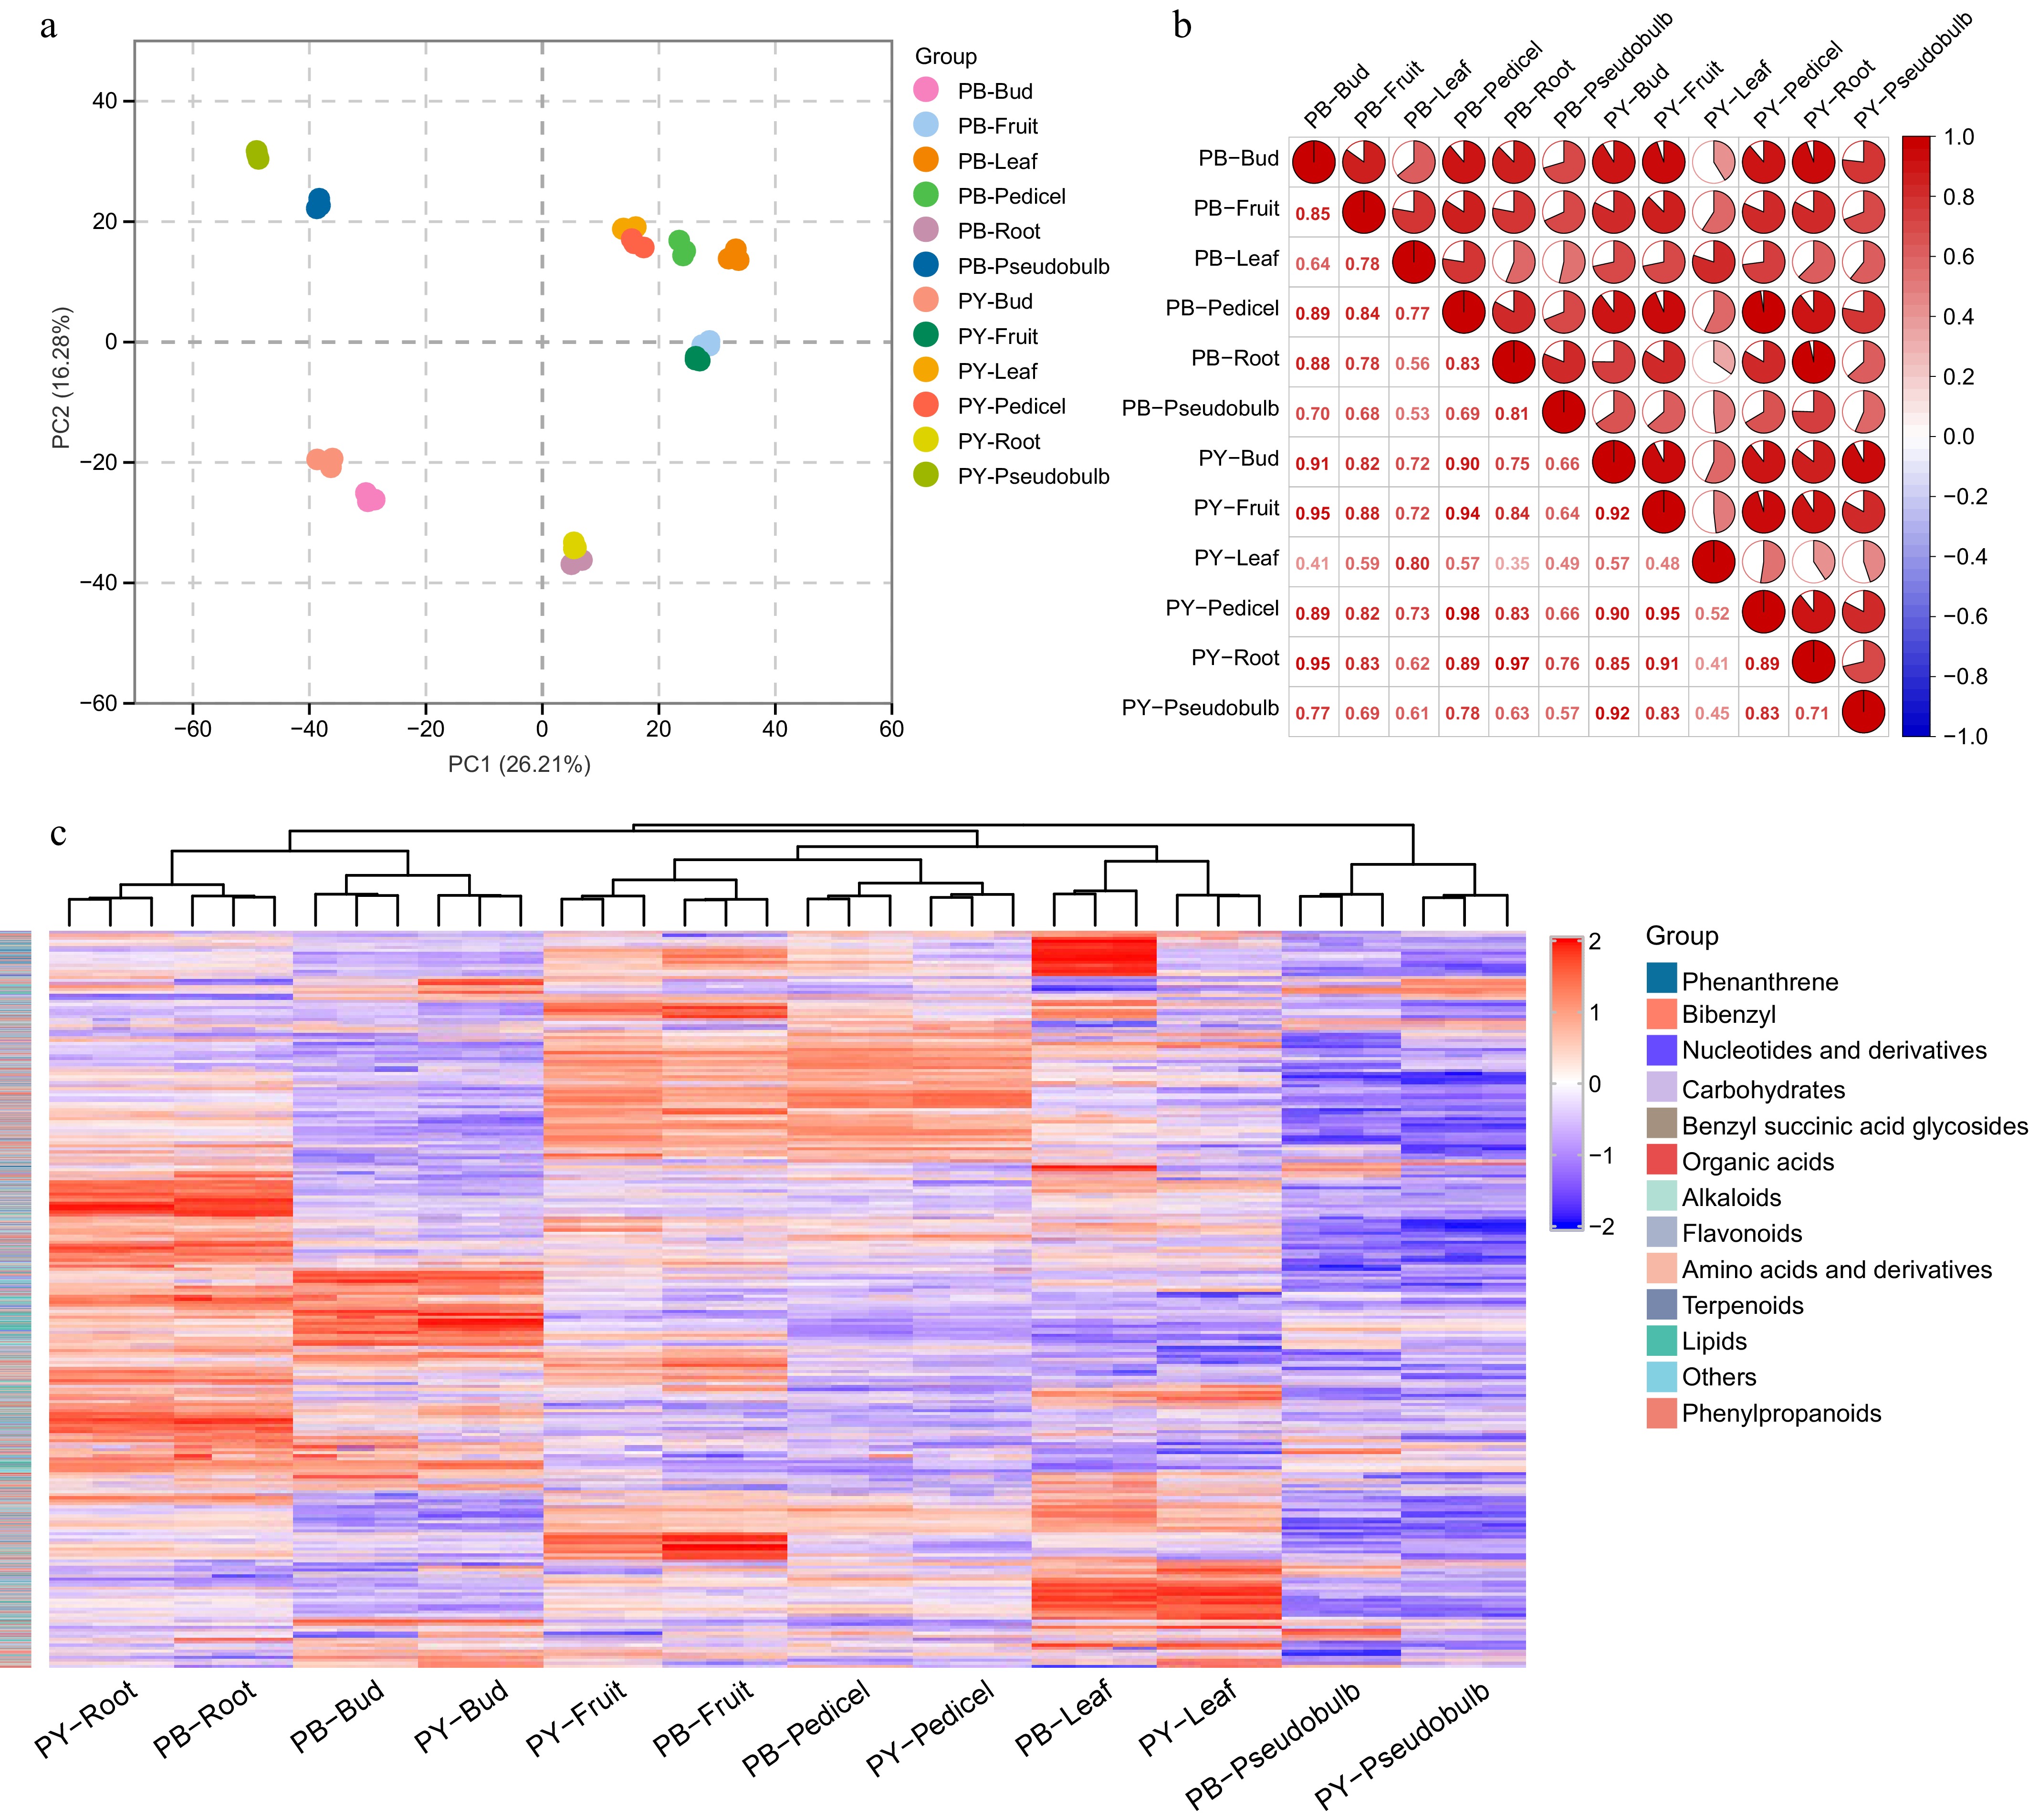
Figure 3.
Multivariate statistical analysis and correlation profiling of metabolites in the two Pleione species. (a) PCA score plot showing the metabolic discrimination among different tissues of P. bulbocodioides (PB) and P. yunnanensis (PY). Each point represents a biological replicate, with distinct colors indicating different tissue types. (b) Pearson correlation heatmap illustrating the pairwise correlations of metabolite profiles among all tissue samples from the two species. The color gradient represents correlation coefficients. (c) Hierarchical clustering heatmap displaying the relative abundance of all annotated metabolites across different tissues. The colored sidebar indicates metabolite classes.
-
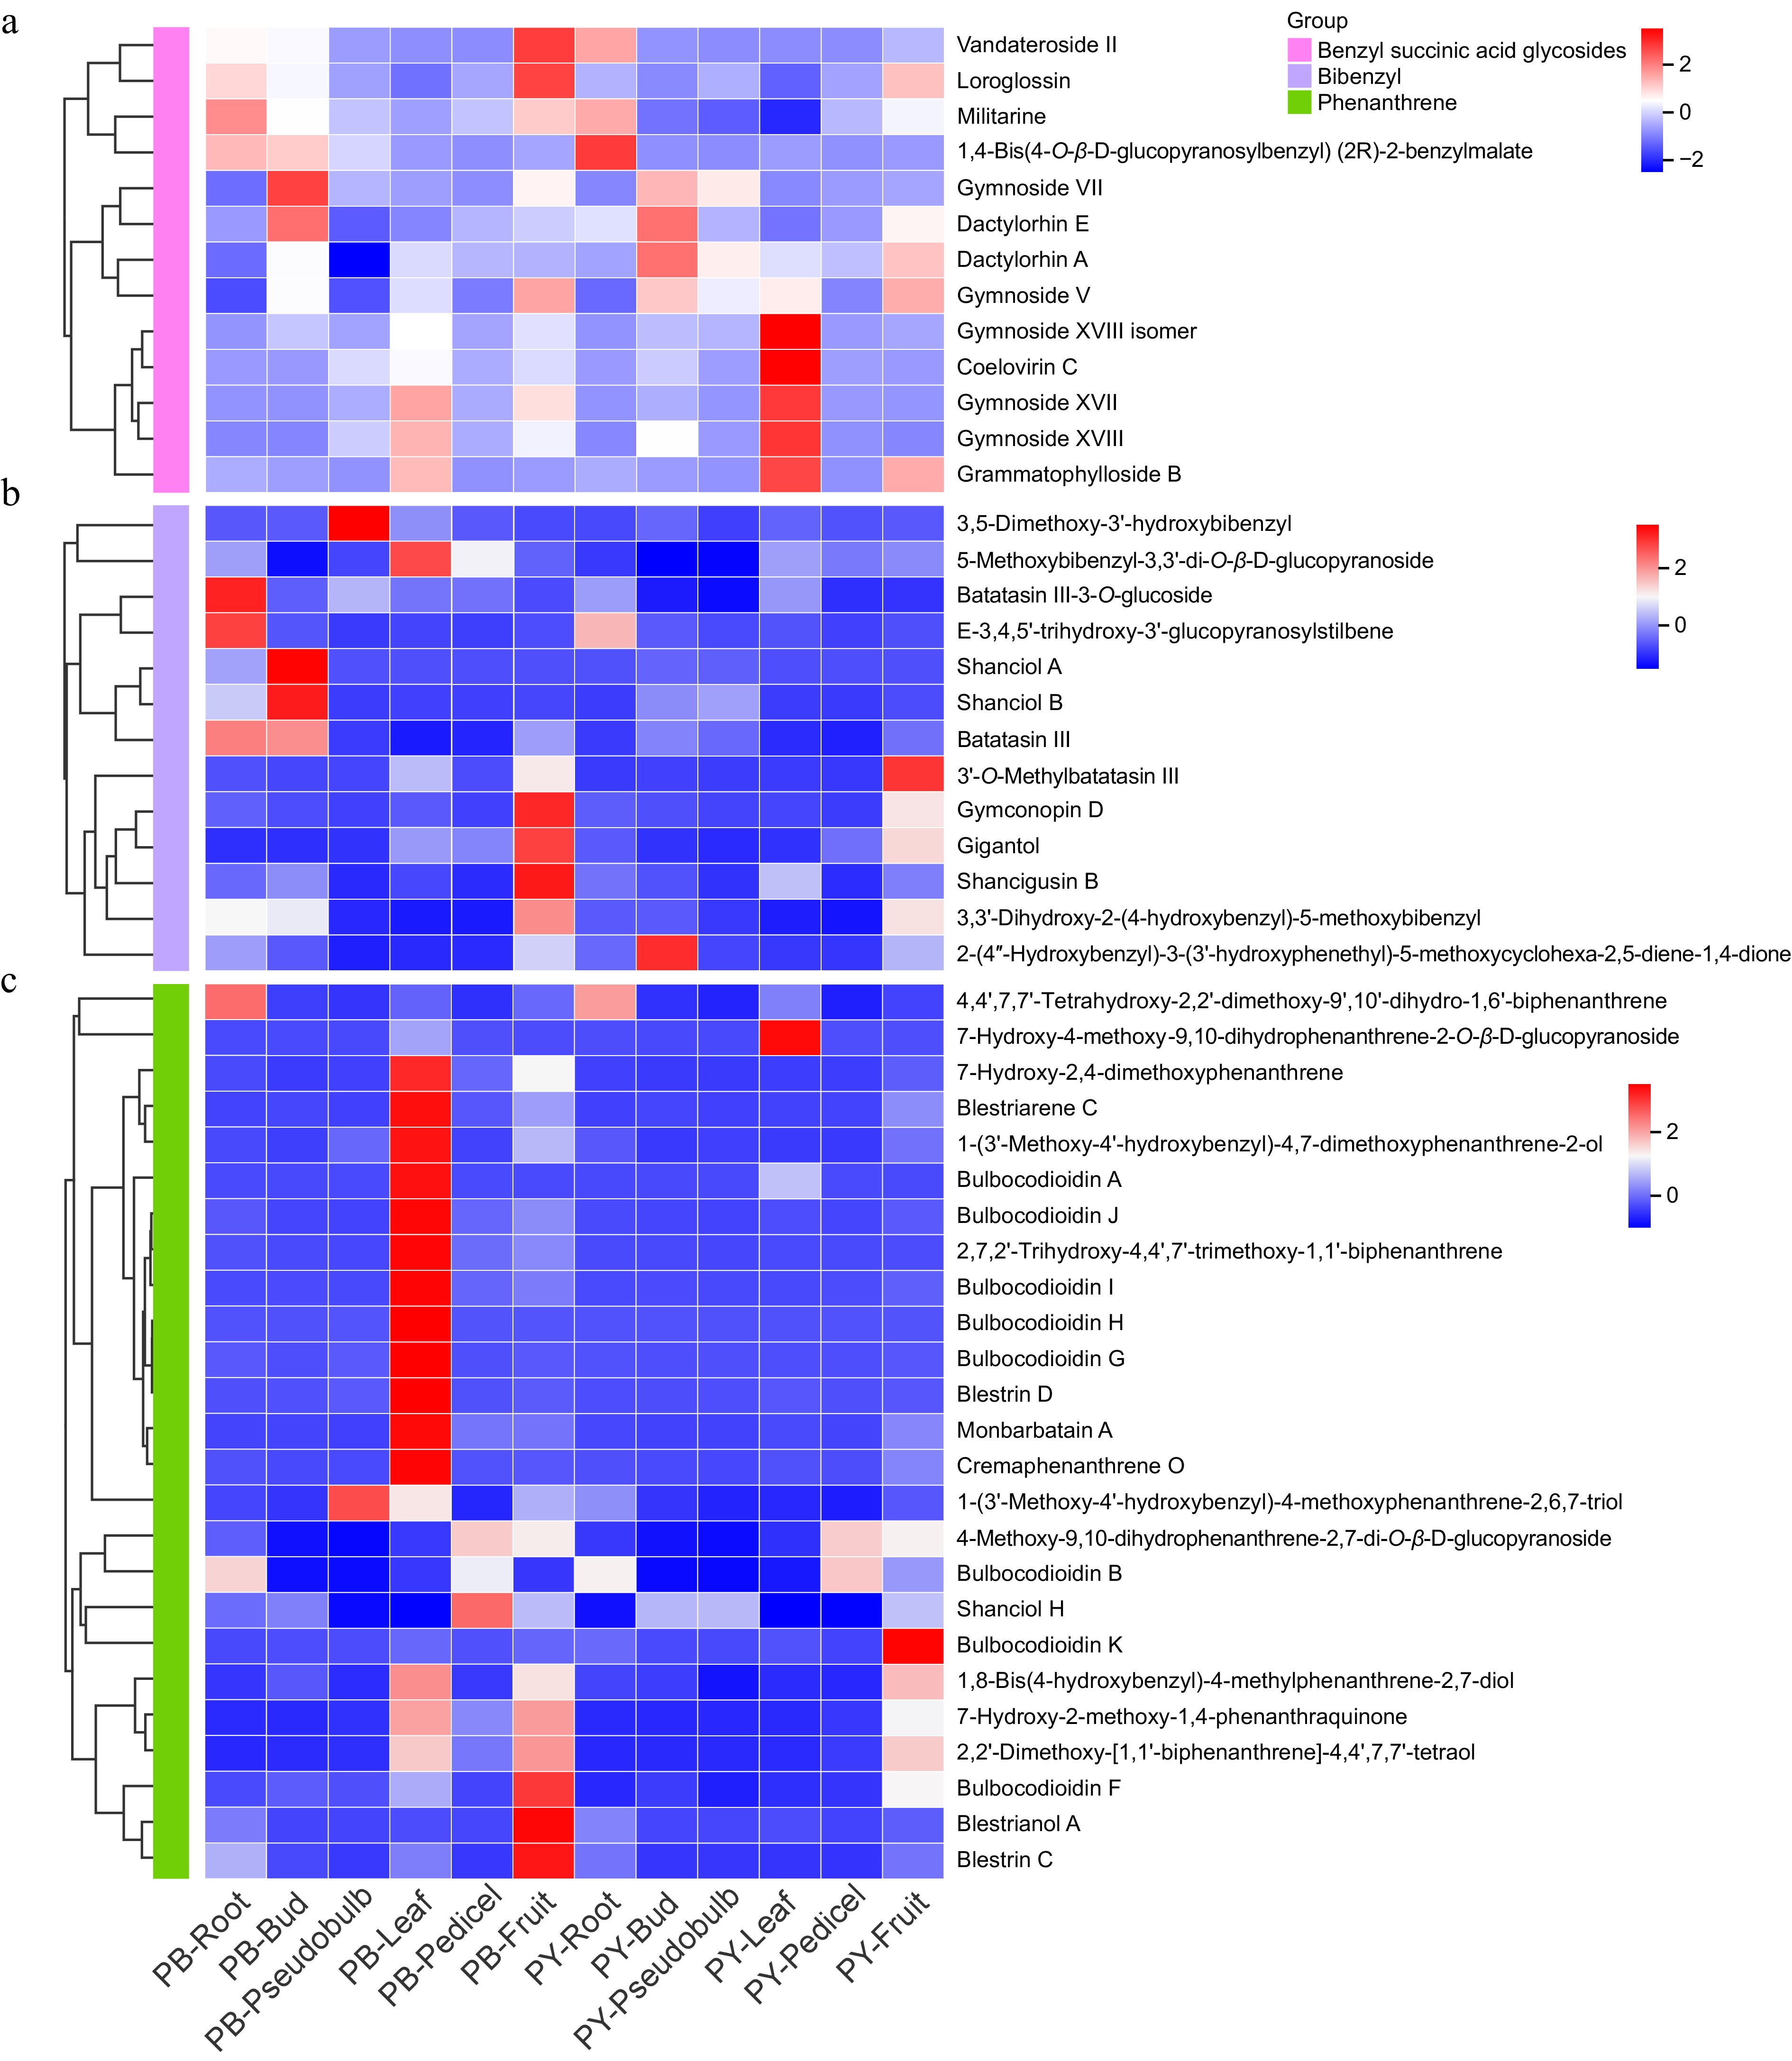
Figure 4.
Tissue-specific distribution of characteristic compounds in the two Pleione species. Hierarchical clustering heatmaps showing the relative abundance of (a) benzyl succinic acid glycosides, (b) bibenzyls, and (c) phenanthrenes across different tissues of P. bulbocodioides (PB) and P. yunnanensis (PY). Each row represents a metabolite, each column represents a tissue sample, and the color scale indicates normalized metabolite levels (red: high abundance; blue: low abundance).
-
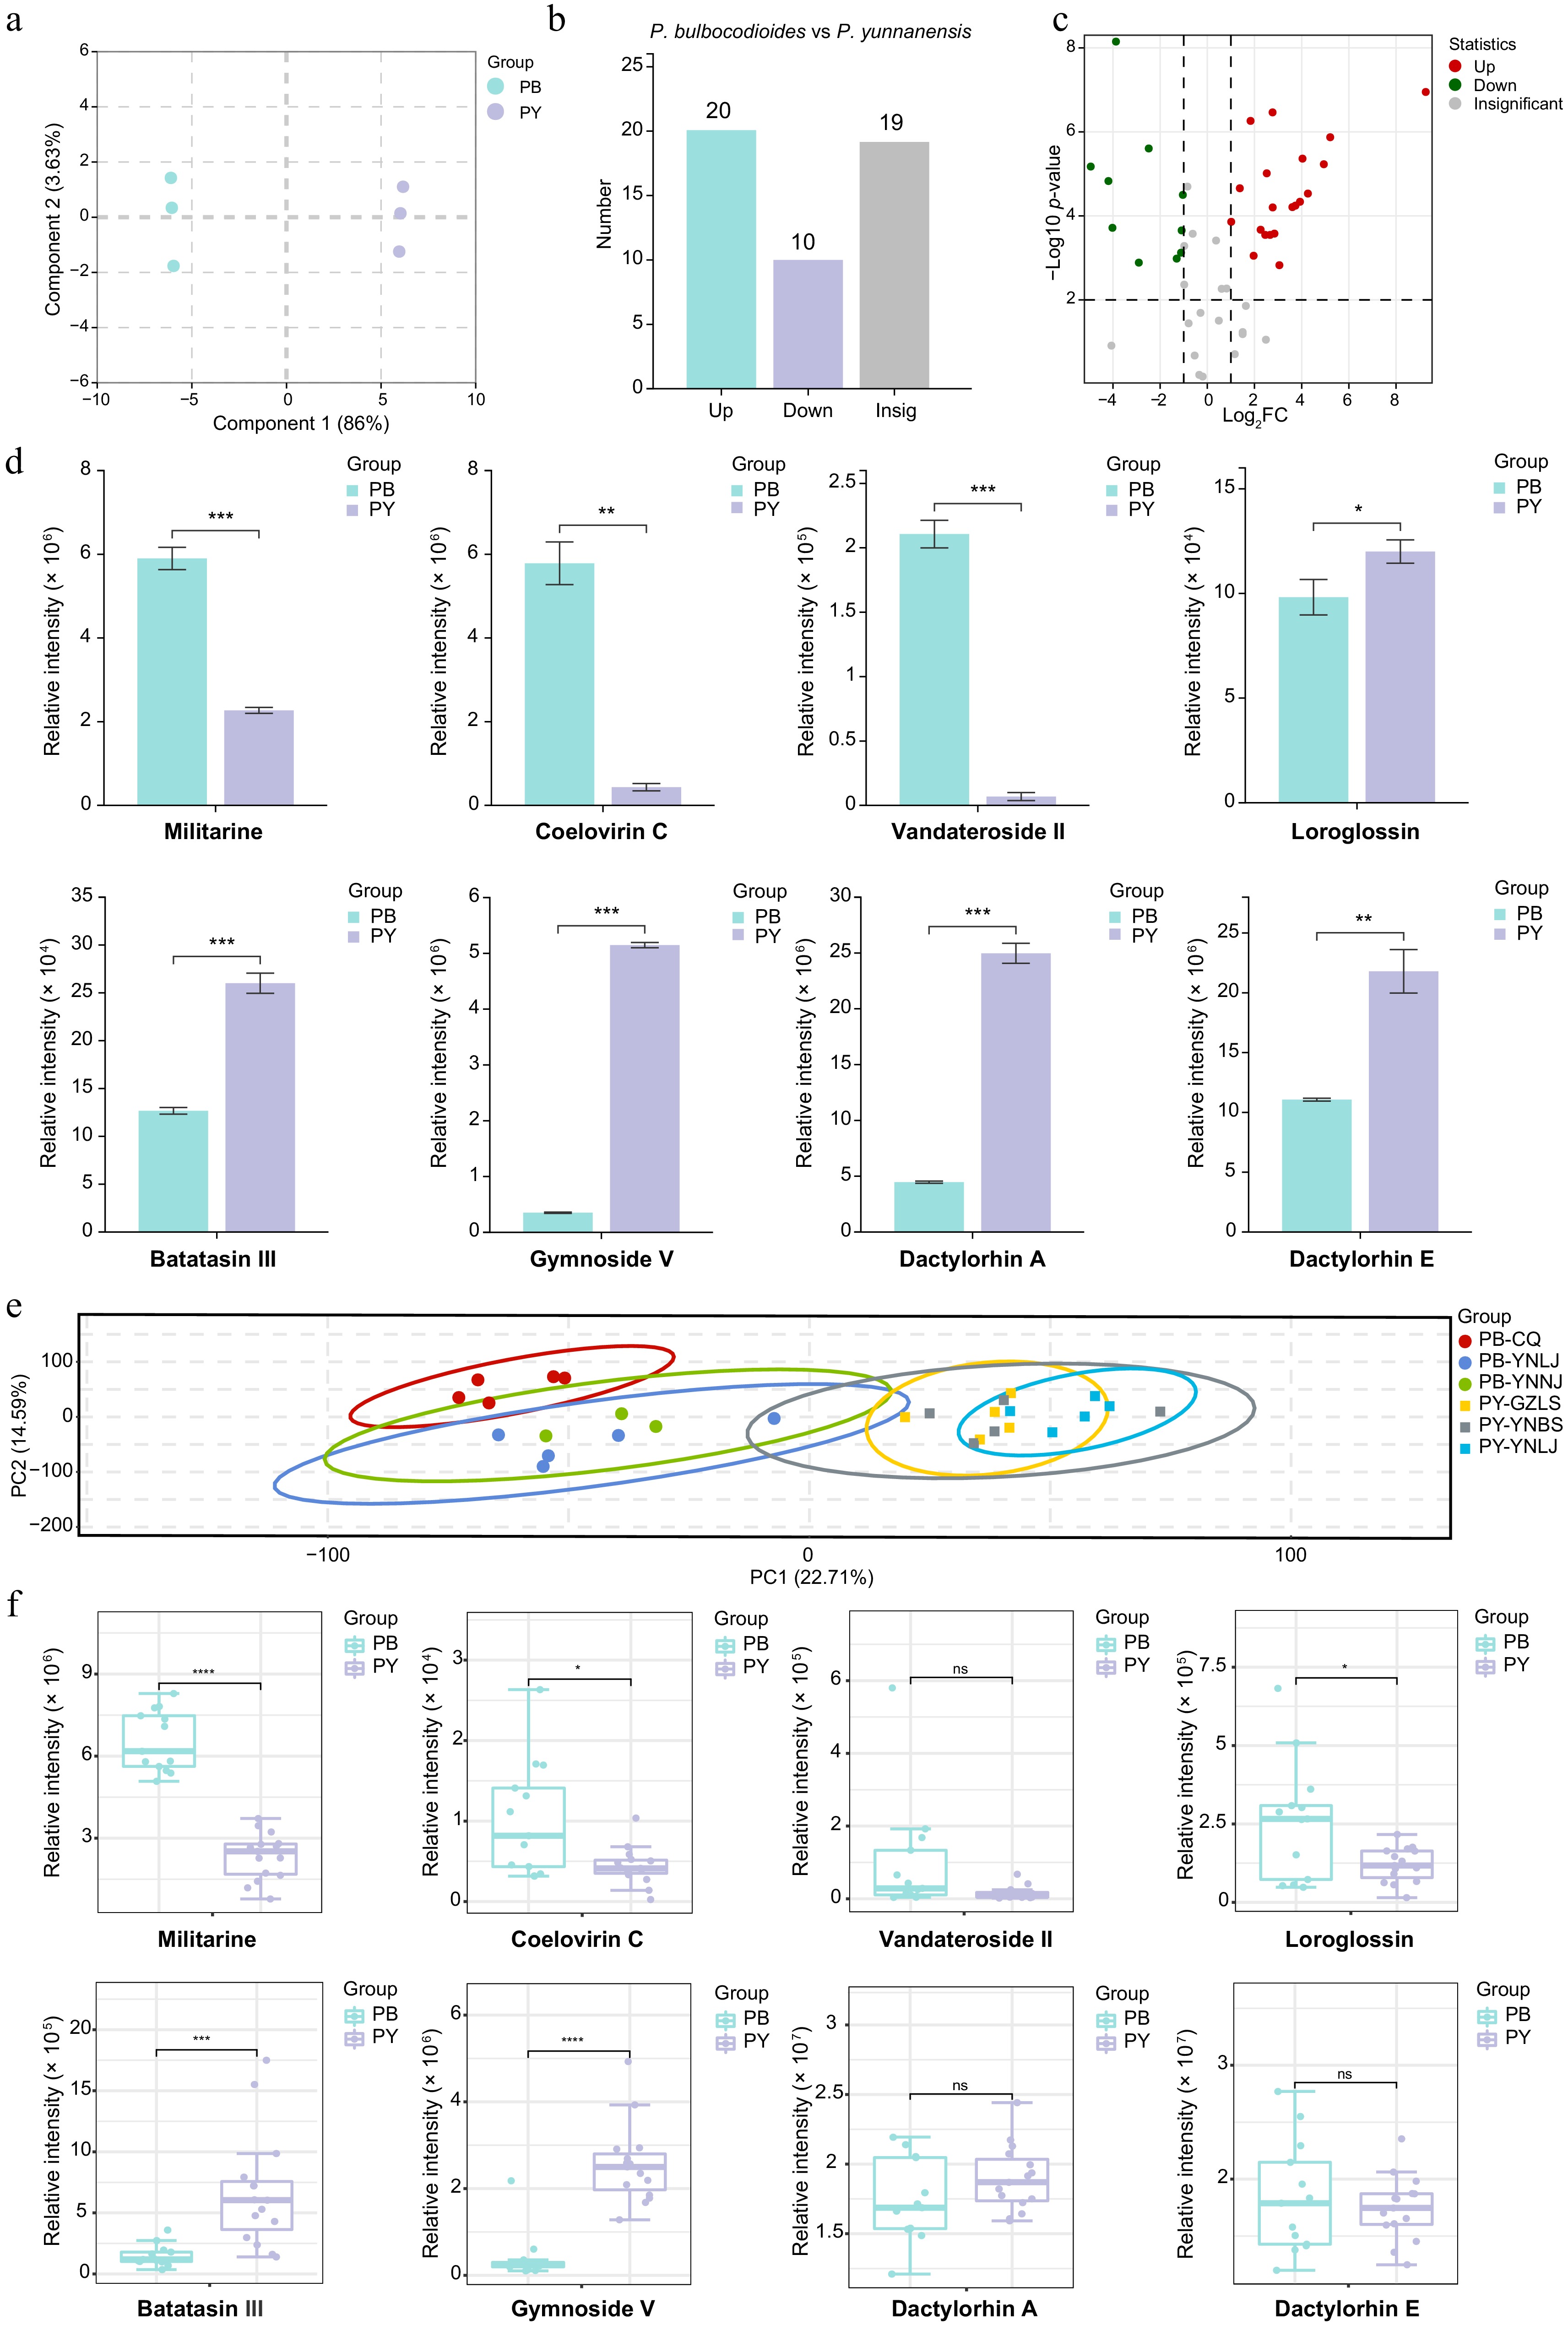
Figure 5.
Screening of potential Q-markers in pseudobulbs of the two Pleione species. (a) OPLS-DA score plot showing the separation between P. bulbocodioides (PB) and P. yunnanensis (PY) pseudobulb samples. (b) Bar plot of the numbers of significantly upregulated, downregulated, and insignificant metabolites. (c) Volcano plot of differentially accumulated metabolites (fold change > 2 or < 0.5; p < 0.01). Red, upregulated in PB; green, downregulated in PB; gray, non-significant. (d) Bar plots (mean ± SD) showing the relative abundances of eight representative differential metabolites in pseudobulbs. (e) PCA score plot of pseudobulb samples from six geographical origins. (f) Boxplots showing relative peak areas of eight characteristic compounds in pseudobulbs across six origins, comparing PB and PY. ns, not significant; * p < 0.05, ** p < 0.01, *** p < 0.001, **** p < 0.0001, comparing PB and PY.
-
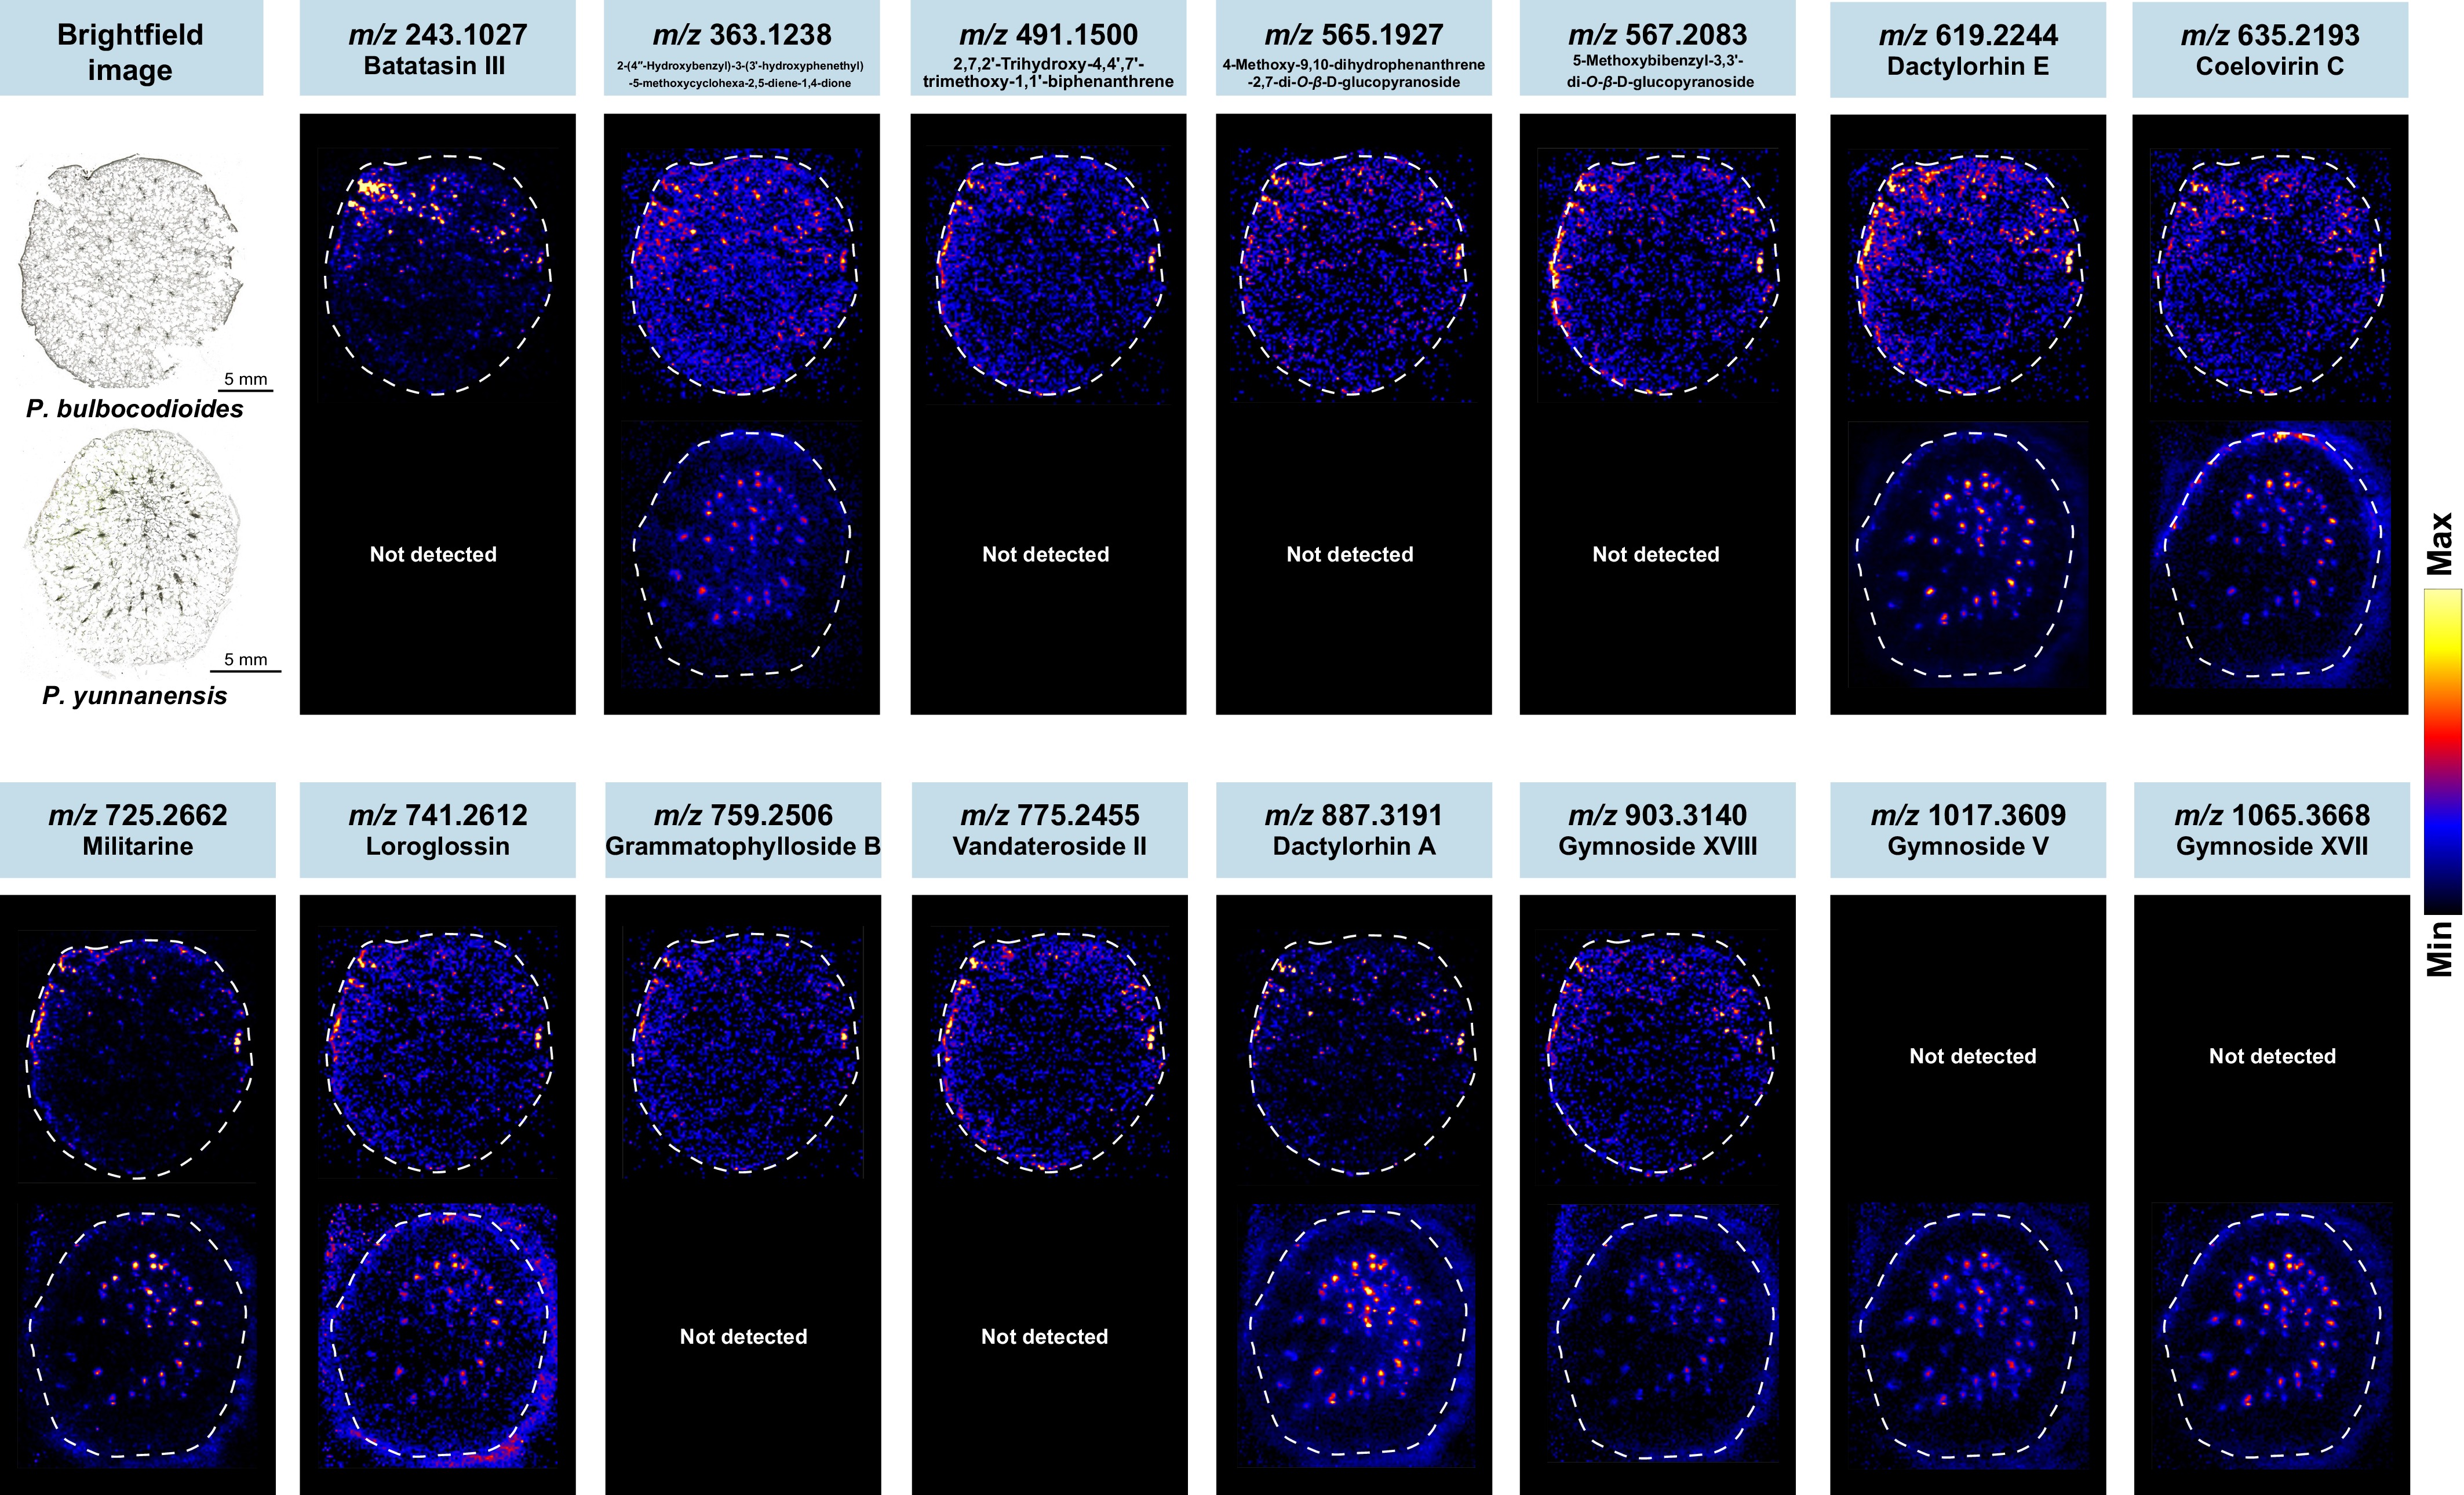
Figure 6.
DESI-MSI reveals spatial distribution patterns of bioactive compounds in pseudobulbs of the two Pleione species. Cross-sections of pseudobulbs from P. bulbocodioides and P. yunnanensis were analyzed by DESI-MSI in negative ion mode. Representative ion images show the spatial localization of three classes of bioactive compounds, including benzyl succinic acid glycosides, bibenzyls, and phenanthrenes.
-
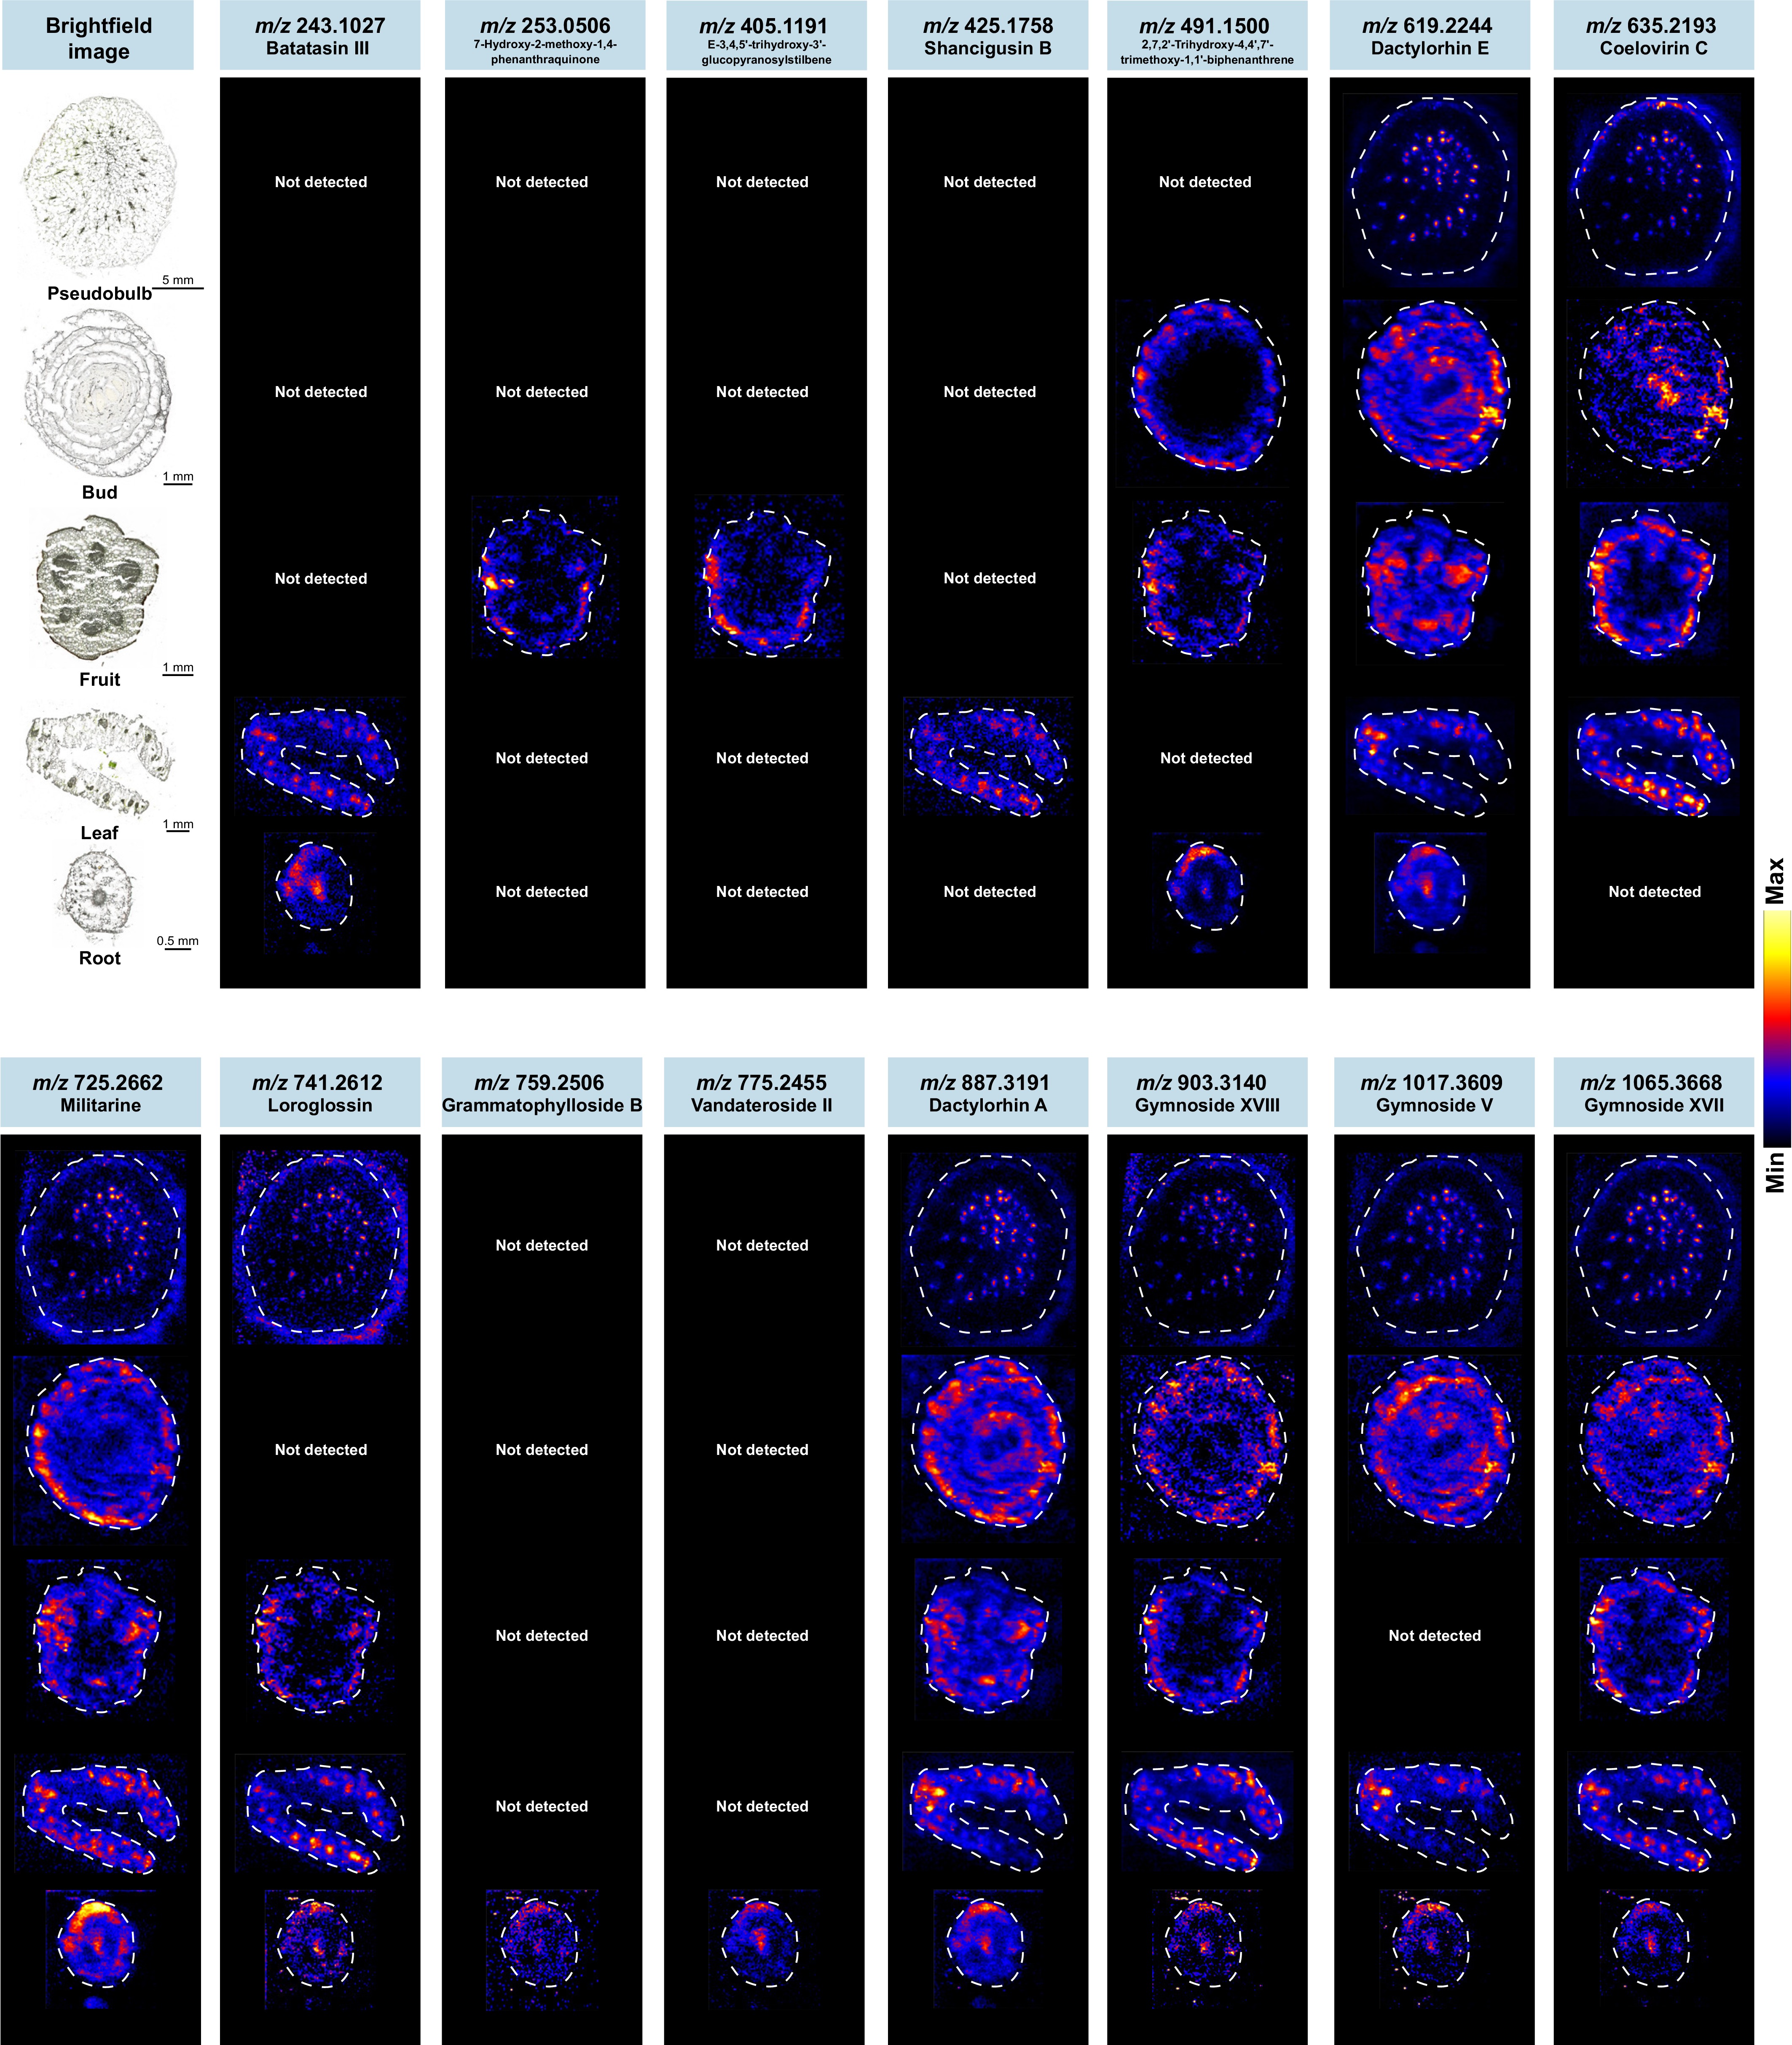
Figure 7.
DESI-MSI reveals tissue-specific spatial distribution of bioactive compounds in P. yunnanensis. Cross-sections of different tissues (pseudobulbs, buds, fruits, leaves and roots) from P. yunnanensis were prepared through frozen sectioning and analyzed by DESI-MSI in negative ion mode. Representative ion images show the spatial localization of three classes of bioactive compounds (including bibenzyls, phenanthrenes, and benzyl succinic acid glycosides).
-
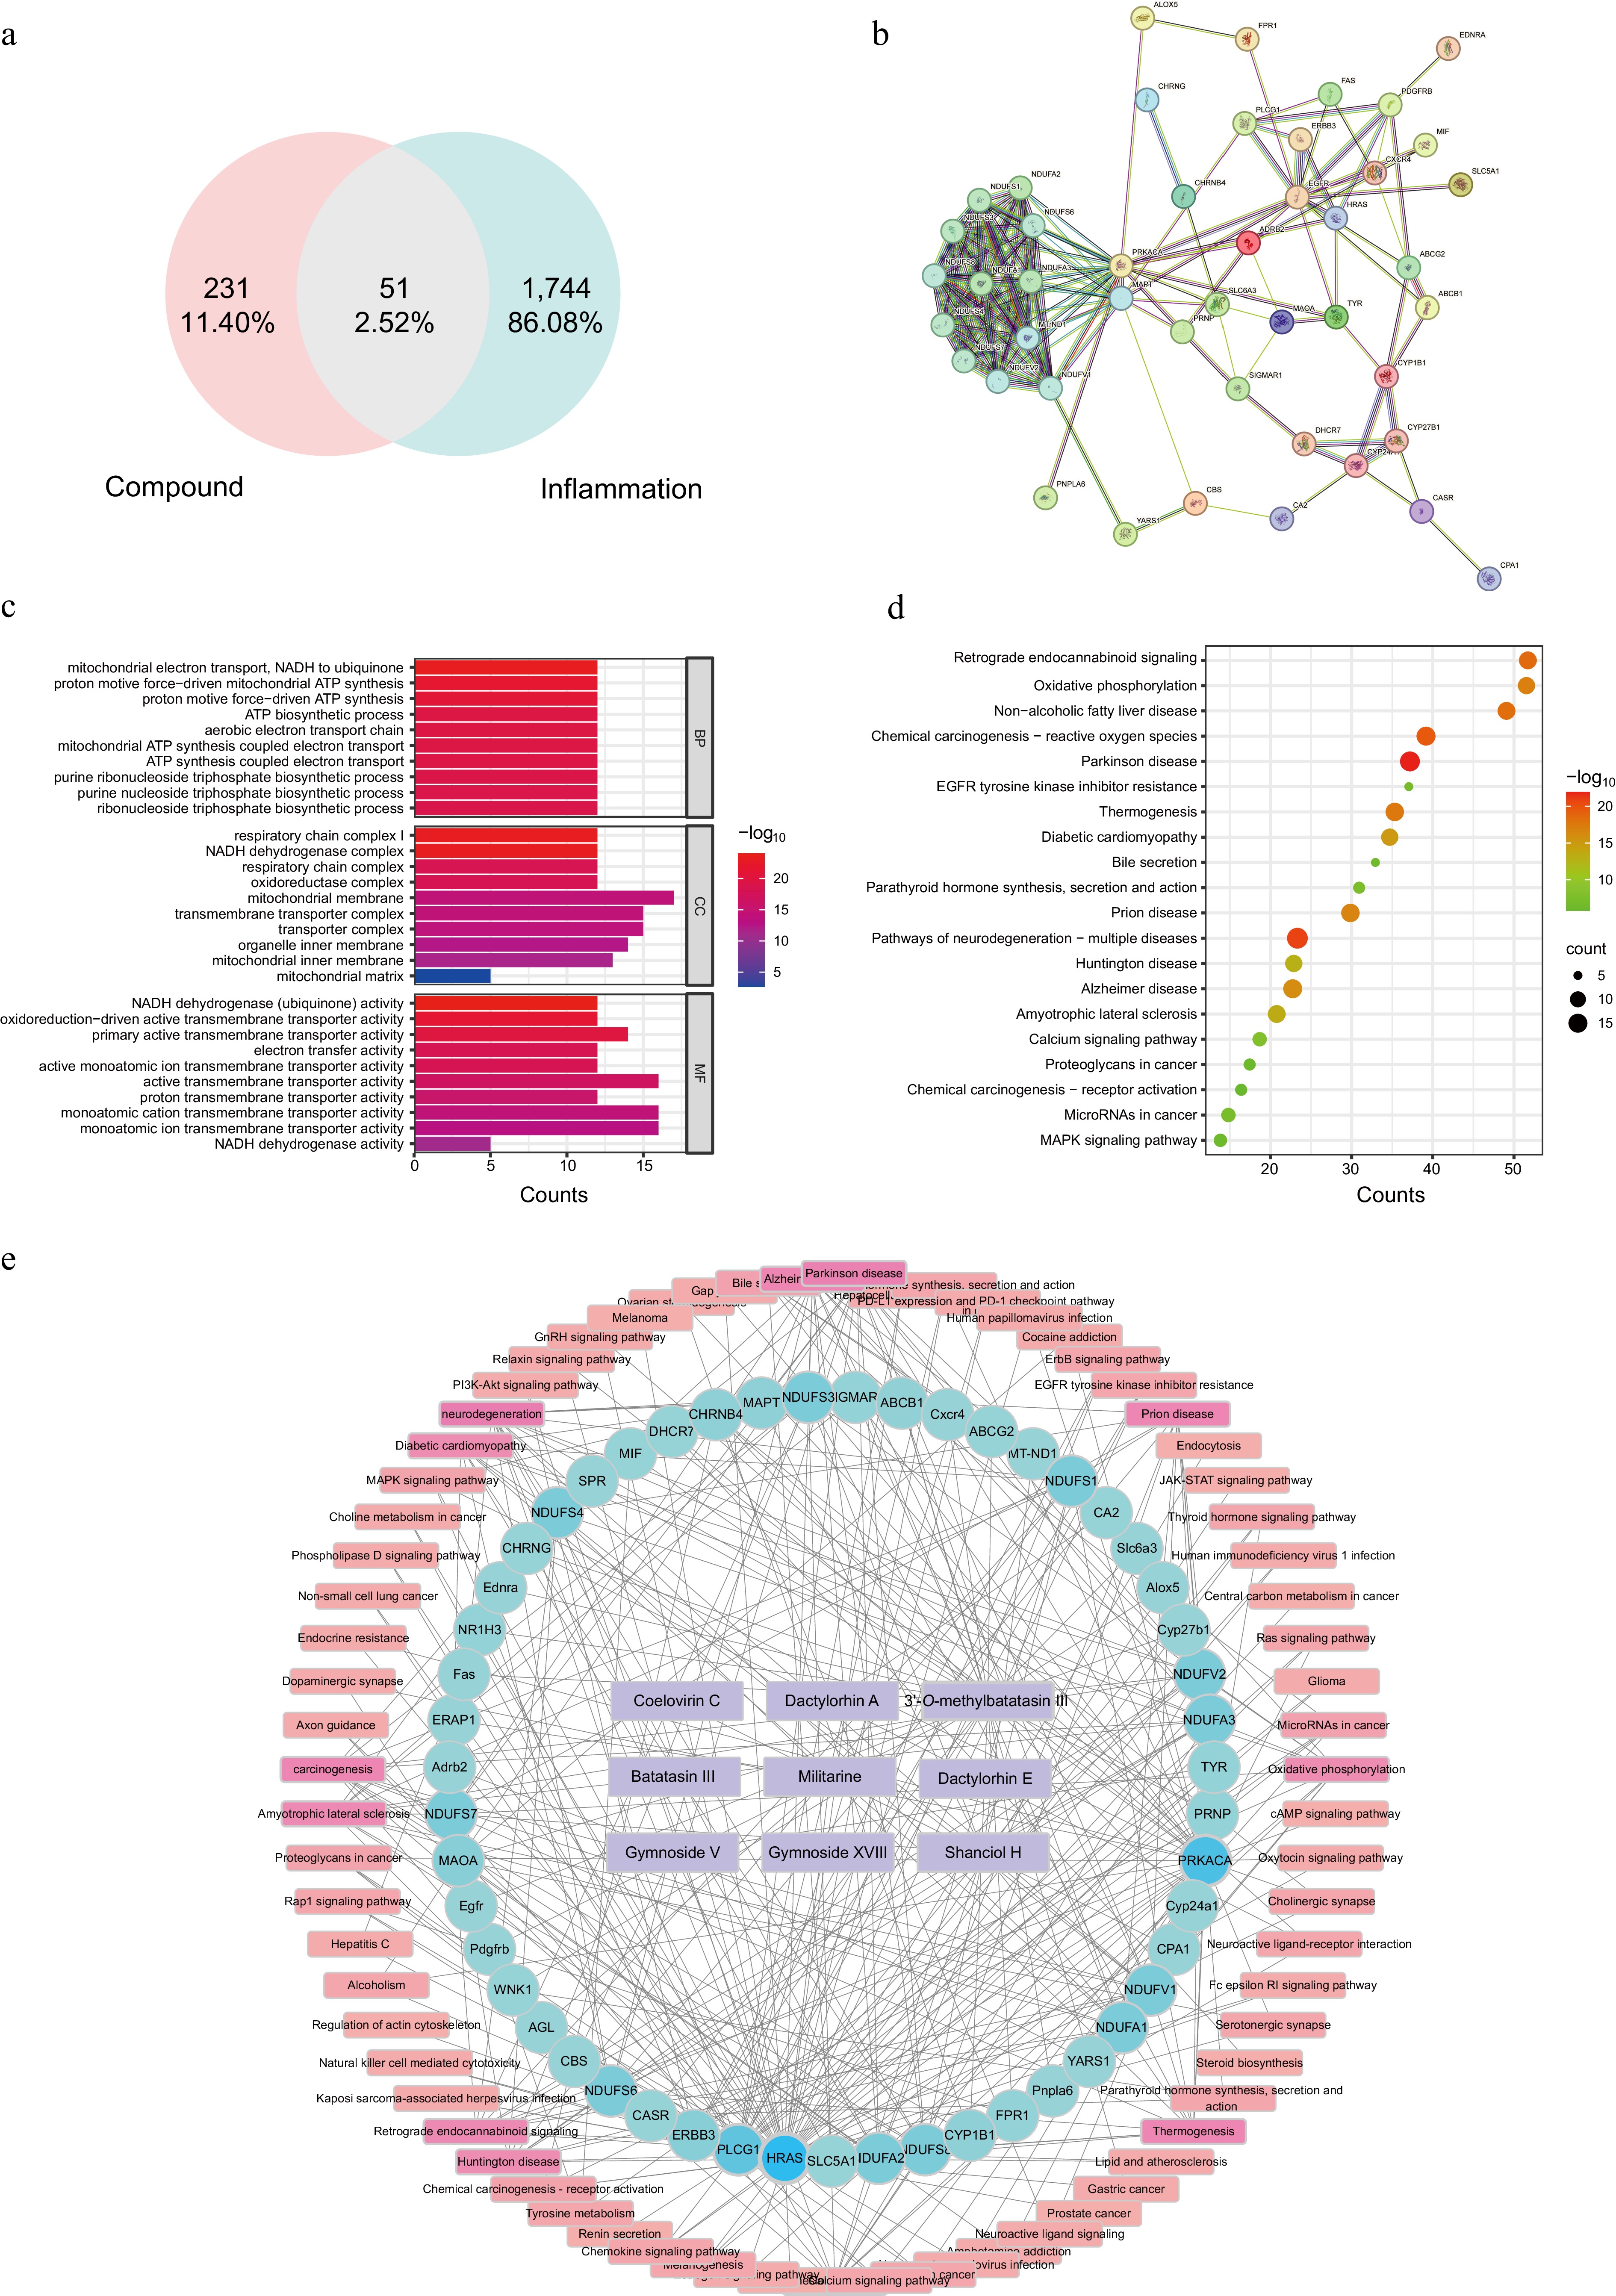
Figure 8.
Network pharmacology analysis of candidate Q-markers for Shancigu. (a) Venn diagram showing the intersection of compound-predicted targets and inflammation-related targets. (b) PPI network of common targets. (c) GO functional enrichment analysis. (d) KEGG pathway enrichment analysis. (e) Compound-target-pathway network.
Figures
(8)
Tables
(0)