








-
Shancigu, the dried pseudobulbs of three orchid species (Cremastra appendiculata [D. Don] Makino, Pleione bulbocodioides [Franch.] Rolfe, and Pleione yunnanensis [Rolfe]), has been traditionally used for its heat-clearing, detoxifying, phlegm-resolving, and nodule-dispersing properties[1,2]. Modern studies have demonstrated its anti-cancer, hepatoprotective, anti-inflammatory, neuroprotective, and antioxidant potentials[3]. Phytochemical investigations have successfully isolated and identified a variety of bioactive compounds from Shancigu, including phenanthrenes, bibenzyls, and benzyl succinic acid glycosides. Among these, phenanthrenes and bibenzyls are the major active constituents responsible for its antitumor effects[4]; benzyl succinic acid glycosides, including militarine and dactylorhin A, exhibit hepatoprotective, anti-dementia, and neuroprotective activities[5,6]. These findings have advanced our understanding of the medicinal value of Shancigu. However, most existing studies have focused solely on the dried pseudobulbs, and systematic investigations of whole plants (including roots, leaves, buds, fruits, and pedicels) are still lacking. Among the three official botanical sources, C. appendiculata is commercially known as 'Maocigu' and differs substantially from the two Pleione species in chemical composition and commercial identity. The two Pleione species, traded as 'Bingqiuzi', are morphologically nearly indistinguishable and are often not differentiated in commercial practice. However, their respective chemical profiles remain poorly characterized, and effective chemical markers for quality evaluation and botanical authentication are still lacking[7]. To address this gap, we focused on P. bulbocodioides and P. yunnanensis and systematically characterized their specialized metabolite profiles across multiple tissues, aiming to clarify their interspecific chemical diversity and provide a chemical basis for quality control and botanical authentication. Furthermore, the accumulation of bioactive compounds in multiple non-traditional tissues suggests that these organs may also hold medicinal potential, offering new opportunities for resource expansion while supporting the conservation of these endangered medicinal plants.
Accurate botanical authentication and quality control are essential for the consistency and safety of medicinal plant products. To address this challenge, the concept of quality markers (Q-markers) has been proposed as a strategy to identify chemical indicators that reflect both botanical authenticity and therapeutic properties[8,9]. Their discovery is guided by the principles of therapeutic efficacy, specificity to the herb, and traceability through production and metabolic processes[10]. Currently, quality evaluation of Traditional Chinese Medicines (TCMs) commonly employs high-performance liquid chromatography (HPLC) and ultra-performance liquid chromatography-quadrupole time-of-flight tandem mass spectrometry (UPLC-QTOF-MS/MS) for qualitative and quantitative determination of indicator components, which have played significant roles in component identification[11]. Untargeted metabolomics based on high-resolution mass spectrometry (HRMS) enables comprehensive profiling of small-molecule metabolites in biological samples[12]. This approach can simultaneously detect thousands of metabolic features and facilitate structural identification through database matching and fragmentation analysis, providing a foundation for discovering potential Q-markers[13]. Recently, an integrated strategy has identified five potential Q-markers for P. bulbocodioides, namely militarine, dactylorhin A, and three new pleionoids A–C[7]. However, effective Q-markers for quality evaluation and botanical authentication remain unavailable for the endangered P. yunnanensis. Moreover, the biosynthesis and accumulation sites of these bioactive compounds remain unclear[2,14], and systematic investigations of chemical variations between different botanical sources are still lacking. Furthermore, conventional analytical methods typically require sample homogenization, which leads to the complete loss of spatially resolved metabolite information[15]. These issues together severely constrain the development of quality control and botanical authentication methods for Shancigu.
The loss of spatially resolved metabolite information not only constrains quality control and botanical authentication, but also limits our understanding of the medicinal potential of non-traditional tissues. Mass spectrometry imaging (MSI) is a powerful tool for mapping the spatial distribution of metabolites in intact tissues[16]. Based on ionization methods, MSI mainly includes desorption electrospray ionization (DESI-MSI), matrix-assisted laser desorption/ionization (MALDI-MSI), and secondary ion MSI (SIMS)[17]. Among these, DESI-MSI offers simple sample preparation, ambient operating conditions, and high sensitivity for small molecules, making it particularly suitable for natural product research[18]. MSI has been increasingly applied to investigate the spatial distribution of endogenous components in medicinal plants, providing valuable insights into the accumulation sites of bioactive compounds[19]. Examples include the visualization of triterpenoids in Ganoderma lingzhi[20,21] and Panax quinquefolius[22], as well as other bioactive secondary metabolites in Salvia miltiorrhiza[23], Ginkgo biloba[24], Scutellaria baicalensis[25], and Taxus chinensis[26]. Furthermore, MSI facilitates direct comparison of chemical compositions between different plant parts, providing important evidence for selecting and validating Q-markers[27]. When integrated with untargeted metabolomics, DESI-MSI can simultaneously capture comprehensive chemical profiles and spatial distribution patterns, offering an effective approach for Q-marker discovery and validation. Nevertheless, chemical and spatial characterization alone cannot fully reveal the biological functions and potential targets of candidate Q-markers. To bridge this gap, network pharmacology has been introduced as a complementary in silico strategy to predict the potential targets and signaling pathways of bioactive compounds[28]. This approach has been successfully applied to screen Q-markers by integrating chemical and pharmacological data, thus providing a valuable basis for understanding their mechanisms of action and for the quality control of TCMs[29]. Collectively, these advances provide the methodological foundation for the present study.
In this study, we integrated UPLC-QTOF-MS/MS-based untargeted metabolomics, feature-based molecular networking (FBMN), and DESI-MSI to systematically profile metabolites and their spatial distribution across multiple tissues of P. bulbocodioides and P. yunnanensis. Candidate Q-markers for quality evaluation were statistically screened from pseudobulb metabolomic data, further validated using samples from multiple geographical origins, spatially confirmed by DESI-MSI, and pharmacologically assessed through network pharmacology. This work provides a comprehensive chemical characterization of these two endangered Pleione species and establishes an integrated framework for their quality control and botanical authentication.
-
Fresh whole plants of two orchid species, P. bulbocodioides and P. yunnanensis, were collected in September 2025 from a nursery in Baoshan City, Yunnan Province, China (24.5717° N, 98.5116° E). All plants were approximately 3 years old and at the harvest stage. September is within the conventional harvest period of this medicinal material. The two species were grown under the same nursery conditions and collected at the same time, ensuring comparable developmental stages. Three individual plants were harvested per species as biological replicates. The plants were transported to the laboratory at room temperature with intact soil. Upon arrival, tissues were dissected and flash-frozen in liquid nitrogen, then stored at −80 °C until subsequent analysis. For multi-origin validation, an independent batch of fresh whole plants from six provenance groups was cultivated under uniform conditions at Kunming Botanical Garden, Yunnan, China. Specifically, P. bulbocodioides originated from Chongqing (CQ), Nujiang, Yunnan (YNNJ), and Lijiang, Yunnan (YNLJ); P. yunnanensis originated from Leishan, Guizhou (GZLS), Baoshan, Yunnan (YNBS), and Lijiang, Yunnan (YNLJ). Pseudobulb and leaf tissues were dissected and collected in September 2026 during the conventional harvest period, with five biological replicates per population, except for the YNNJ, which had three biological replicates. The fresh tissues were oven-dried at 80 °C to constant weight and stored at room temperature before analysis. HPLC-grade acetonitrile, acetic acid, and methanol were obtained from Merck KGaA (Darmstadt, Germany). Water was purified via a Milli-Q ULTRA system (Millipore, Vimodrone, Italy). Reference standards (purity ≥ 98%) of batatasin III (56684-87-8), 3'-O-methylbatatasin III (101330-69-2), gymnoside III (899430-03-6), and dactylorhin A (256459-34-4) were procured from Shanghai Yuanye Biotechnology Co., Ltd (Shanghai, China). Reference standard (purity ≥ 98%) of militarine (58139-23-4) was procured from MREDA (Beijing, China). Lidocaine (137-58-6) and carboxymethyl cellulose (CMC) sodium salt were purchased from Aladdin Scientific Ltd (Shanghai, China). All other chemicals were of analytical grade.
Sample preparation for UPLC-QTOF-MS/MS analysis
-
Prior to freeze-drying, the whole plants collected from Baoshan were dissected into different tissues (roots, pseudobulbs, leaves, buds, fruits, and pedicels), and each tissue type was processed separately. The freshly dissected tissues were freeze-dried using a lyophilizer (ALPHA 2-4 LSCbasic, Christ, Germany). The dried materials were subsequently pulverized in a mixer mill at 30 Hz for 1 min. An aliquot of 100 mg of the resulting powder was extracted with 1.0 mL of chilled 70% methanol (v/v) at 4 °C for 10 h, with lidocaine (0.1 mg/L) added as the internal standard. Following centrifugation at 12,000 rpm for 10 min (4 °C), the supernatant was collected and passed through a 0.22 μm organic membrane filter into a glass vial. For the multi-origin validation samples (pseudobulbs and leaves), the oven-dried materials (80 °C to constant weight) were pulverized and extracted using the same procedure as described above.
Sample preparation for DESI-MSI analysis
-
Fresh samples of roots, pseudobulbs, leaves, buds, fruits, and pedicels were embedded in a 3% (w/v) carboxymethyl cellulose (CMC) solution in water within silicone molds (2 × 2 × 2 cm) and frozen overnight at −80 °C. The frozen tissue blocks were then sectioned using a cryostat microtome (Leica Biosystems, CM1950) at −20 °C. Sections were cut at a thickness of 50 μm for roots, leaves, buds, and fruits, while pseudobulb sections were cut at 100 μm. All sections were immediately mounted onto pre-chilled, positively charged glass slides. Prior to DESI-MSI analysis, the slides were vacuum-dried in a desiccator for 10 min.
UPLC-QTOF-MS/MS analysis
-
Metabolite analysis was performed using a Shimadzu Nexera UPLC system coupled with an AB Sciex ZenoTOF 7600 mass spectrometer equipped with a TurboIonSpray source. Chromatographic separation was carried out on a Waters Acquity UPLC HSS T3 column (2.1 × 100 mm, 1.8 μm) maintained at 40 °C. The mobile phase consisted of solvent A (water with 0.04% acetic acid) and solvent B (acetonitrile with 0.04% acetic acid) at a flow rate of 0.35 mL/min. The gradient program was as follows: 0−10 min, 5%−95% B; 10−11 min, hold at 95% B; 11.1 min, return to 5% B; and re-equilibrate at 5% B until 14 min. The injection volume was 2 μL.
Mass spectrometric detection was performed in both positive and negative electrospray ionization modes. The ion source parameters were set as follows: ion spray voltage, 5,500 V for positive and −4,500 V for negative; source temperature, 500 °C; curtain gas, 35 psi; ion source gases 1 and 2, both 50 psi; collision gas, 7 (arbitrary units). Declustering potential was set to 80 V in both modes. TOF MS full-scan spectra were acquired over the mass range m/z 100−2,000 with an accumulation time of 150 ms. For information-dependent acquisition (IDA), the top 15 (positive) or 18 (negative) precursor ions exceeding 100 cps were selected for fragmentation, with collision energy set at 55 V and a spread of 25 V. MS/MS spectra were recorded from m/z 50 to 2,000 with an accumulation time of 35 ms (positive) or 20 ms (negative). Dynamic background subtraction was enabled to exclude background ions. Prior to analysis, the mass axis was calibrated using the manufacturer's recommended calibration solution.
DESI-MSI analysis
-
DESI-MSI analysis was performed on a high-resolution SELECT SERIES Cyclic IMS platform (Waters Corporation, Milford, MA, USA) equipped with a DESI ion source. Tissue sections were analyzed in negative ionization mode using a TOF MS acquisition method. Critical instrumental parameters were configured as follows: spatial resolution maintained at 100 × 100 μm per pixel with a stage traversal speed of 200 μm/s, ion source temperature stabilized at 150 °C, sample cone voltage set to 40 V, and full mass spectra acquired across m/z 100−1,200. The optimized electrospray solvent comprised HPLC-grade methanol/water (98:2, v/v) containing 0.01% formic acid, delivered at 3 μL/min via a syringe pump. All mass spectral data were acquired using MassLynx software (v4.2, Waters Corporation), with subsequent raw data processing, metabolite visualization, and spatial distribution analysis conducted in HDI Imaging Software (Waters Corporation). Mass calibration was performed using leucine enkephalin (m/z 554.2615 [M-H]−) as the lock mass, delivered at 200 pg/μL in 50:50 acetonitrile/water containing 0.1% formic acid for real-time mass correction during acquisition.
Metabolome data analysis
-
Raw data from untargeted metabolomics were processed using MS-DIAL (v5.5) for peak detection, alignment, extraction, integration, and normalization, generating comprehensive peak tables[30]. Metabolite annotation was performed by combining multiple approaches: database matching within MS-DIAL, computational prediction using SIRIUS (v6.3.3) on exported .msp spectra, and verification against an in-house standard library[31]. FBMN analysis was carried out within the Global Natural Products Social Molecular Networking (GNPS) platform to facilitate the annotation of MS/MS spectra, with edges filtered by a cosine score > 0.7[32]. For statistical analysis, orthogonal partial least squares discriminant analysis (OPLS-DA) was performed using MetaboAnalyst (v6.0) to visualize the metabolic differences between the two Pleione species in pseudobulbs[33]. The OPLS-DA VIP output contained 51 metabolites; after excluding two with zero signal in all P. yunnanensis replicates and infinite fold-change values, 49 were retained for subsequent comparison. Candidate differential metabolites were identified based on variable importance in projection (VIP) > 1, fold change > 2 or < 0.5, and p < 0.01 from Student's t-test. Data are presented as mean ± standard deviation from at least three biological replicates. Visualization of the results, including chromatograms and mass spectra, was performed in GraphPad Prism (v8.0.2). For DESI-MSI data, metabolites were putatively annotated by matching the accurate MS1 features to the untargeted metabolomics results.
Network pharmacological analysis
-
Nine candidate compounds were selected. Their SMILES strings were obtained from PubChem (
https://pubchem.ncbi.nlm.nih.gov ), and potential targets were predicted using the Similarity Ensemble Approach (SEA) database (https://sea.bkslab.org ) with an E-value threshold of < 0.001. Duplicate targets were removed. Inflammation-related targets were retrieved from the GeneCards database (www.genecards.org ) using the keyword 'inflammation'. The targets were filtered to be classified as 'Protein Coding' and with a relevance score > 5. Overlapping targets between compound-predicted targets and inflammation-related targets were considered as potential therapeutic targets. The overlapping targets were submitted to the STRING database (v12,https://cn.string-db.org ) with the species set to Homo sapiens and an interaction score threshold of > 0.4. A protein–protein interaction (PPI) network was constructed and visualized using STRING; core targets were identified by degree centrality. Gene Ontology (GO) and Kyoto Encyclopedia of Genes and Genomes (KEGG) pathway enrichment analyses were performed using the Metascape platform (https://metascape.org )[34]. A significance threshold of p < 0.05 was applied. The GO and KEGG results were visualized using the WeiShengXin online platform (www.bioinformatics.com.cn )[35]. Finally, a compound-target-pathway network was built in Cytoscape 3.10.4. -
UPLC-QTOF-MS/MS was used to rapidly separate and characterize the main chemical components across roots, pseudobulbs, leaves, buds, pedicels, and fruits of the two Pleione species, P. bulbocodioides and P. yunnanensis (Fig. 1a). Total ion chromatograms (TICs) revealed that most metabolites eluted between 2 and 6 min under a gradient of 23%−59% acetonitrile, with significant differences observed among tissues and species (Fig. 1b). A total of 19,340 metabolic features were detected in both positive and negative ionization modes, of which 16,610 yielded MS/MS fragmentation data. From these, 3,216 compounds were annotated (Supplementary Table S1), spanning 476 phenylpropanoids, 377 terpenoids, 353 flavonoids, 350 lipids, 318 amino acids and derivatives, 252 alkaloids, 158 carbohydrates, 109 organic acids, 107 benzyl succinic acid glycosides, 78 bibenzyls, 65 nucleotides and derivatives, 56 phenanthrenes, and 517 others (Fig. 1c). These findings are consistent with the constituents of Shancigu reported in previous studies, and considerably expand the number of annotated metabolites across multiple chemical classes, particularly the three characteristic bioactive classes (benzyl succinic acid glycosides, bibenzyls, and phenanthrenes)[3]. Comparative analysis of the metabolite profiles revealed clear differences in metabolite counts and composition between the two species (Fig. 1d; Supplementary Table S2). In both species, leaves, roots, and fruits showed the highest numbers of metabolites, whereas pseudobulbs showed the fewest. Phenylpropanoids, lipids, terpenoids, amino acids and their derivatives, and flavonoids were identified as core chemical classes common to both species, while benzyl succinic acid glycosides, bibenzyls, and phenanthrenes exhibited distinct distribution patterns across species and tissues. Overall, the metabolomic profiles varied more by tissue type than by species. Notably, the pseudobulbs, despite being the medicinal part, contained relatively few metabolites.
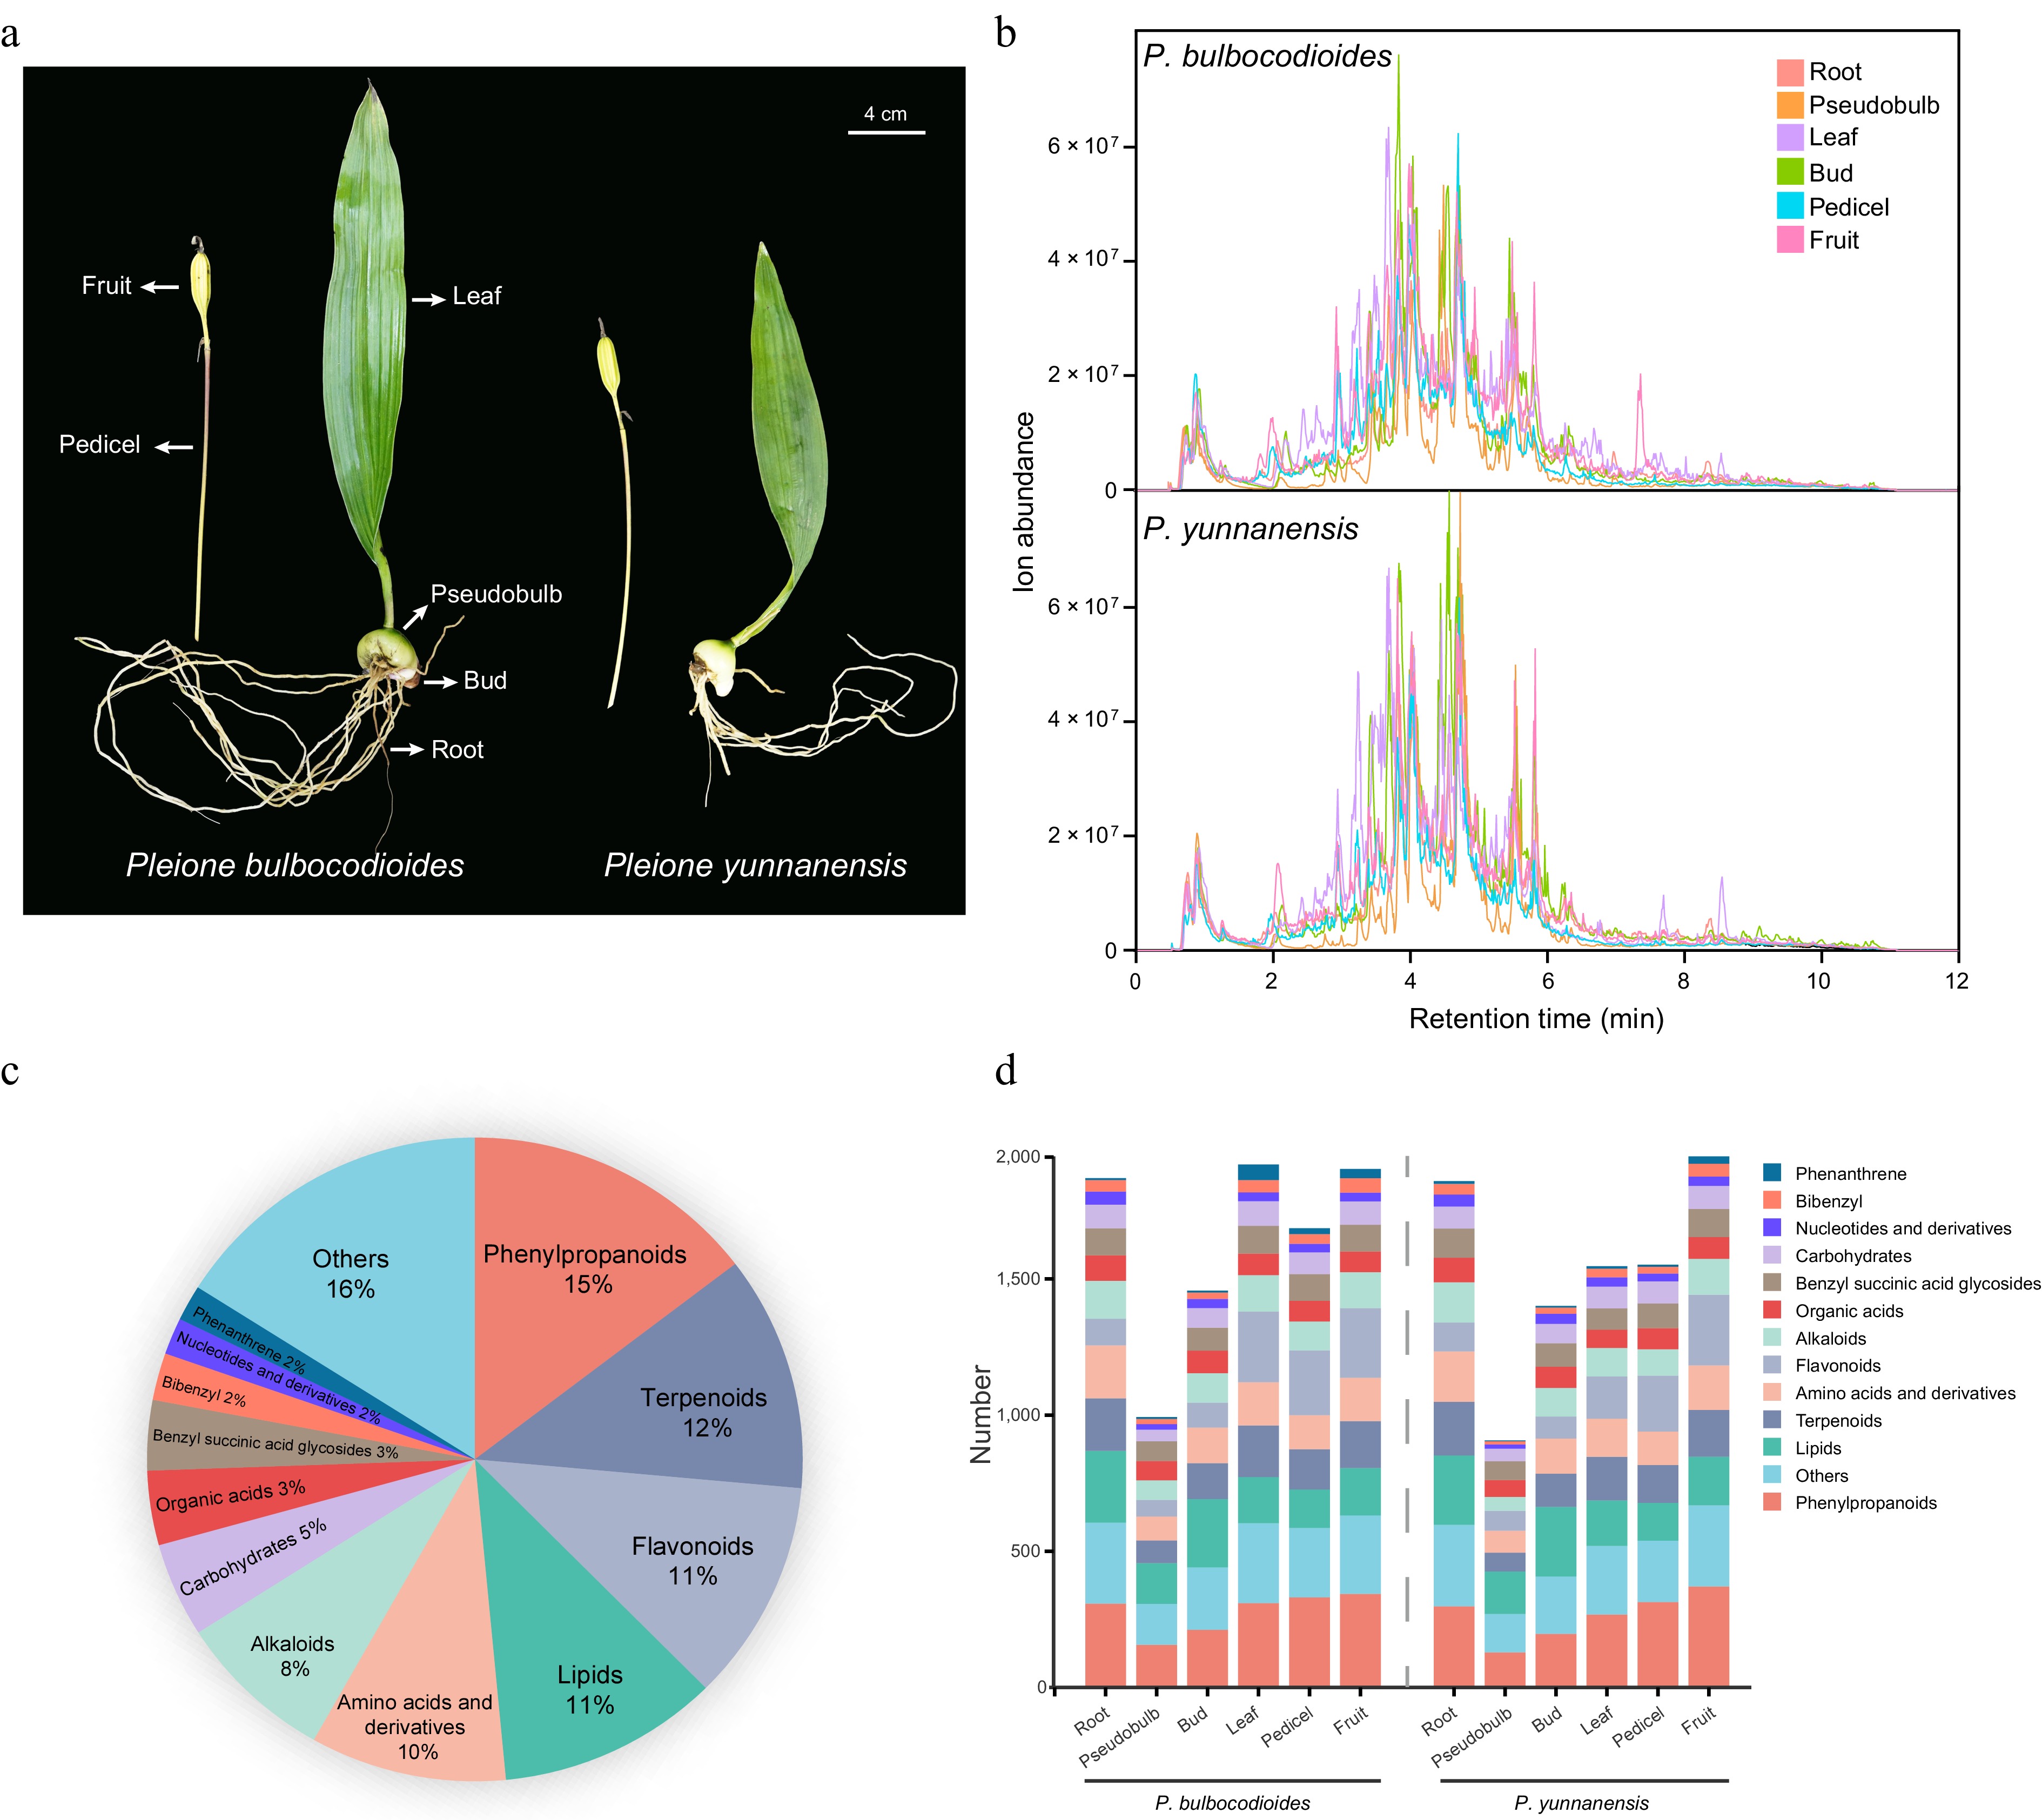
Figure 1.
Comprehensive metabolomic profiling of the two Pleione species. (a) Photographs of P. bulbocodioides and P. yunnanensis whole plants. (b) Representative TICs of different tissues from the two species, acquired by UPLC-QTOF-MS/MS in negative ionization mode. (c) Pie chart showing the classification and relative proportions of all annotated metabolites. (d) Distribution of annotated metabolites in each tissue of the two species.
The accurate annotation of benzyl succinic acid glycosides, bibenzyls, and phenanthrenes is challenging due to their structural diversity and limited reference data. To improve their annotation reliability, FBMN was performed within the GNPS platform. A global molecular network was first constructed using all detected MS/MS spectra from the two Pleione species (Supplementary Fig. S1). From this global network, the subclusters corresponding to the three target classes were isolated and enlarged for detailed examination (Fig. 2a−c). The succinate cluster (Fig. 2a) comprised predominantly benzyl succinic acid glycosides and their derivatives, with representative annotated nodes including dactylorhin E (m/z 619.2273 [M-H]−), dactylorhin A (m/z 887.3218 [M-H]−), and gymnoside XVIII (m/z 903.3174 [M-H]−). The high cosine scores (0.8−0.9) among these nodes reflect their shared benzyl succinic acid glycoside core structure. Additional nodes connected within this cluster (e.g., m/z 631.1658, 883.3059, 873.2784) were annotated in the present study, and their placement in the network alongside known reference compounds provides increased confidence in their structural assignment. The bibenzyl cluster (Fig. 2b) was anchored by batatasin III (m/z 243.1031 [M-H]−) and 5-methoxybibenzyl-3,3'-di-O-β-D-glucopyranoside (m/z 567.2086 [M-H]−). Additional nodes identified within this cluster (e.g., m/z 349.1452, 395.1505) corresponded to bibenzyls with varying degrees of hydroxylation, methoxylation, and acylation, and their co-clustering with the reference compounds supported their annotation. The phenanthrene cluster (Fig. 2c) included bulbocodioidin G (m/z 537.1568 [M-H]−), bulbocodioidin H (m/z 537.1577 [M-H]−), and bulbocodioidin J (m/z 493.1659 [M-H]−), with the closely matched m/z values of G and H suggesting they are likely positional isomers. Additional nodes with m/z values of 493.1668, 507.1463, and 507.1452 were annotated as positional isomers of hydroxyl and/or methoxyl substitution on the phenanthrene core. Their co-clustering with the reference compounds further supported the assignment. Across all three clusters, the high cosine scores and the co-clustering of newly annotated nodes with known references provided increased confidence in the structural assignments, establishing a chemically informed foundation for the subsequent MS/MS fragmentation analysis.
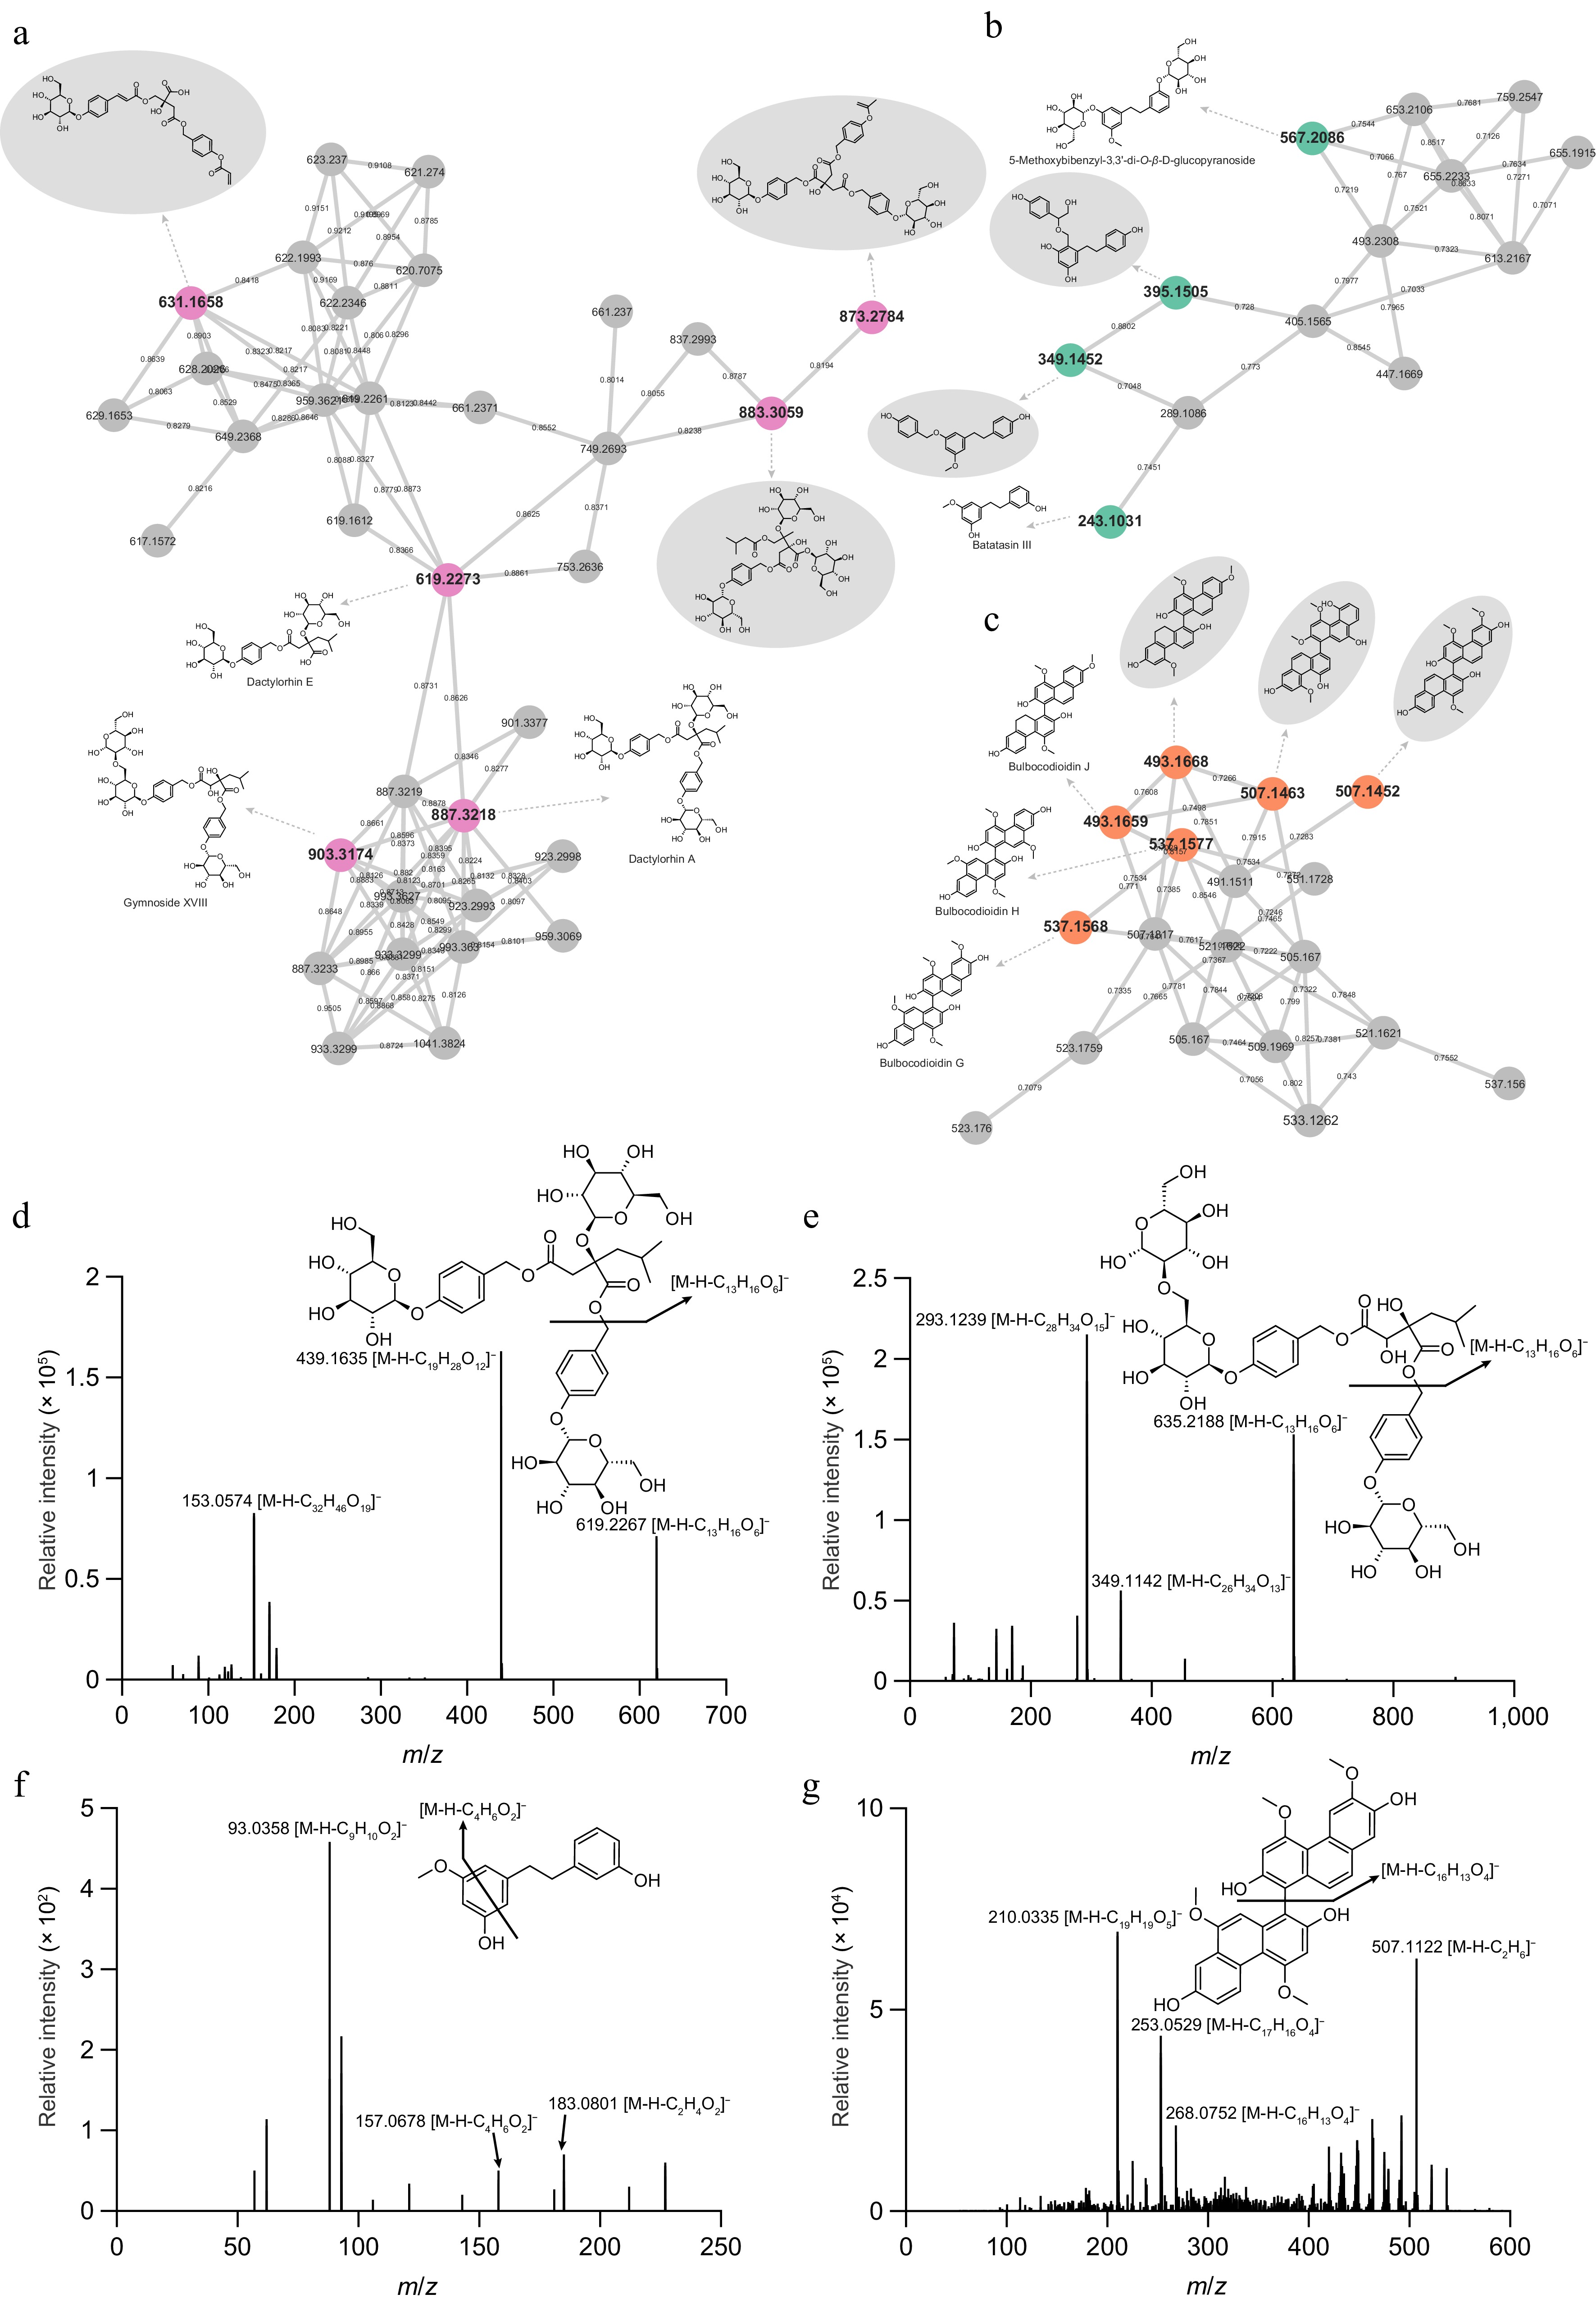
Figure 2.
Feature-based molecular networking-assisted annotation of three characteristic compound classes. Molecular networks of (a) benzyl succinic acid glycosides, (b) bibenzyls, and (c) phenanthrenes, extracted from the global network shown in Supplementary Fig. S1. Nodes represent individual metabolites, and edges indicate MS/MS spectral similarity (cosine score). Representative MS/MS spectra and fragmentation pathways of diagnostic ions acquired in negative ionization mode: (d) dactylorhin A (m/z 887.3218 [M-H]−), (e) gymnoside XVIII (m/z 903.3174 [M-H]−), (f) batatasin III (m/z 243.1031 [M-H]−), and (g) bulbocodioidin G (m/z 537.1568 [M-H]−).
To further validate the structural assignments and establish class-specific diagnostic fragmentation patterns, representative compounds from each cluster were subjected to detailed MS/MS spectral interpretation (Fig. 2d−g). For benzyl succinic acid glycosides, both dactylorhin A (m/z 887.3218 [M-H]−) and gymnoside XVIII (m/z 903.3174 [M-H]−) exhibited the same characteristic neutral loss of a glucosyloxybenzyl moiety (C13H16O6), yielding fragment ions at m/z 619.2267 and m/z 635.2188, respectively (Fig. 2d, e). This shared fragmentation pattern supports their common benzyl succinic acid glycoside core structure. For bibenzyls, batatasin III (m/z 243.1031 [M-H]−) generated diagnostic fragments at m/z 183.0801 ([M-H-C2H4O2]−), m/z 157.0678 ([M-H-C4H6O2]−), and m/z 93.0358 ([M-H-C9H10O2]−), representing characteristic cleavages of the bibenzyl skeleton (Fig. 2f). For phenanthrenes, bulbocodioidin G (m/z 537.1568 [M-H]−) generated a highly diagnostic ion at m/z 268.0752 ([M-H-C16H13O4]−), corresponding to the neutral loss of a C16H13O4 moiety via cleavage of the central ring, along with its demethylated product at m/z 253.0529, and a further fragmentation product at m/z 210.0335 (Fig. 2g).
In summary, this untargeted metabolomics approach provided a comprehensive profile of the metabolite composition across tissues and species. The FBMN analysis further enhanced the reliability of annotation for the three characteristic bioactive classes, offering increased confidence in their structural annotation. These findings establish a chemical foundation for the subsequent tissue distribution analysis and candidate Q-marker screening.
Comparative profiling of bioactive compounds across tissues and species
-
We performed multivariate statistical analyses based on the quantitative metabolite data to reveal the metabolic differences among tissues of the two Pleione species (Supplementary Table S3). Principal component analysis (PCA) showed a clear separation of samples by tissue type, with PC1 and PC2 accounting for 26.21% and 16.28% of total variance, respectively (Fig. 3a). Underground tissues, including pseudobulbs, roots, and buds, clearly separated from aerial tissues (leaves, fruits, and pedicels). This pattern indicated that tissue type, rather than species difference, was the main source of variation. Pearson correlation analysis further supported this pattern (Fig. 3b). Correlations between the same tissues of the two species were consistently high, with pedicels showing a correlation of 0.98 and roots 0.97, indicating evident metabolic similarity within tissue types regardless of species. The separation of leaf samples between the two species was further refined in a 3D PCA model, revealing subtle differences beyond the variation mainly attributable to tissue type (Supplementary Fig. S2). Hierarchical clustering further illustrated the differentiation of metabolic profiles across tissues (Fig. 3c). Pseudobulbs of both species clustered into a distinct group, consistent with their overall low metabolite content, which likely results from a dilution effect caused by extensive storage parenchyma development[36]. Within the aerial clade, leaves of the two species further separated from fruits and pedicels. P. bulbocodioides leaves exhibited a distinct metabolite accumulation pattern, characterized by the enrichment of a variety of phenanthrenes. Other tissue types displayed broadly similar metabolite profiles between the two species. This metabolic differentiation between aerial and underground tissues has been well documented in medicinal plants. It has been associated with differences in tissue-specific biosynthesis, vascular transport dynamics, and the distinct ecological functions of organs growing above and below ground[37−39].
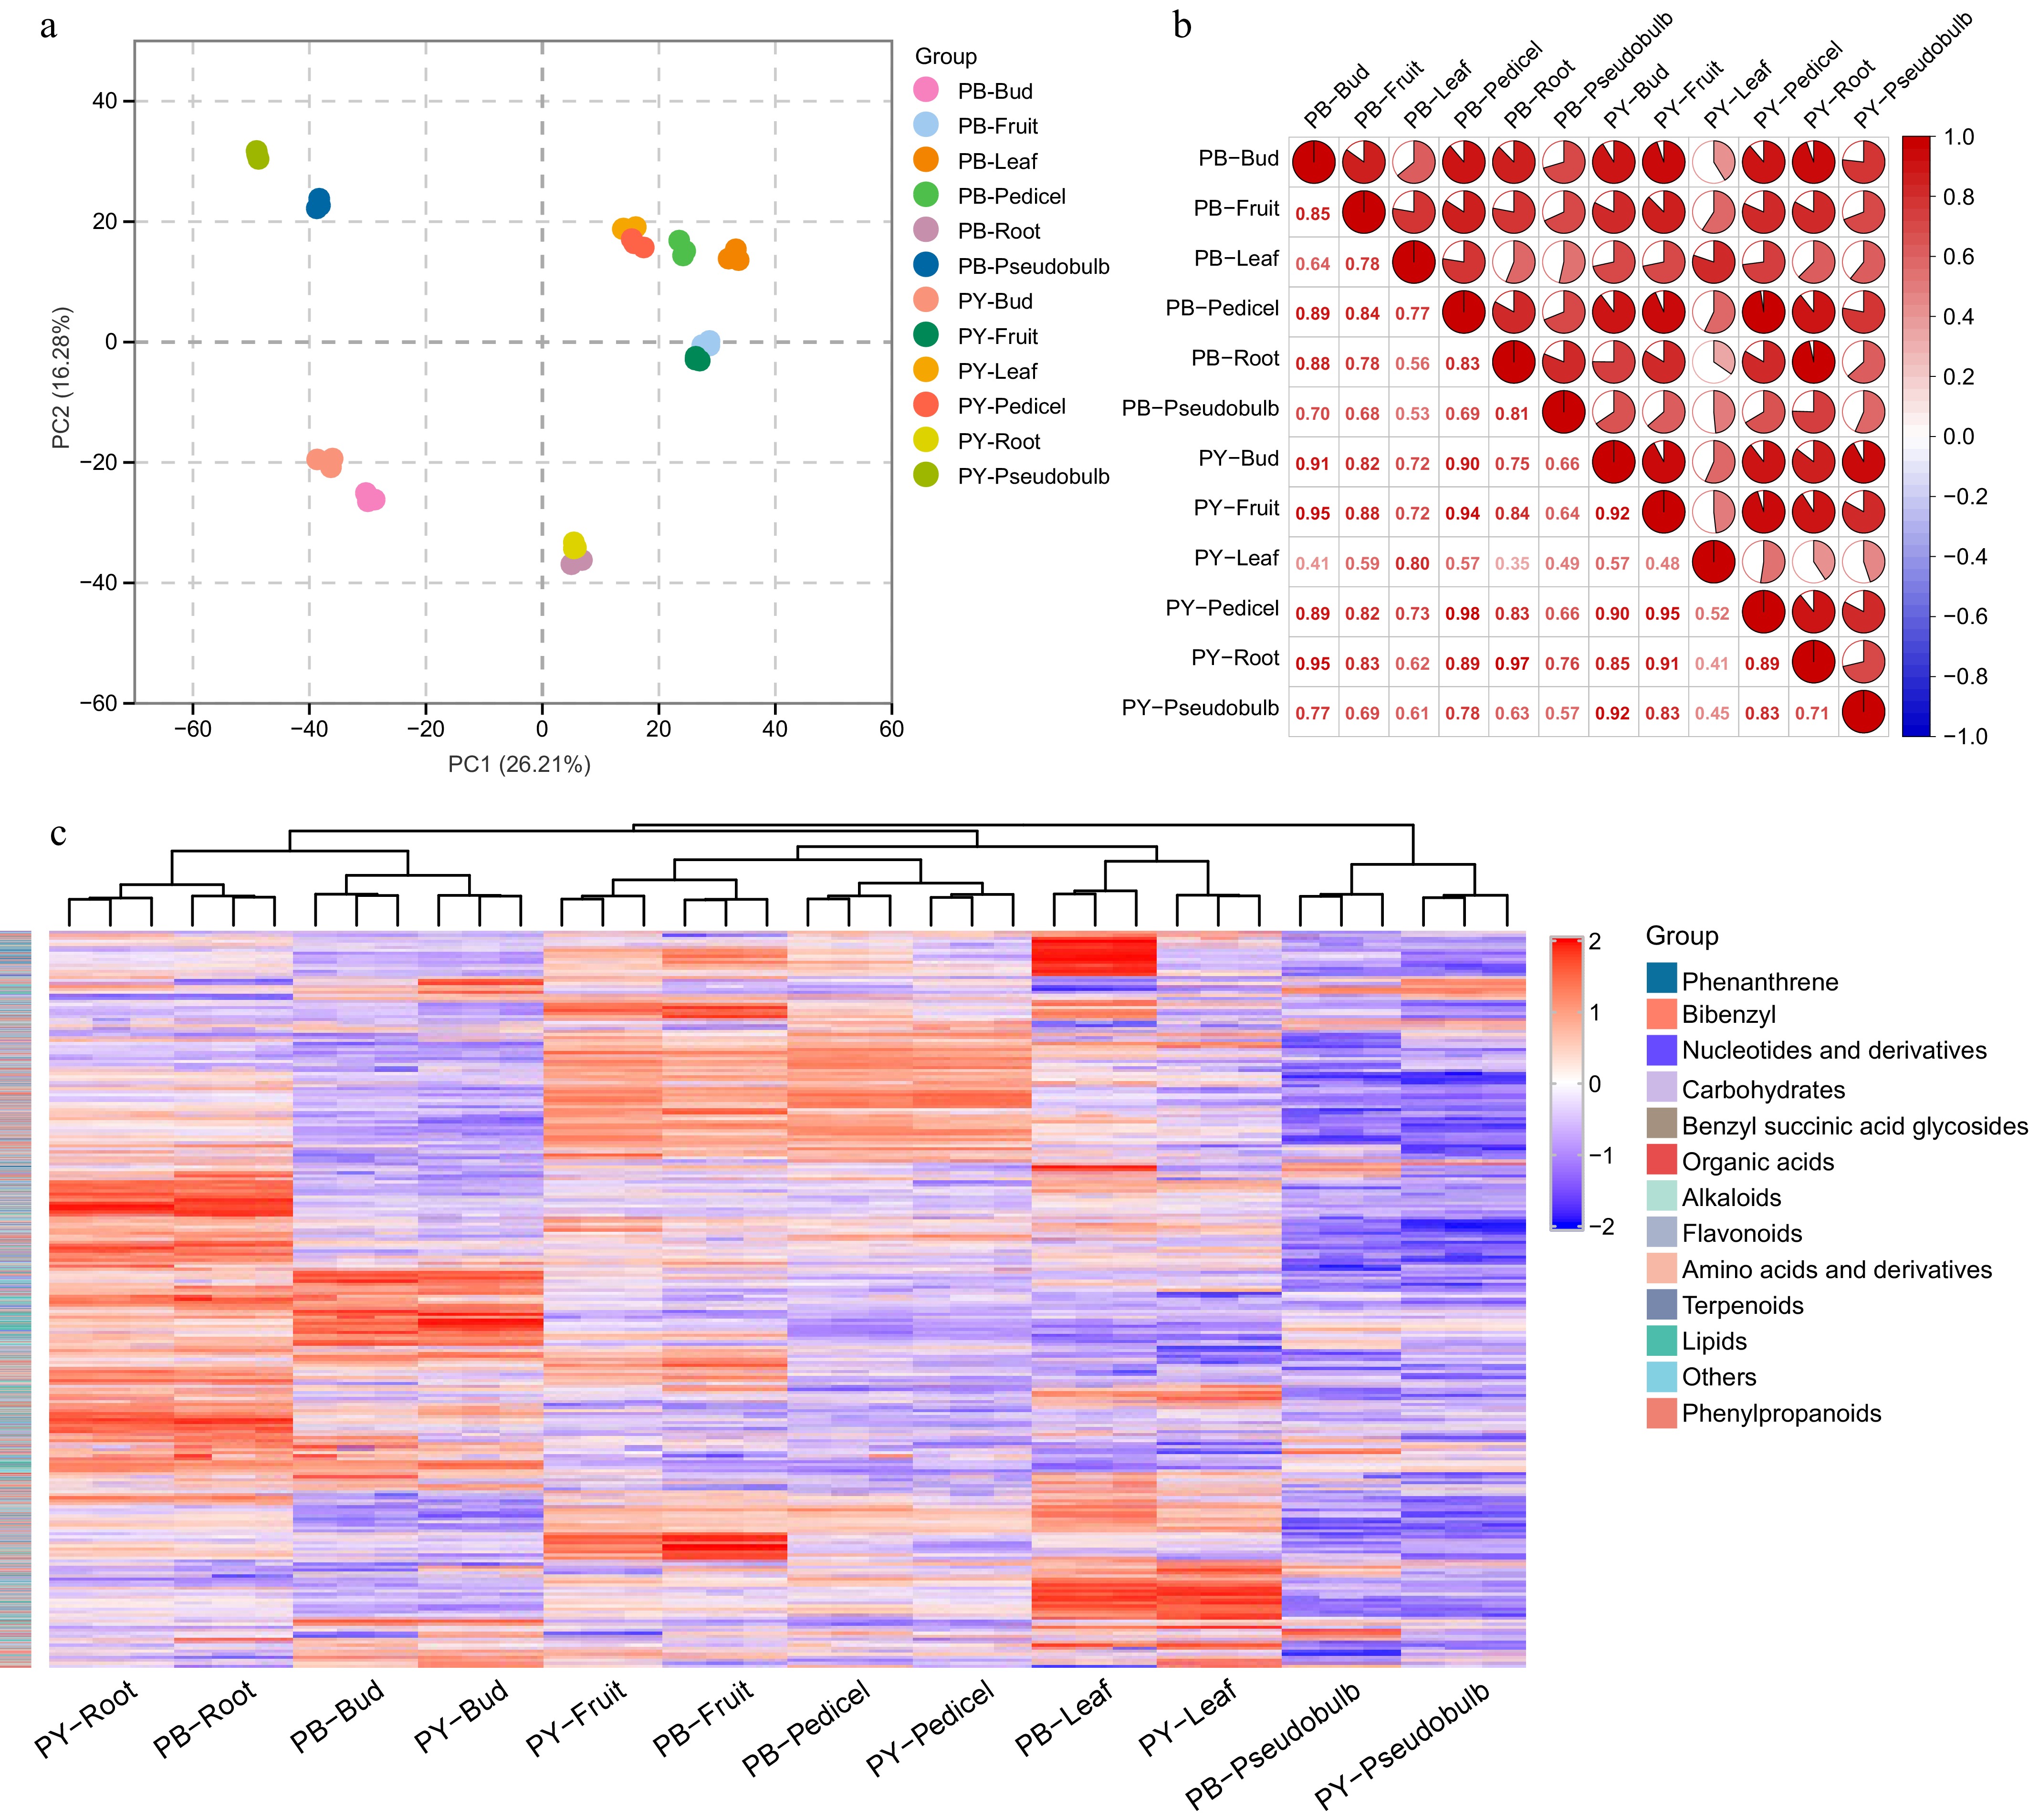
Figure 3.
Multivariate statistical analysis and correlation profiling of metabolites in the two Pleione species. (a) PCA score plot showing the metabolic discrimination among different tissues of P. bulbocodioides (PB) and P. yunnanensis (PY). Each point represents a biological replicate, with distinct colors indicating different tissue types. (b) Pearson correlation heatmap illustrating the pairwise correlations of metabolite profiles among all tissue samples from the two species. The color gradient represents correlation coefficients. (c) Hierarchical clustering heatmap displaying the relative abundance of all annotated metabolites across different tissues. The colored sidebar indicates metabolite classes.
Among the detected compounds, the three characteristic classes—benzyl succinic acid glycosides, bibenzyls, and phenanthrenes—were highly abundant in terms of response intensity and have well-documented pharmacological activities, including anti-tumor, anti-inflammatory, neuroprotective, and hepatoprotective effects[4,5,40,41]; these classes were therefore selected for focused analysis. The distribution of these three classes was further characterized at the individual compound level by constructing hierarchical clustering heatmaps for all detected benzyl succinic acid glycosides, bibenzyls, and phenanthrenes. Representative annotated compounds are shown in Fig. 4, and the complete heatmaps are presented in Supplementary Figs S3−S5. Benzyl succinic acid glycosides showed tissue-specific accumulation patterns (Fig. 4; Supplementary Fig. S3). Gymnoside XVIII, coelovirin C, gymnoside XVII, gymnoside XVIII isomer, and grammatophylloside B accumulated predominantly in leaves of P. yunnanensis, with lower levels also observed in leaves of P. bulbocodioides. Gymnoside VII, dactylorhin E, dactylorhin A, and gymnoside V showed higher abundance in buds of both species. Additionally, vandateroside II and loroglossin showed higher abundance specifically in the fruits of P. bulbocodioides, while militarine and 1,4-bis(4-O-β-D-glucopyranosylbenzyl) (2R)-2-benzylmalate showed higher abundance in roots of both species. Pseudobulbs and pedicels of both species showed low abundance of this compound class.
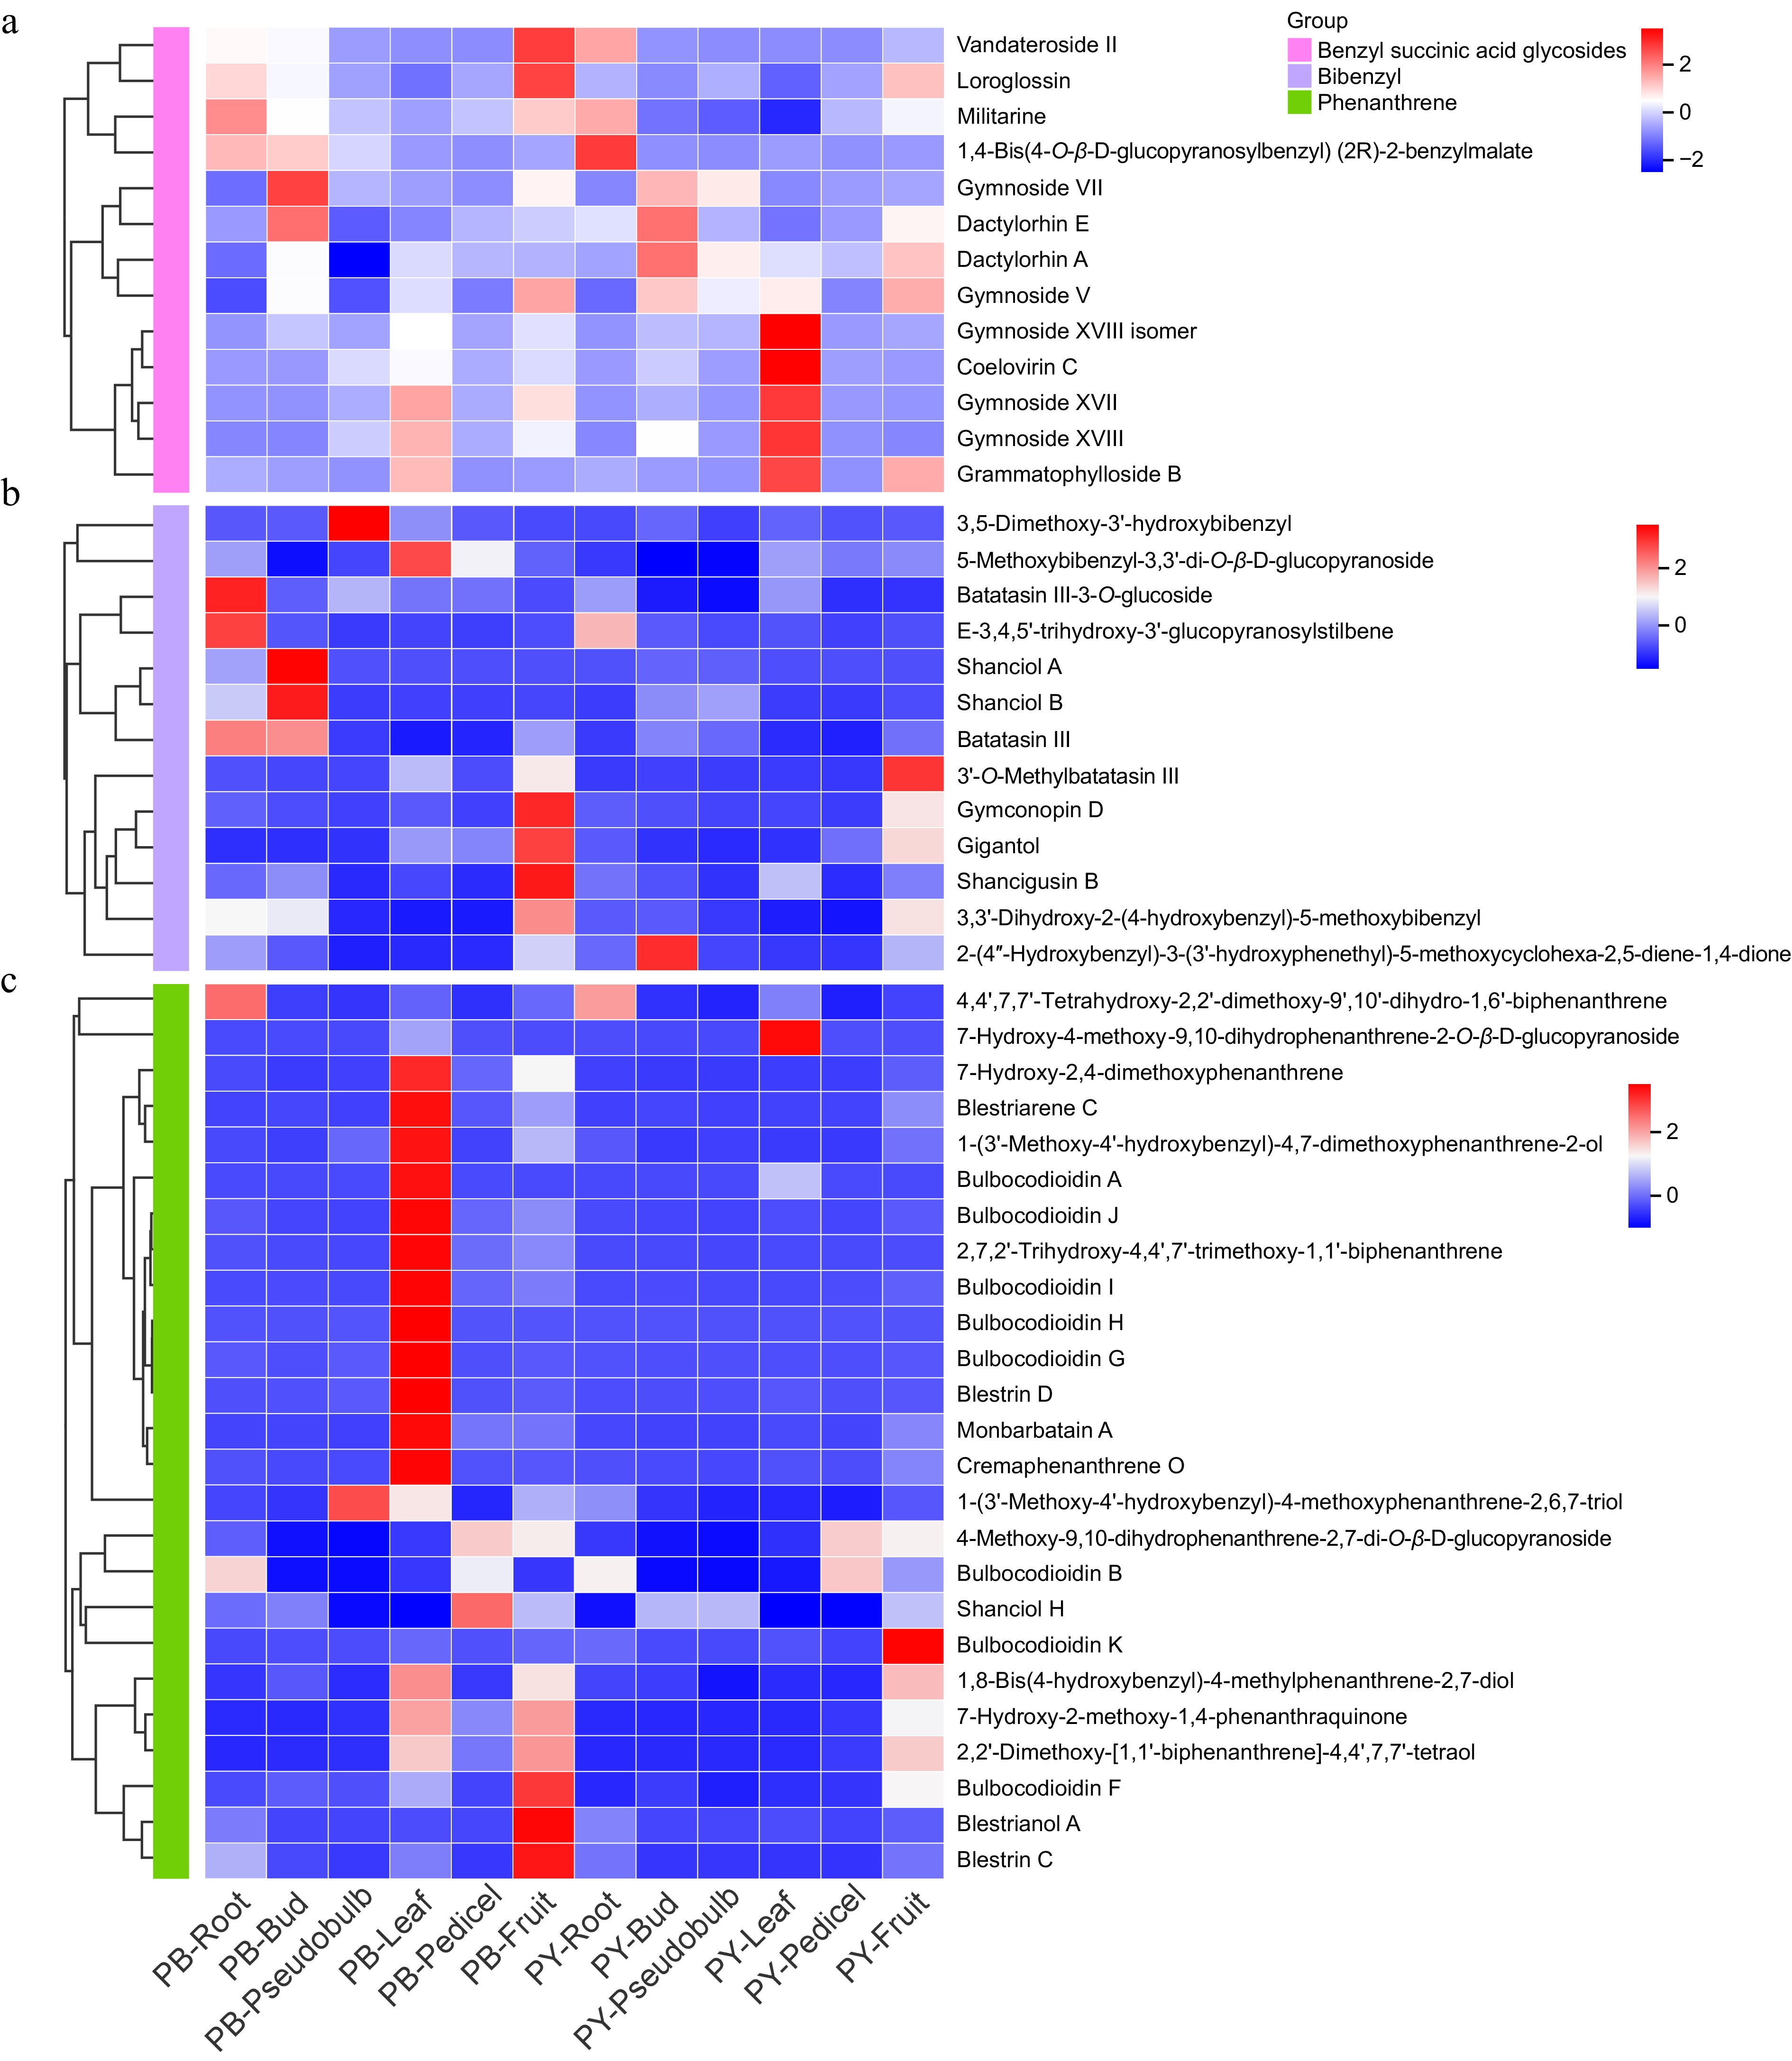
Figure 4.
Tissue-specific distribution of characteristic compounds in the two Pleione species. Hierarchical clustering heatmaps showing the relative abundance of (a) benzyl succinic acid glycosides, (b) bibenzyls, and (c) phenanthrenes across different tissues of P. bulbocodioides (PB) and P. yunnanensis (PY). Each row represents a metabolite, each column represents a tissue sample, and the color scale indicates normalized metabolite levels (red: high abundance; blue: low abundance).
Bibenzyls displayed two distinct tissue-specific accumulation patterns (Fig. 4b). 3'-O-methylbatatasin III, gymconopin D, gigantol, shancigusin B, 3,3'-dihydroxy-2-(4-hydroxybenzyl)-5-methoxybibenzyl, and 2-(4''-hydroxybenzyl)-3-(3'-hydroxyphenethyl)-5-methoxycyclohexa-2,5-diene-1,4-dione accumulated predominantly in fruits of P. bulbocodioides, with relatively high levels also detected in fruits of P. yunnanensis. In contrast, batatasin III-3-O-glucoside, E-3,4,5'-trihydroxy-3'-glucopyranosylstilbene, shanciol A, shanciol B, and batatasin III accumulated primarily in roots and buds of P. bulbocodioides, and were barely detectable in the corresponding tissues of P. yunnanensis, revealing an interspecific pattern. The complete bibenzyl heatmap (Supplementary Fig. S4) revealed a wide range of bibenzyl signals in leaves and fruit of P. bulbocodioides.
Phenanthrenes showed the most localized distribution specificity among the three classes (Fig. 4c; Supplementary Fig. S5). The majority of annotated phenanthrenes, including bulbocodioidin A, bulbocodioidin G, bulbocodioidin H, blestriarene C, and cremaphenanthrene O, showed higher abundance in leaves of P. bulbocodioides. A smaller proportion, such as blestriarene A, blestrin C, and bulbocodioidin K, accumulated in fruits of both species. In contrast, phenanthrenes were barely detectable in other tissues, and P. yunnanensis maintained low abundance across all tissues except fruits. The near absence of phenanthrenes in leaves of P. yunnanensis, despite their abundance in P. bulbocodioides leaves, suggests an interspecific difference in phenanthrene accumulation[42,43]. Whether this reflects transcriptional regulation, substrate availability, enzyme activity, transport, or post-translational modifications cannot be determined from metabolomic data alone and warrants further multi-omics investigation.
Benzyl succinic acid glycosides, bibenzyls, and phenanthrenes accumulated predominantly in the aerial parts of the two Pleione species, particularly in leaves and fruits. This pattern is consistent with the known role of photosynthetic tissues as major sites of phenylpropanoid biosynthesis, and raises the possibility that aerial organs contribute to the biosynthesis of these specialized metabolites in Pleione species[44,45]. Overall, these results indicated that tissue type was the primary factor shaping the metabolic profiles of the two Pleione species, with aerial and underground tissues displaying distinct chemical compositions. The three characteristic classes showed contrasting tissue-specific accumulation, and interspecific differences in the pseudobulb (the official medicinal part) were further examined for Q-marker screening.
Candidate Q-marker screening and spatial distribution in situ of pseudobulbs
-
Pseudobulbs are the main medicinal part of Shancigu, and differences in their bioactive compounds are important for botanical authentication and quality control. To characterize candidate Q-markers based on these bioactive classes, two complementary dimensions were integrated: statistical discrimination and multi-origin validation through OPLS-DA and common-garden experiments, and spatial localization through DESI-MSI within intact tissues.
OPLS-DA was performed on the metabolomic data of pseudobulbs, focusing on the three characteristic bioactive classes, to identify compounds with statistically significant differences for distinguishing the two Pleione species (Fig. 5a). The OPLS-DA score plot revealed a clear separation between P. bulbocodioides (PB) and P. yunnanensis (PY) along Component 1 (86%), suggesting metabolic divergence between the two species in their medicinal tissues. Of the 49 metabolites screened (Supplementary Table S4), 20 were significantly upregulated in PB, and 10 were significantly downregulated (fold change > 2 or < 0.5, p < 0.01), while 19 showed no significant difference (Fig. 5b, c). Among the eight representative compounds shown in the bar plots, three were significantly higher in PB pseudobulbs and five in PY pseudobulbs (Fig. 5d). In PB, three compounds reached significance: militarine, coelovirin C, and vandateroside II. In PY, five compounds were significantly higher: batatasin III, gymnoside V, dactylorhin A, dactylorhin E, and loroglossin. The markers with significantly higher abundance in PY were dominated by benzyl succinic acid glycosides (gymnoside V, dactylorhin A, dactylorhin E, and loroglossin) with particularly high response intensities, along with the bibenzyl batatasin III, indicating distinct metabolic profiles of pseudobulbs in the two species. The marked accumulation of these compounds in PY pseudobulbs suggested that they may serve as candidate markers for species discrimination in P. yunnanensis[40,41]. Conversely, the significant accumulation of militarine, vandateroside II, and coelovirin C in PB pseudobulbs provided a corresponding set of markers for P. bulbocodioides[40].
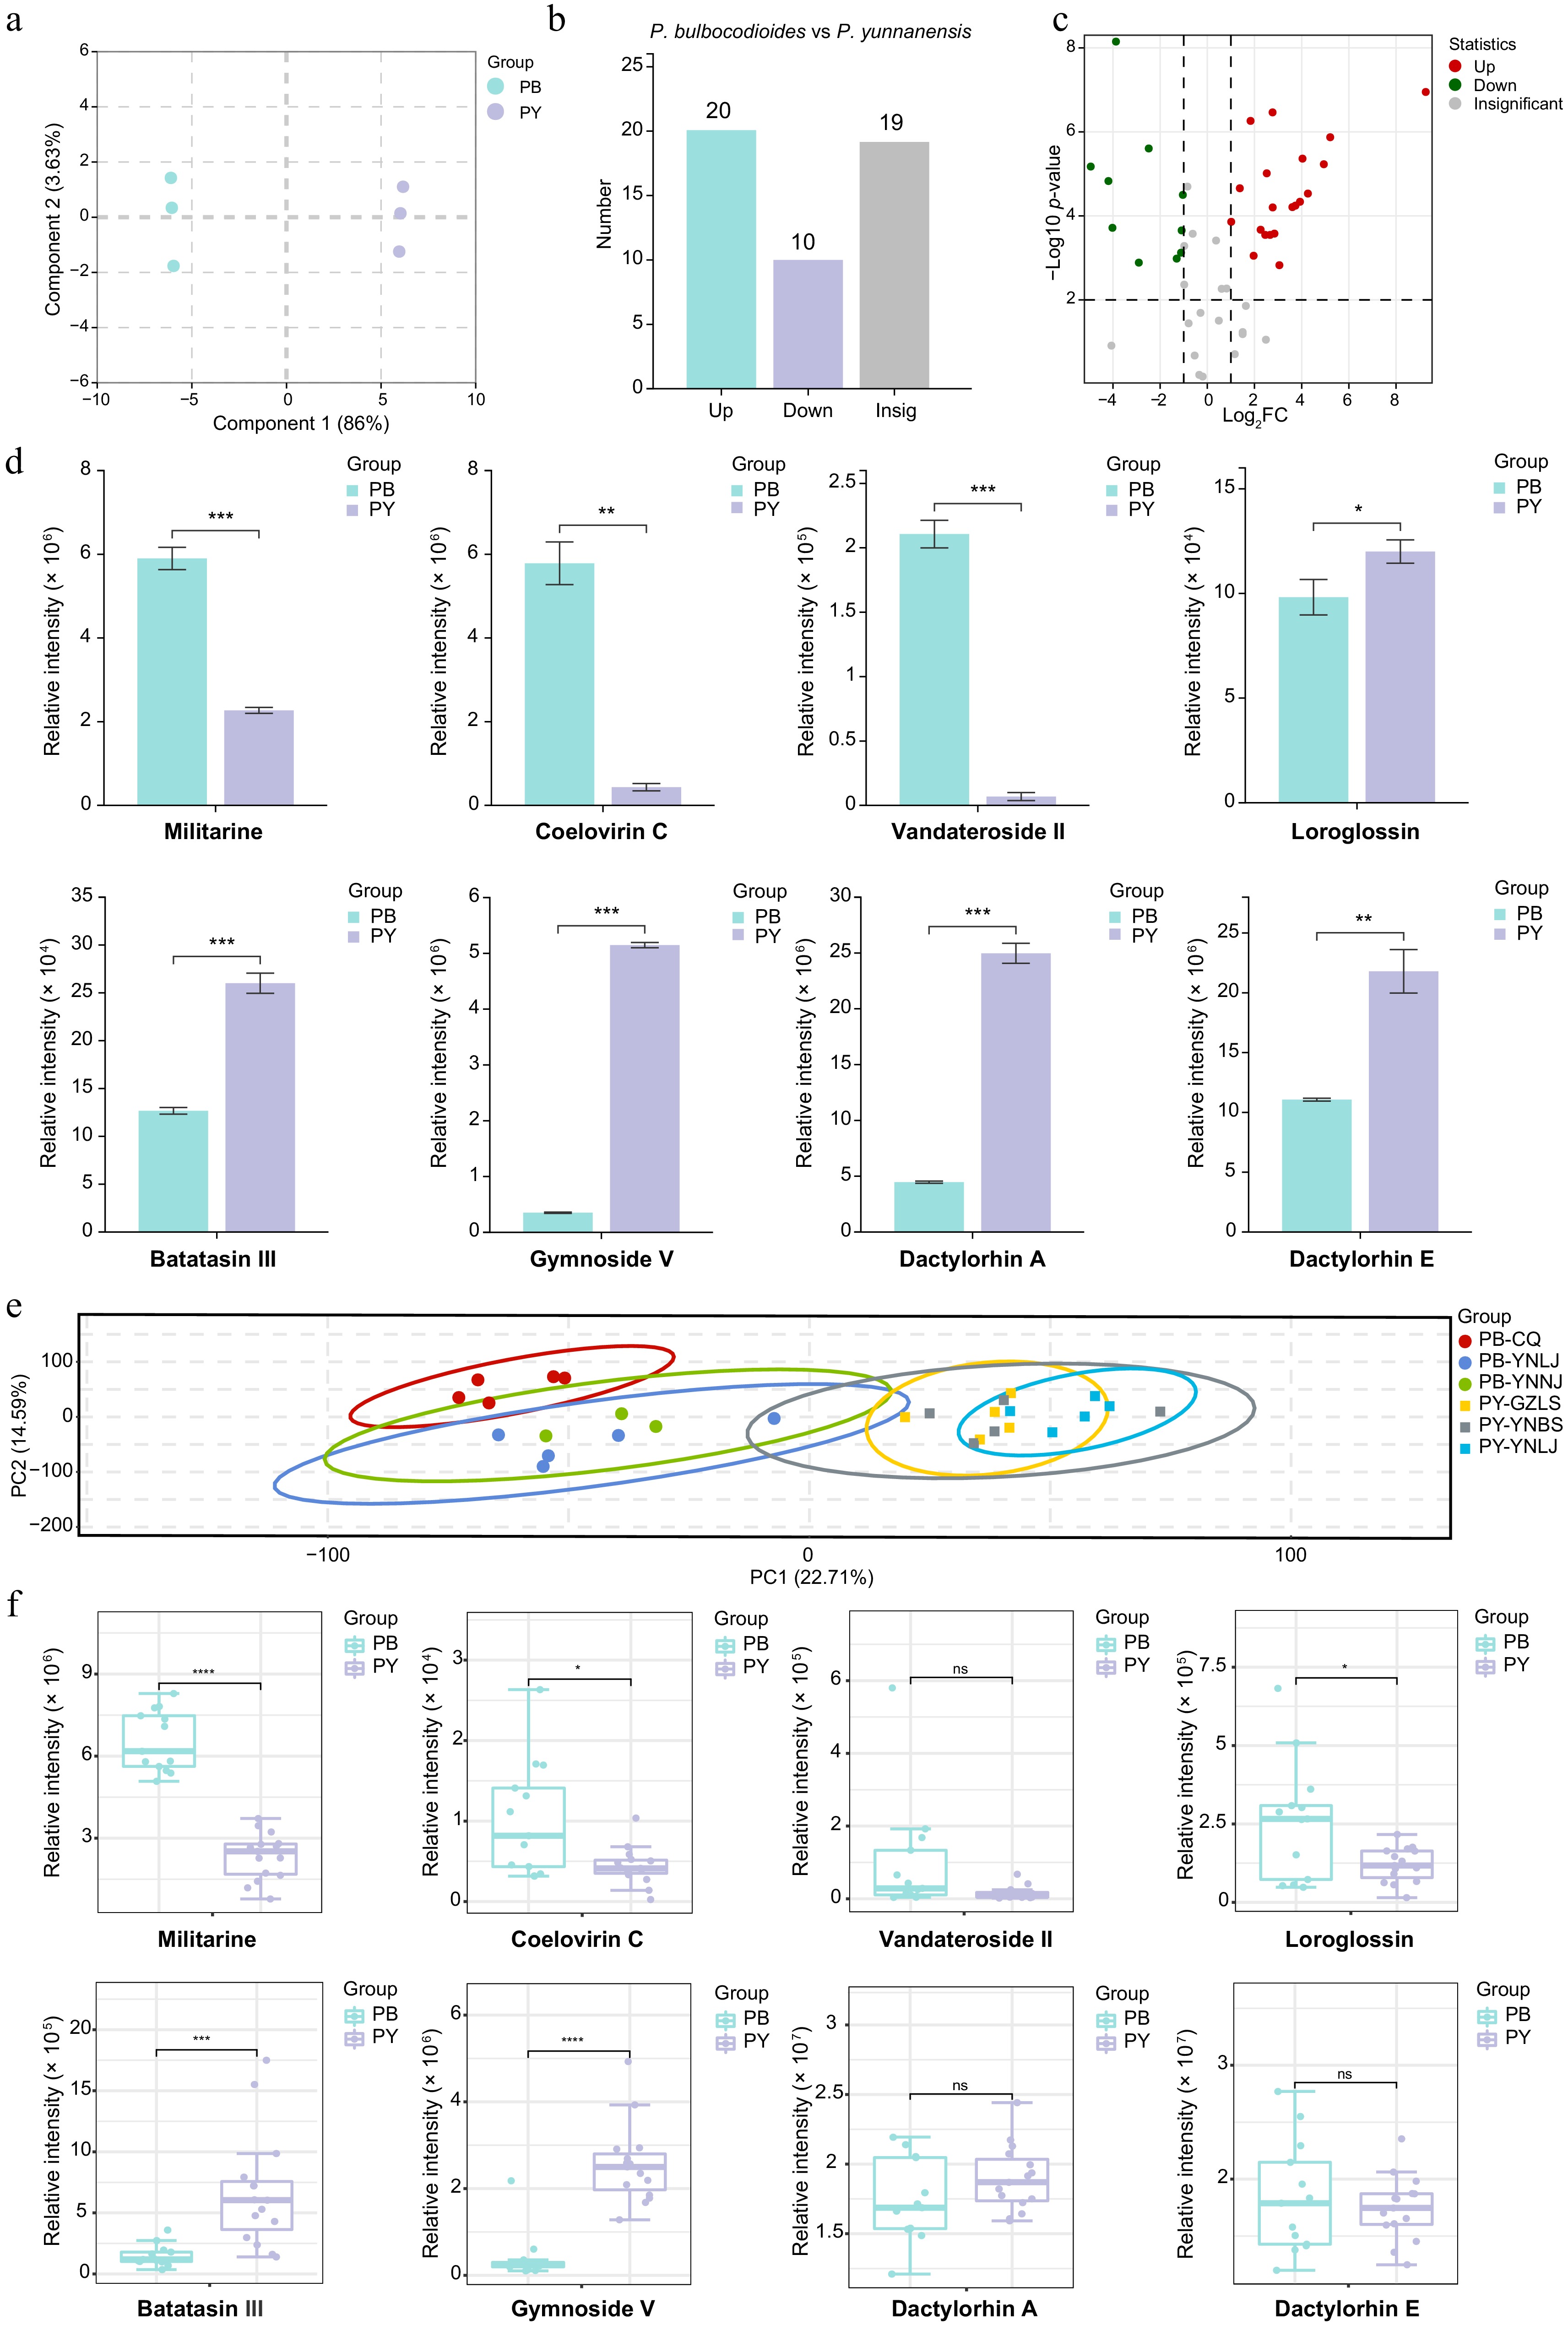
Figure 5.
Screening of potential Q-markers in pseudobulbs of the two Pleione species. (a) OPLS-DA score plot showing the separation between P. bulbocodioides (PB) and P. yunnanensis (PY) pseudobulb samples. (b) Bar plot of the numbers of significantly upregulated, downregulated, and insignificant metabolites. (c) Volcano plot of differentially accumulated metabolites (fold change > 2 or < 0.5; p < 0.01). Red, upregulated in PB; green, downregulated in PB; gray, non-significant. (d) Bar plots (mean ± SD) showing the relative abundances of eight representative differential metabolites in pseudobulbs. (e) PCA score plot of pseudobulb samples from six geographical origins. (f) Boxplots showing relative peak areas of eight characteristic compounds in pseudobulbs across six origins, comparing PB and PY. ns, not significant; * p < 0.05, ** p < 0.01, *** p < 0.001, **** p < 0.0001, comparing PB and PY.
To validate whether these interspecific differences were stable across geographical origins, we performed a multi-origin validation using samples from six geographical origins cultivated under uniform common-garden conditions at Kunming Botanical Garden. PCA of pseudobulb metabolomes showed a partial separation between PB and PY along PC1 (22.71%), with overlapping distributions reflecting within-species geographical variation (Fig. 5e). Among the eight characteristic compounds examined by boxplots, four retained significant interspecific differences across origins: militarine and coelovirin C were consistently higher in PB, while batatasin III and gymnoside V were consistently higher in PY (Fig. 5f; Supplementary Table S5). The remaining four compounds (vandateroside II, loroglossin, dactylorhin A, and dactylorhin E) showed no significant difference in the multi-origin dataset or showed a trend opposite to the Baoshan results. This indicates that their differential accumulation may be influenced by geographical origin and growing conditions rather than representing stable interspecific differences. Notably, the common-garden test indicates that the stable interspecific differences observed for militarine, coelovirin C, batatasin III, and gymnoside V are likely genetically based rather than solely environmentally driven. These four compounds represent more reliable candidate markers for species discrimination and quality evaluation of Shancigu. Beyond pseudobulbs, we also evaluated leaf samples from the same six geographical origins. Leaf metabolomes showed partial interspecific separation by PCA, and leaves accumulated high levels of various characteristic bioactive compounds (Supplementary Fig. S6; Supplementary Table S5), supporting further investigation of leaves as a potential supplementary resource for Shancigu.
DESI-MSI was employed to visualize whether these candidate Q-markers displayed tissue-specific localization within pseudobulb tissues. A total of 15 compounds, including benzyl succinic acid glycosides, bibenzyls, and phenanthrenes, were detected and visualized (Fig. 6), with 13 found in P. bulbocodioides and 9 in P. yunnanensis (Supplementary Table S6). The two species displayed distinct accumulation patterns. P. yunnanensis pseudobulbs were characterized by the predominant accumulation of high-molecular-weight benzyl succinic acid glycosides, among which gymnoside V (m/z 1017.3609 [M-H]−) and gymnoside XVII (m/z 1065.3668 [M-H]−) were mainly detected. In contrast, P. bulbocodioides exhibited a more diverse profile, with representatives from all three compound classes across a wide molecular weight range. The spatial distribution of these compounds revealed distinct tissue-specific patterns. In both species, the detected metabolites were primarily distributed in vascular bundles and the epidermis, and were barely detectable in the ground tissue. In P. bulbocodioides, compounds from all three classes accumulated in both regions, indicating a multi-compartment distribution. In P. yunnanensis, benzyl succinic acid glycosides accumulated predominantly in vascular bundles, consistent with their potential association with the vascular transport system[46]. The interspecific differences in distribution revealed by DESI-MSI were consistent with the differential accumulation observed in the metabolomic data. For instance, gymnoside V and gymnoside XVII were predominantly detected in P. yunnanensis pseudobulbs by DESI-MSI, supporting their higher abundance in this species[27]. One exception was batatasin III, which was enriched in P. yunnanensis by LC-MS but not detected in its pseudobulb sections. This likely reflects the sampling limitation of single sections rather than true absence, and future analyses with multiple replicates and serial sections will help confirm these patterns.
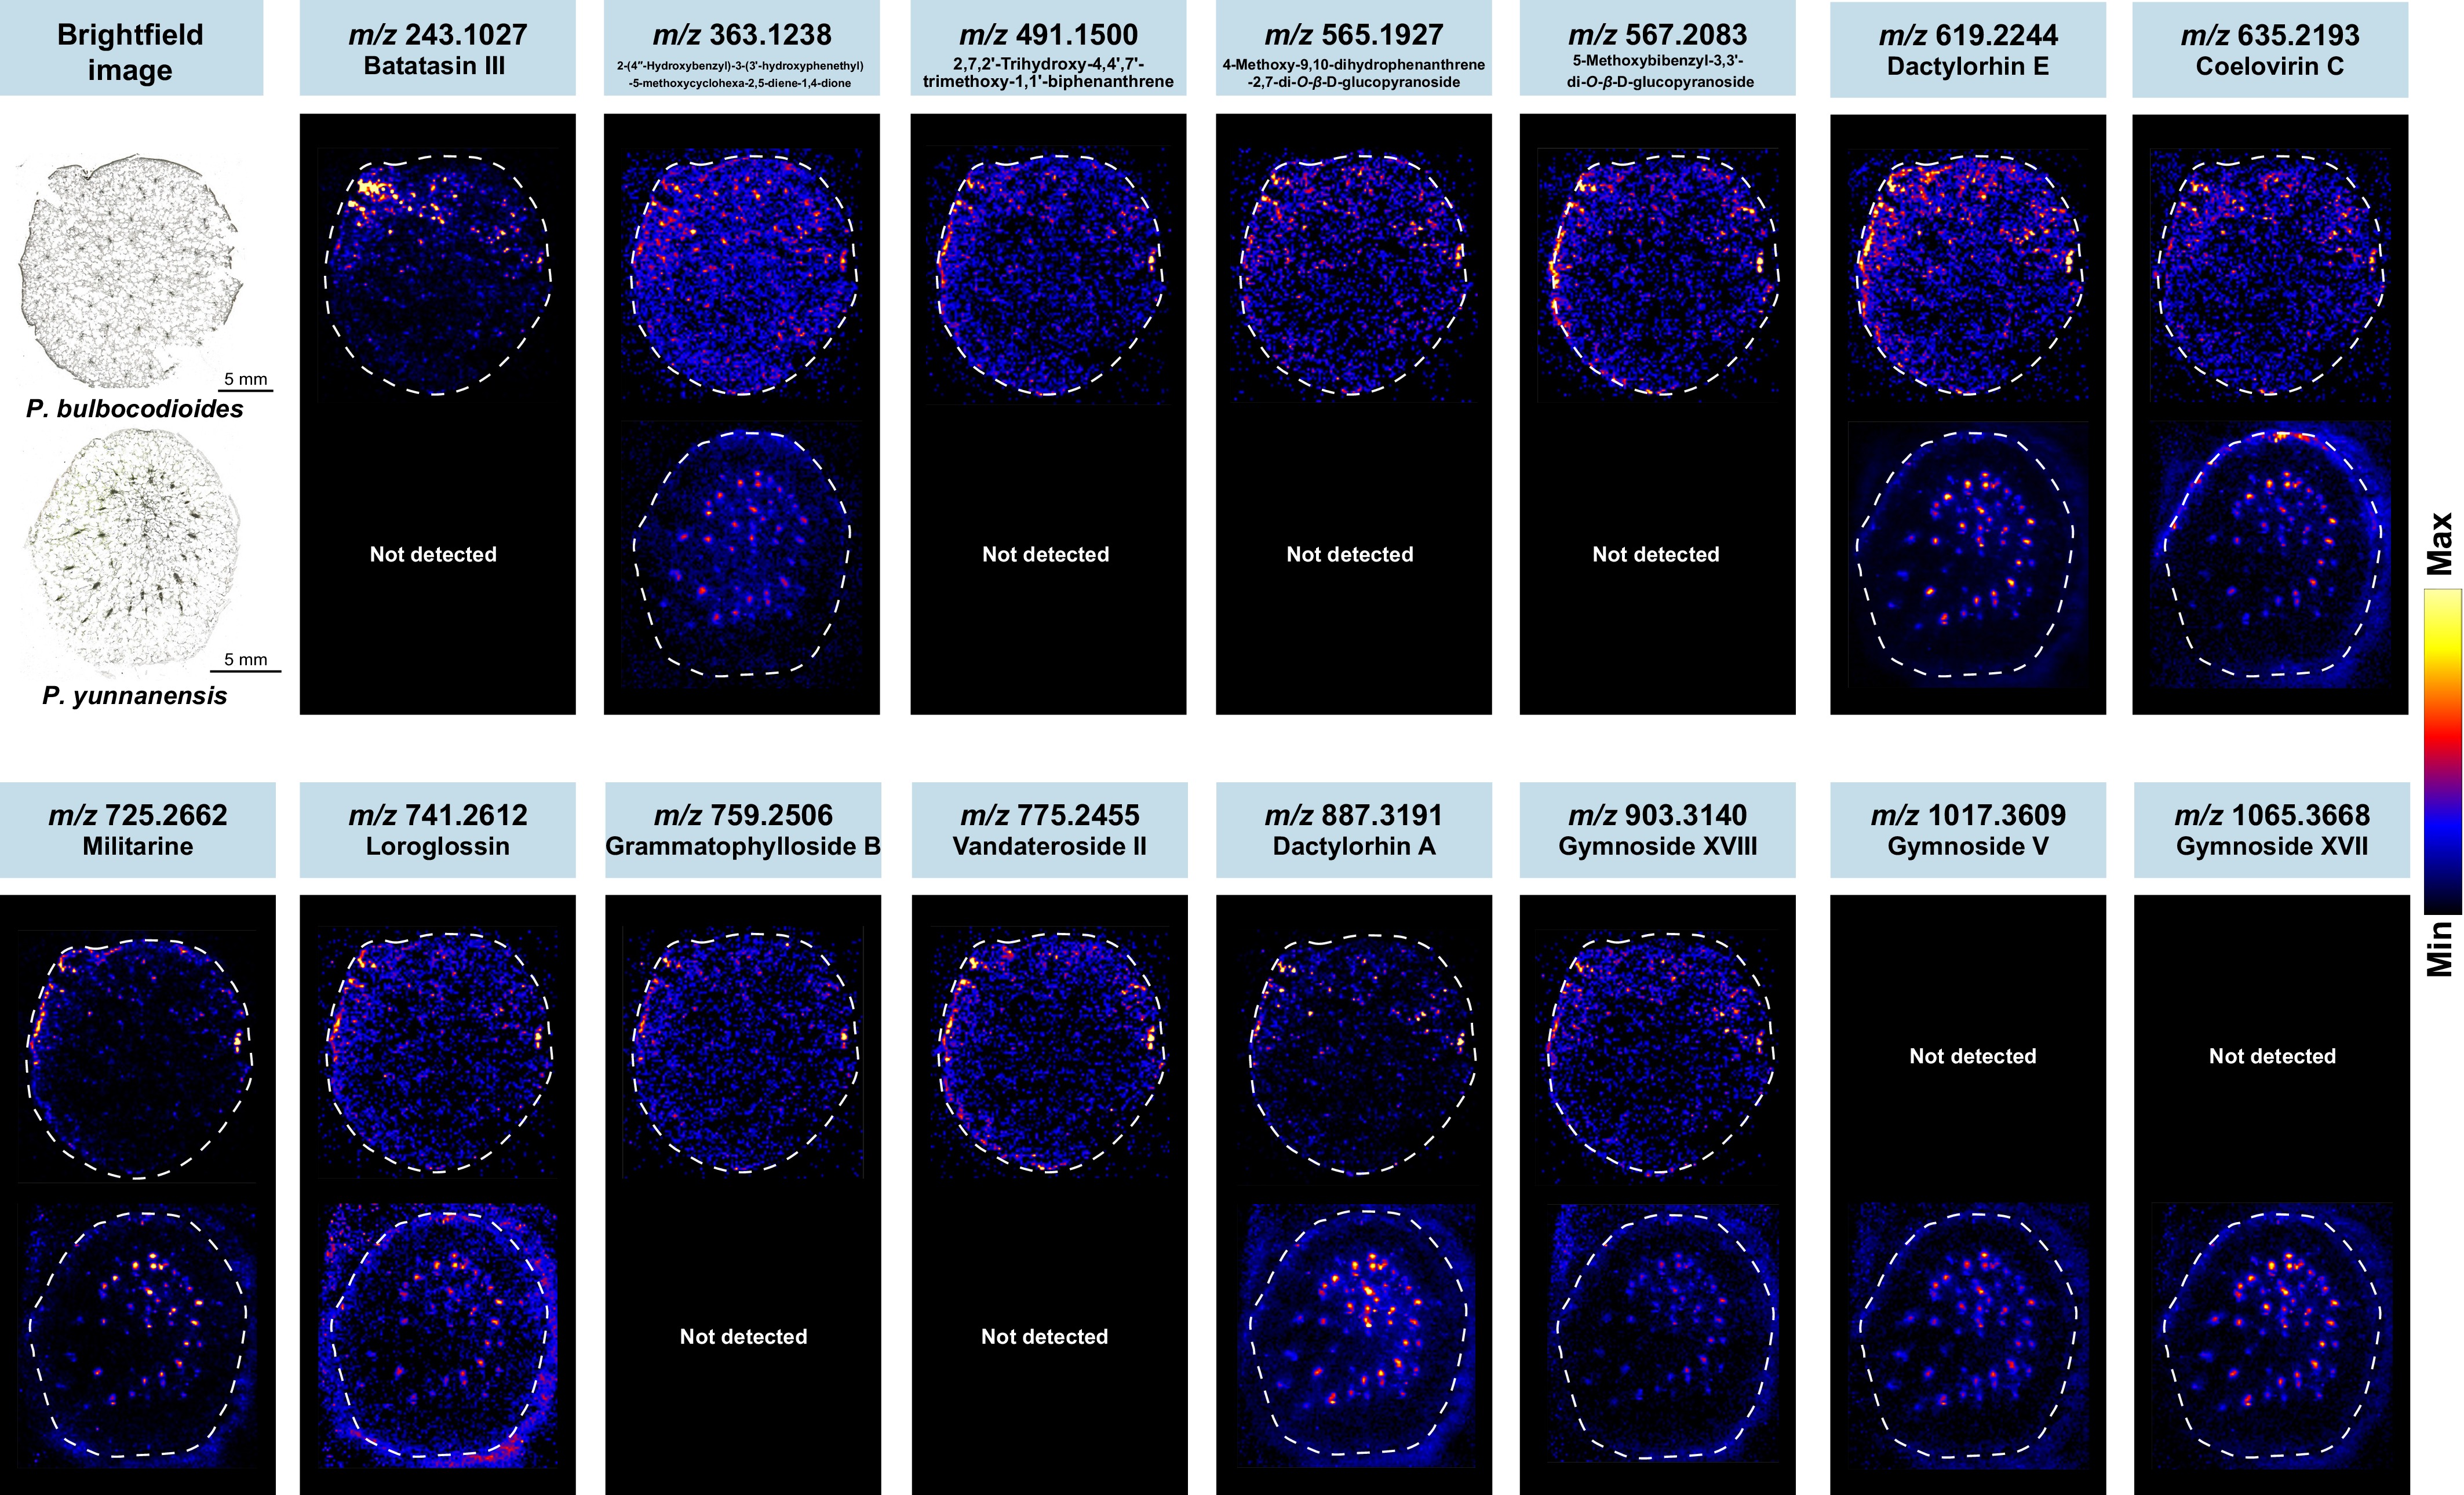
Figure 6.
DESI-MSI reveals spatial distribution patterns of bioactive compounds in pseudobulbs of the two Pleione species. Cross-sections of pseudobulbs from P. bulbocodioides and P. yunnanensis were analyzed by DESI-MSI in negative ion mode. Representative ion images show the spatial localization of three classes of bioactive compounds, including benzyl succinic acid glycosides, bibenzyls, and phenanthrenes.
These spatially resolved findings also have practical implications for quality control. Conventional quality assessment relies on homogenized tissue samples and assumes a uniform distribution of bioactive compounds, but the tissue-specific localization observed here means that measured marker content may vary with sampling procedure. This spatial heterogeneity highlights the need for standardized sampling protocols and positions DESI-MSI as a complementary tool for assessing sample representativeness[19,27,47]. Collectively, statistical discrimination, multi-origin validation, and spatial evidence provide convergent support for the candidate Q-markers. This integrated approach offers a useful strategy for Q-marker discovery and validation in medicinal plants, while the observed localization patterns provide a spatial reference for future biosynthetic and functional studies in Pleione species.
Spatial profiling of candidate Q-markers and medicinal tissue exploration in P. yunnanensis
-
To extend the spatial profiling of these characteristic bioactive compounds beyond pseudobulbs, DESI-MSI was employed to visualize their distribution across multiple tissues of P. yunnanensis. Given the notable accumulation of the three bioactive classes in non-pseudobulb tissues indicated by the untargeted metabolomic data, this analysis aimed to evaluate the potential medicinal value of these tissues. A total of 15 bioactive compounds were detected, predominantly benzyl succinic acid glycosides, along with three bibenzyls and two phenanthrenes (Fig. 7). The number of detected metabolites varied across tissues: pseudobulbs (8), buds (8), fruits (10), leaves (10), and roots (11) (Supplementary Table S7).
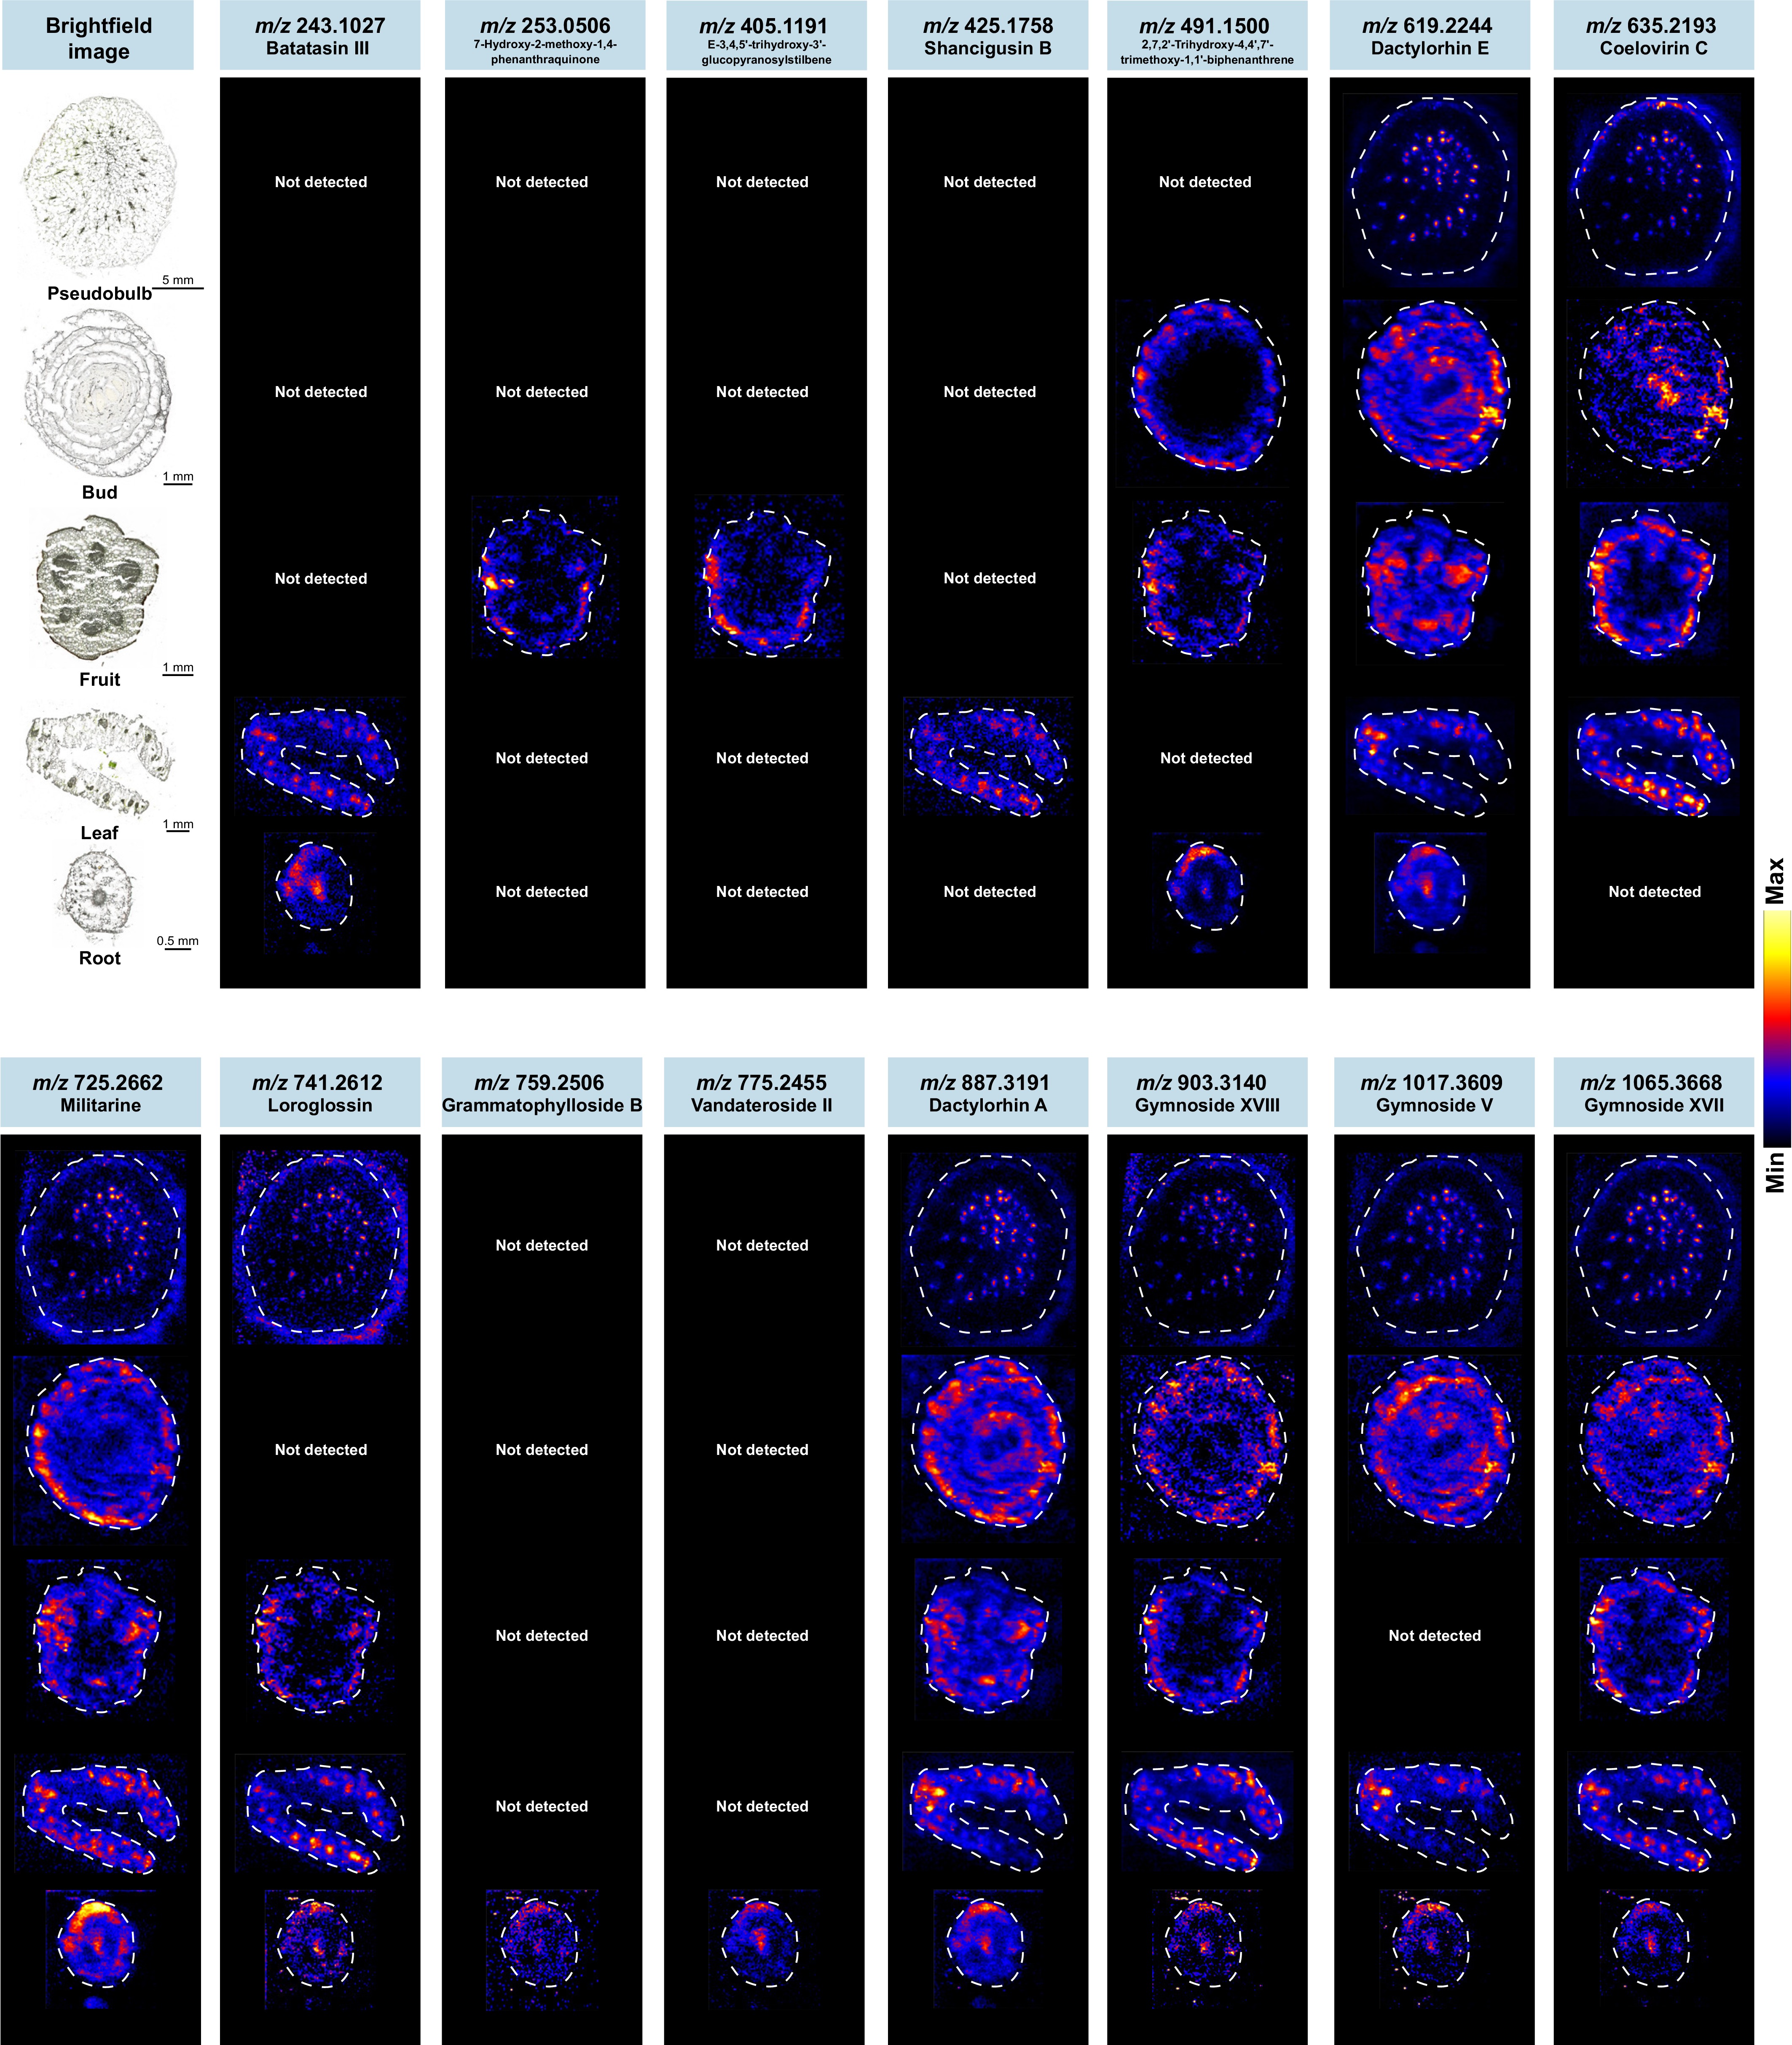
Figure 7.
DESI-MSI reveals tissue-specific spatial distribution of bioactive compounds in P. yunnanensis. Cross-sections of different tissues (pseudobulbs, buds, fruits, leaves and roots) from P. yunnanensis were prepared through frozen sectioning and analyzed by DESI-MSI in negative ion mode. Representative ion images show the spatial localization of three classes of bioactive compounds (including bibenzyls, phenanthrenes, and benzyl succinic acid glycosides).
Pseudobulbs and buds both showed the fewest detected compounds among all tissues, consistent with the results of the untargeted metabolomic data. In pseudobulbs, the metabolites were primarily detected in the vascular bundles, with individual compounds such as coelovirin C also accumulating in the epidermis. The metabolites detected in buds closely resembled those in pseudobulbs, dominated by benzyl succinic acid glycosides. In buds, most detected ion signals were localized to concentric layers of leaf primordia, from the outer to the inner whorls. By contrast, coelovirin C showed prominent accumulation in the meristematic tissue. A distinct spatial organization was also evident in fruits: compounds accumulated in the ovary wall region (e.g., coelovirin C, loroglossin, gymnoside XVIII, and gymnoside XVII) were clearly distinct from those predominantly localized in the seed region (e.g., dactylorhin E, militarine, and dactylorhin A). The placental region contained few detectable metabolites. These tissue-specific accumulation patterns suggest possible functional specialization of metabolites across different tissue types[48].
Distinct spatial patterns were also observed in leaves and roots. In leaves, two bibenzyls (batatasin III and shancigusin B) were highly concentrated in the vascular bundles, similar to benzyl succinic acid glycosides. In addition, coelovirin C and gymnoside XVIII also showed some accumulation in perivascular parenchyma regions. While most metabolites were distributed in the vascular bundles on both sides of the leaf, dactylorhin E, dactylorhin A, and gymnoside V displayed asymmetric distribution, with these compounds detected exclusively in the vascular bundles of one side. This asymmetric distribution within the vascular system suggests that the accumulation of these compounds may be influenced by localized factors within the leaf[49,50]. In roots, bioactive compounds were primarily distributed in the cortex and the pith-phloem region. Within the cortex, compounds such as militarine and dactylorhin A showed an asymmetric distribution. The accumulation in the pith-phloem region is consistent with vascular-associated transport. Overall, these characteristic bioactive compounds were distributed across multiple tissues of P. yunnanensis, each with a distinct spatial pattern. The spatial distribution of these compounds supports further investigation of non-pseudobulb tissues as potential supplementary resources. In addition, these tissue-specific distribution patterns may provide spatial clues for future studies on their biosynthesis.
Network pharmacology prediction of anti-inflammatory and neuroprotective potential of candidate Q-markers
-
To investigate whether these candidate Q-markers possess pharmacological activities consistent with the traditional efficacy of Shancigu, network pharmacology analysis was performed to predict their potential targets and pathways. Nine compounds were included in the network pharmacology analysis: the four pseudobulb candidates validated across geographical origins (militarine, coelovirin C, batatasin III, and gymnoside V), together with five additional representative compounds (3'-O-methylbatatasin III, shanciol H, dactylorhin E, gymnoside XVIII, and dactylorhin A) selected to represent the three major compound classes. Since inflammation is one of the well-documented pharmacological activities of Shancigu[41], inflammation-related targets were used to probe the pharmacological basis of these candidate Q-markers. Potential targets of these compounds were predicted using the SEA database, identifying 231 unique targets. From GeneCards, 1,744 inflammation-related targets were retrieved. The Venn diagram (Fig. 8a) identified 51 overlapping targets, which were considered potential therapeutic targets of the candidate Q-markers against inflammation (Supplementary Table S8).
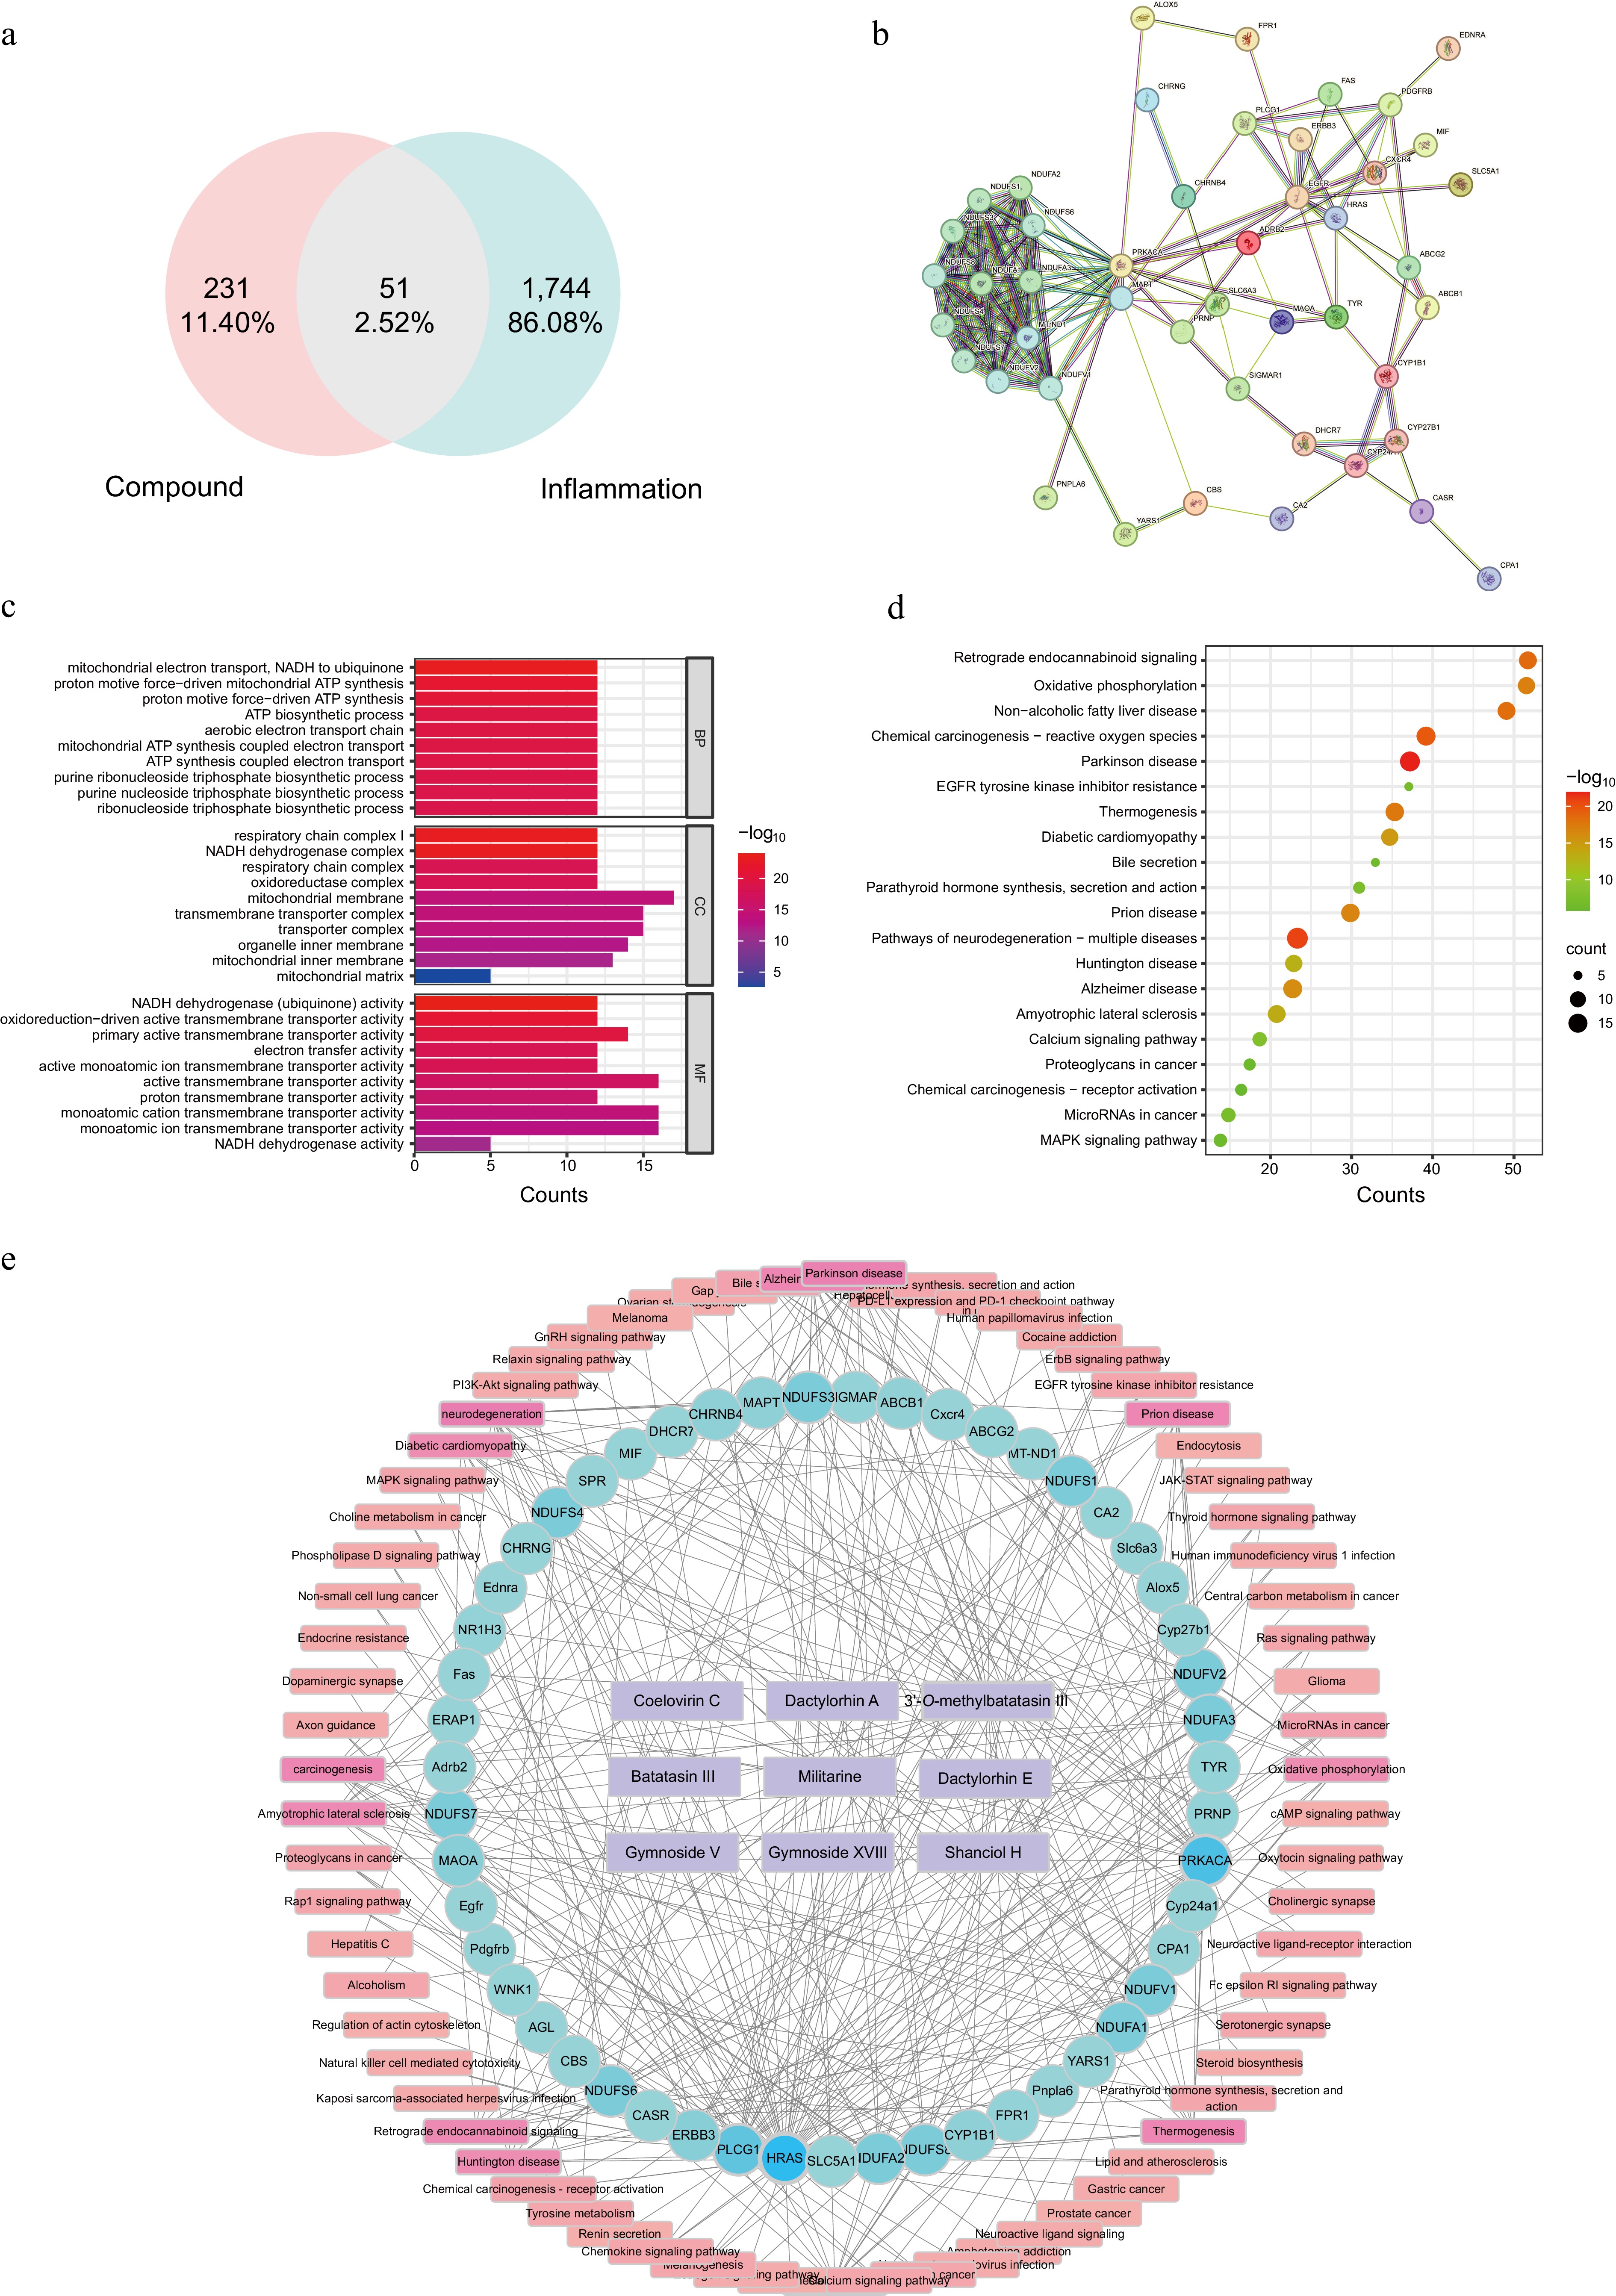
Figure 8.
Network pharmacology analysis of candidate Q-markers for Shancigu. (a) Venn diagram showing the intersection of compound-predicted targets and inflammation-related targets. (b) PPI network of common targets. (c) GO functional enrichment analysis. (d) KEGG pathway enrichment analysis. (e) Compound-target-pathway network.
The 51 overlapping targets were submitted to the STRING database (interaction score > 0.4) to construct a PPI network, which was visualized in STRING (Fig. 8b). Topological analysis based on degree identified several highly connected hub nodes, including PRKACA, MAPT, NDUFV1, MT-ND1, and NDUFA1, which may represent key targets. GO enrichment analysis (p < 0.05) revealed that biological process terms were primarily associated with mitochondrial electron transport (NADH to ubiquinone), proton motive force-driven ATP synthesis, and aerobic electron transport chain (Fig. 8c). Cellular component analysis showed significant enrichment in the mitochondrial inner membrane, respiratory chain complex, and transmembrane transporter complex, while molecular function terms were predominantly enriched in NADH dehydrogenase activity, electron transfer activity, and primary active transmembrane transporter activity. KEGG pathway enrichment analysis indicated that the potential anti-inflammatory targets were significantly enriched in Alzheimer's disease, pathways of neurodegeneration-multiple diseases, MAPK signaling pathway, oxidative phosphorylation, Parkinson disease, Huntington disease, amyotrophic lateral sclerosis, calcium signaling pathway, and chemical carcinogenesis-reactive oxygen species (Fig. 8d). A compound-target-pathway network was constructed using Cytoscape based on the predicted interactions among the nine selected compounds, the overlapping targets, and the enriched KEGG pathways (Fig. 8e). This integrated network visualized the multidimensional associations among the candidate compounds, their potential anti-inflammatory targets, and the enriched pathways. These associations provide a systematic overview of the predicted functional links through which these selected compounds may contribute to the anti-inflammatory effects of Shancigu.
Although the analysis in this study primarily focused on anti-inflammatory activity, GO enrichment analysis showed that the predicted targets were mainly involved in the mitochondrial electron transport chain, respiratory chain complex I, NADH dehydrogenase activity, oxidative phosphorylation-related ATP biosynthesis, and transmembrane ion transport. Consistent with the GO results, KEGG enrichment analysis revealed the involvement of multiple neurodegenerative disease-related pathways[51,52]. This enrichment may reflect the participation of shared molecular processes, including chronic inflammation, mitochondrial dysfunction, and oxidative stress. Given the role of neuroinflammation in the onset and progression of neurodegenerative diseases[53,54], these findings suggest that the candidate Q-markers may exert neuroprotective effects by modulating inflammation-related mechanisms. This inference is further supported by previous experimental evidence: militarine has been reported to ameliorate cognitive impairment, whereas batatasin III exhibits anti-inflammatory effects and has reported neuroprotective potential[3,6,55,56]. Together, these findings suggest a potential association between the candidate Q-markers and anti-inflammatory/neuroprotective pathways, consistent with the traditional use of Shancigu.
-
This study systematically compared the chemical composition and spatial distribution of two endangered Pleione species used as Shancigu. In pseudobulbs, four stable compounds with interspecific differences were identified and validated across multiple origins. Militarine and coelovirin C were significantly higher in P. bulbocodioides, and batatasin III and gymnoside V were significantly higher in P. yunnanensis; these four compounds represent stable candidate Q-markers, combining species specificity with documented pharmacological activity. DESI-MSI detected multiple bioactive compounds in pseudobulbs and revealed their enrichment in vascular bundles and the epidermis; this tissue-specific distribution indicates that pseudobulb sampling needs to be standardized to ensure consistent quality assessment. Extending DESI-MSI to multiple tissues of P. yunnanensis showed that these bioactive compounds also accumulate in other tissues. Network pharmacology analysis of representative compounds further suggested potential anti-inflammatory and neuroprotective effects. These findings provide a practical chemical basis for the botanical authentication and quality evaluation of Shancigu, and offer a spatial reference for the sustainable utilization of this medicinal resource.
-
The authors confirm their contributions to the paper as follows: study conception and design: Zhao Y, Lai J; methodology, investigation, and resources: Lai J; formal analysis and data curation: Lai J, Xu J; validation: Lai J, Wu J, Liu X; writing − original draft preparation: Lai J; writing − review and editing: Lai J, Xu J, Sun Y, Li N, Wu J, Zhao Y; supervision, project administration, and funding acquisition: Zhao Y. All authors reviewed the results and approved the final version of the manuscript.
-
The datasets generated and analyzed during the current study are available from the corresponding author upon reasonable request.
-
The authors declare that they have no conflict of interest.
-
accompanies this paper online at: https://doi.org/10.48130/mpb-0026-0019.
- Supplementary Table S1 Detailed information of metabolites annotated in the two Pleione species.
- Supplementary Table S2 Number of detected metabolites in different tissues in the two Pleione species.
- Supplementary Table S3 Detail of metabolites quantified in the two Pleione species.
- Supplementary Table S4 Detailed information of 49 differentially accumulated metabolites screened by OPLS-DA in pseudobulbs of the two Pleione species.
- Supplementary Table S5 Detailed information of characteristic compounds in pseudobulbs and leaves of two Pleione species across six geographical origins.
- Supplementary Table S6 Detailed information of characteristic compounds visualized by DESI-MSI in pseudobulbs of the two Pleione species.
- Supplementary Table S7 Detailed information of characteristic compounds detected by DESI-MSI in different tissues (pseudobulbs, buds, fruits, leaves, and roots) of P. yunnanensis.
- Supplementary Table S8 Detailed information of 51 related target proteins.
- Supplementary Fig. S1 Global feature-based molecular network of all detected metabolites in the two Pleione species.
- Supplementary Fig. S2 Three-dimensional PCA score plot of metabolite profiles from different tissues of P. bulbocodioides (PB) and P. yunnanensis (PY).
- Supplementary Fig. S3 Heatmap of all detected benzyl succinic acid glycosides across different tissues of the two Pleione species.
- Supplementary Fig. S4 Heatmap of all detected bibenzyls across different tissues of the two Pleione species.
- Supplementary Fig. S5 Heatmap of all detected phenanthrenes across different tissues of the two Pleione species.
- Supplementary Fig. S6 PCA score plot of leaf metabolite profiles and relative accumulation of characteristic compounds in leaves of the two Pleione species across six geographical origins.
- Copyright: © 2026 by the author(s). Published by Maximum Academic Press, Fayetteville, GA. This article is an open access article distributed under Creative Commons Attribution License (CC BY 4.0), visit https://creativecommons.org/licenses/by/4.0/.
-
About this article
Cite this article
Lai J, Xu JA, Sun YK, Liu XY, Li N, et al. 2026. Untargeted metabolomics and mass spectrometry imaging reveal metabolite spatial distribution and candidate Q-markers in Shancigu (Pleione bulbocodioides and P. yunnanensis, Orchidaceae). Medicinal Plant Biology 5: e024 doi: 10.48130/mpb-0026-0019 

Untargeted metabolomics and mass spectrometry imaging reveal metabolite spatial distribution and candidate Q-markers in Shancigu (Pleione bulbocodioides and P. yunnanensis, Orchidaceae)
- Received: 01 July 2026
- Revised: 11 September 2026
- Accepted: 20 September 2026
- Published online: 15 October 2026
Abstract: Shancigu is a traditional Chinese medicinal material derived from the dried pseudobulbs of three orchid species, including Pleione bulbocodioides and Pleione yunnanensis. These two Pleione species are traded under the commercial name 'Bingqiuzi' and are often not distinguished in the market, yet their chemical profiles have not been systematically characterized. This study combined untargeted metabolomics with molecular networking and mass spectrometry imaging to map the spatial distribution of metabolites across multiple tissues, and further screened candidate quality markers (Q-markers). A total of 3,216 metabolites were annotated, including 107 benzyl succinic acid glycosides, 78 bibenzyls, and 56 phenanthrenes, providing a comprehensive chemical characterization of these species. Metabolomic data showed a clear separation between aerial and underground tissues, with tissue type rather than species driving metabolic variation. In pseudobulbs, several compounds that differentially accumulated between the two species were proposed as candidate Q-markers, including militarine, batatasin III, coelovirin C, and gymnoside V. Desorption electrospray ionization mass spectrometry imaging (DESI-MSI) analysis of pseudobulb frozen sections detected 15 compounds in situ, with 13 found in P. bulbocodioides and nine in P. yunnanensis, revealing their distinct spatial distribution patterns. Furthermore, multi-tissue DESI-MSI of P. yunnanensis mapped 15 compounds across five tissues, showing characteristic tissue-specific localization patterns. Network pharmacology suggested that these candidate Q-markers may exert anti-inflammatory and neuroprotective effects. This integrated approach characterized the chemical diversity and spatial heterogeneity of bioactive compounds in these two endangered Pleione medicinal plants. These findings provide a chemical foundation for the botanical authentication and quality evaluation of Shancigu.