-
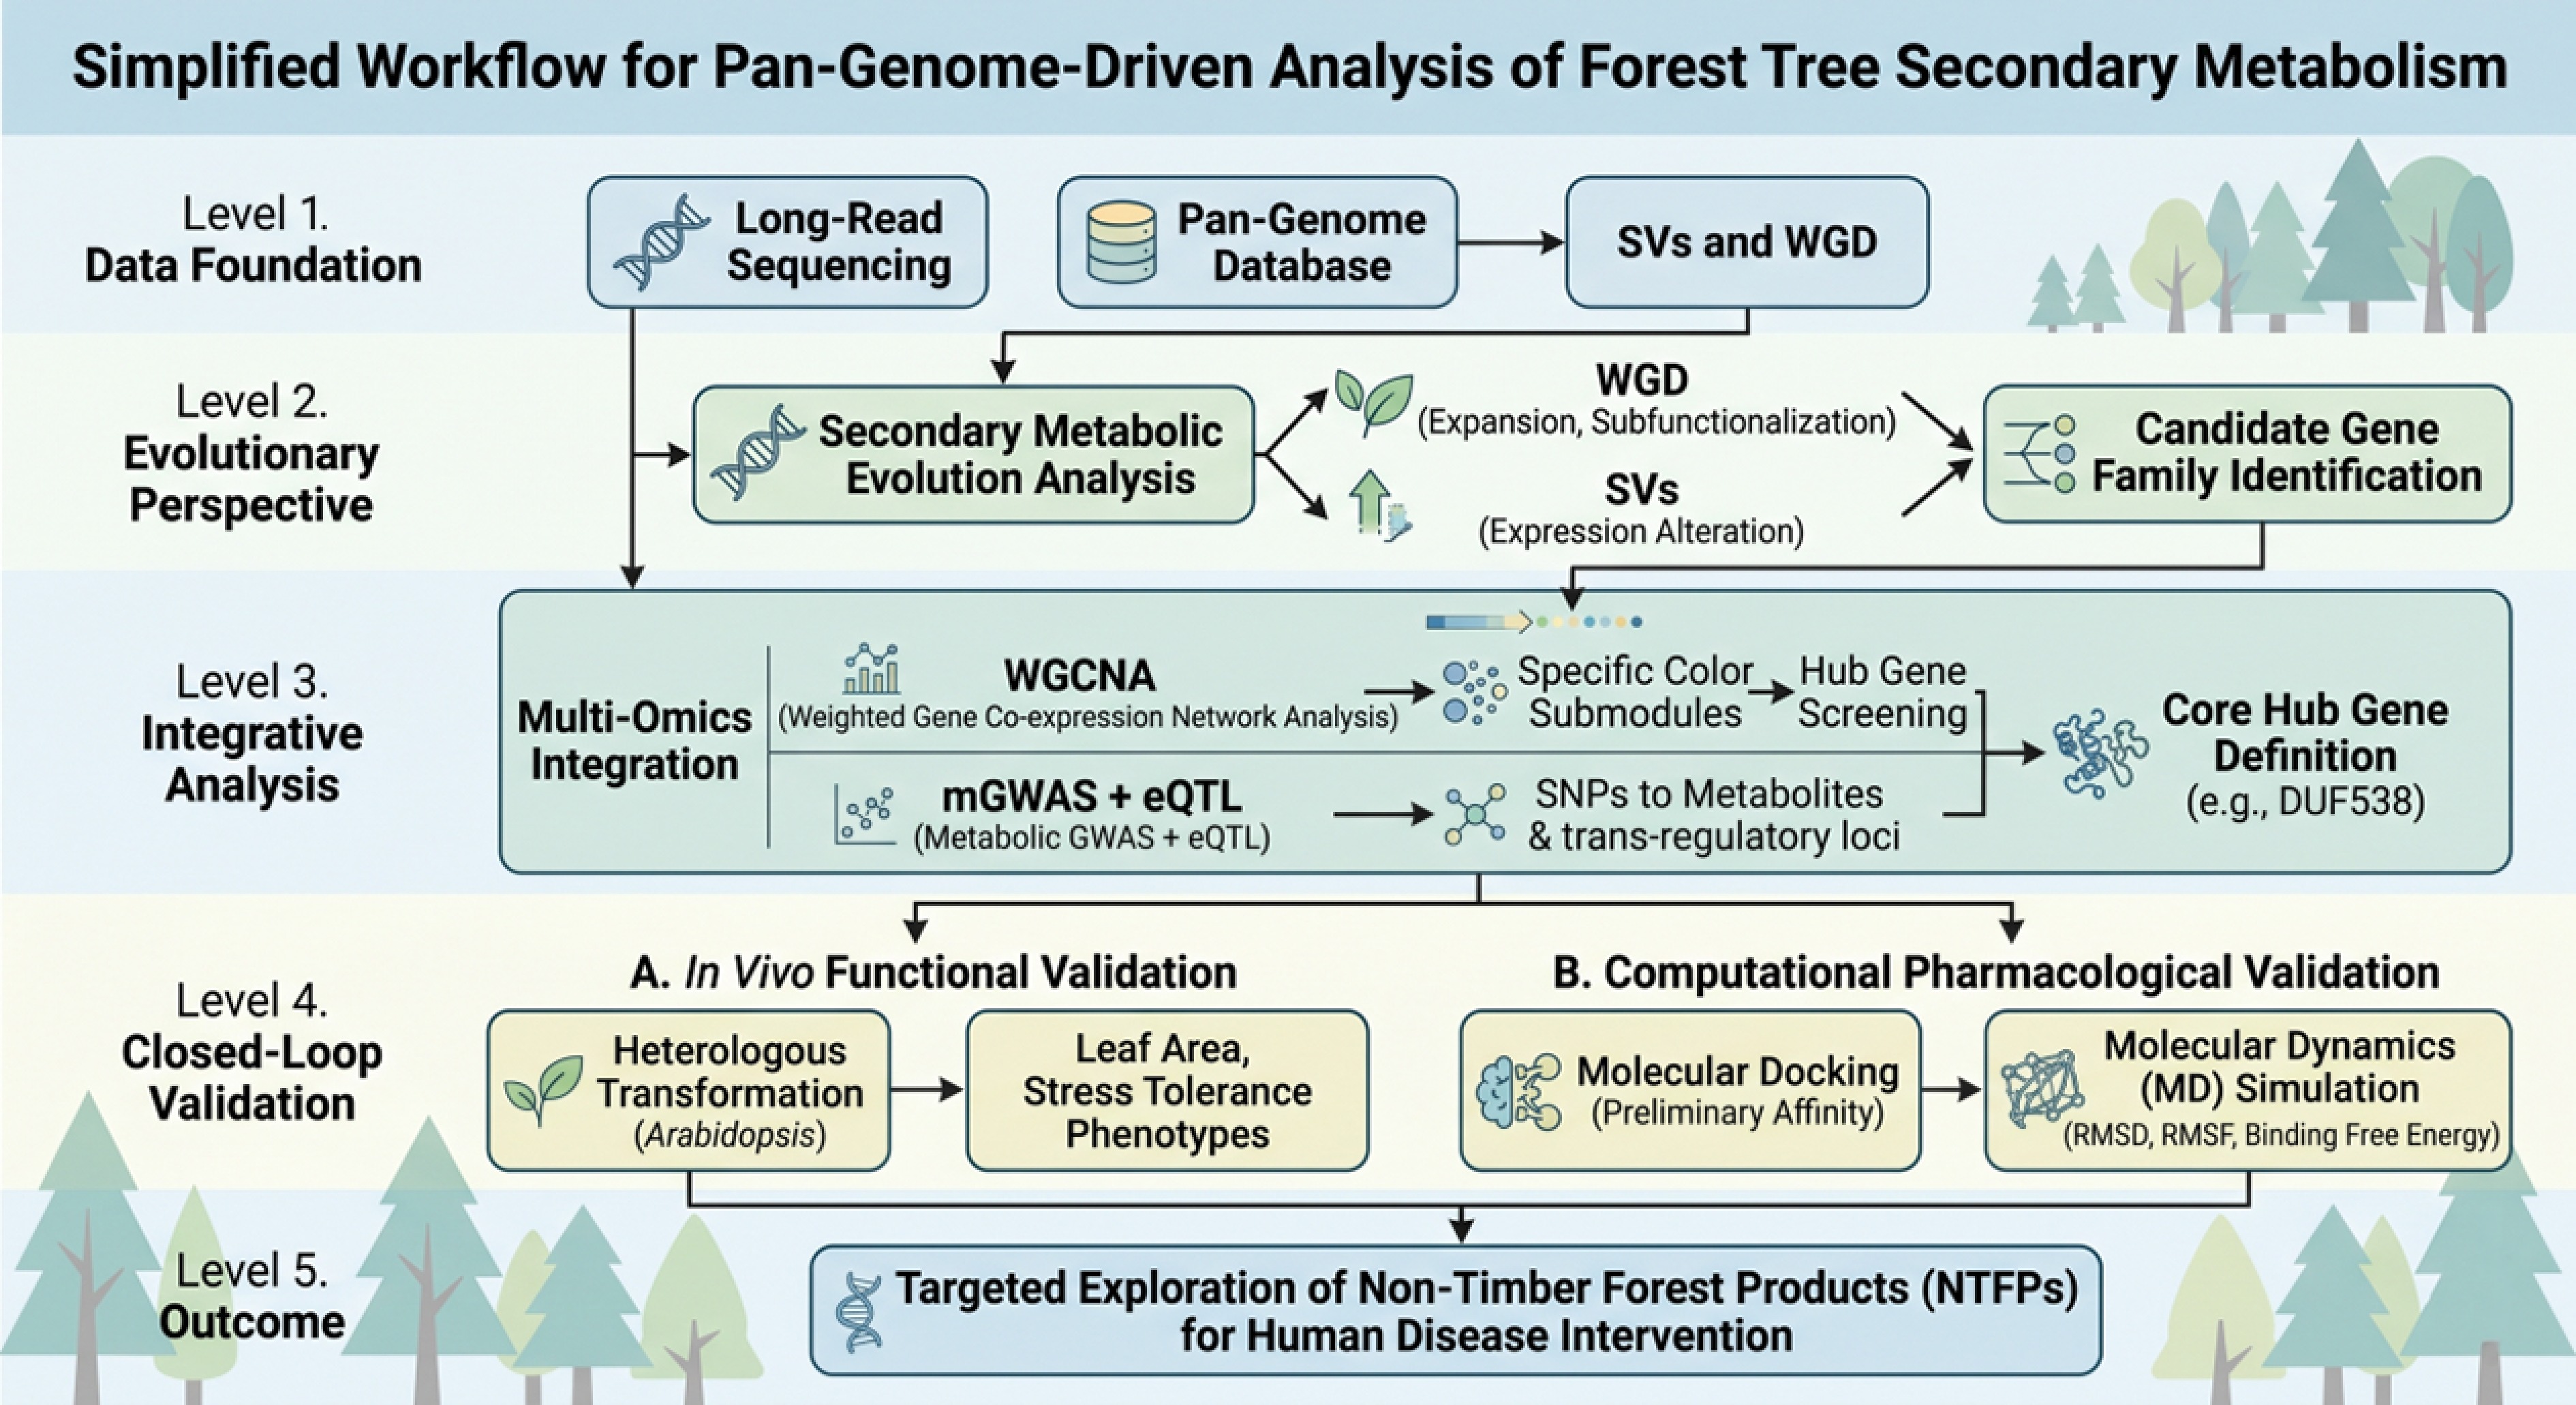
Figure 1.
Schematic diagram of the overall workflow for a pan-genome-driven analysis of secondary metabolism in forest trees. The diagram illustrates the complete technical workflow from pan-genomic data resources, evolutionary analysis, multi-omics integrative analysis, and closed-loop validation to natural product exploitation.
-
Species Omics type Core scientific question Key findings Limitations of the study Ref. Pseudocydonia sinensis PacBio gapless genome Impacts of WGD on the phenylpropanoid pathway evolution Maleae-specific WGD drives expansion of phenylpropanoid and flavonoid gene families Only one individual genome; lacks population-level variant information [16] Populus euphratica Pan-genome + transcriptome How SVs regulate stress-responsive metabolic pathways SVs at PYL loci alter gene transcription and modulate drought responses No combined metabolomic analysis; secondary metabolic–phenotype associations are absent [17] Populus tomentosa Pan-genome + mGWAS + eQTL Genetic basis for coumarin metabolism DUF538 is identified as a core gene for coumarin biosynthesis Limited population sample size; no pharmacological translation investigation [18] Table 1.
Representative pan-genome–multi-omics case studies for secondary metabolism research in forest trees.
-
Tree species Secondary metabolite Biosynthetic pathway Pharmacological target Evidence level Ref. Taxus brevifolia Paclitaxel Terpenoid biosynthetic pathway Tubulin In vitro + in vivo experimental evidence [31] Camptotheca acuminata Camptothecin Terpenoid–indole–alkaloid pathway Topoisomerase I In vitro + in vivo experimental evidence [32] Betula platyphylla Betulinic acid Triterpenoid biosynthetic pathway COX-2, 5-LOX In vitro cellular assays; computational simulations [33] Populus spp. Flavonoids Flavonoid biosynthetic pathway PPARγ, α-glucosidase Computational prediction only;
experimental validations pending[34] Table 2.
Representative bioactive secondary metabolites derived from forest tree species.
-
Workflow Input Output Advantages Limitations Ref. Molecular docking Proteins' 3D structure, small-molecule structure Preliminary binding modes and docking scores High throughput, fast computation speed Static model; ignores proteins' conformational dynamics; relatively high false positive rates [41] Molecular dynamics simulation Docked complex, force-field parameters RMSD/RMSF, binding free energies Atomistic-scale dynamic characterization of molecular interactions High computational resource consumption; force-field parameter deficits for complex natural products [42] ADMET prediction 2D/3D small-molecule structures Pharmacokinetic and toxicity risk profiles Early elimination of candidates with poor druglikeness Performance depends on the training datasets; prediction accuracy is limited for tree-specific metabolites [43] 2D: 2-dimension; 3D: 3-dimension; RMSD: Root Mean Square Deviation; RMSF: Root Mean Square Fluctuation. Table 3.
Input, output, advantages, and limitations of core computational pharmacology evaluation workflows applied to tree-derived natural products.
Figures
(1)
Tables
(3)