-
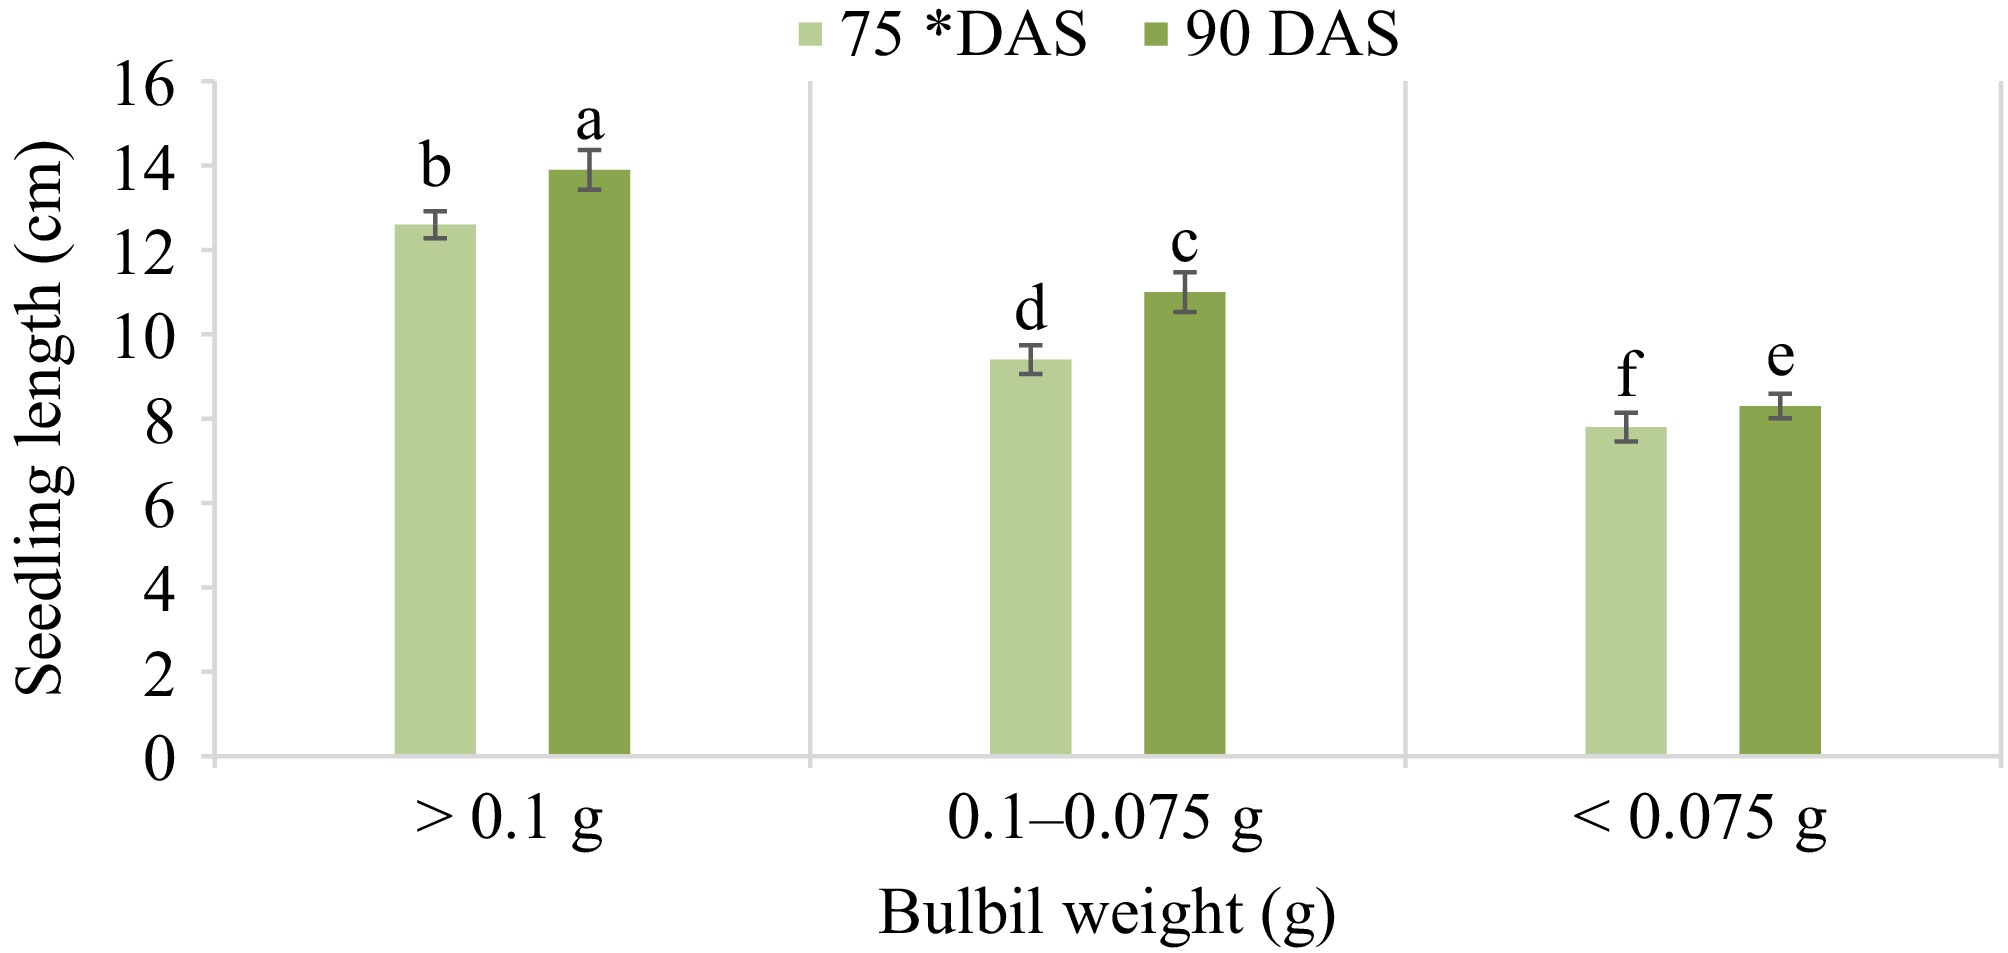
Figure 1.
Growth performance of bulbil-derived garlic seedlings as influenced by initial bulbil weight categories at 75 and 90 d after sowing (DAS). Data points represent the mean ± SD (n = 4). Different lowercase letters indicate statistically significant differences among treatments at p < 0.05, based on Fisher's least significant difference test. * DAS, Days after sowing
-
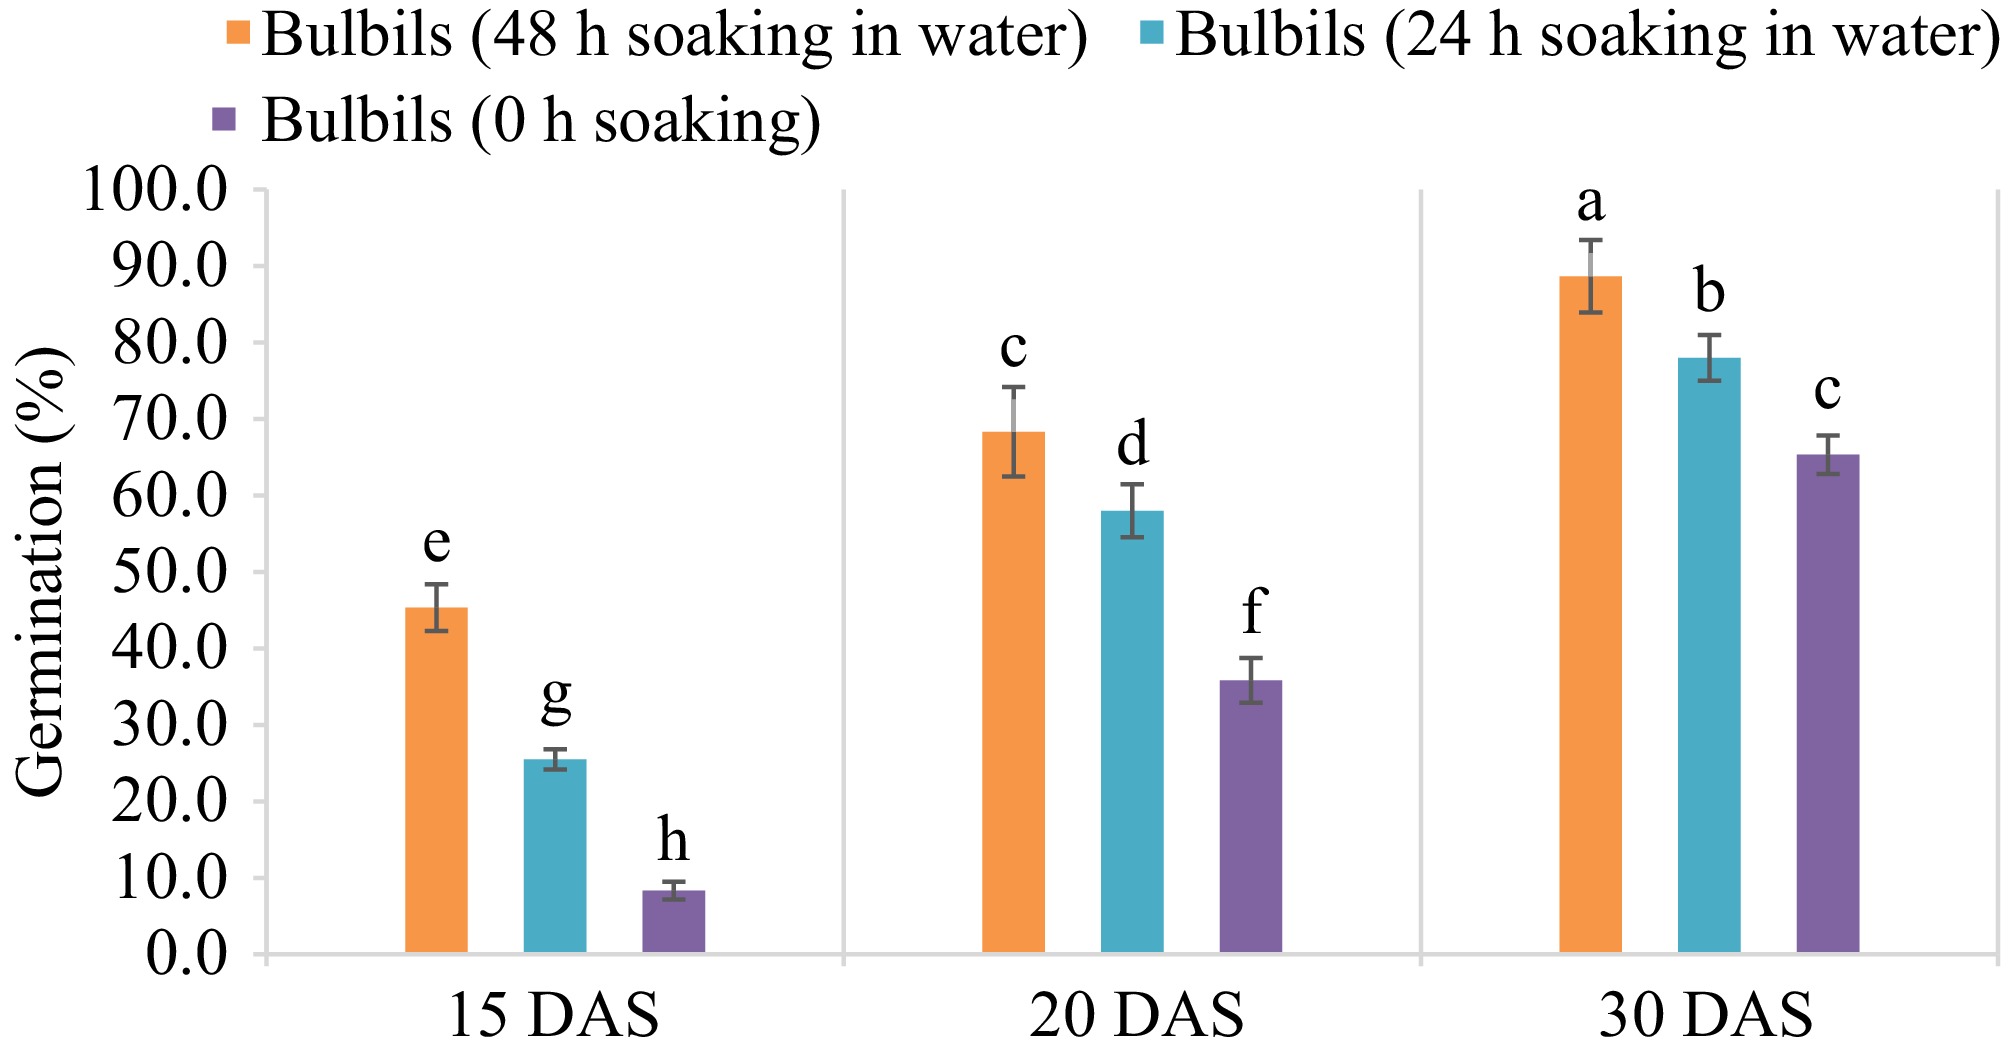
Figure 2.
Germination dynamics of garlic bulbils at 15, 20, and 30 d after sowing (DAS) as affected by pre-sowing hydration treatment. Data points represent the mean ± SD (n = 3). 0 h (no soaking), 24 h (24 h soaking in water), and 48 h (48 h soaking in water). Different lowercase letters indicate significant differences (p < 0.05).
-
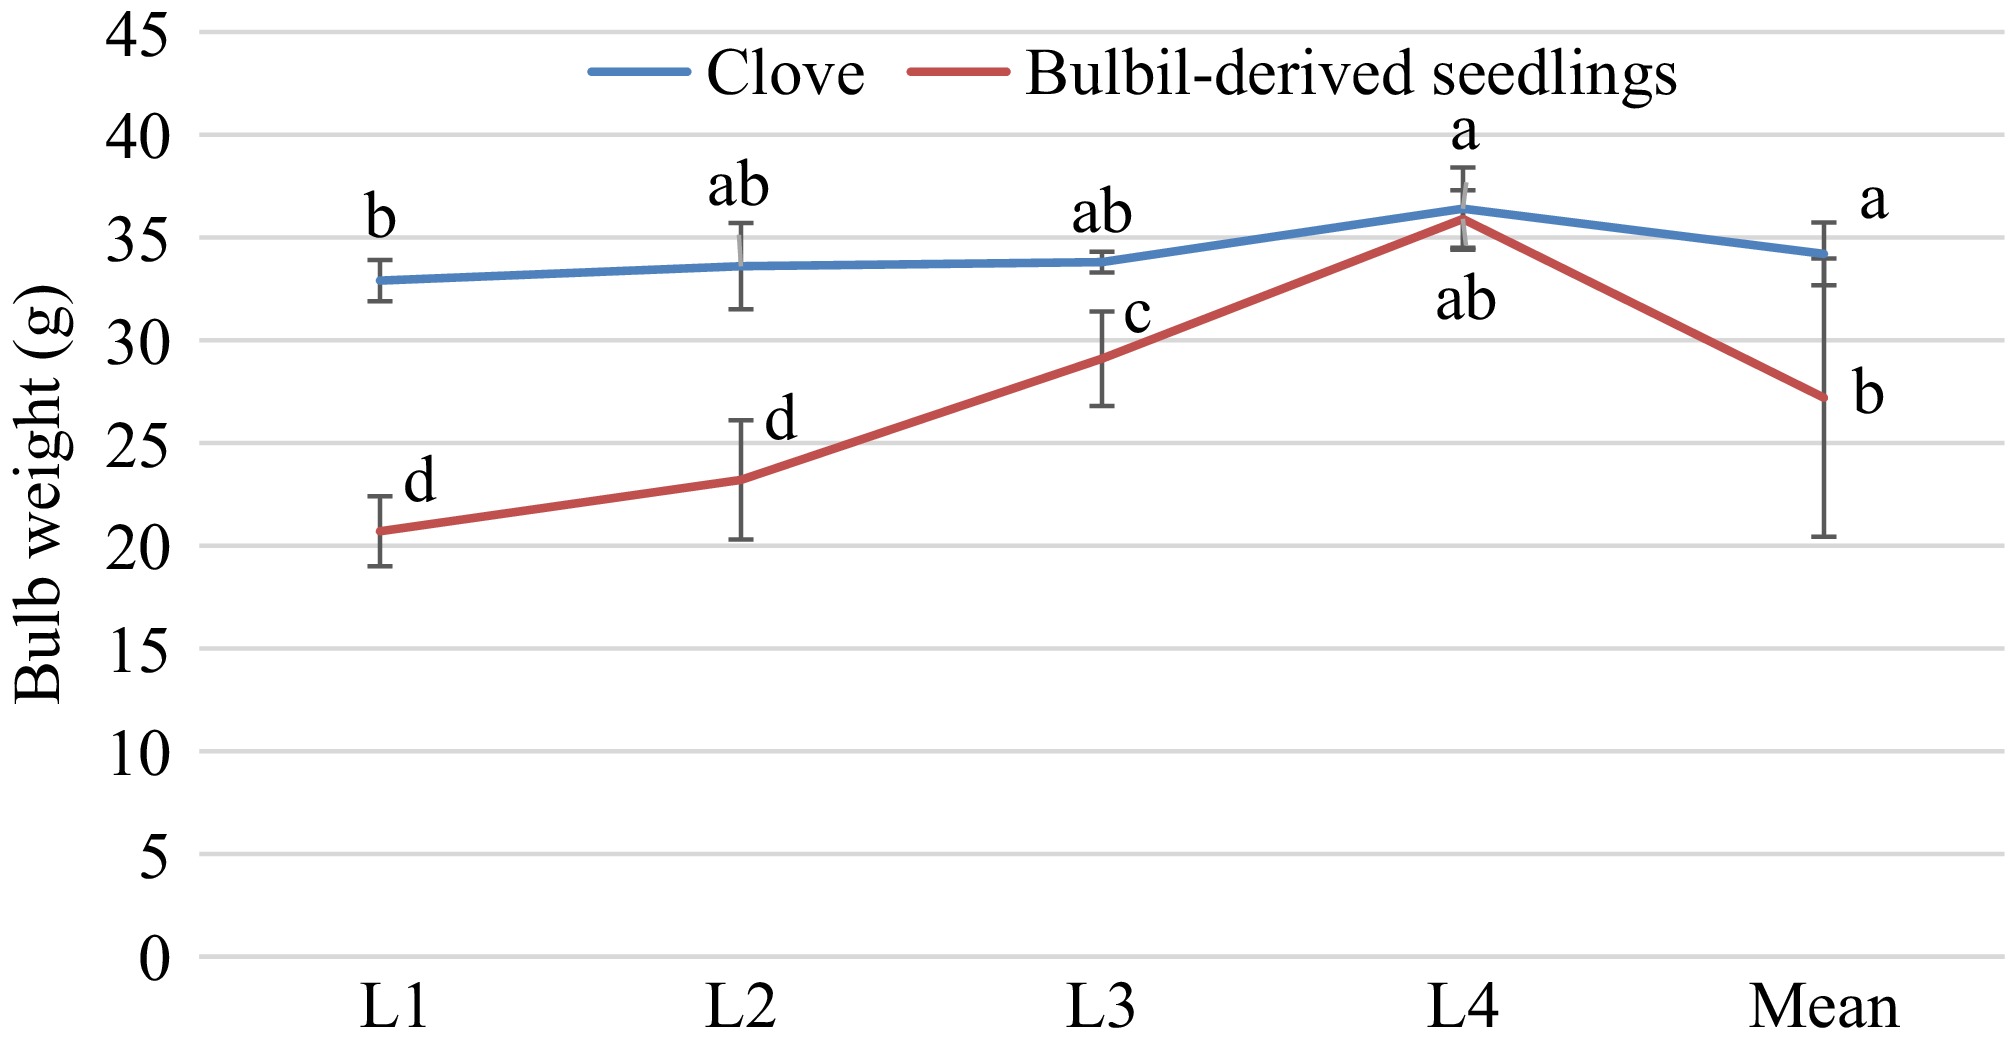
Figure 3.
Interactive effects of planting materials (conventional cloves vs bulbil-derived seedlings) and K fertilizer application levels on average garlic bulb weight (g). Data points represent the mean ± SD (n = 3). Potassium levels: L1 (0), L2 (50), L3 (75), and L4 (100 kg·ha–1) were applied against a uniform basal nutrient dressing. Different letters indicate significant differences in interactions (p < 0.05).
-
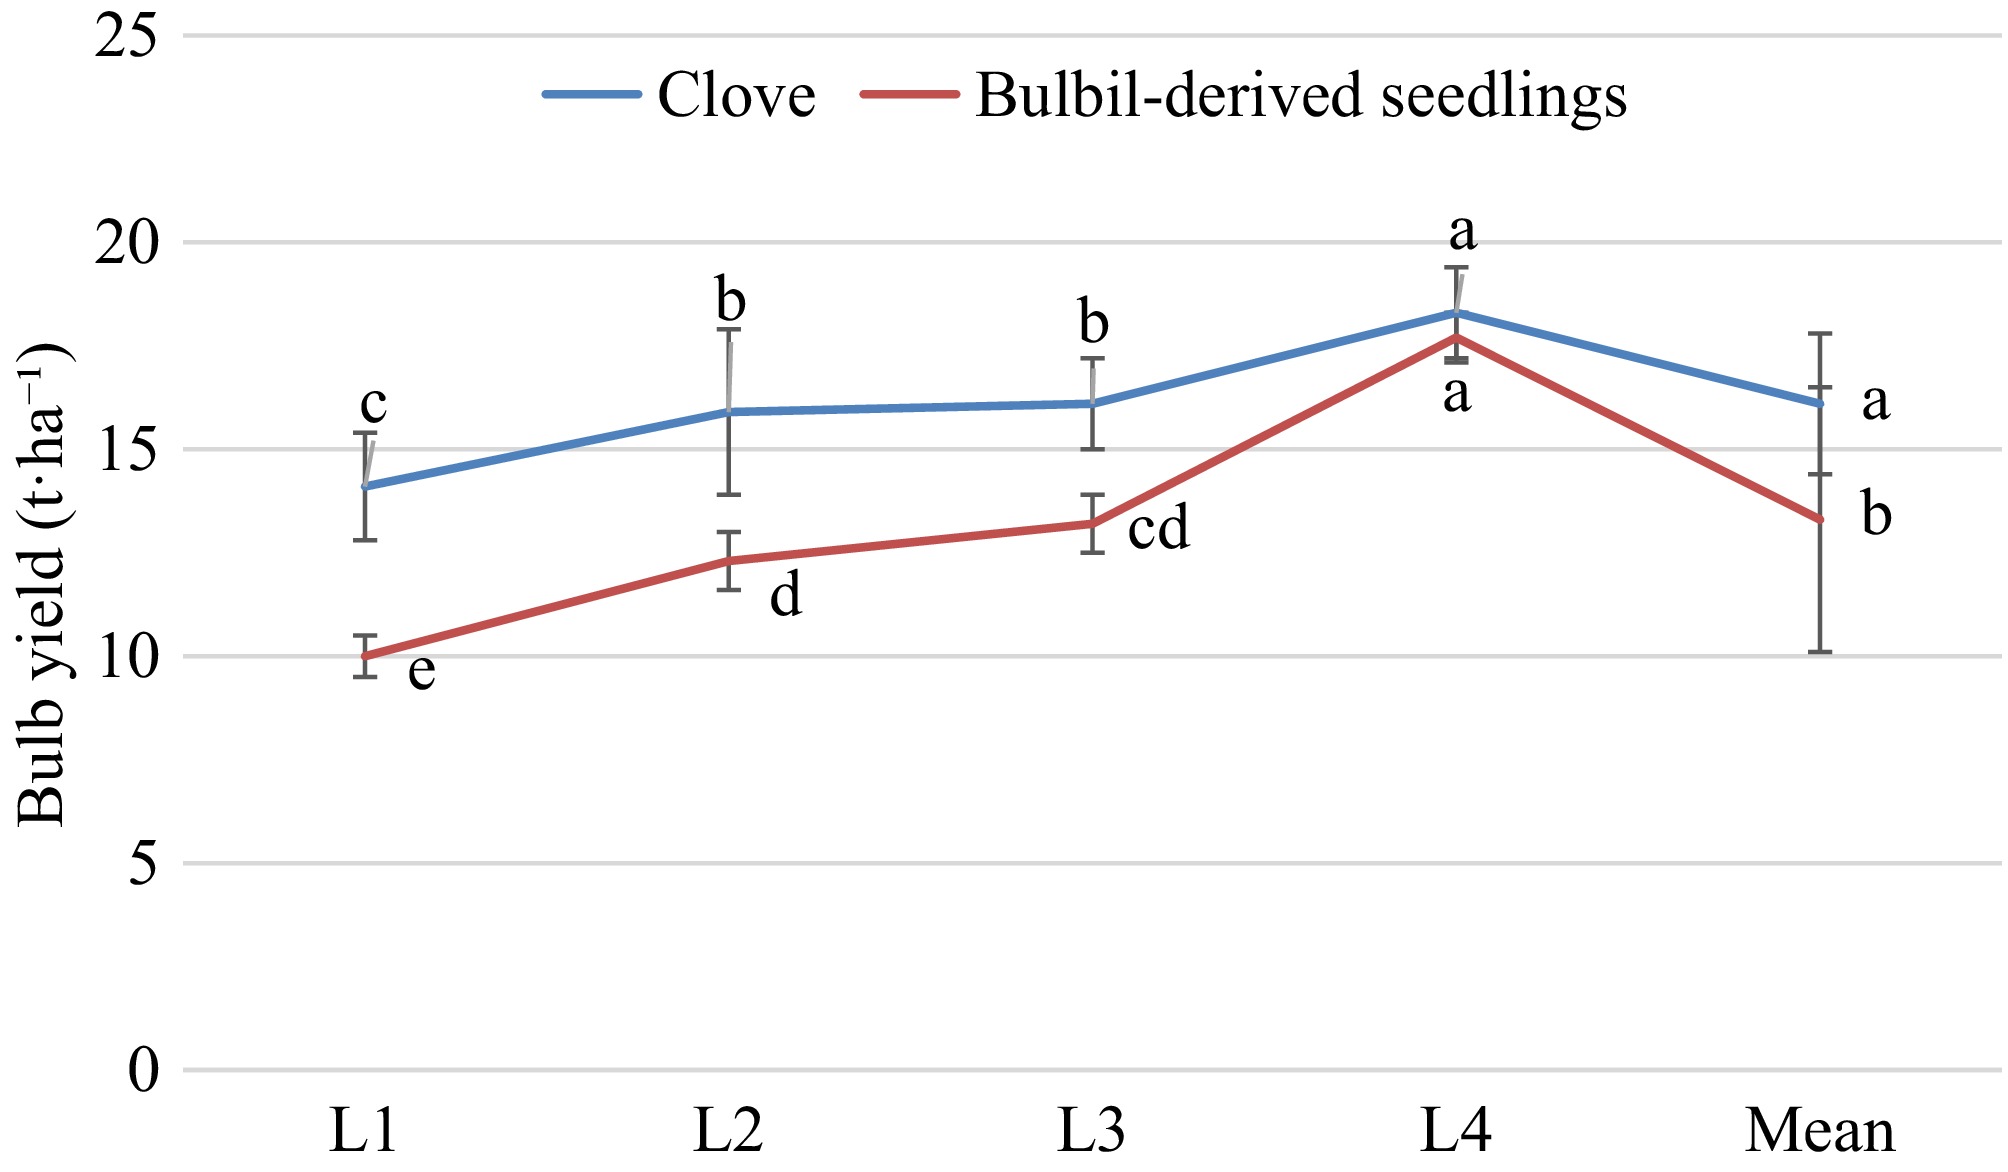
Figure 4.
Marketable garlic bulb yield (t·ha−1) as affected by the interaction between different planting materials and potassium fertiliser rates. Data points represent means ± SD (n = 3). For treatment definitions and baseline fertiliser details, see the footnotes in Fig. 3. Lowercase letters represent statistical differences at p < 0.05 using Fisher's LSD test.
-
Bulbil weight 75 DAS 90 DAS Mean (bulbil size) > 0.1 g 12.6 ± 0.32b 13.9 ± 0.47a 13.25 ± 0.9a 0.075–0.1 g 9.4 ± 0.34d 11 ± 0.47c 10.2 ± 1.1b < 0.075 g 7.8 ± 0.34f 8.3 ± 0.29e 8.05 ± 0.4c Mean (seedling age) 9.9 ± 2.4b 11.1 ± 2.8a Initial bulbil weight influenced garlic seedlings at 75 and 90 d after sowing (DAS). Data points represent the mean ± SD (n = 4). Different lowercase letters indicate statistically significant differences among treatments at p < 0.05, based on Fisher's LSD test. Table 1.
Effect of bulbil weight and days intervals on seedling length (cm).
-
Pre-sowing treatment Percent germination at 15 DAS* Percent germination at 20 DAS Percent germination at 30 DAS Mean Bulbils (48 h soaking in water) 45.3 ± 3.06e 68.3 ± 5.86c 88.8 ± 4.73a 67.4 ± 21.7a Bulbils (24 h soaking in water) 25.5 ± 1.32g 58.0 ± 3.46d 78.0 ± 3.00b 53.8 ± 26.5b Bulbils (no soaking) 8.3 ± 1.15h 35.8 ± 2.93f 65.3 ± 2.52c 36.5 ± 28.5c Mean 26.4 ± 18.5c 54.1 ± 16.6b 77.3 ± 11.7a Garlic bulbil germination at 15, 20, and 30 d after sowing was affected by pre-sowing hydration treatments. Data points represent the mean ± SD (n = 3). Different lowercase letters indicate statistically significant differences among treatments at p < 0.05, based on Fisher's LSD test. * DAS: days after sowing. Table 2.
Effect of pre-sowing treatment and days intervals on bulbil germination.
-
Planting materials Potassium levels Mean L1 L2 L3 L4 Clove 32.9 ± 1.0b 33.6 ± 2.1ab 33.8 ± 0.5ab 36.4 ± 2.0a 34.2 ± 1.53a Bulbil-derived seedlings 20.7 ± 1.7d 23.2 ± 2.9d 29.1 ± 2.3c 35.9 ± 1.4ab 27.2 ± 6.77b Mean 26.8 ± 8.63c 28.4 ± 7.35c 31.4 ± 3.32b 36.1 ± 0.35a Potassium levels: L1 (0), L2 (50), L3 (75), and L4 (100 kg·ha–1). Data points represent the mean ± SD (n = 3). Different lowercase letters indicate statistically significant differences among treatments at p < 0.05, based on Fisher's LSD test. Table 3.
Effect of planting materials and potassium levels on bulb weight.
-
Planting materials Potassium levels Mean L1 L2 L3 L4 Clove 14.1 ± 1.3c 15.9 ± 2.0b 16.1 ± 1.1b 18.3 ± 1.1a 16.1 ± 1.7a Bulbil-derived seedlings 10.0 ± 0.5e 12.3 ± 0.7d 13.2 ± 0.7cd 17.7 ± 0.6a 13.3 ± 3.2b Mean 12.1 ± 2.9c 14.1 ± 2.5b 14.7 ± 2.1b 18.0 ± 0.4a Potassium levels: L1 (0), L2 (50), L3 (75), and L4 (100 kg·ha–1). Data points represent the mean ± SD (n = 3). Different lowercase letters indicate statistically significant differences among treatments at p < 0.05, based on Fisher's LSD test. Table 4.
Effect of planting materials and potassium levels on bulb yield.
Figures
(4)
Tables
(4)