-
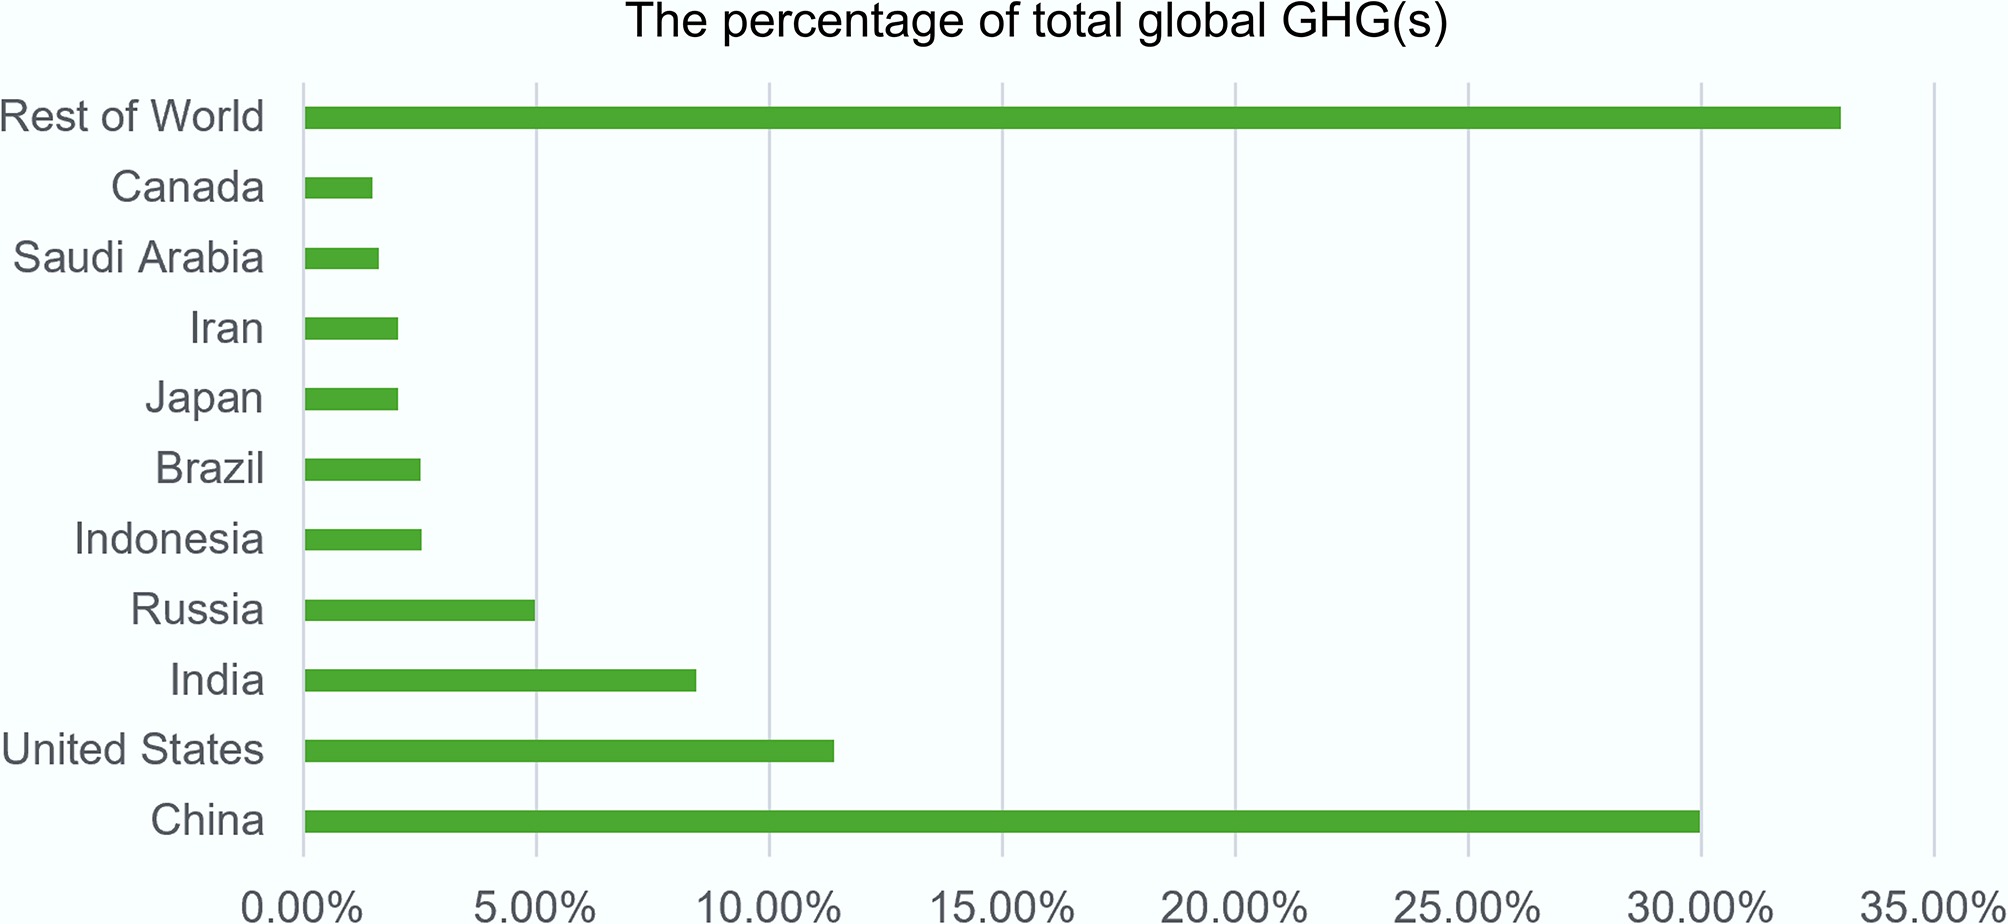
Figure 1.
Distribution of 2024 values among the top 10 countries and the rest of the world. Source: adapted from Crippa et al.[33].
-
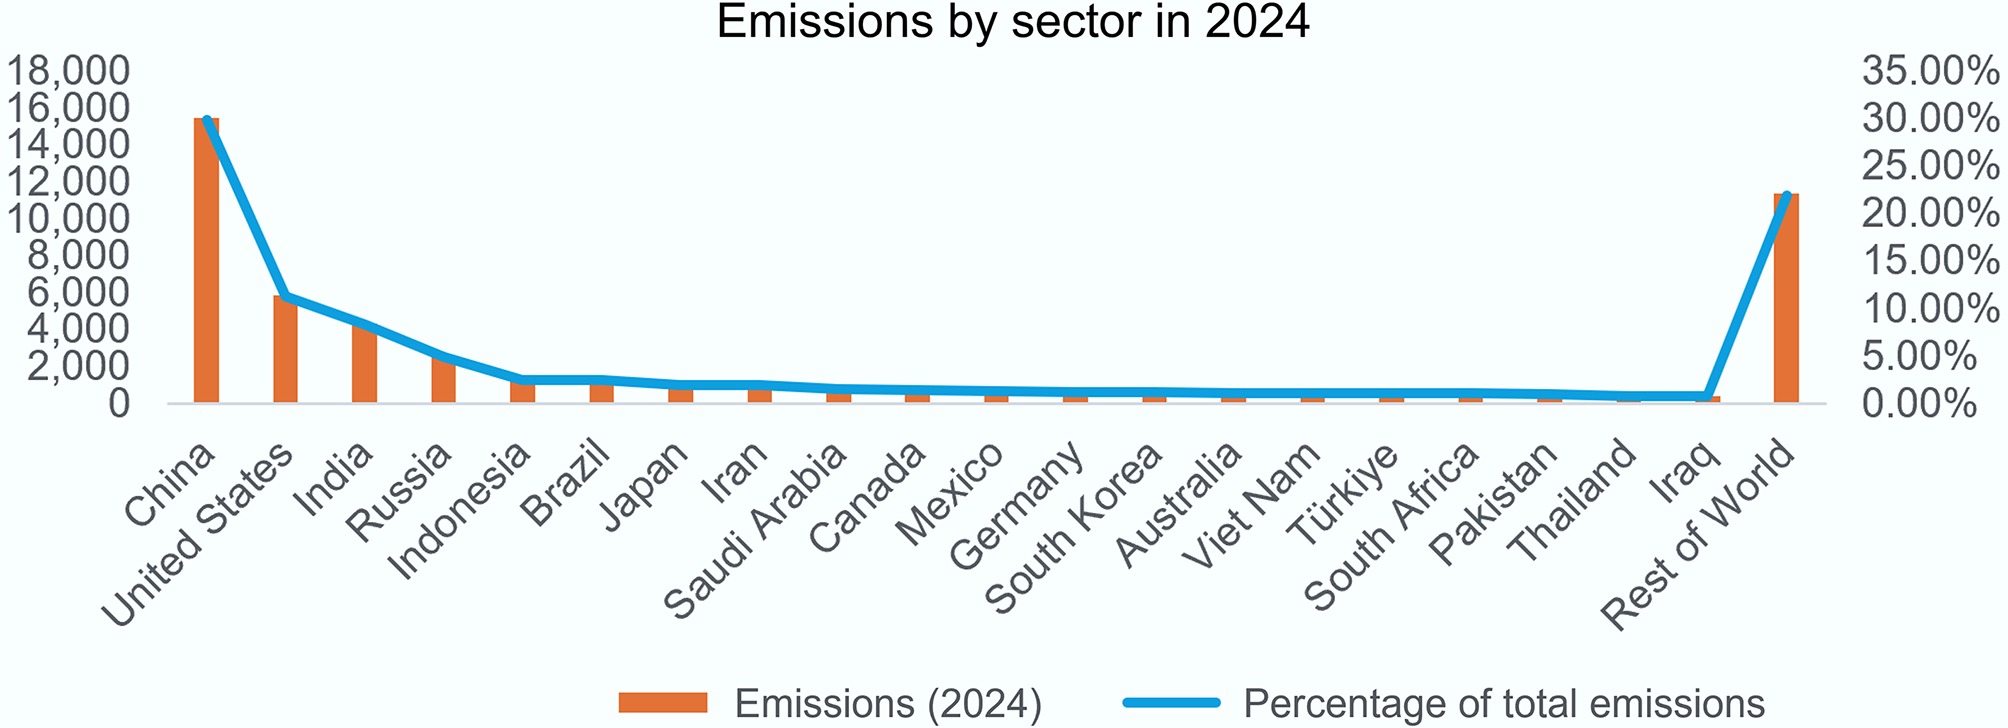
Figure 2.
Global sector greenhouse gas emissions. Adapted from Crippa et al.[33].
-
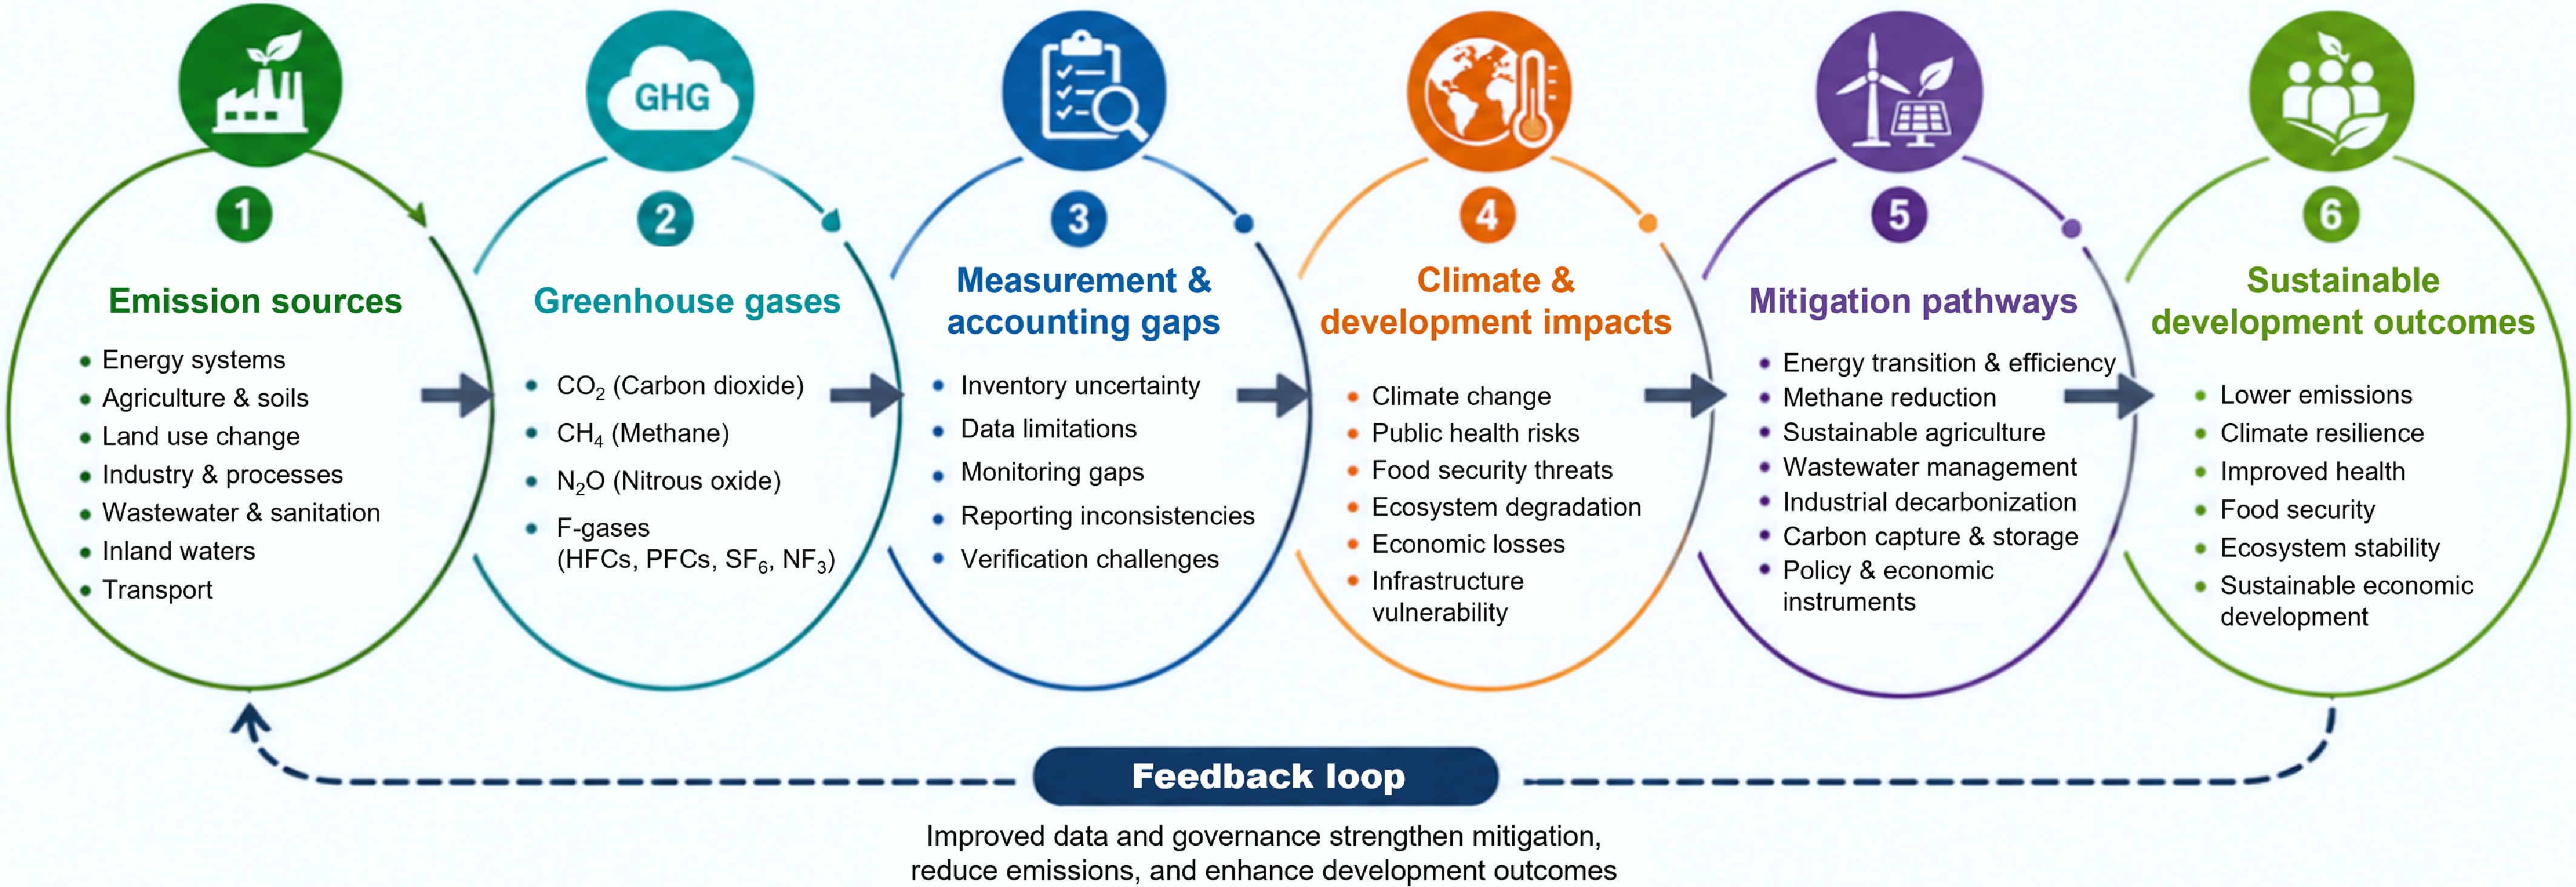
Figure 3.
Integrated framework of greenhouse gas sources, measurement gaps, climate impacts, and mitigation pathways.
-
Component Method used Review design Narrative literature review with thematic synthesis Literature sources Scopus, Web of Science, Google Scholar, publisher platforms, and backward citation searching Selection approach Purposive and iterative; sources retained for substantive empirical, analytical, methodological, emissions, or policy relevance Evidence base 83 substantive sources, including journal articles, international assessments, reports, inventories, and authoritative datasets Synthesis Evidence organized by gas, sector, geography, methodology, accounting issue, and key finding, then synthesized narratively and thematically; no statistical pooling was undertaken Methodological limitation No formal risk-of-bias assessment or complete systematic-search and screening record was retained Table 1.
Summary of the narrative review methodology
-
Country Emission sector 2024 value Global total (%) China Power industry 6,646.88 12.82% USA Transport 1,702.83 3.28% India Power industry 1,532.63 2.96% Russia Power industry 854.99 1.65% Indonesia Power industry 353.49 0.68% Brazil Agriculture 633.99 1.22% Japan Power industry 435.64 0.84% Iran Fuel exploitation 234.61 0.45% Saudi Arabia Power industry 279.16 0.54% Canada Fuel exploitation 212.26 0.41% Mexico Power industry 155.49 0.30% Germany Power industry 173.10 0.33% South Korea Power industry 267.21 0.52% Australia Power industry 163.92 0.32% Viet Nam Power industry 202.24 0.39% Türkiye Power industry 143.66 0.28% South Africa Power industry 233.54 0.45% Pakistan Agriculture 261.24 0.50% Thailand Power industry 90.23 0.17% Iraq Fuel exploitation 199.48 0.38% Adapted from Crippa et al.[33]. Table 2.
Leading emission sector in the top 20 emitting countries, 2024
-
Sector or system CO2 CH4 N2O F-gas Documented accounting gap and quantification status Priority mitigation and MRV response Ref. Energy supply and fossil-fuel systems Primary gas from fuel combustion, flaring, and energy use Fugitive emissions from production, processing, transmission, and storage Secondary combustion-related source Limited direct contribution Bottom-up estimates may underrepresent intermittent leaks, abnormal operating conditions, and high-emitting facilities. Measurement studies document underestimation, but the magnitude varies by region and infrastructure type Decarbonize energy supply; measure facility-level emissions; combine inventories with ground, aerial, and satellite observations; prioritize high-emitting sites [33,63−66] Industry Fuel- and process-related emissions, including cement and chemical production Source-specific process and fugitive emissions Emissions from nitrogen-related industrial processes Major source through refrigerants, electronics, and other industrial applications Facility coverage, process assumptions, refrigerant leakage, and inconsistent treatment of fluorinated gases affect comparability. No single global estimate of industrial undercounting is available in the reviewed evidence Electrification and efficiency; low-carbon process changes; refrigerant substitution and recovery; facility-level reporting and verification [9,33,34] Transport and buildings Primary gas from direct fuel use and purchased energy Smaller combustion and fuel-distribution contribution Smaller combustion-related contribution Refrigerant leakage from cooling and heat-pump systems Territorial inventories may exclude emissions embodied in imported electricity, fuels, construction materials, and services. Refrigerant leakage may be estimated using generalized equipment assumptions Electrification; energy efficiency; low-carbon electricity; refrigerant management; reporting of territorial and consumption-based boundaries [9,34,43] Agriculture and managed land Energy use, land-use change, and changes in soil and biomass carbon stocks Livestock, manure management, and flooded rice Managed soils, fertilizer use, manure, and crop residues Not a principal source in the reviewed agricultural evidence Uniform emission factors may not represent local soil, climate, amendments, or management. Soil-carbon estimates differ in coverage and treatment of emissions, removals, and permanence. No harmonized global omission percentage is available Improve nitrogen-use efficiency; use locally representative emission factors; manage livestock, manure, and rice systems; repeat soil-carbon measurements; report reversals and permanence risks [13,23,24,44] Wastewater and non-sewered sanitation Mainly biogenic CO2, with treatment-related energy emissions reported separately Treatment plants, sewers, septic tanks, pit latrines, and sludge systems Nitrification, denitrification, and nitrogen-rich effluent treatment Not a principal source Decentralized and non-sewered systems may be excluded where infrastructure and activity data are incomplete. Default factors may not represent technology or operating conditions. Available studies confirm non-negligible emissions but do not provide a harmonized global missing share Extend inventories across the complete sanitation chain; measure plant-level CH4 and N2O; improve process control; develop technology- and region-specific emission factors [25,38−40,54] Solid waste and landfills Mainly biogenic CO2, with operational energy reported separately Principal climate-relevant gas from anaerobic decomposition Minor or poorly characterized contribution Not a principal source Reported emissions depend on waste composition, landfill age, moisture, oxidation, and gas-capture efficiency. Satellite observations identify persistent hotspots that may not be represented fully by conventional reporting Reduce organic waste disposal; capture and use landfill gas; combine facility reporting with aerial and satellite verification; investigate persistent hotspots [41,67] Reservoirs and inland waters Gross surface fluxes, carbon burial, and changes relative to the pre-impoundment landscape Diffusion, ebullition, and downstream degassing Not evaluated consistently in the reviewed reservoir evidence Not applicable Gross surface fluxes cannot be equated directly with anthropogenic or inventory-accountable emissions. Estimates depend on the pre-impoundment baseline, reservoir age, measurement pathway, and allocation among reservoir services Report gross and net fluxes separately; establish pre-impoundment baselines; measure multiple emission pathways; disclose allocation to hydropower, irrigation, water supply, and flood control [26,58−62] MRV, monitoring, reporting, and verification. Table 3.
Sector-by-gas emission profiles, accounting gaps, and priority responses
Figures
(3)
Tables
(3)