-
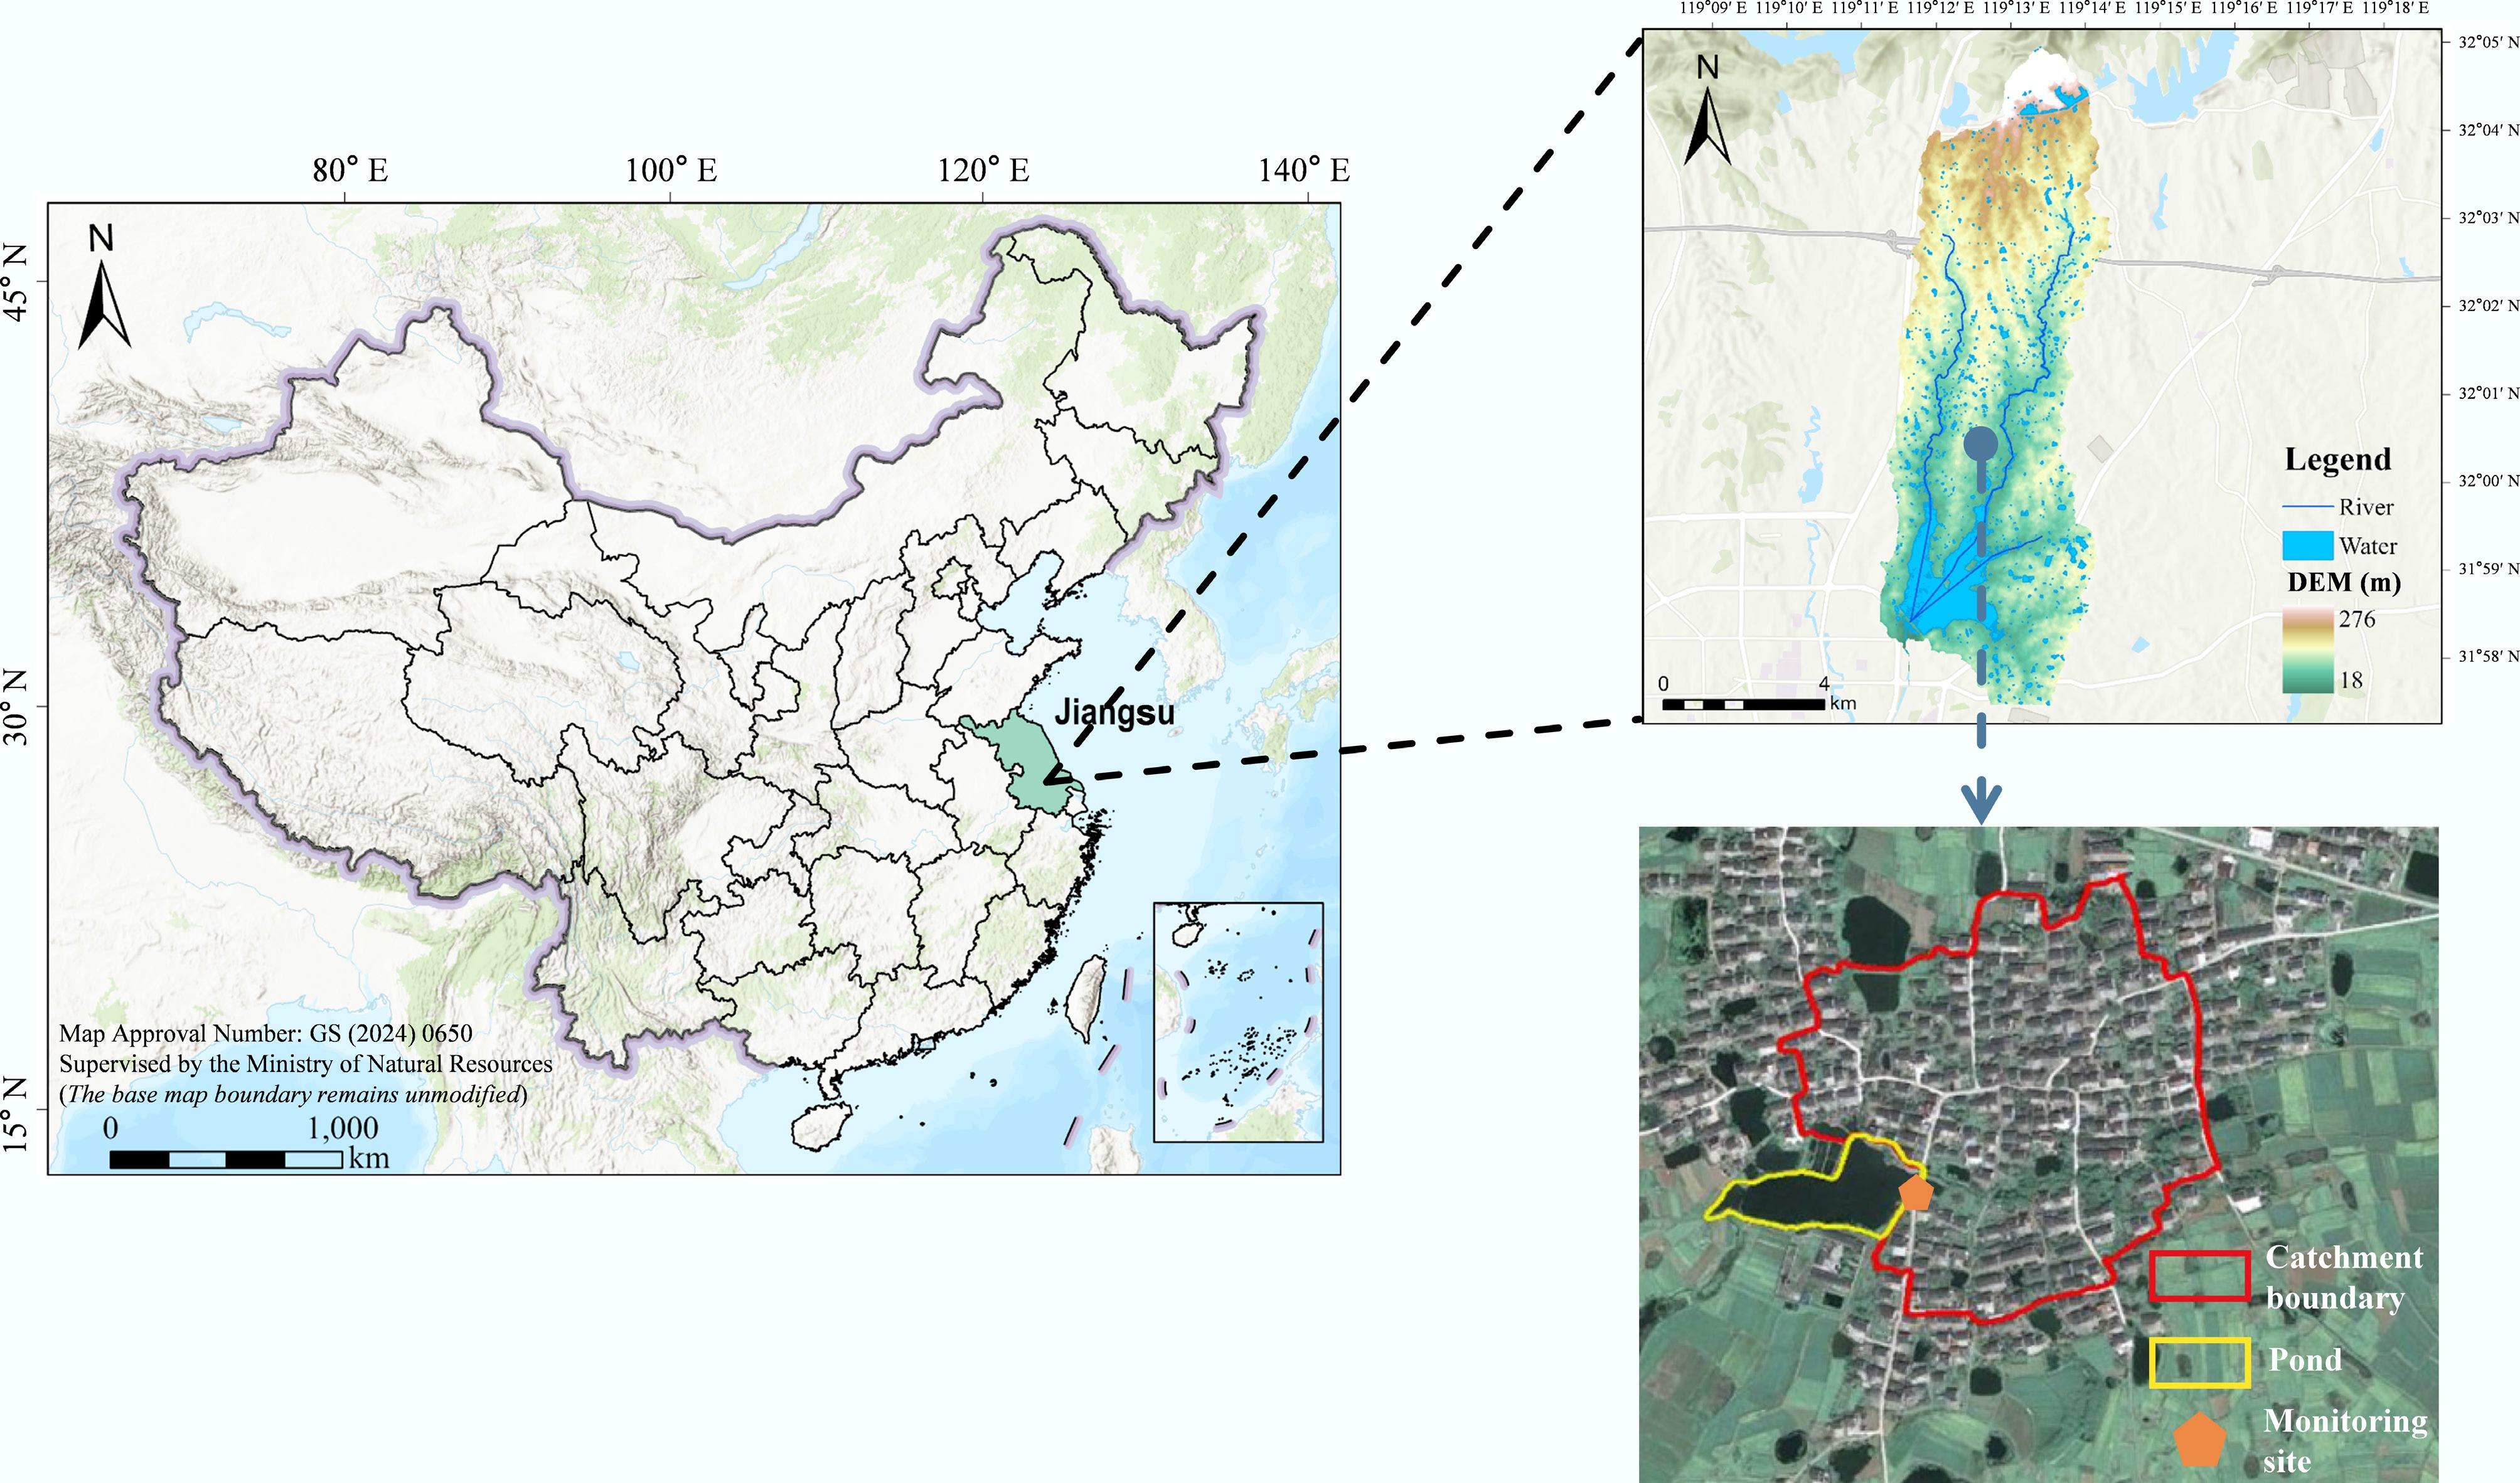
Figure 1.
Study area and outlet monitoring location in Dai Village, Jurong Reservoir catchment, eastern China. The panels show the national and provincial location, catchment elevation (DEM, m), and the village-scale catchment boundary, pond, and monitoring site. The China administrative boundary panel is based on the standard map with approval number GS (2024) 0650, downloaded from the Standard Map Service website of the Ministry of Natural Resources of China. The base map was not altered.
-
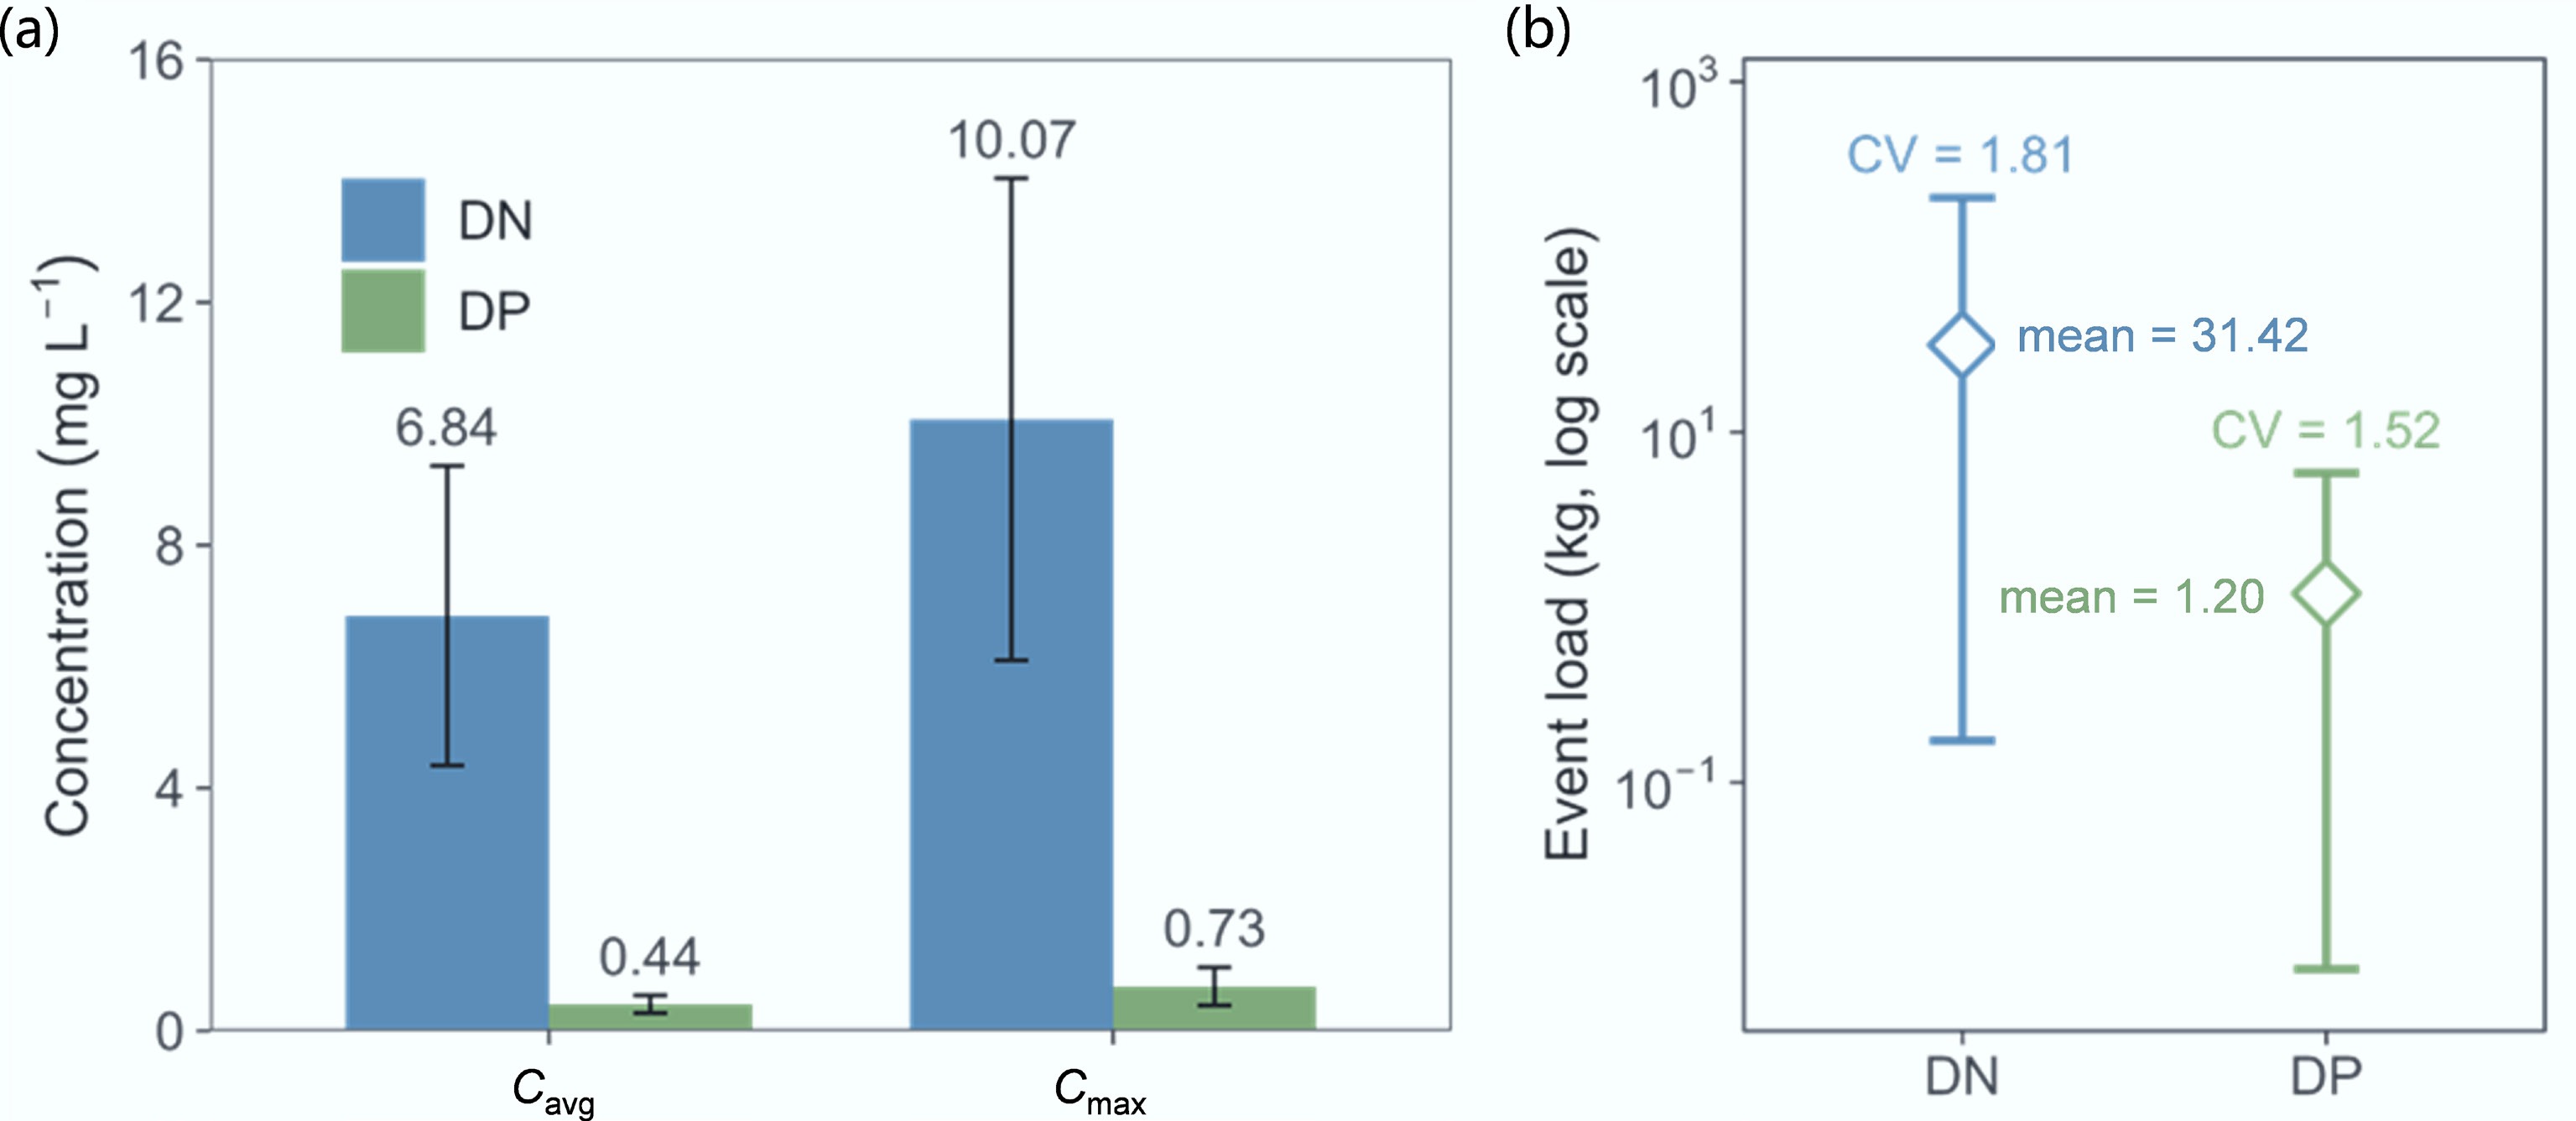
Figure 2.
Event-scale DN and DP export across the 21 rainfall-runoff events: (a) mean and peak concentrations (Cavg, Cmax); (b) event loads (log scale).
-
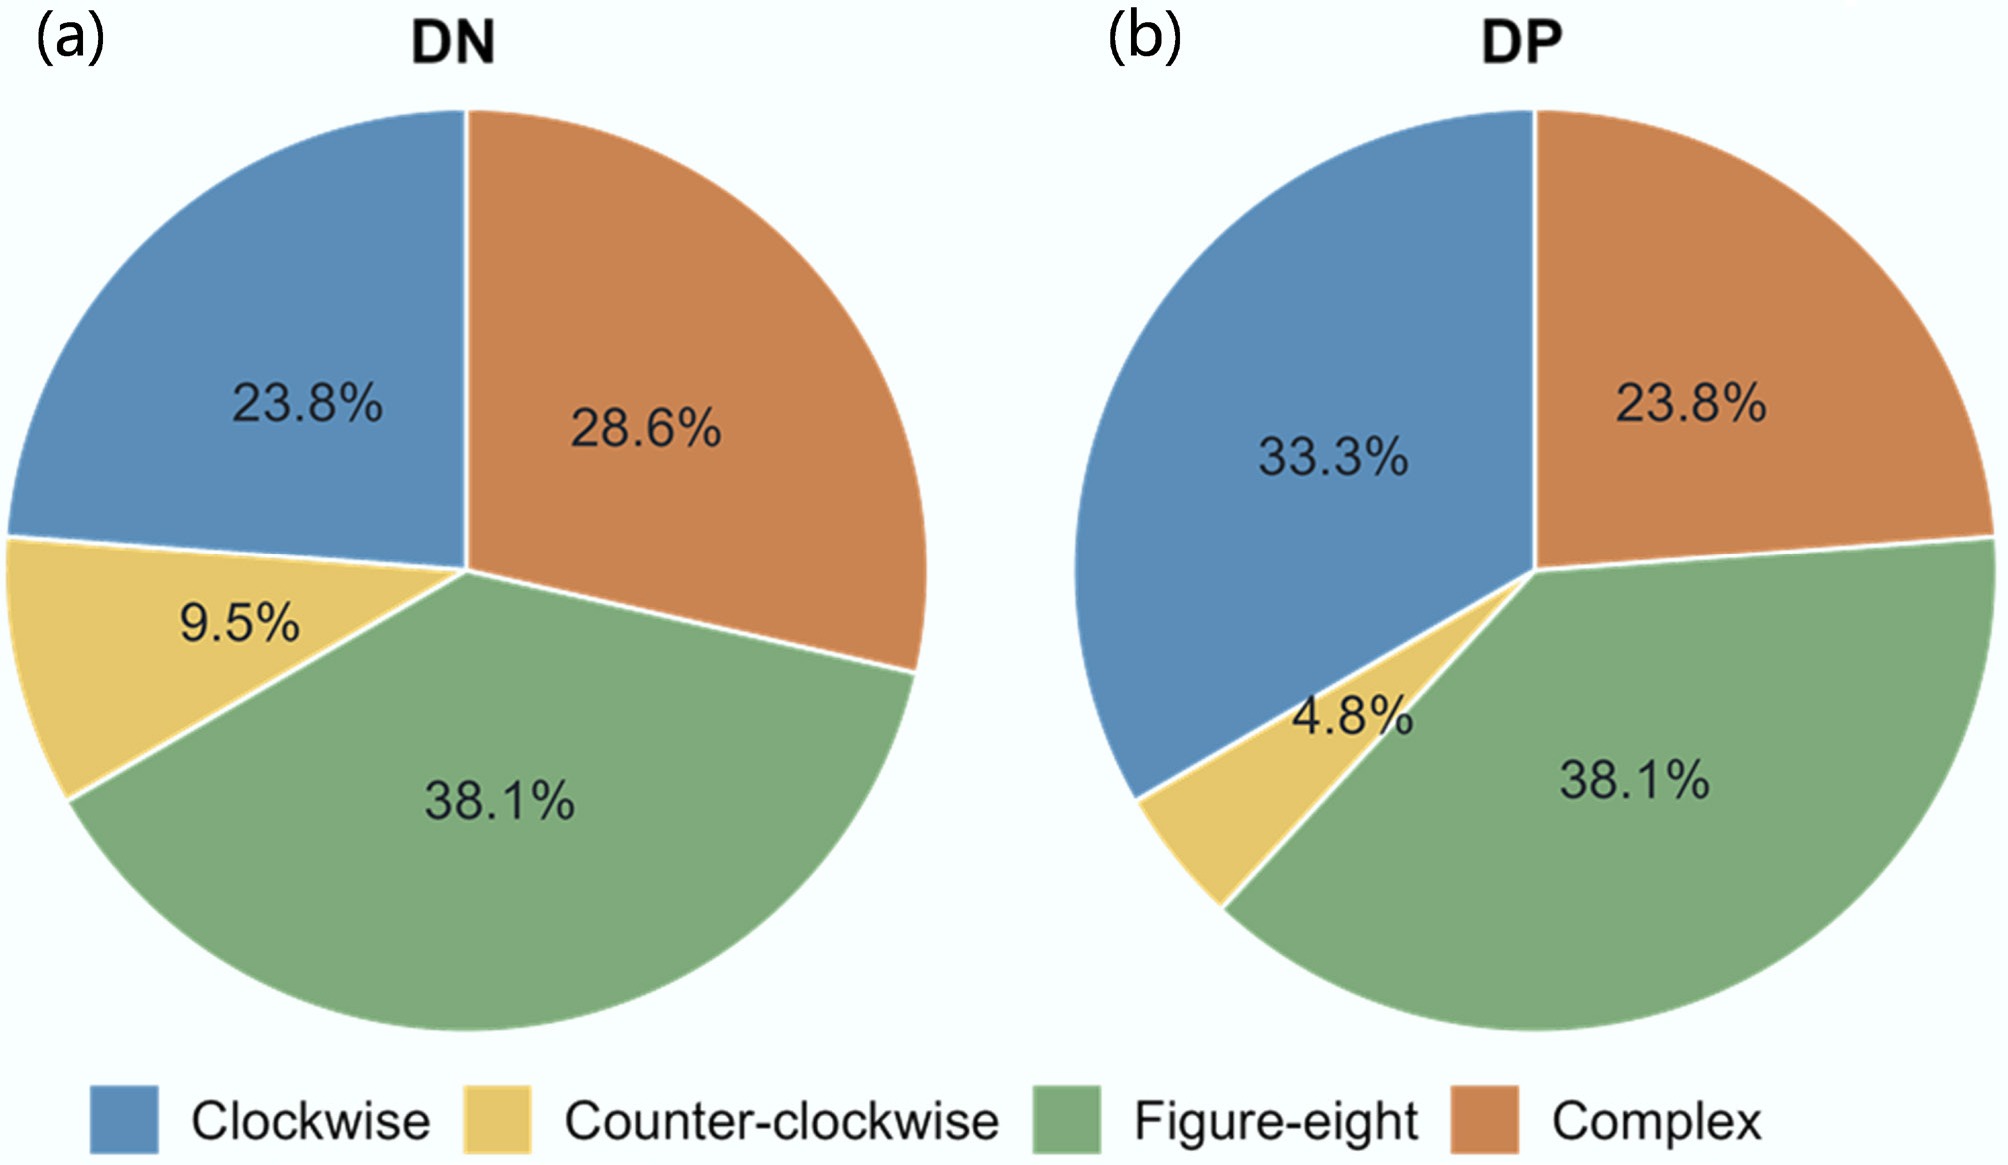
Figure 3.
Frequency of DN and DP concentration-discharge hysteresis patterns: (a) DN; (b) DP.
-
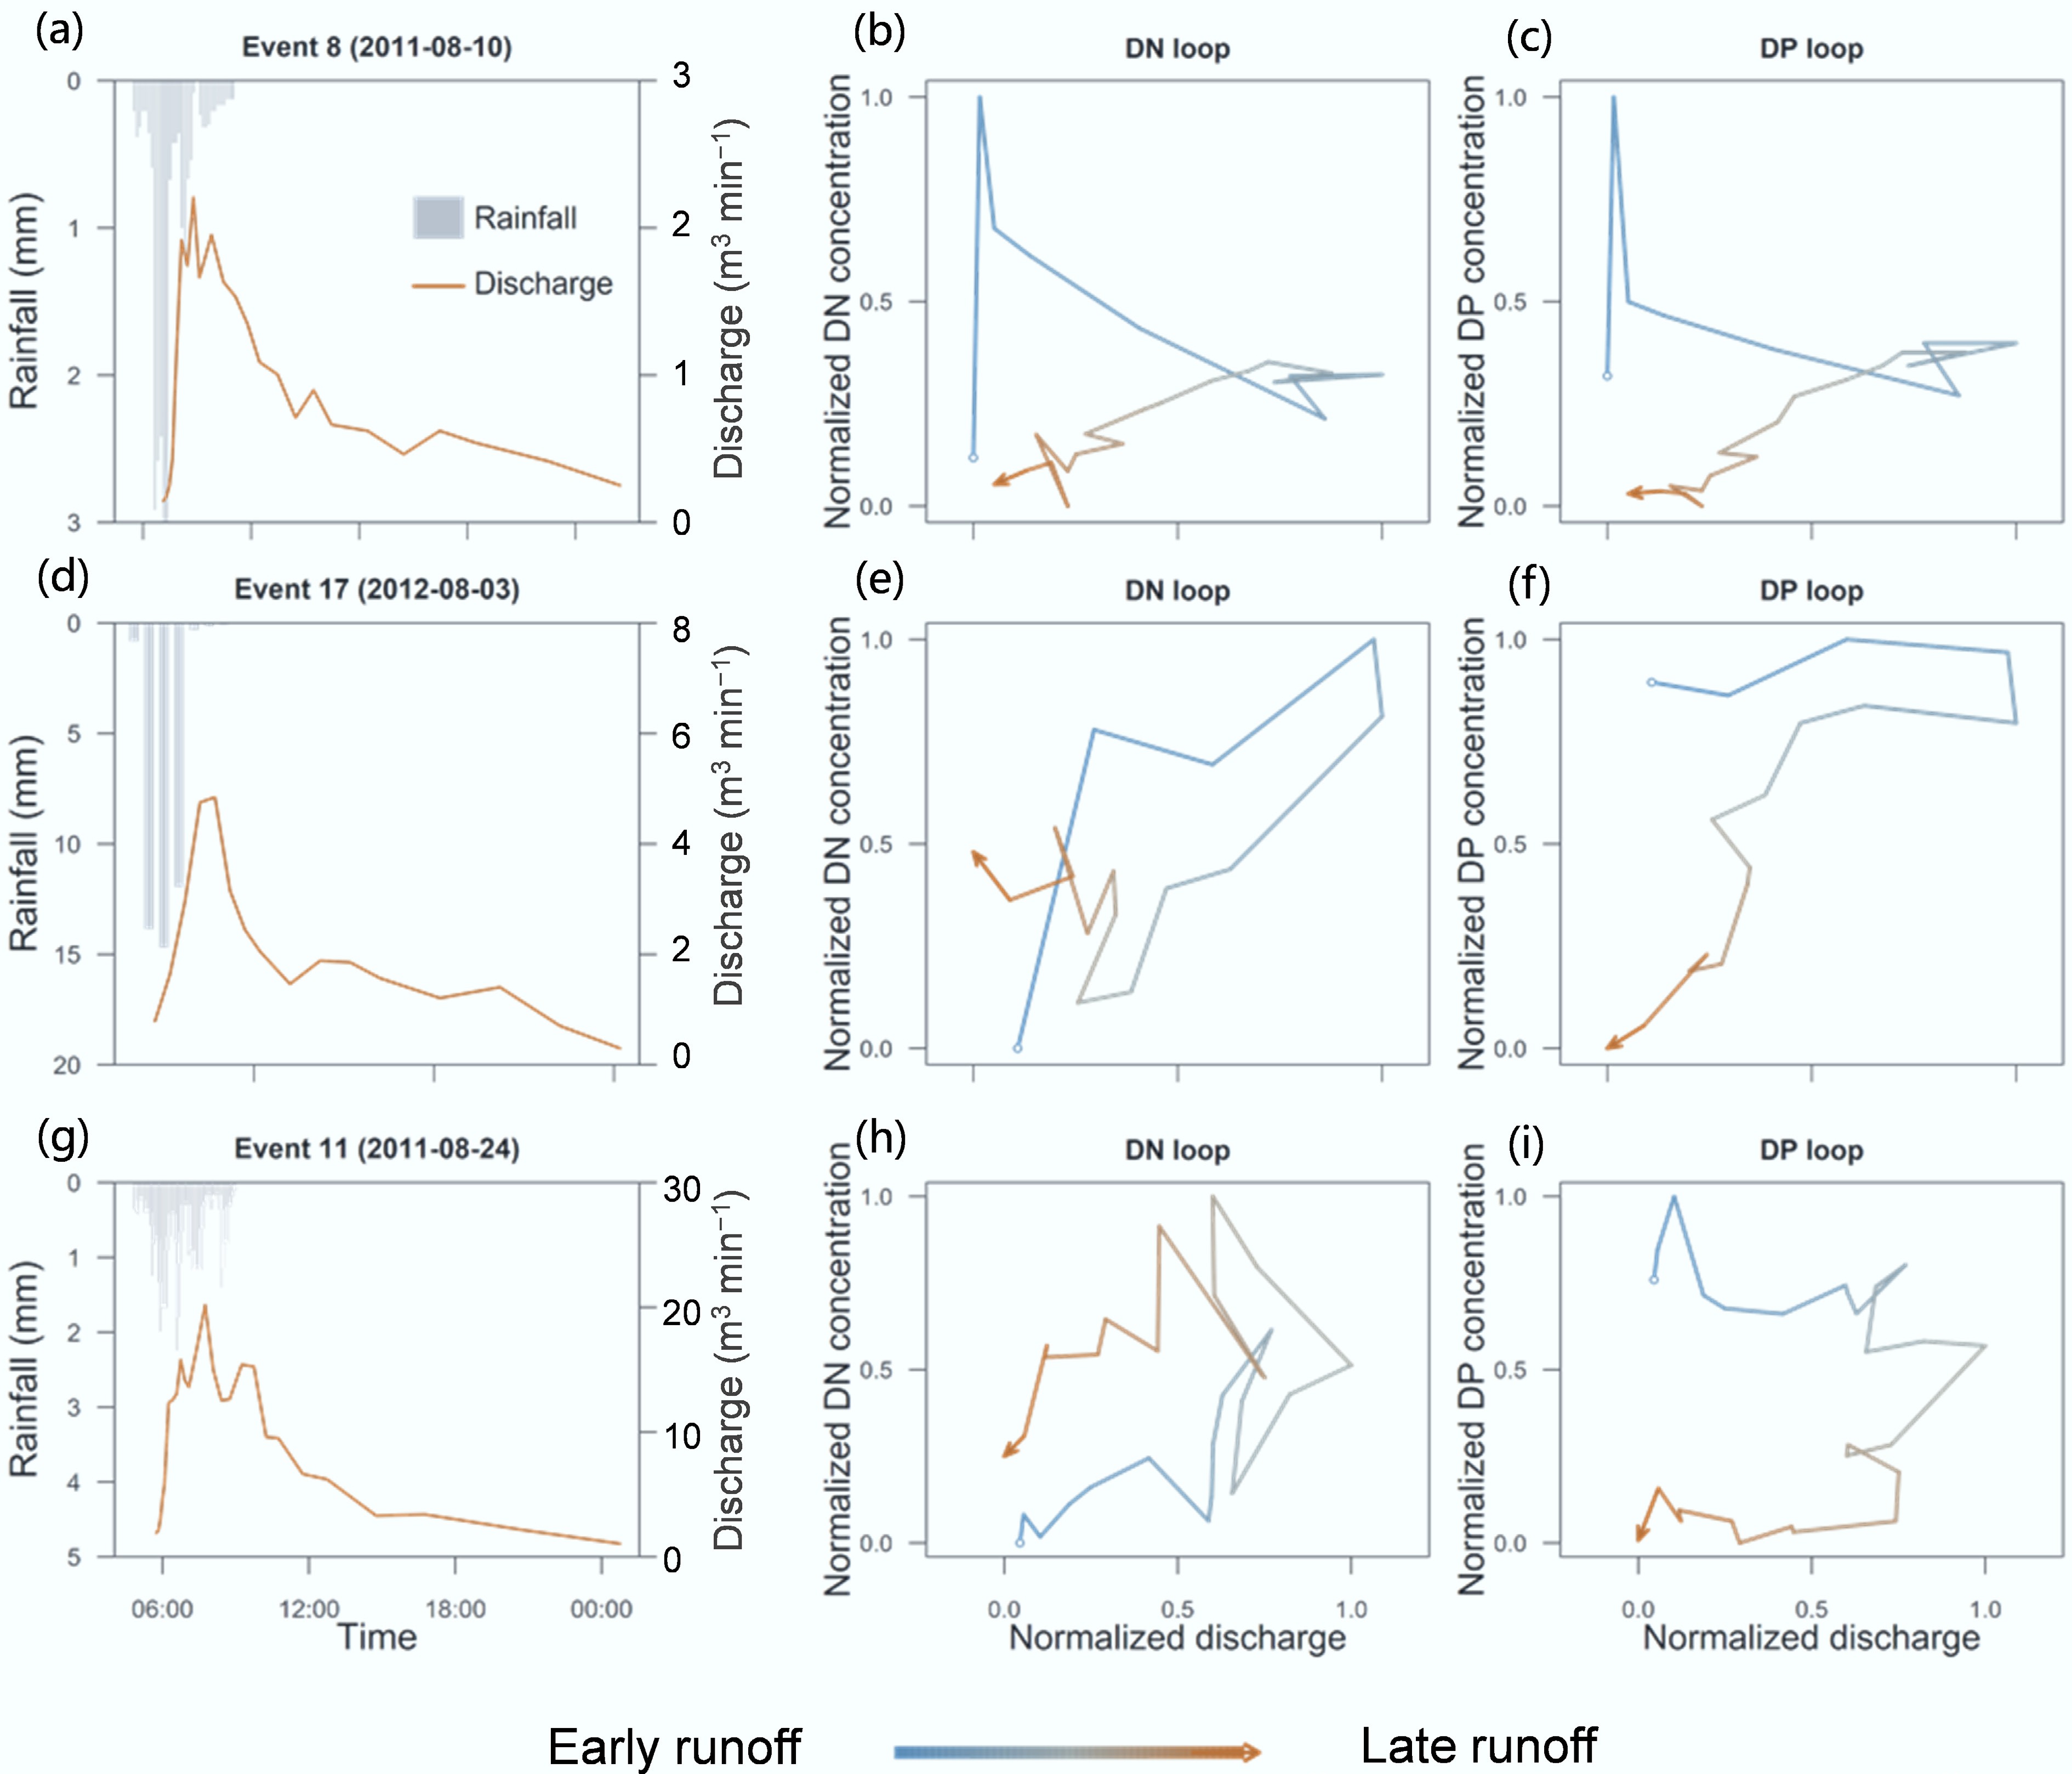
Figure 4.
Representative rainfall-runoff events and DN/DP concentration-discharge hysteresis loops for Events No. 8, 17, and 11: (a), (d), (g) rainfall and discharge; (b), (e), (h) DN loops; (c), (f), (i) DP loops.
-
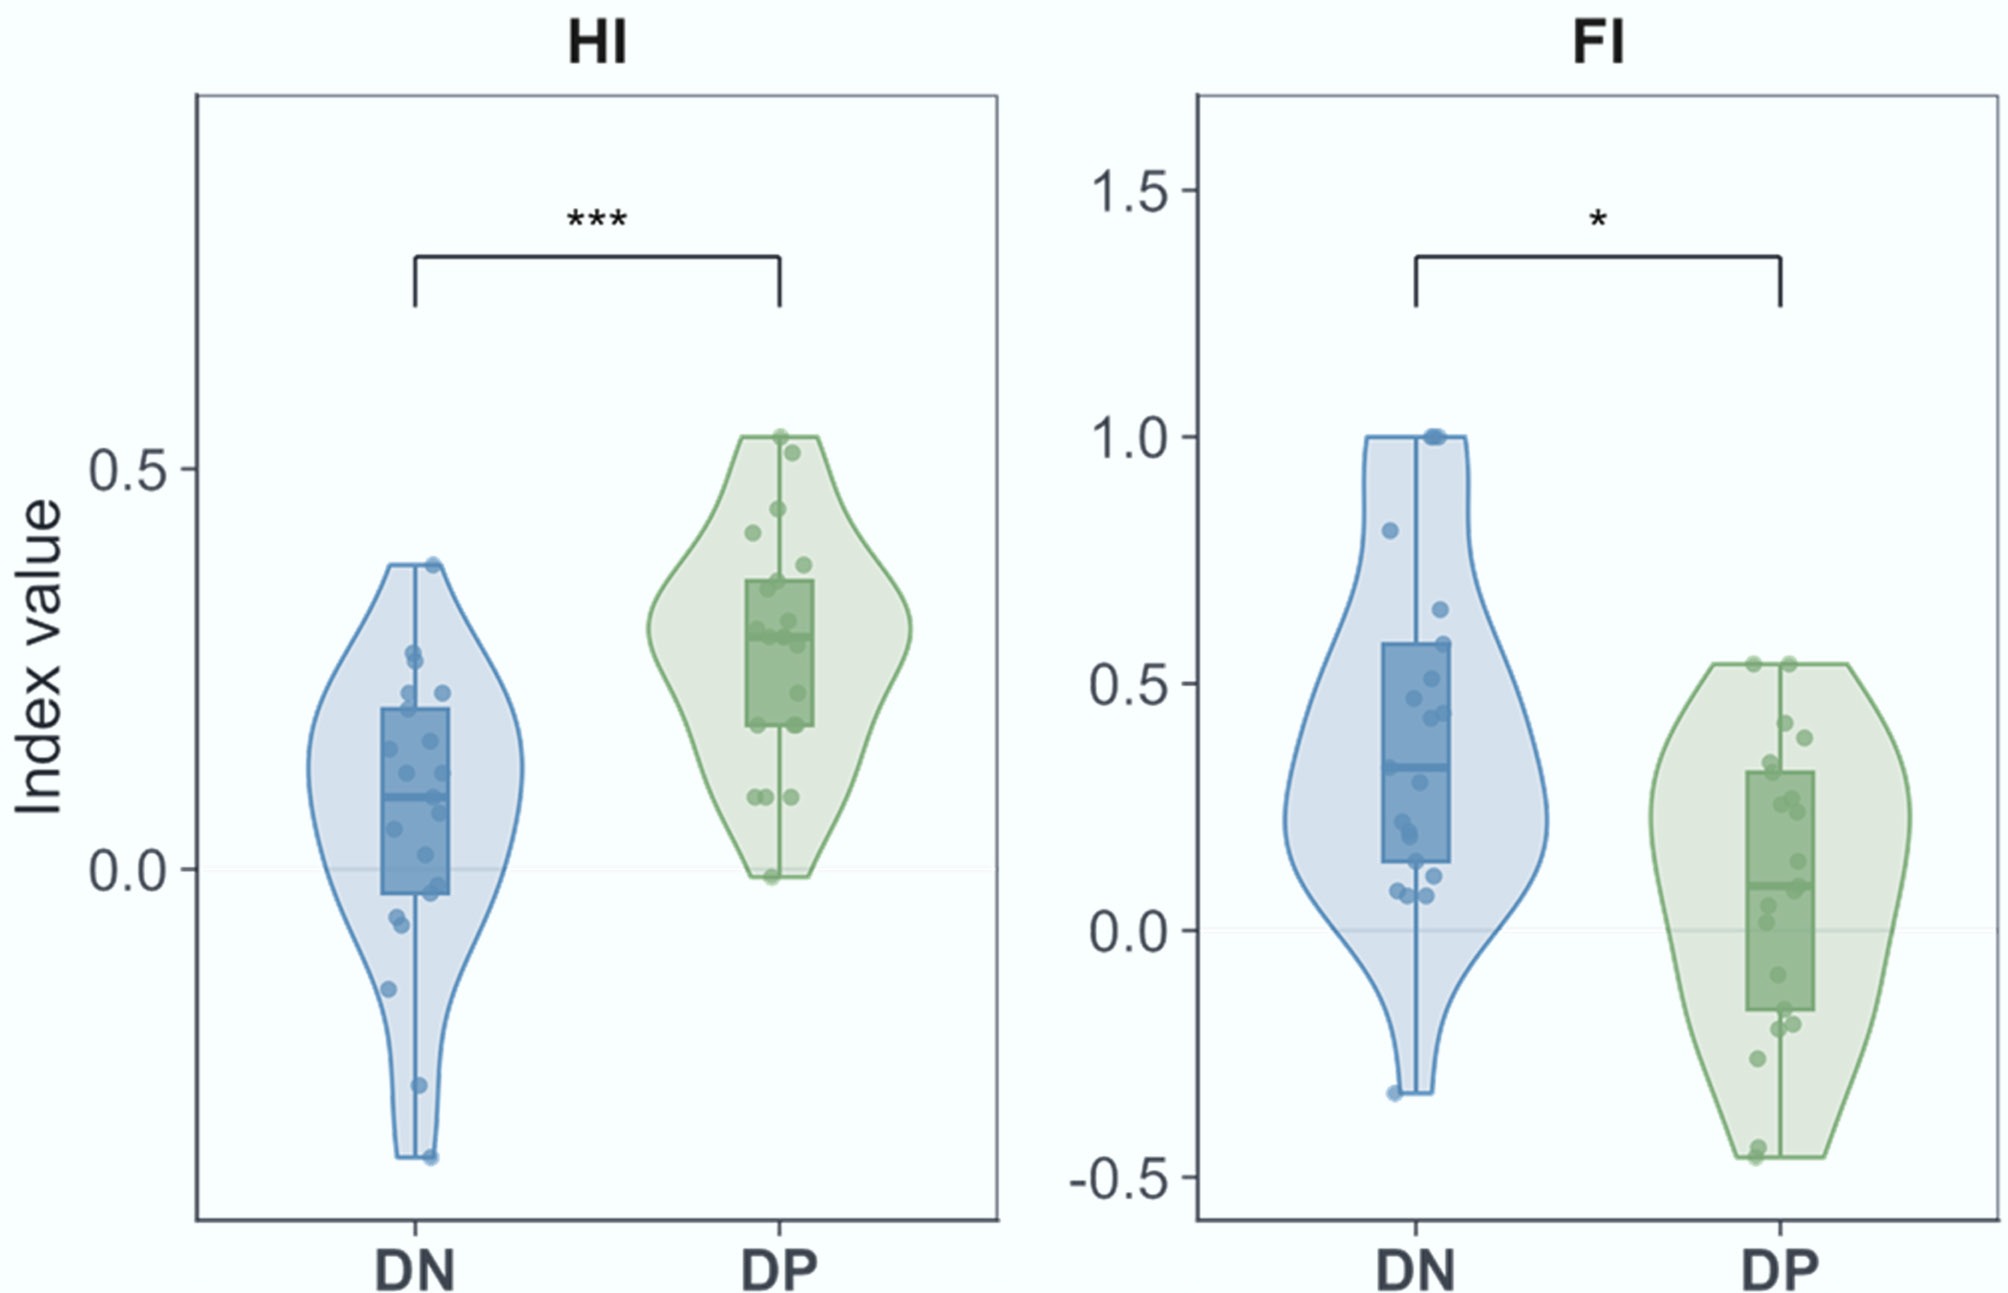
Figure 5.
Hysteresis index (HI) and flushing index (FI) for DN and DP. * p < 0.05; *** p < 0.001.
-
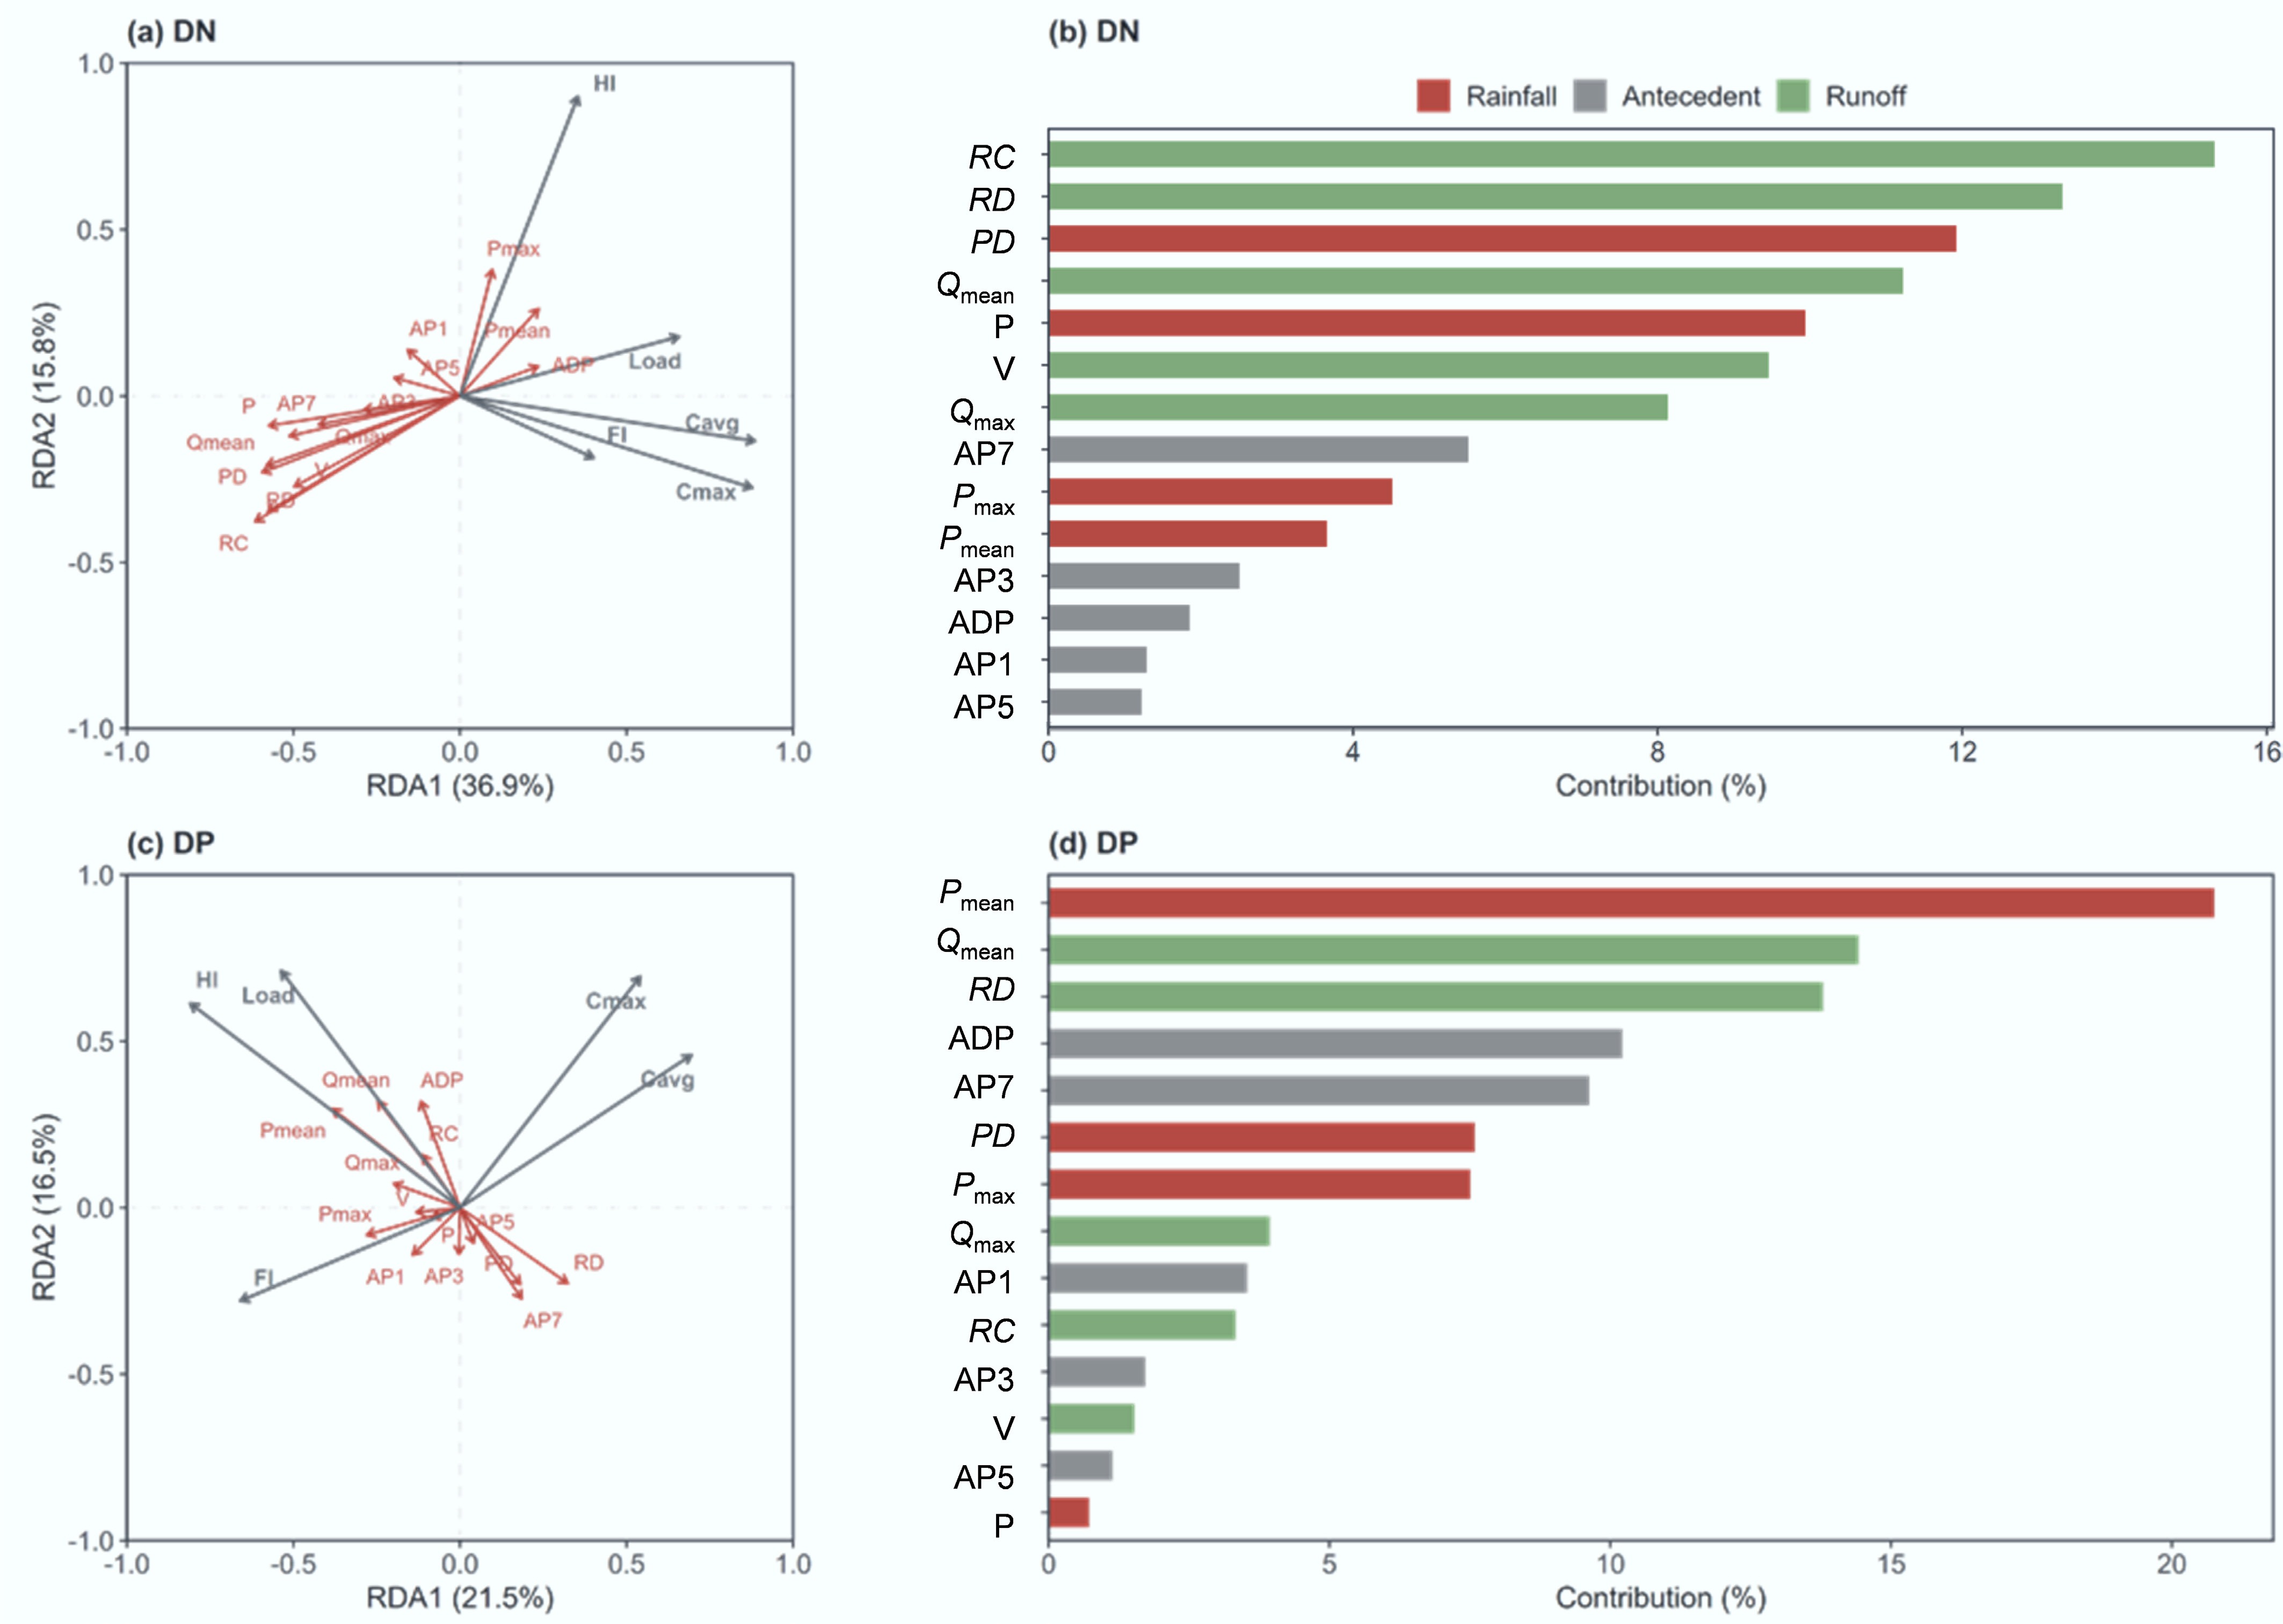
Figure 6.
Exploratory redundancy analysis (RDA) and descriptive variance partitioning of hydro-meteorological driver gradients for (a) DN, and (b) DP export. The full constrained models did not reach statistical significance in 999-permutation tests at n = 21, so the ordinations are interpreted as driver-gradient summaries rather than confirmatory predictor tests. Variance-partitioning values are relative shares of constrained variance.
-
Category Abbr. Description (unit) Mean Max Min SD Rainfall P Total precipitation (mm) 28.35 101.5 5.83 22.09 PD Precipitation duration (h) 3.86 14.6 0.42 3.89 Pmean Mean precipitation intensity (mm h−1) 12.51 47.2 2.96 12.92 Pmax Maximum 5-min precipitation intensity (mm h−1) 94.51 247.9 24.6 64.49 Antecedent ADP Antecedent dry period (d) 5.11 20.0 0.1 4.61 AP1 Precipitation in previous 1 d (mm) 5.33 58.79 0 13.54 AP3 Precipitation in previous 3 d (mm) 9.39 58.79 0 13.90 AP5 Precipitation in previous 5 d (mm) 15.09 101.52 0 13.96 AP7 Precipitation in previous 7 d (mm) 21.83 101.52 5 25.78 Runoff RD Runoff duration (h) 16.37 59.2 1.0 17.01 V Cumulative flow volume (m³) 3,848.7 24,709 25 5,957.1 Qmax Maximum flow (m3 s−1) 0.169 0.812 0.007 0.201 Qmean Mean flow (m3 s−1) 0.066 0.175 0.003 0.062 RC Runoff coefficient 0.806 2.594 0.022 0.848 Table 1.
Hydro-meteorological variables used in the redundancy analysis
Figures
(6)
Tables
(1)