










-
Diffuse nutrient pollution remains a persistent barrier to improving surface-water quality after decades of point-source control. Enrichment by nitrogen (N) and phosphorus (P) drives eutrophication, alters aquatic food webs, and complicates drinking-water reservoir protection[1,2]. In China, rural nutrient emissions have intensified with fertilizer use, livestock production, and domestic wastewater generation[3−6]. The pressure is especially acute in densely settled, water-rich regions of eastern China, where villages are embedded in drainage networks connecting households, gardens, cropland, ponds, streams, and reservoirs. Similar storm-dominated nutrient pulses have been reported from rural, agricultural, and peri-urban headwaters in North America and Europe, where storm events can dominate annual N and P export and the two nutrients respond asynchronously within the same hydrograph[7,8]. Phosphorus export in those settings tracks the size of the readily mobilizable surface pool, whereas nitrate export is sustained by well-connected subsurface and legacy stores[9,10]. The divergence between N and P export during storms is therefore a general feature of small, source-dense catchments rather than a purely Chinese phenomenon, yet it has rarely been resolved at the village scale. Storms are not simply short disturbances around a stable background. They can be the brief periods when stored nutrients become connected to receiving waters. Monthly or seasonal monitoring can underestimate these pulses, even though they may determine whether nutrients retained within villages remain local or move downstream. Understanding event-scale mobilization in villages is therefore important for nitrogen cycling, eutrophication prevention, and targeted non-point source (NPS) pollution control.
Villages differ from cropland and urban catchments because domestic, agricultural, and drainage functions coexist within a small area. Domestic sewage, livestock waste, refuse storage, and over-fertilized vegetable plots can supply soluble and particulate nutrients[4,5,11]. Roofs, hardened yards, and roads are interlaced with gardens, cropland, ditches, and ponds. This surface mosaic creates short flow routes during storm onset while activating slower soil, ditch, and pond pathways as rainfall continues. Average concentrations or seasonal loads can therefore miss the central export mechanism, because nutrients reach the outlet only when source availability, mobilization, and hydrological connectivity coincide. Ponds and ditches further complicate this process because they can shift from flow-convergence zones during peak runoff to temporary retention zones during slower drainage. Village nutrient loss should therefore be analyzed along the source–mobilization–connectivity–retention–delivery chain rather than as a single end-of-pipe load[7,12−14].
DN and DP can diverge within the same storm because different processes mobilize and retain them. Dissolved N is generally more soluble and less strongly adsorbed than P, so it can move with surface runoff, interflow, and subsurface flow[12,15,16]. Dissolved P is more closely tied to adsorption-desorption, particle detachment, rainfall energy, and antecedent wet-dry history[17,18]. These contrasts imply different limiting controls. DN export may be transport-limited when mobile N is present, but delivery depends on hydrological connection to the outlet. DP export may be source-limited when transport occurs, but the readily mobilizable dissolved-P pool is constrained by adsorption, desorption, particle interaction, or source exhaustion[19,20]. Concentration–discharge (C–Q) hysteresis can reveal these event-scale controls from the timing of concentration and discharge responses[21,22]. Clockwise loops indicate rapid near-source delivery, counter-clockwise loops indicate delayed distal or subsurface delivery, and figure-eight loops indicate multiple pathways within one event[23−25]. However, loop shape alone cannot separate transport activation from source limitation in a heterogeneous village drainage system. Quantitative hysteresis and flushing metrics are therefore needed to translate loop shape into mechanistic inference[26].
To address this gap, we selected Dai Village in the Jurong Reservoir catchment of eastern China, a densely settled village typical of the region, and monitored 21 rainfall-runoff events at high frequency during the rainy seasons of 2011 and 2012. The study had three objectives: (1) to quantify event concentrations and loads of DN and DP and to determine whether the two nutrients diverge during the same events; (2) to characterize their concentration-discharge behavior using loop classification together with the hysteresis index (HI) and the flushing index (FI), and to identify the stage of the export chain at which each nutrient is constrained; and (3) to examine how rainfall forcing, runoff connectivity, and antecedent moisture align with DN and DP responses, using redundancy analysis as exploratory driver-gradient support. Because both nutrients were measured at the same outlet, during the same events, and under the same rainfall forcing, DN and DP export could be compared directly. The intended outcome is practical, namely to establish whether village nutrient control should apply the same measures to N and P, and at which point along the source-to-outlet chain each measure should act.
-
The study was conducted in Dai Village, an eastern Chinese village in the Jurong Reservoir catchment, Jiangsu Province (32°01′ N, 119°13′ E; Fig. 1). The monitoring was conducted during 2011–2012, before later rural sanitation and wastewater-management upgrades were widely implemented in many Chinese villages; the results should therefore be interpreted as an event-scale record of the village drainage and waste-management context at that time. The region has a northern subtropical monsoon climate, with a mean annual temperature of 15.1 °C and mean annual precipitation of 1,018.6 mm, mainly from June to August. The monitored catchment covers 11.28 ha and has 466 permanent residents and about 1,300 livestock[11]. Its rural landscape includes scattered houses, hardened roads and yards, small vegetable gardens, cropland, and a ditch-pond drainage system. Stormwater drains through surface ditches into an outlet pond (Fig. 1), then into a downstream creek and the Jurong Reservoir. This outlet configuration made it possible to monitor the integrated response of the village drainage system rather than isolated responses from individual source areas. Untreated domestic sewage, open-air storage of human and animal waste, and over-fertilized vegetable plots make the village a concentrated mixed source of N and P. The coexistence of impervious surfaces, cultivated soils, and ponded drainage also provides a suitable setting for testing whether dissolved N and P are limited by transport activation or by source release during rainfall-runoff events.
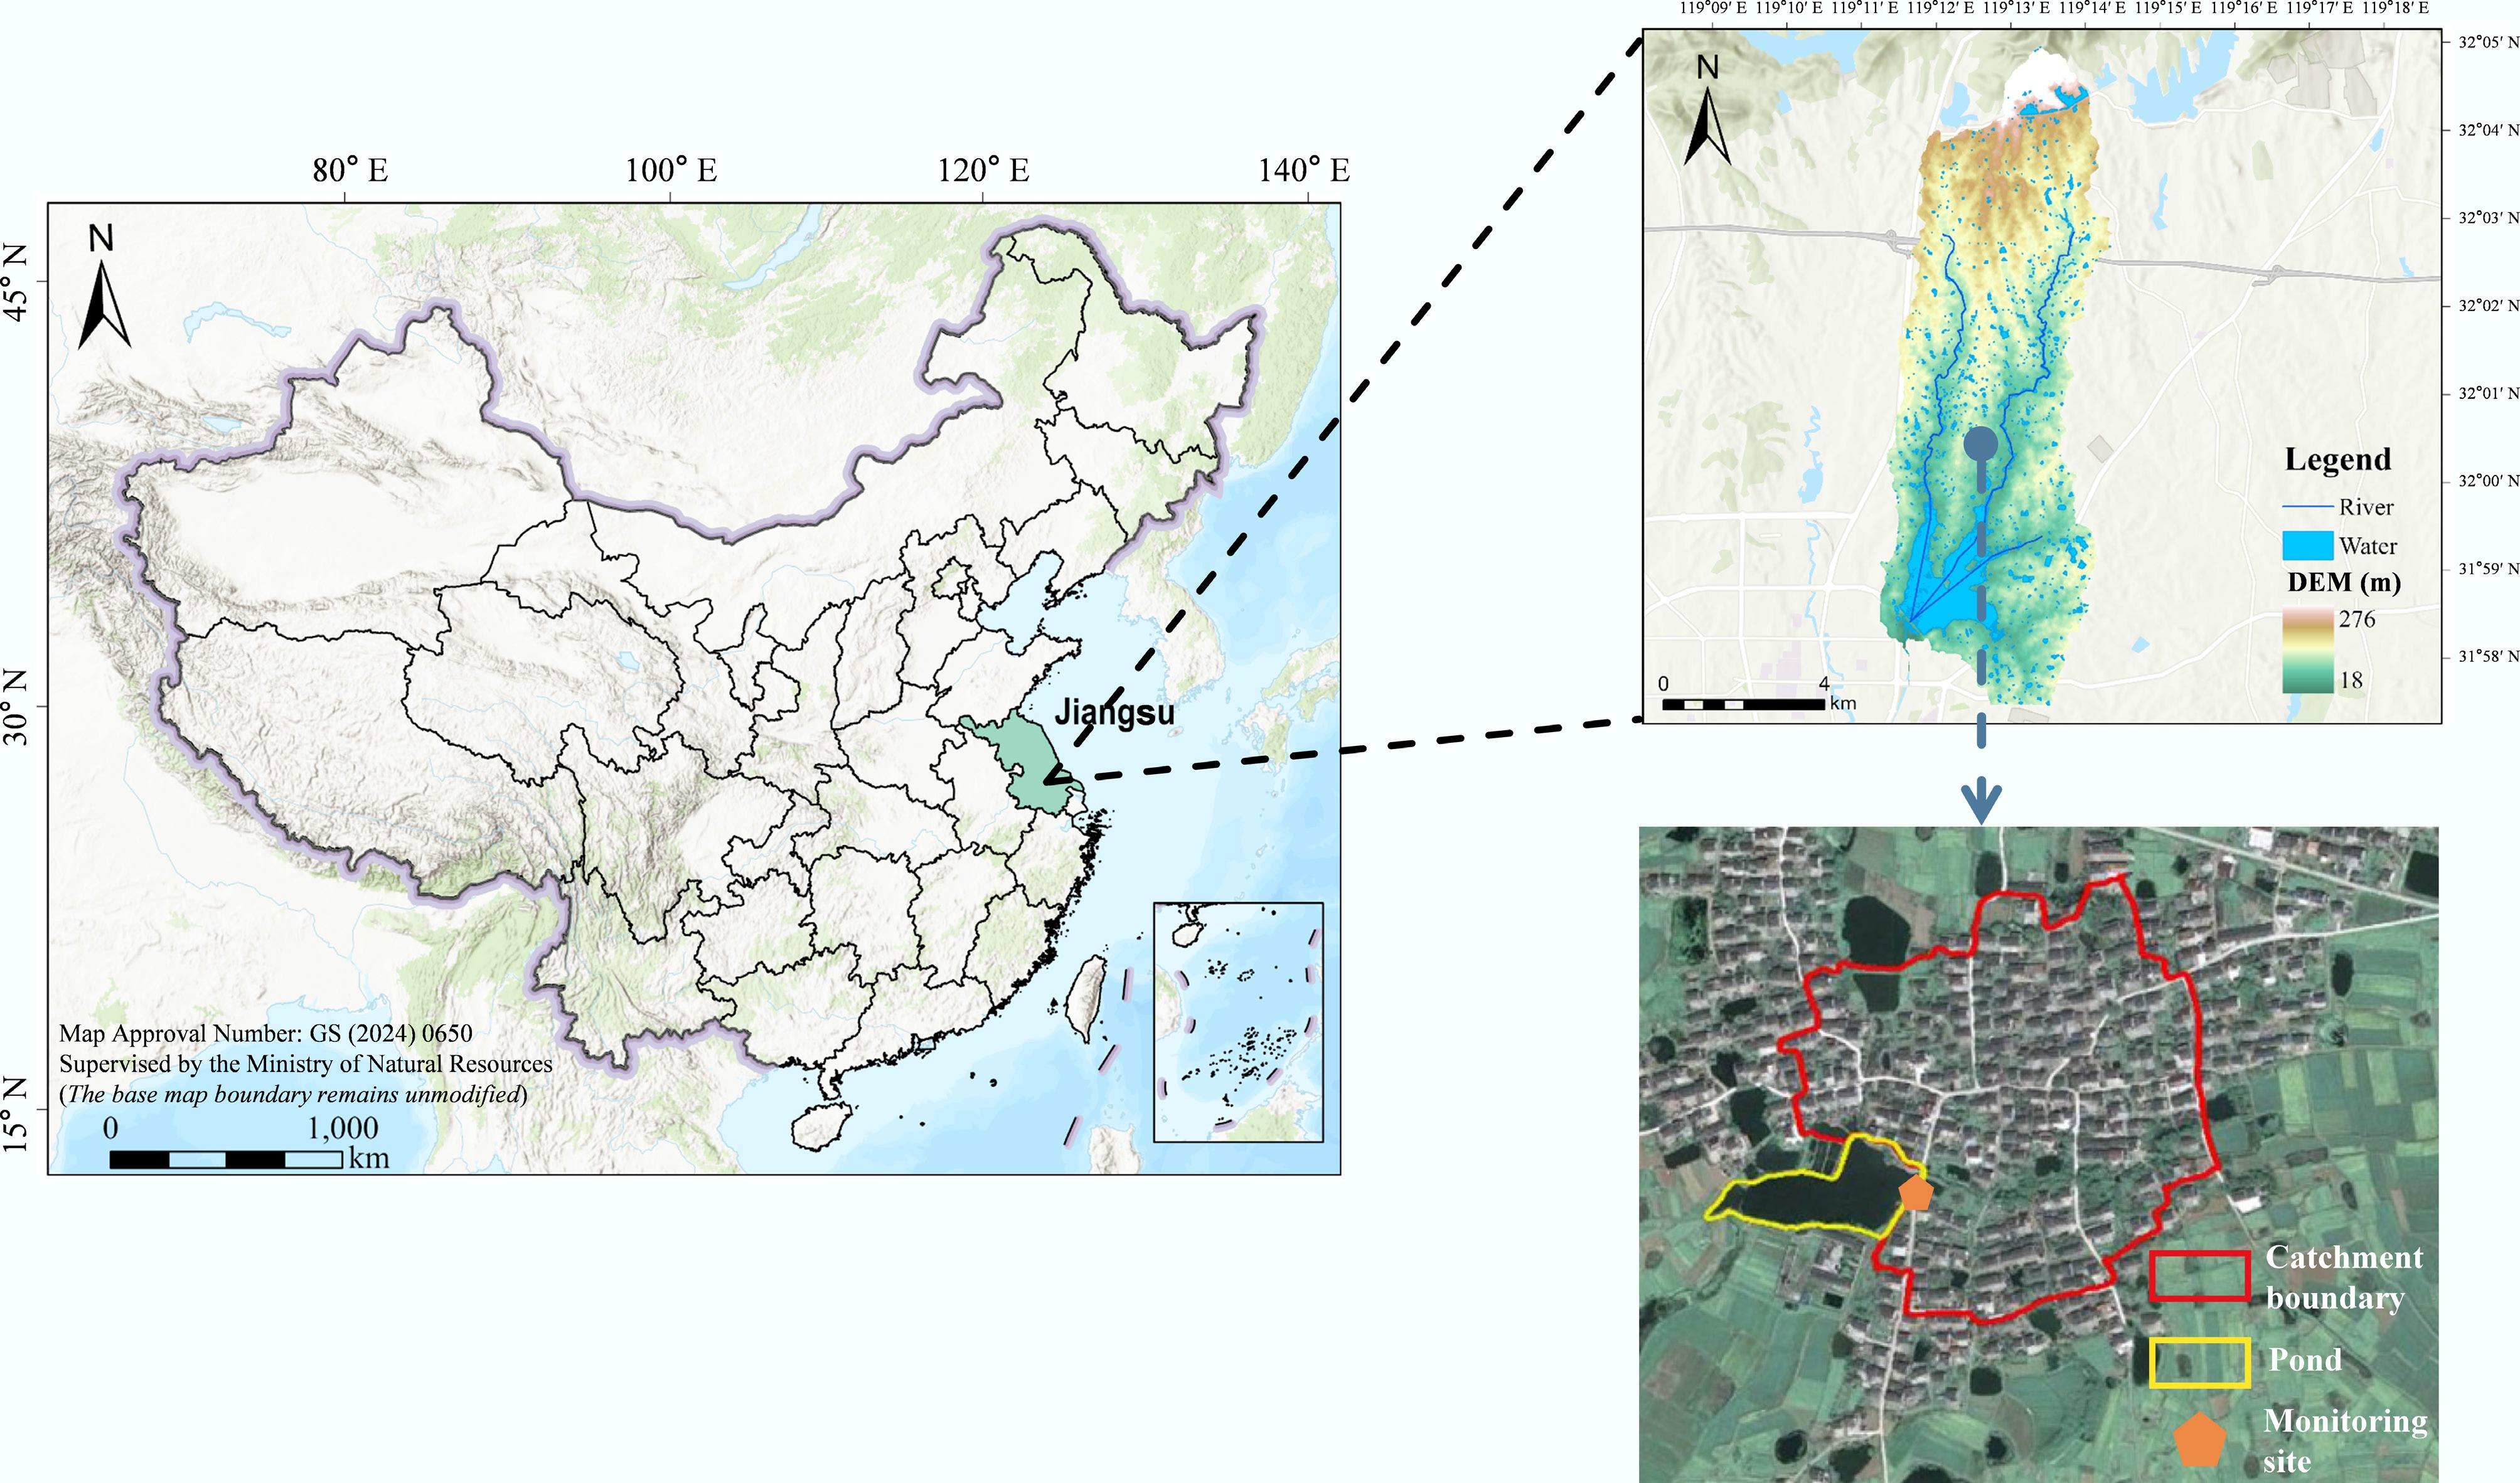
Figure 1.
Study area and outlet monitoring location in Dai Village, Jurong Reservoir catchment, eastern China. The panels show the national and provincial location, catchment elevation (DEM, m), and the village-scale catchment boundary, pond, and monitoring site. The China administrative boundary panel is based on the standard map with approval number GS (2024) 0650, downloaded from the Standard Map Service website of the Ministry of Natural Resources of China. The base map was not altered.
Sample collection and analysis
-
Rainfall-runoff was monitored at high frequency during the rainy seasons (June–August) of 2011 and 2012, capturing 21 storm events. The sampling campaign was designed specifically for rainfall-runoff periods; no routine non-event, dry-weather, or baseflow water samples were collected. Rainfall amount and intensity were recorded at 5-min resolution by an automatic weather station (Vantage Pro 2, Davis Instruments, USA) near the sampling site. Discharge was monitored at the channel entering the outlet pond, where runoff from the village drainage network converged. Instantaneous flow was calculated by the velocity-area method. Flow velocity was measured at three verticals (left one-third, mid-channel, and right two-thirds) with a rotating-cup current meter (LS45A, Chongqing Hydrological Instrument Factory), and synchronous stage was used to compute cross-sectional area. Because the village drainage carries continuous untreated domestic sewage and also conveys water released from the outlet pond, event runoff volume at the monitoring section is not derived from event rainfall alone. The event runoff coefficient is therefore defined as the ratio of event runoff volume to event rainfall volume over the catchment and can exceed unity (maximum 2.59).
A flow-responsive sampling strategy was used to capture pollutant dynamics during the periods when concentration changes were expected to be fastest. Sampling intervals were shortened to 5–10 min on the rising limb and extended to 1–2 h on the falling limb until runoff ceased. Water was collected 5 cm below the surface at the channel centre, stored in acid-washed polyethylene bottles at 4 °C in the dark, transported to the laboratory within 24 h, and filtered through 0.45-μm cellulose acetate membranes. DN was measured by alkaline potassium persulfate digestion-UV spectrophotometry (GB 11894-89), and DP by the molybdenum-antimony anti-spectrophotometric method (GB 11893-89). The nominal method detection limits specified by these national methods are 0.050 mg L−1 for N and 0.01 mg L−1 for P when a 25-mL sample is used. Laboratory quality assurance and quality control (QA/QC) followed the corresponding national standard methods. Instrument response was checked with calibration standards, reagent blanks were used to screen for possible contamination, and duplicate measurements were used to evaluate analytical repeatability. Samples were re-analyzed when concentrations fell outside the calibration range, blank checks indicated possible contamination, or replicate readings were unstable. These quality-control steps were applied consistently to DN and DP analyses. The high-frequency design was essential because fixed-interval sampling would likely miss the short windows when first flushing, dilution, or delayed subsurface delivery changes the direction of the C–Q relationship.
Data analysis
Export indices
-
Event mean concentration (Cavg), maximum concentration (Cmax), and total load were used to quantify export intensity, peak pollution level, and export magnitude. Cavg represents the flow-weighted concentration over a storm event, whereas Cmax captures short-term concentration peaks that may be ecologically important even when event-average concentrations are lower. Load integrates concentration and runoff volume and therefore reflects the actual mass delivered from the village outlet:
$ C_{\text{avg}}=\dfrac{M}{V}=\dfrac{\sum_{ }^{ }\left(C_t\cdot Q_t\cdot\Delta t\right)}{\sum_{ }^{ }\left(Q_t\cdot\Delta t\right)}, $ (1) where, M is total pollutant load (kg), V is total event runoff (m3), and Ct and Qt are concentration (mg L−1) and discharge (m3 s−1) at time t over event duration T (s), respectively.
$ C_{\max}=\max\left(C_1,C_2,\ldots,C_n\right),\ $ (2) $ \text{Load}=\sum_{ }^{ }\left(C_t\cdot Q_t\cdot\text{Δ}t\right)\times10^{-3}, $ (3) where, Ct is in mg L−1, the discharge volume Qt · Δt is in m3, and 10−3 converts the product to kg. These indices were calculated separately for DN and DP for each monitored storm event.
Quantifying the flushing-hysteresis effect
-
Transport mode was first classified by the shape of each C–Q loop. Clockwise hysteresis indicates rapid near-source flushing, counter-clockwise hysteresis indicates delayed delivery from distal or subsurface sources, figure-eight hysteresis reflects multiple pathways, and complex hysteresis usually reflects rainfall fluctuation or switching source-sink mechanisms[24]. Because visual loop classification can be subjective, we combined loop morphology with quantitative indices that describe both direction and flushing strength. This combination is particularly useful in village systems, where multiple sources and pathways can produce similar loop shapes.
We quantified hysteresis direction and magnitude using the normalized hysteresis index (HI) of Lloyd et al.[23]. Discharge and concentration were normalized to remove dimensional differences. Normalized discharge was divided into 2% intervals, producing 50 discharge classes that balanced loop resolution with noise from uneven high-frequency sampling. This interval-based discretization of normalized discharge is the standard implementation of the Lloyd et al. index and has been applied across a wide range of catchments and solutes[22,24,25]. The 2% width was chosen to match the density of the flow-responsive sampling scheme, which collected samples every 5–10 min on the rising limb, so that loop detail is retained without leaving discharge classes unpopulated during the more sparsely sampled recession. The integrated difference between normalized rising- and falling-limb concentrations was then computed:
$ \text{HI}=\dfrac{1}{n}\sum_{ }^{ }\left(C_{j\text{,rising}}-C_{j\text{,falling}}\right), $ (4) where, n is the number of discharge intervals, and Cj, rising and Cj, falling are normalized concentrations on the rising and falling limbs in interval j. HI ranges from −1 to 1. HI > 0 denotes clockwise hysteresis, HI < 0 denotes counter-clockwise hysteresis, and values near 0 indicate weak net hysteresis; in those cases, the original loop morphology was retained to distinguish no hysteresis from symmetric figure-eight behavior[27].
$ \text{FI}=C\left({Q}_{\text{peak}}\right)-C\left({Q}_{\text{initial}}\right) $ (5) We also used the flushing index (FI) to quantify early-storm first-flush behavior, defined as the difference between normalized concentration at peak discharge and at runoff initiation. Qinitial refers to the discharge at the onset of the hydrograph rise. Because the village drain carries continuous sewage-fed flow, discharge at the outlet is never zero, so Qinitial cannot be defined by a zero-flow threshold. Events were delimited from the continuous discharge record, and Qinitial was taken as the local discharge minimum immediately preceding the rainfall-driven rise, which is also the first sample collected once the flow-responsive sampling scheme was triggered. This follows the original formulation of the flushing index, in which the reference point is the onset of the hydrograph rise rather than a fixed discharge value[27], and it keeps FI comparable across events with different pre-event flow levels. FI ranges from −1 to 1. FI > 0 indicates flushing, whereas FI < 0 indicates dilution[27]. Combining HI and FI refines mechanism diagnosis: HI > 0 with FI > 0 indicates rapid near-source flushing; HI > 0 with FI < 0 indicates clockwise delivery with dilution or partial source exhaustion near peak flow; HI < 0 with FI > 0 indicates first flushing followed by delayed distal or subsurface contribution; and HI < 0 with FI < 0 indicates dilution at peak flow with delayed contribution during recession. Values near zero were interpreted together with visual loop class. Because HI and FI were paired across the same 21 events, DN and DP were compared with a paired Wilcoxon signed-rank test; significance levels are reported with the corresponding results.
Exploratory driver-gradient analysis
-
To summarize hydro-meteorological gradients associated with N and P export, we selected explanatory variables describing rainfall, antecedent moisture, and runoff characteristics (Table 1). The response variables were Cavg, Cmax, load, HI, and FI. This response set linked three aspects of event behavior: concentration level, export magnitude, and transport timing. The explanatory variables were grouped to distinguish rainfall forcing, antecedent wetness, and generated runoff because these variables represent successive conditions in event generation and delivery, from rainfall forcing to outlet runoff.
Table 1. Hydro-meteorological variables used in the redundancy analysis
Category Abbr. Description (unit) Mean Max Min SD Rainfall P Total precipitation (mm) 28.35 101.5 5.83 22.09 PD Precipitation duration (h) 3.86 14.6 0.42 3.89 Pmean Mean precipitation intensity (mm h−1) 12.51 47.2 2.96 12.92 Pmax Maximum 5-min precipitation intensity (mm h−1) 94.51 247.9 24.6 64.49 Antecedent ADP Antecedent dry period (d) 5.11 20.0 0.1 4.61 AP1 Precipitation in previous 1 d (mm) 5.33 58.79 0 13.54 AP3 Precipitation in previous 3 d (mm) 9.39 58.79 0 13.90 AP5 Precipitation in previous 5 d (mm) 15.09 101.52 0 13.96 AP7 Precipitation in previous 7 d (mm) 21.83 101.52 5 25.78 Runoff RD Runoff duration (h) 16.37 59.2 1.0 17.01 V Cumulative flow volume (m³) 3,848.7 24,709 25 5,957.1 Qmax Maximum flow (m3 s−1) 0.169 0.812 0.007 0.201 Qmean Mean flow (m3 s−1) 0.066 0.175 0.003 0.062 RC Runoff coefficient 0.806 2.594 0.022 0.848 After standardization, data suitability was evaluated using Kaiser–Meyer–Olkin and Bartlett sphericity tests. Collinearity was screened by removing variables with a variance inflation factor > 10. Redundancy analysis (RDA) and variance partitioning were used as exploratory ordination tools to summarize how export indices aligned with rainfall, antecedent moisture, and runoff gradients. The 14 predictors listed in Table 1 deliberately retain four antecedent rainfall windows (AP1, AP3, AP5, and AP7), which are mutually correlated but represent different antecedent time scales. Given 21 events and 14 predictors retained after screening, model degrees of freedom were limited. RDA was therefore interpreted descriptively together with the C–Q loops, HI, and FI metrics, rather than as a confirmatory model. The three driver groups are not statistically independent, because rainfall amount and intensity generate the runoff volume and runoff coefficient, and antecedent moisture modulates how efficiently rainfall is converted to runoff, so overlap among groups is expected on physical rather than purely statistical grounds. Variance partitioning was therefore used to quantify this overlap as shared fractions rather than to isolate independent effects. No higher-order interaction terms were fitted because they would be underpowered; potential overlap among driver groups was examined only through shared fractions in variance partitioning. Conclusions about event controls were based primarily on the observed concentration, load, HI, and FI patterns, with RDA used as supporting exploratory evidence. All analyses were performed in R.
-
Across the 21 storm events in 2011–2012, village runoff showed high dissolved nutrient concentrations and strong event variability (Fig. 2). DN dominated the dissolved nutrient pool in both concentration and load. Mean DN concentration was 6.84 mg L−1, 15.5 times the mean DP concentration (0.44 mg L−1), and mean peak concentrations were 10.07 mg L−1 for DN and 0.73 mg L−1 for DP. Even for dissolved fractions alone, these concentrations exceeded the Class V thresholds of the Chinese Environmental Quality Standards for Surface Water (GB 3838-2002; TN 2.0 mg L−1, TP 0.4 mg L−1). The concentration data therefore identified the village outlet as a high-risk pathway for nutrient delivery during storms. Loads varied more strongly than concentrations, showing that export magnitude was controlled by event hydrology as well as pollutant level. DN load ranged from 0.17 to 217.60 kg (mean 31.42 kg), and DP load ranged from 0.01 to 5.84 kg (mean 1.20 kg). The coefficients of variation for load (DN = 1.81, DP = 1.52) exceeded those for concentration (DN = 0.35, DP = 0.32). This contrast justified treating DN and DP separately in the subsequent hysteresis and driver analyses.
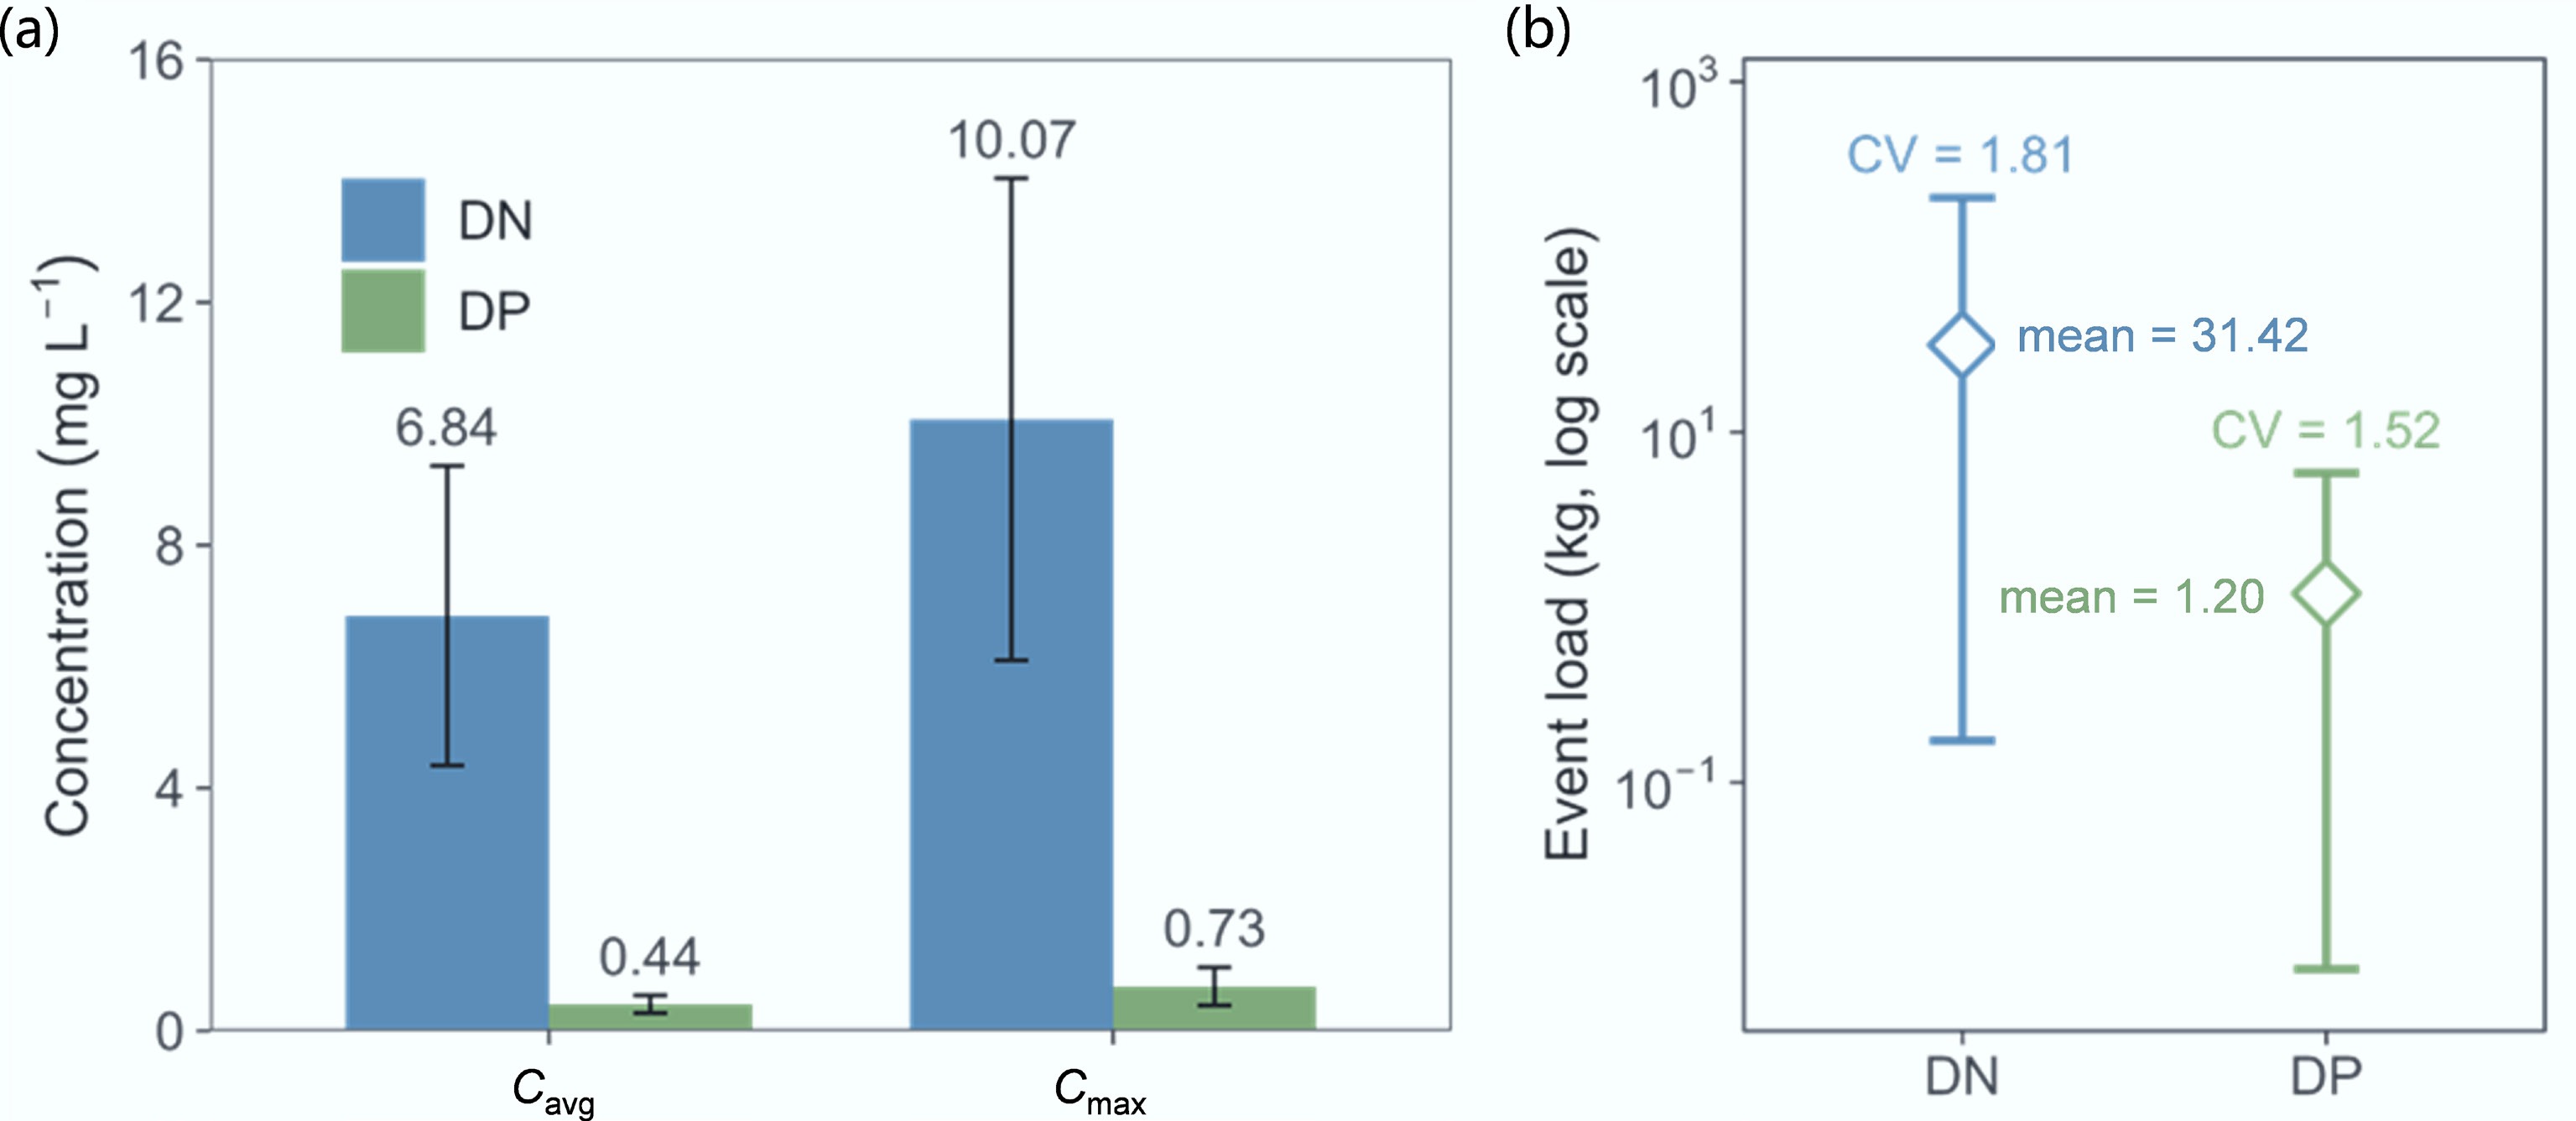
Figure 2.
Event-scale DN and DP export across the 21 rainfall-runoff events: (a) mean and peak concentrations (Cavg, Cmax); (b) event loads (log scale).
Hysteresis and flushing behavior
-
Classification of the C–Q loops showed diverse hysteresis patterns for both nutrients (Fig. 3). Figure-eight hysteresis was the most frequent pattern, occurring in eight events for DN and eight events for DP (38.1% each). Secondary patterns differed between nutrients. Clockwise hysteresis was more frequent for DP (seven events, 33.3%) than for DN (five events, 23.8%), whereas complex hysteresis was slightly more frequent for DN (6 events, 28.6%) than for DP (five events, 23.8%). Pure counter-clockwise hysteresis was least common for both nutrients (DN two events, 9.5%; DP one event, 4.8%).
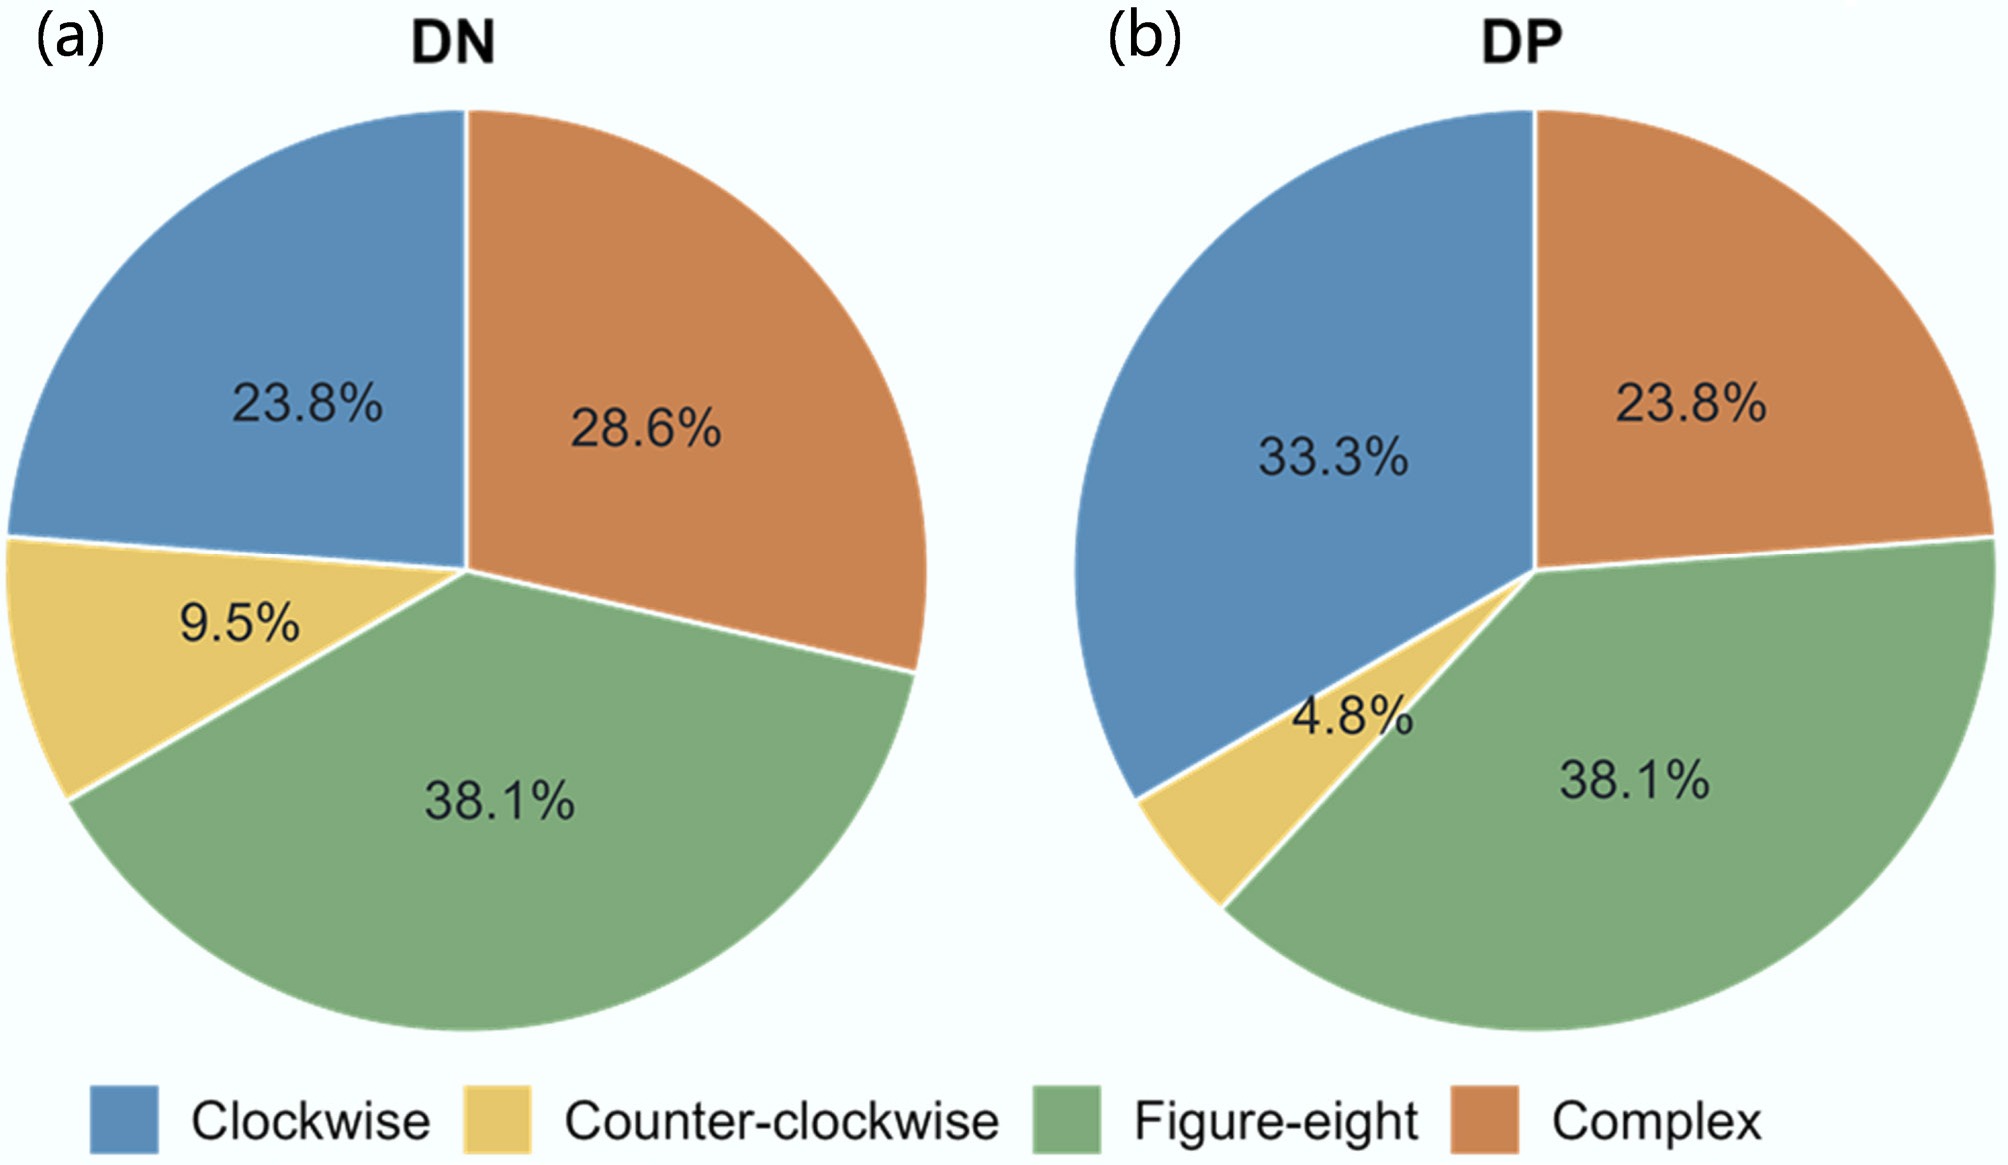
Figure 3.
Frequency of DN and DP concentration-discharge hysteresis patterns: (a) DN; (b) DP.
Three representative events illustrated how the same village outlet could produce different nutrient responses (Fig. 4). In Event 8, both DN and DP showed figure-eight loops with clear crossing between rising and falling limbs, indicating within-event pathway switching. In Event 17, DN traced a complex figure-eight pattern and concentrations remained high after peak discharge, whereas DP formed a closed clockwise loop, peaked before discharge, and declined rapidly during recession. In Event 11, the two nutrients had opposite loop directions. DP was clockwise, with higher rising-limb concentrations, whereas DN was counter-clockwise, with a concentration peak lagging discharge and higher falling-limb concentrations.
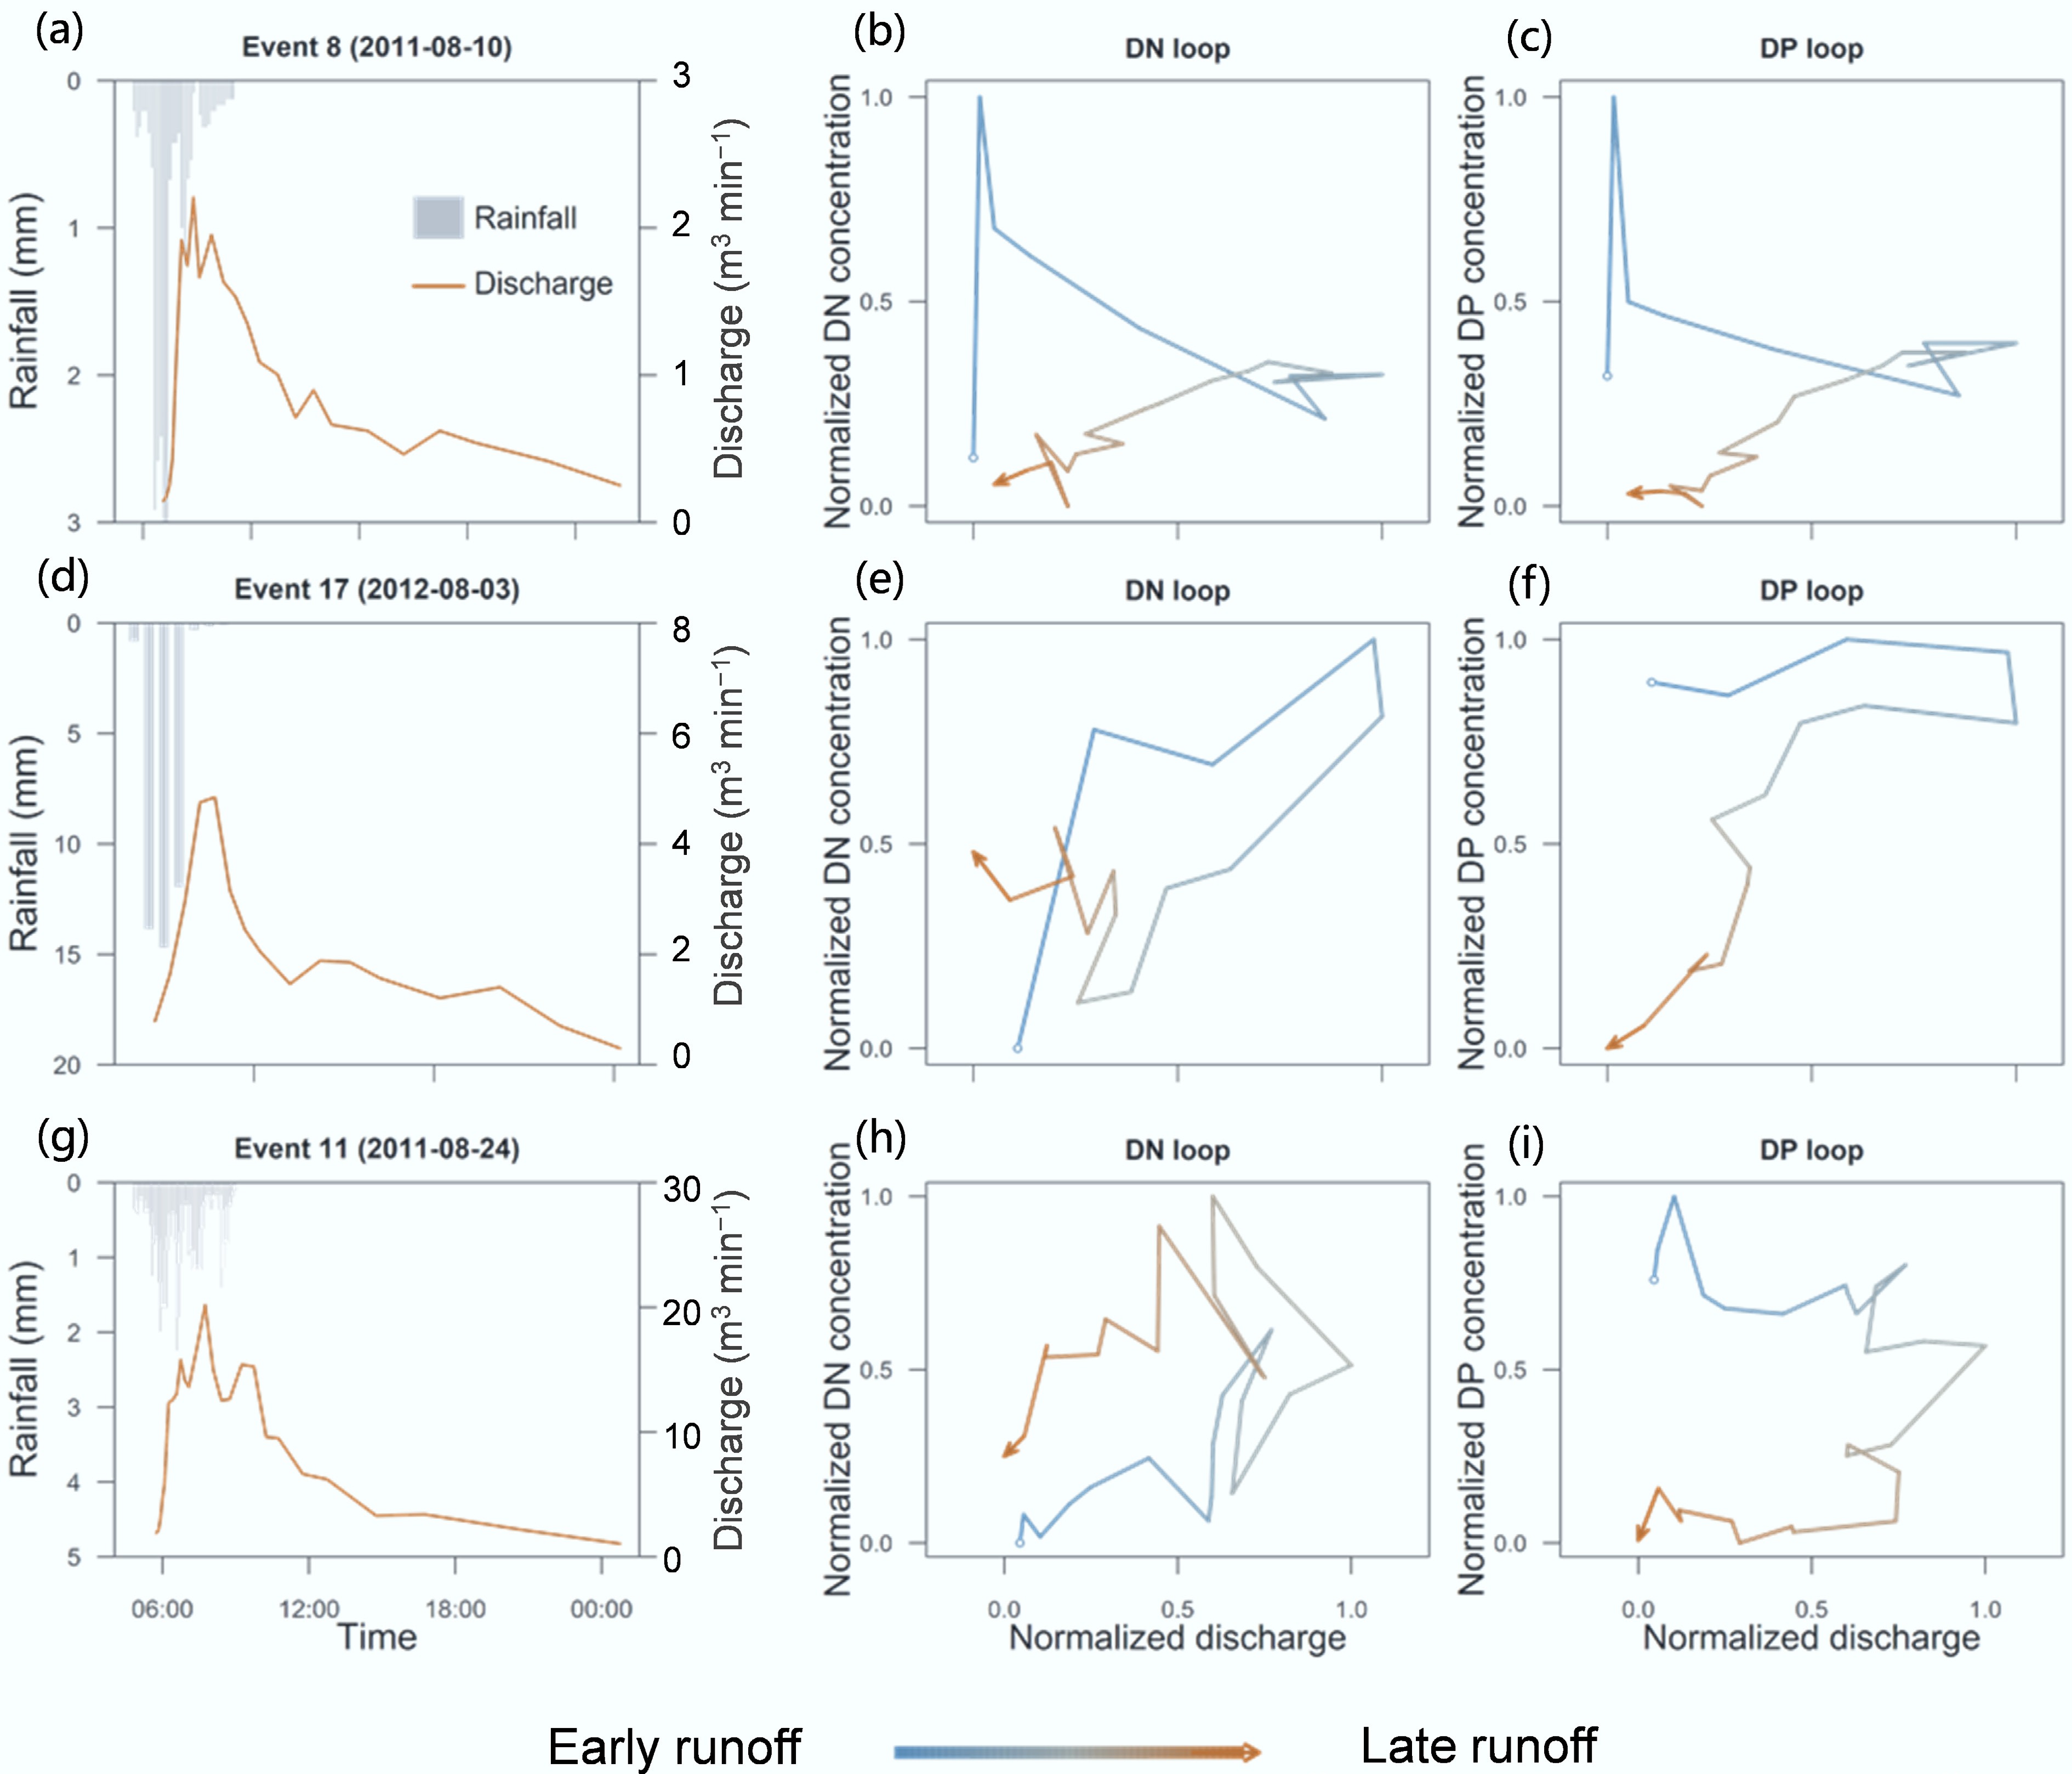
Figure 4.
Representative rainfall-runoff events and DN/DP concentration-discharge hysteresis loops for Events No. 8, 17, and 11: (a), (d), (g) rainfall and discharge; (b), (e), (h) DN loops; (c), (f), (i) DP loops.
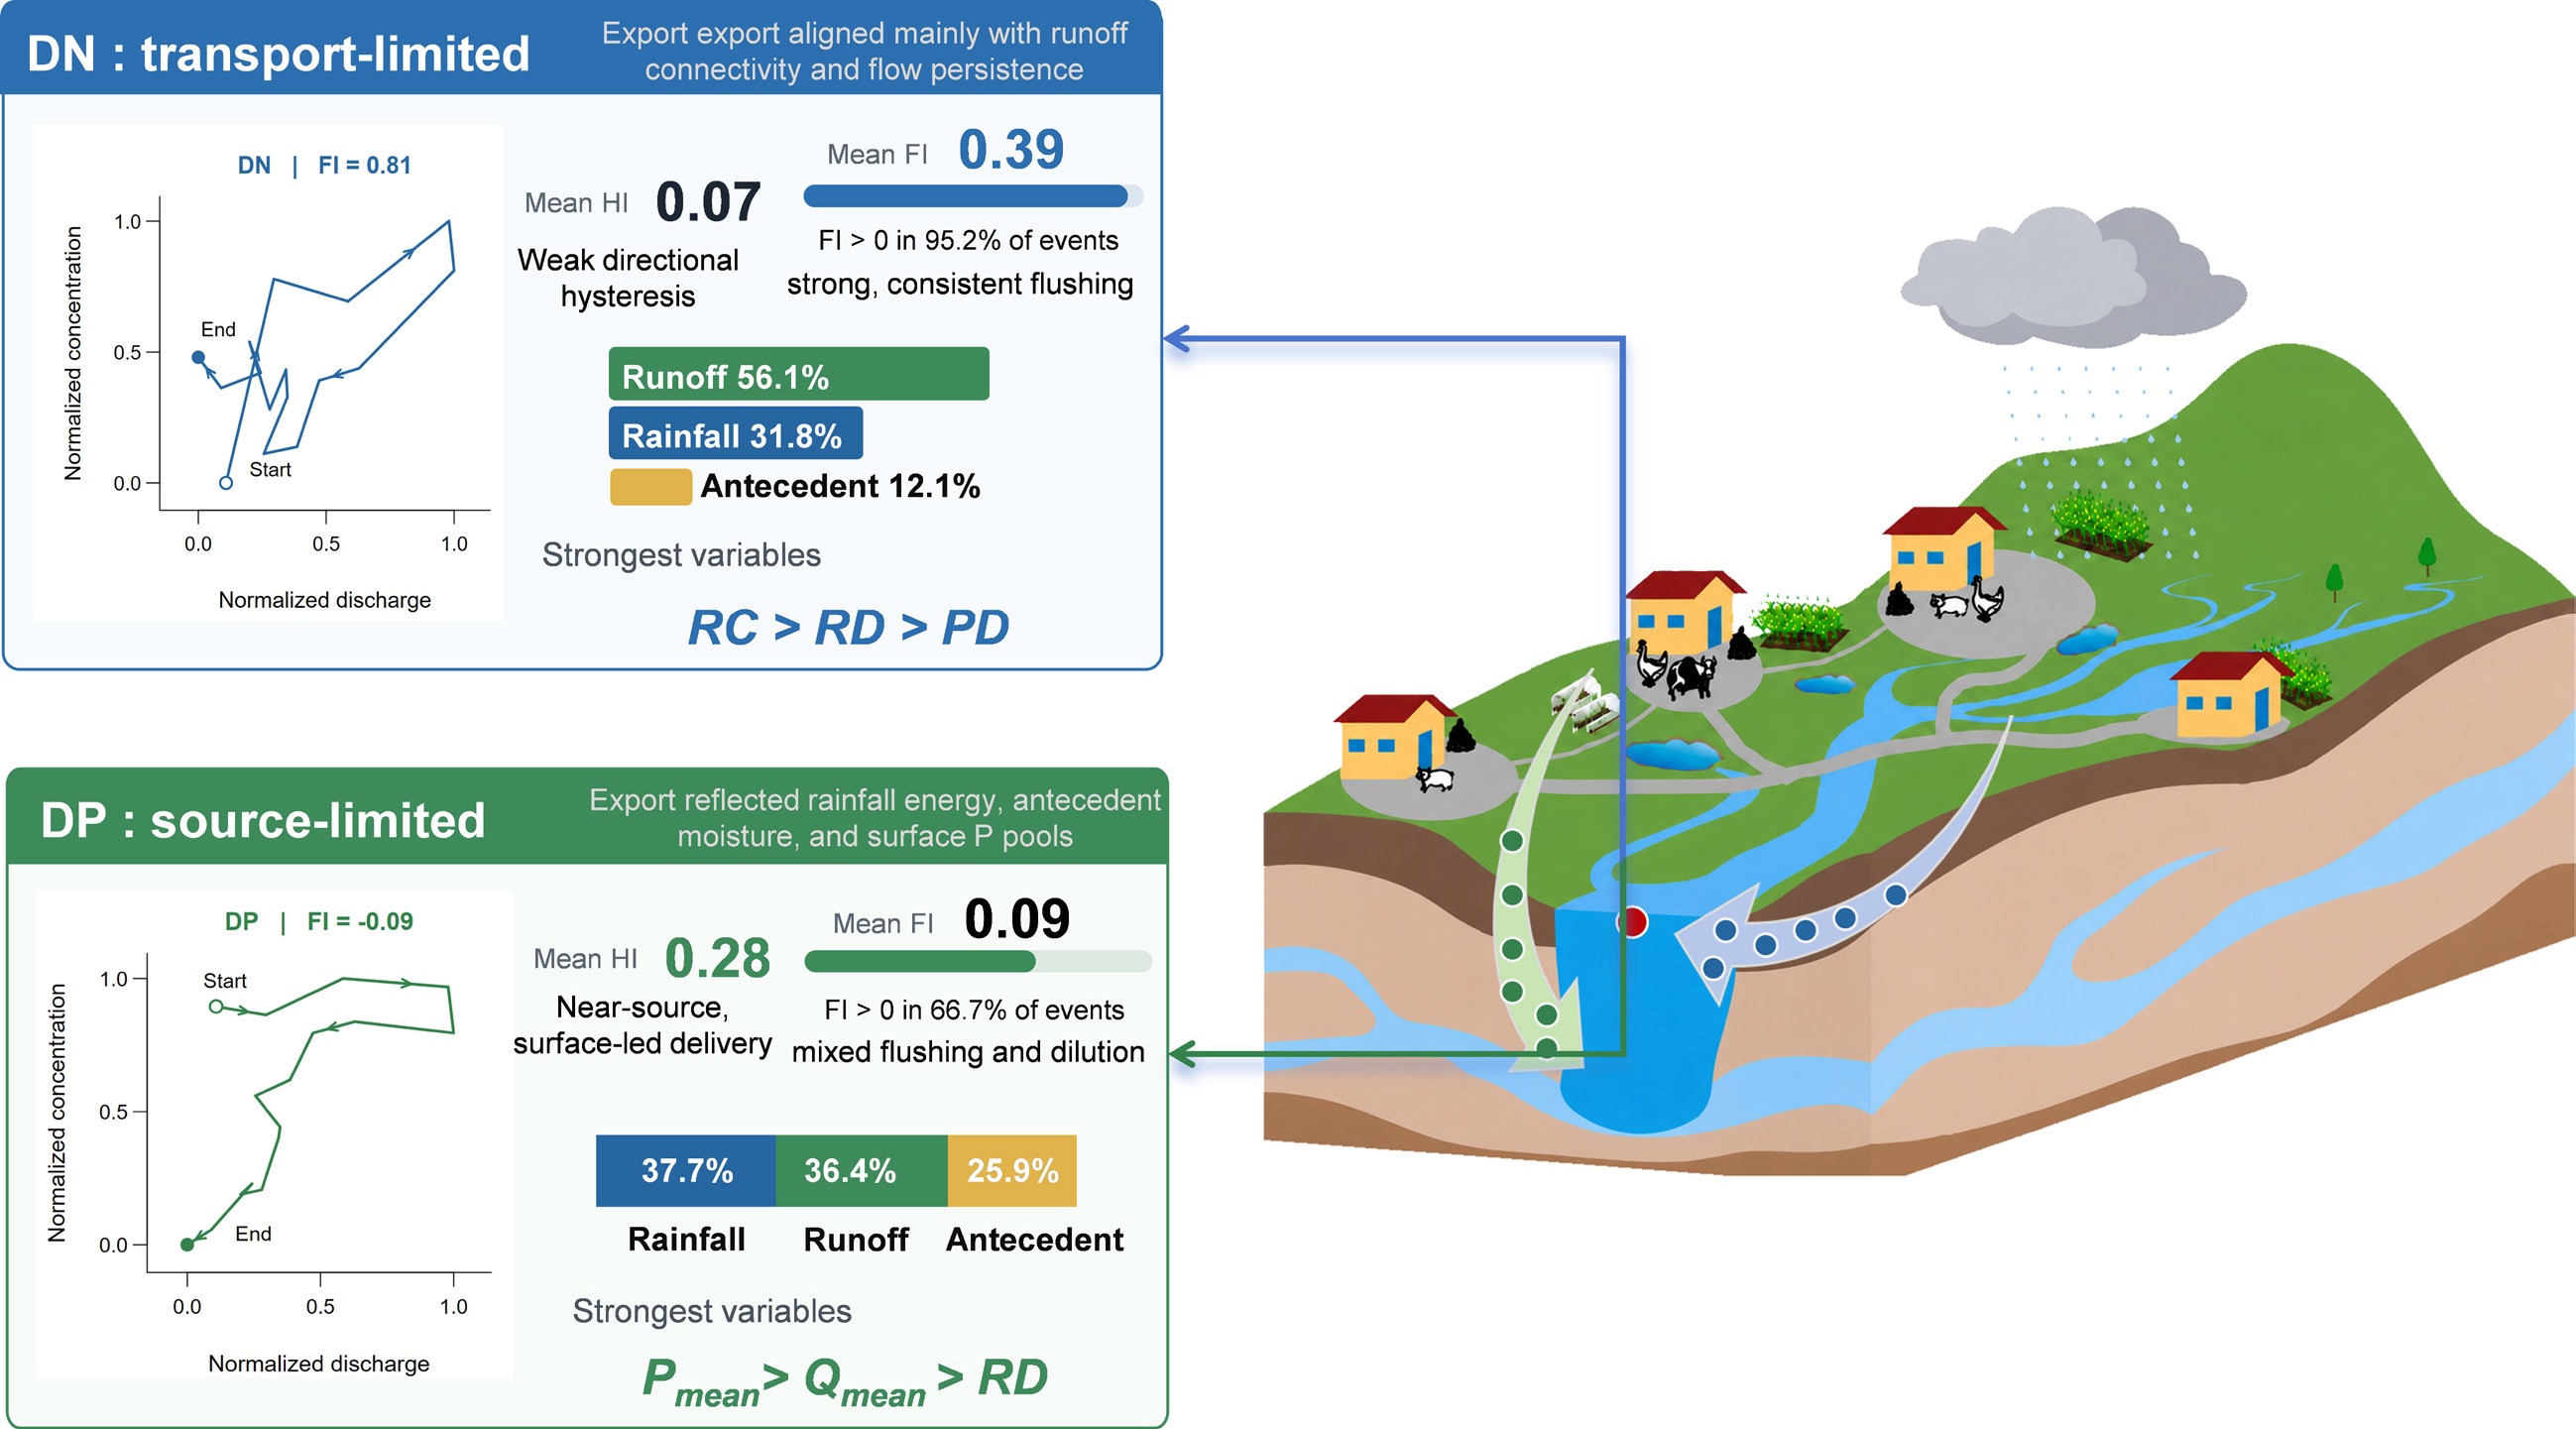
The representative events show why morphology alone is insufficient. Quantitative hysteresis metrics further separated nutrient-level behavior across all events (Fig. 5). Mean HI was significantly higher for DP (0.28) than for DN (0.07; p < 0.001). DP HI was predominantly positive (range −0.01 to 0.54), consistent with clockwise dominance, whereas DN HI varied around zero across a broader range (−0.36 to 0.38). Flushing behavior also differed. DN showed a strong and consistent flushing signal (mean FI 0.39; FI > 0 in 95.2% of events), with concentration increasing as runoff increased. DP flushing was weaker (mean FI 0.09; p = 0.012) and alternated between flushing and dilution (FI > 0 in 66.7% of events). Together, the loop classification and the HI/FI metrics show that DN and DP differed in transport timing as well as in export magnitude. The following section examines whether these contrasting signatures align with measurable hydro-meteorological gradients.
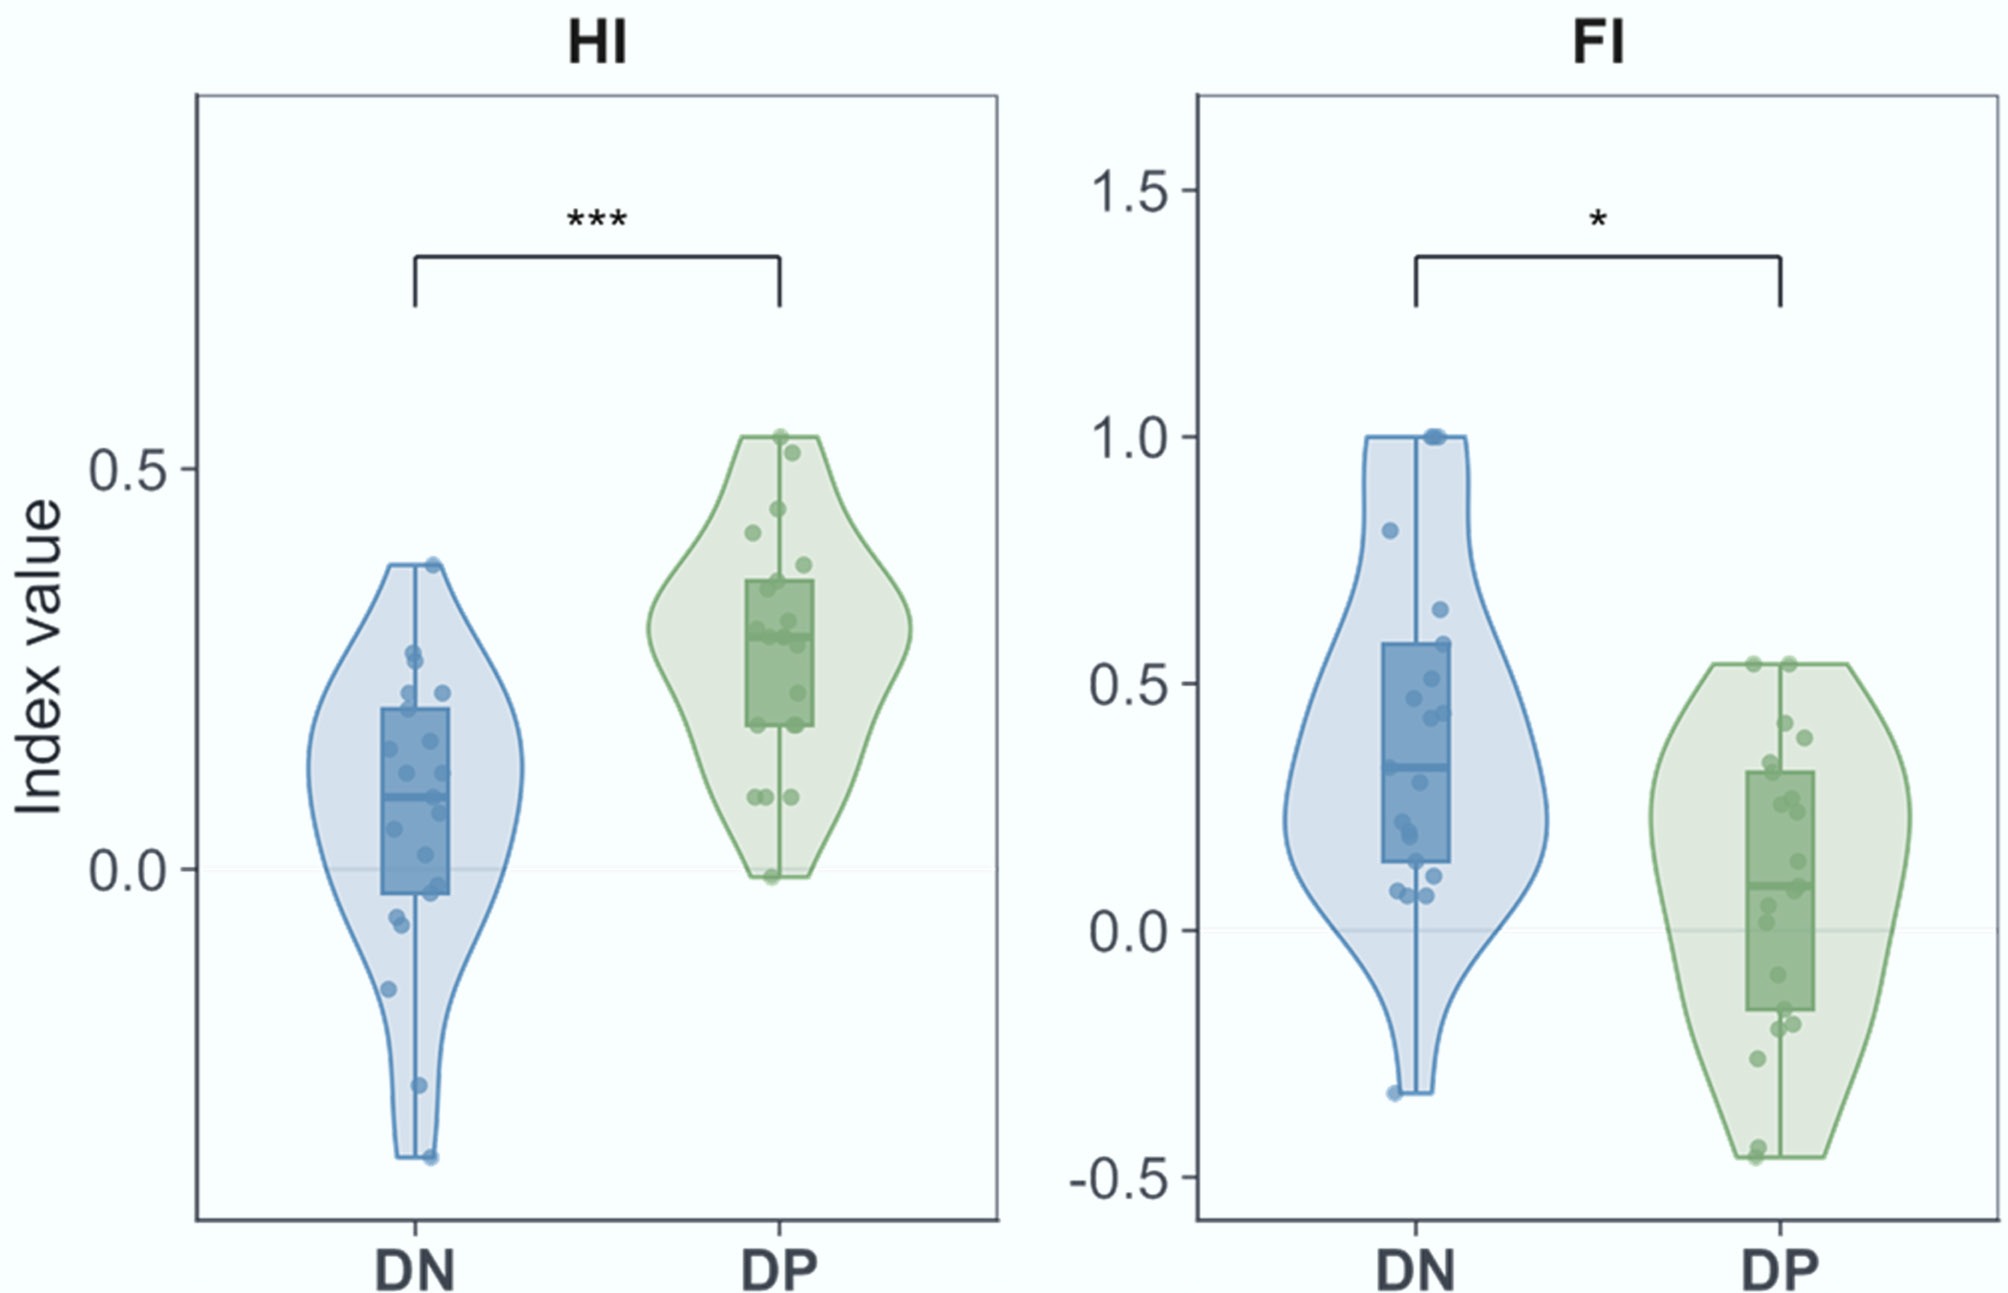
Figure 5.
Hysteresis index (HI) and flushing index (FI) for DN and DP. * p < 0.05; *** p < 0.001.
Exploratory hydro-meteorological driver gradients
-
Exploratory RDA was used to visualize hydro-meteorological gradients rather than to test predictor effects (Fig. 6). Consistent with this exploratory use, the full constrained models did not reach statistical significance in 999-permutation tests at n = 21, indicating that the ordinations should be read descriptively. The first two DN axes accounted for 52.7% of the variance (RDA1 36.9%, RDA2 15.8%). RDA1 was aligned mainly with runoff coefficient (RC), runoff duration (RD), and mean flow (Qmean), whereas RDA2 was aligned with maximum rainfall intensity (Pmax). Variable-importance ranking placed RC, RD, and precipitation duration (PD) highest. Descriptive variance partitioning placed runoff characteristics as the largest independent fraction for DN export (56.1%). Variance-partitioning values are reported as relative shares of the constrained variance of each model rather than as absolute explained variance, and shared fractions are not listed separately. Thus, DN export indices were most closely aligned with generated runoff and flow persistence.
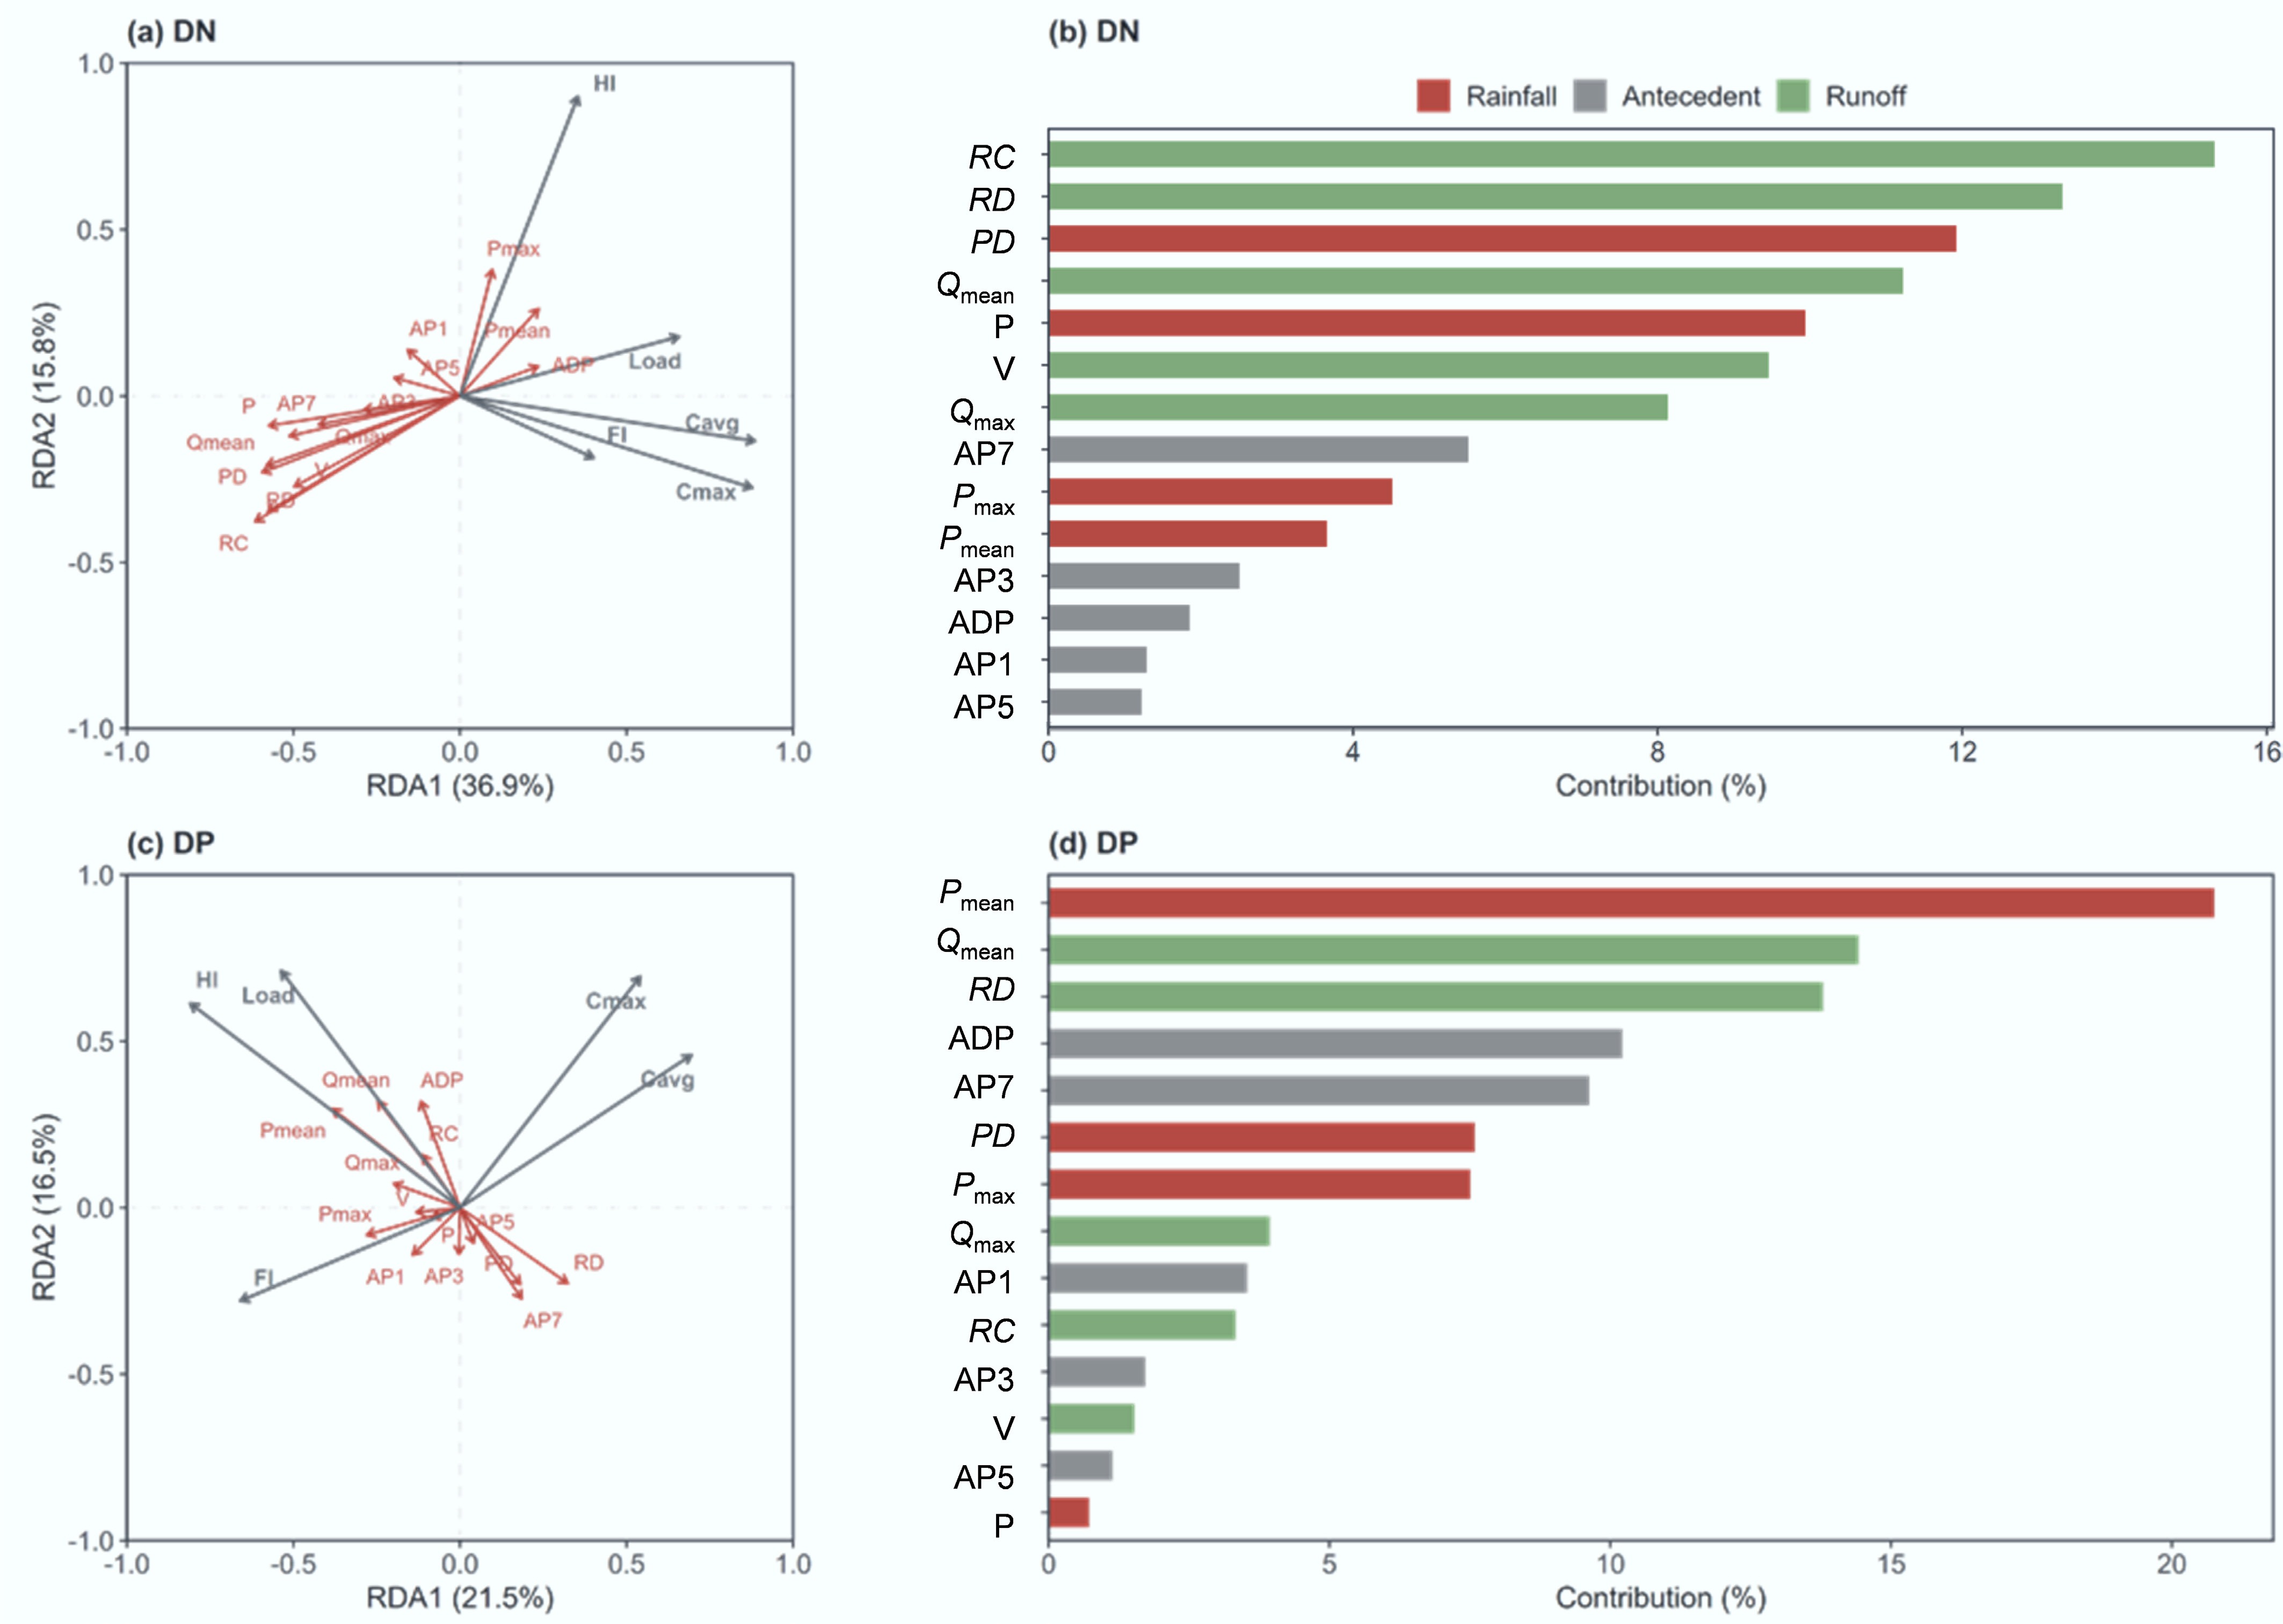
Figure 6.
Exploratory redundancy analysis (RDA) and descriptive variance partitioning of hydro-meteorological driver gradients for (a) DN, and (b) DP export. The full constrained models did not reach statistical significance in 999-permutation tests at n = 21, so the ordinations are interpreted as driver-gradient summaries rather than confirmatory predictor tests. Variance-partitioning values are relative shares of constrained variance.
For DP, the first two axes accounted for 38.0% of the variance (RDA1 21.5%, RDA2 16.5%) within the same exploratory analysis. RDA1 was aligned with rainfall-energy variables, especially mean and maximum rainfall intensity (Pmean and Pmax), whereas RDA2 was aligned with antecedent dry period (ADP) and 7-d antecedent rainfall (AP7). Descriptive variance partitioning showed broadly shared fractions among rainfall (37.7%), runoff (36.4%), and antecedent moisture (25.9%). Antecedent moisture contributed a larger descriptive fraction to DP than to DN (25.9% vs 12.1%), and the key variables ranked as Pmean > Qmean > RD > ADP > AP7. Compared with DN, DP therefore showed broader alignment with rainfall energy, hydrological delivery, and pre-storm moisture status.
-
The event data indicate that Dai Village functioned as a concentrated, storm-responsive nutrient source during monitored runoff events rather than as a weak diffuse background source. DN concentrations and loads greatly exceeded DP, consistent with N-rich inputs from domestic sewage, livestock waste, and vegetable-garden fertilizer[11], and with the greater mobility of dissolved N compared with P retained by particles and sediments[17,28]. The larger variability in load than in concentration shows that nutrient delivery was shaped by runoff volume and hydrological connectivity. In a reservoir catchment, these short event windows can therefore carry disproportionate ecological risk. The frequent figure-eight loops indicate that export was not governed by a single pathway. Early rainfall likely flushed nutrients accumulated on roofs, roads, hardened yards, and ditch surfaces, whereas continued rainfall connected gardens, cropland soils, and ditch-pond storage during the falling limb[15,29−31]. This within-event pathway switching agrees with high-frequency studies showing transient source-zone activation and changing hydrological connectivity during storms[8,32−34].
Within this shared storm response, DN and DP separated clearly. DN behaved as a transport-dominated solute at the event scale. FI was positive in almost all events, HI had weak net directionality, and driver gradients were strongest for generated runoff and flow persistence. These patterns indicate that soluble N was readily delivered once surface, ditch, and subsurface pathways connected to the outlet. The limiting step was therefore hydrological connection rather than the immediate size of a small mobilizable source pool. DP responded differently. Its higher HI indicates stronger near-source or surface-pathway delivery, but its lower and more variable FI shows that concentration did not always increase with discharge. This behavior is consistent with finite readily mobilizable dissolved P, dilution during larger or longer storms, particle-sediment interactions, adsorption-desorption, redox-sensitive release, and possible biological uptake during temporary retention. DP should therefore be interpreted as source- and surface-process-sensitive, not as transport-independent.
We use transport-limited and source-limited as shorthand for dominant event-scale controls, not as fixed nutrient identities or direct source-tracing evidence. Loop shape, FI, and exploratory driver gradients must be read together because several source-pathway combinations can converge at one village outlet and generate similar C–Q patterns.
This interpretation is consistent with classic source- and transport-limitation frameworks, in which C–Q behavior separates source-abundant transport from source exhaustion or mobilization-limited responses[19,20,22]. Catchment studies have shown that nitrate export can be sustained by hydrological connectivity and subsurface delivery[15,16,35], whereas phosphorus export often depends on short-distance mobilization, sediment interaction, and antecedent wetness[9,10,18]. Our event data indicate that these contrasting controls can operate during the same monitored storms within a small village drainage unit. In agricultural and headwater catchments, nitrate is frequently reported as chemostatic or only weakly diluting, a behavior attributed to large, well-connected subsurface and legacy N stores that are not exhausted within a single event. Dissolved P more often behaves chemodynamically, with clockwise loops, early-storm concentration peaks, and within-event exhaustion attributed to finite surface pools, rate-limited desorption, and sediment interaction under varying antecedent wetness. The present results reproduce both signatures, but within a single 11.28 ha drainage unit and within the same storms. DN maintained positive FI in 95.2% of events with weak net hysteresis, whereas DP showed consistently positive HI with weaker and more variable flushing. In most published comparisons, the two behaviors are separated by catchment, by monitoring period, or by the solute studied, so the divergence can plausibly be attributed to differences in travel distance, catchment size, or landscape setting. At Dai Village, source zones, transport pathways, and the receiving ditch are only tens to hundreds of meters apart and experience identical rainfall forcing, so the contrast is attributable more directly to how each solute is stored and released than to differences in hydrological setting.
Hydro-meteorological gradients of nitrogen and phosphorus export
-
The driver analysis was consistent with the HI/FI interpretation for DN. DN export aligned most strongly with generated runoff and flow persistence, which is plausible for a soluble nutrient moving with water across surface, ditch, and subsurface pathways[16]. Runoff coefficient, runoff duration, and mean flow therefore summarize how efficiently village sources were connected to the outlet. Because event runoff at this outlet includes a continuous non-rainfall component, RC also partly reflects the persistence of sewage-fed flow, which is consistent with a continuously available dissolved-N pool at the event scale. Rainfall intensity may still matter, but largely through the runoff and connectivity it generates. For management, the evidence points first to interrupting or treating connected flow paths rather than only removing surface source material before storms.
For DP, exploratory gradients were broader and involved rainfall energy, runoff, and antecedent moisture. These gradients should be treated as mechanistic clues, not as a tested predictor ranking. Rainfall intensity can detach or flush P-rich particles and surface-associated dissolved P; runoff determines whether that material reaches the outlet; and antecedent moisture may alter soil redox conditions, pore-water exchange, and adsorption-desorption equilibria[18]. The larger antecedent-moisture fraction for DP than for DN is therefore a descriptive signal of moisture sensitivity. It does not prove a mechanism by itself. Rainfall amount alone is consequently an incomplete indicator of P-export risk.
The contrast also affects monitoring design. Control measures transferred directly from cropland or urban catchments may underperform because village runoff combines field-edge retention, impervious-surface flushing, and ditch-pond storage within one small drainage unit. Their relative importance can change within a single storm. Event diagnosis therefore depends on samples collected before the rising limb, near peak flow, and during recession. One or two grab samples can misclassify flushing, dilution, or delayed delivery, especially when DN and DP follow different pathways. High-frequency monitoring is thus not only a technical refinement. It changes the management inference that village runoff data can support.
Implications for village nutrient management
-
These findings point to different intervention points. For transport-dominated DN export, the most relevant control stage is hydrological interception and treatment along connected pathways, including ditch-pond systems, drainage outlets, and subsurface-connected flow routes. Ecological ditches, vegetated buffers, pond retention, denitrifying zones, and staged drainage treatment[36,37] are most useful where runoff connectivity is strongest. For source- and surface-process-sensitive DP export, the more relevant stages are source reduction and surface mobilization, including fertilizer management in vegetable plots, waste storage, sediment capture, and outlet sedimentation. Because antecedent moisture can modify DP release, P control may also need to consider wet-dry cycles rather than rainfall amount alone.
Together, these results argue for nutrient-specific source-to-sink design rather than uniform end-of-pipe treatment. For N, the main task is to reduce the efficiency with which runoff connects soluble sources to downstream waters. For P, it is to reduce readily mobilizable pools and prevent short-distance surface flushing from reaching the outlet. This distinction can guide the placement of best management practices. N-oriented measures are likely to be most relevant along connected drainage corridors, whereas P-oriented measures are likely to be most relevant near vegetable plots, waste storage areas, sediment accumulation zones, and outlet convergence points. Such differentiated design is consistent with spatially targeted NPS pollution control[38,39].
Limitations and future directions
-
The interpretation has four boundaries. First, the evidence comes from one rural eastern Chinese village and from rainy-season storms monitored in 2011–2012, before later rural sanitation upgrades; quantitative driver contributions may differ under other soils, drainage densities, land-use mosaics, pond connections, or wastewater management conditions. Second, the study did not collect routine non-storm, dry-weather, or baseflow samples. It therefore cannot quantify stormflow-background contrasts, and its conclusions apply to event-scale export during monitored runoff. Third, the full constrained RDA models did not reach statistical significance in permutation tests, given the modest event number relative to candidate predictors. Ordination and variance partitioning are therefore exploratory support, not validated effect sizes or causal evidence. Fourth, the study used event chemistry and hysteresis metrics rather than direct isotopic or molecular source tracing. The transport-limited and source-limited interpretation is mechanistic but indirect. Future work should combine high-frequency event monitoring with source tracers[40], dedicated baseline sampling, seasonal observations, and multi-village comparisons.
-
High-frequency monitoring of 21 rainfall-runoff events showed that DN and DP exports from a rural eastern Chinese village were episodic and storm-dependent, but constrained at different stages of the event export chain. DN showed near-universal positive flushing and stronger alignment with runoff variables, indicating transport-dominated export through connected flow paths. DP showed stronger clockwise hysteresis, weaker and more variable flushing, and broader alignment with rainfall energy and antecedent moisture, indicating a source- and surface-process-sensitive response. This contrast means that village nutrient control should be nutrient-specific. Measures for N should interrupt the hydrological connection between stored nitrogen and the outlet, whereas measures for P should reduce the mobilizable surface pool and intercept early-storm surface runoff. For reservoir catchments containing many such villages, this implies that monitoring and control effort should be concentrated on storm periods rather than distributed evenly in time, and that N and P measures should be placed at different points in the drainage network rather than combined in a single end-of-pipe facility.
-
Not applicable.
No acknowledgements are applicable for this work.
-
The authors confirm their contributions to the paper as follows: Yuhang Zhang: conceptualization, field monitoring, sample collection, laboratory analysis, data curation, formal analysis, visualization, and original draft preparation; Xuan Huang: conceptualization, supervision, methodology, interpretation, and manuscript revision; Hua Yan: interpretation and manuscript revision; Xu Yang: field monitoring, sample collection, hydrological data processing, and statistical analysis; Xing Yan: field monitoring, sample collection, and laboratory analysis; Yongqiu Xia: supervision, funding acquisition, interpretation, and manuscript revision. All authors reviewed the results and approved the final version of the manuscript.
-
The datasets generated during and/or analyzed during the current study are available from the corresponding author upon reasonable request.
-
The authors declare that they have no known competing financial interests or personal relationships that could have appeared to influence the work reported in this paper.
-
Full list of author information is available at the end of the article.
- Copyright: © 2026 by the author(s). Published by Maximum Academic Press, Fayetteville, GA. This article is an open access article distributed under Creative Commons Attribution License (CC BY 4.0), visit https://creativecommons.org/licenses/by/4.0/.
-
About this article
Cite this article
Zhang Y, Huang X, Yan H, Yang X, Yan X, et al. 2026. Contrasting storm-event controls on dissolved nitrogen and phosphorus export from a rural village in eastern China. Nitrogen Cycling 2: e029 doi: 10.48130/nc-0026-0015 

Contrasting storm-event controls on dissolved nitrogen and phosphorus export from a rural village in eastern China
- Received: 23 June 2026
- Revised: 05 August 2026
- Accepted: 08 September 2026
- Published online: 20 October 2026
Abstract: Rainfall-runoff events can deliver disproportionate nutrient loads from rural settlements to receiving waters, yet the event-scale evidence separating dissolved nitrogen (DN) from dissolved phosphorus (DP) export remains limited. This uncertainty weakens nutrient-specific management because DN and DP export may be constrained at different stages of the export chain, from source mobilization to outlet delivery. We monitored 21 rainfall-runoff events at high frequency in Dai Village, Jiangsu Province, Eastern China, and combined concentration–discharge (C–Q) hysteresis metrics with exploratory redundancy analysis to compare DN and DP export. Runoff was strongly N-enriched relative to P. The mean DN concentration was 6.84 mg L−1, 15.5 times the mean DP concentration (0.44 mg L−1), and event loads were highly variable (CV > 1.5). Figure-eight hysteresis was common for both nutrients (38.1% of events), indicating within-storm switching between rapid surface flushing and delayed delivery. Despite this shared event structure, DN and DP diverged in their dominant constraints. DN showed consistent flushing (FI > 0 in 95.2% of events) and aligned mainly with runoff characteristics, indicating transport-dominated export through connected flow paths. DP showed weaker and more variable flushing (FI > 0 in 66.7% of events) and aligned with rainfall energy, runoff, and antecedent moisture, indicating a response constrained by mobilizable sources and surface processes. These event-scale observations support nutrient-specific runoff diagnostics, with pathway interception for DN and mobilizable P, and sediment- and moisture-sensitive controls for DP.