-
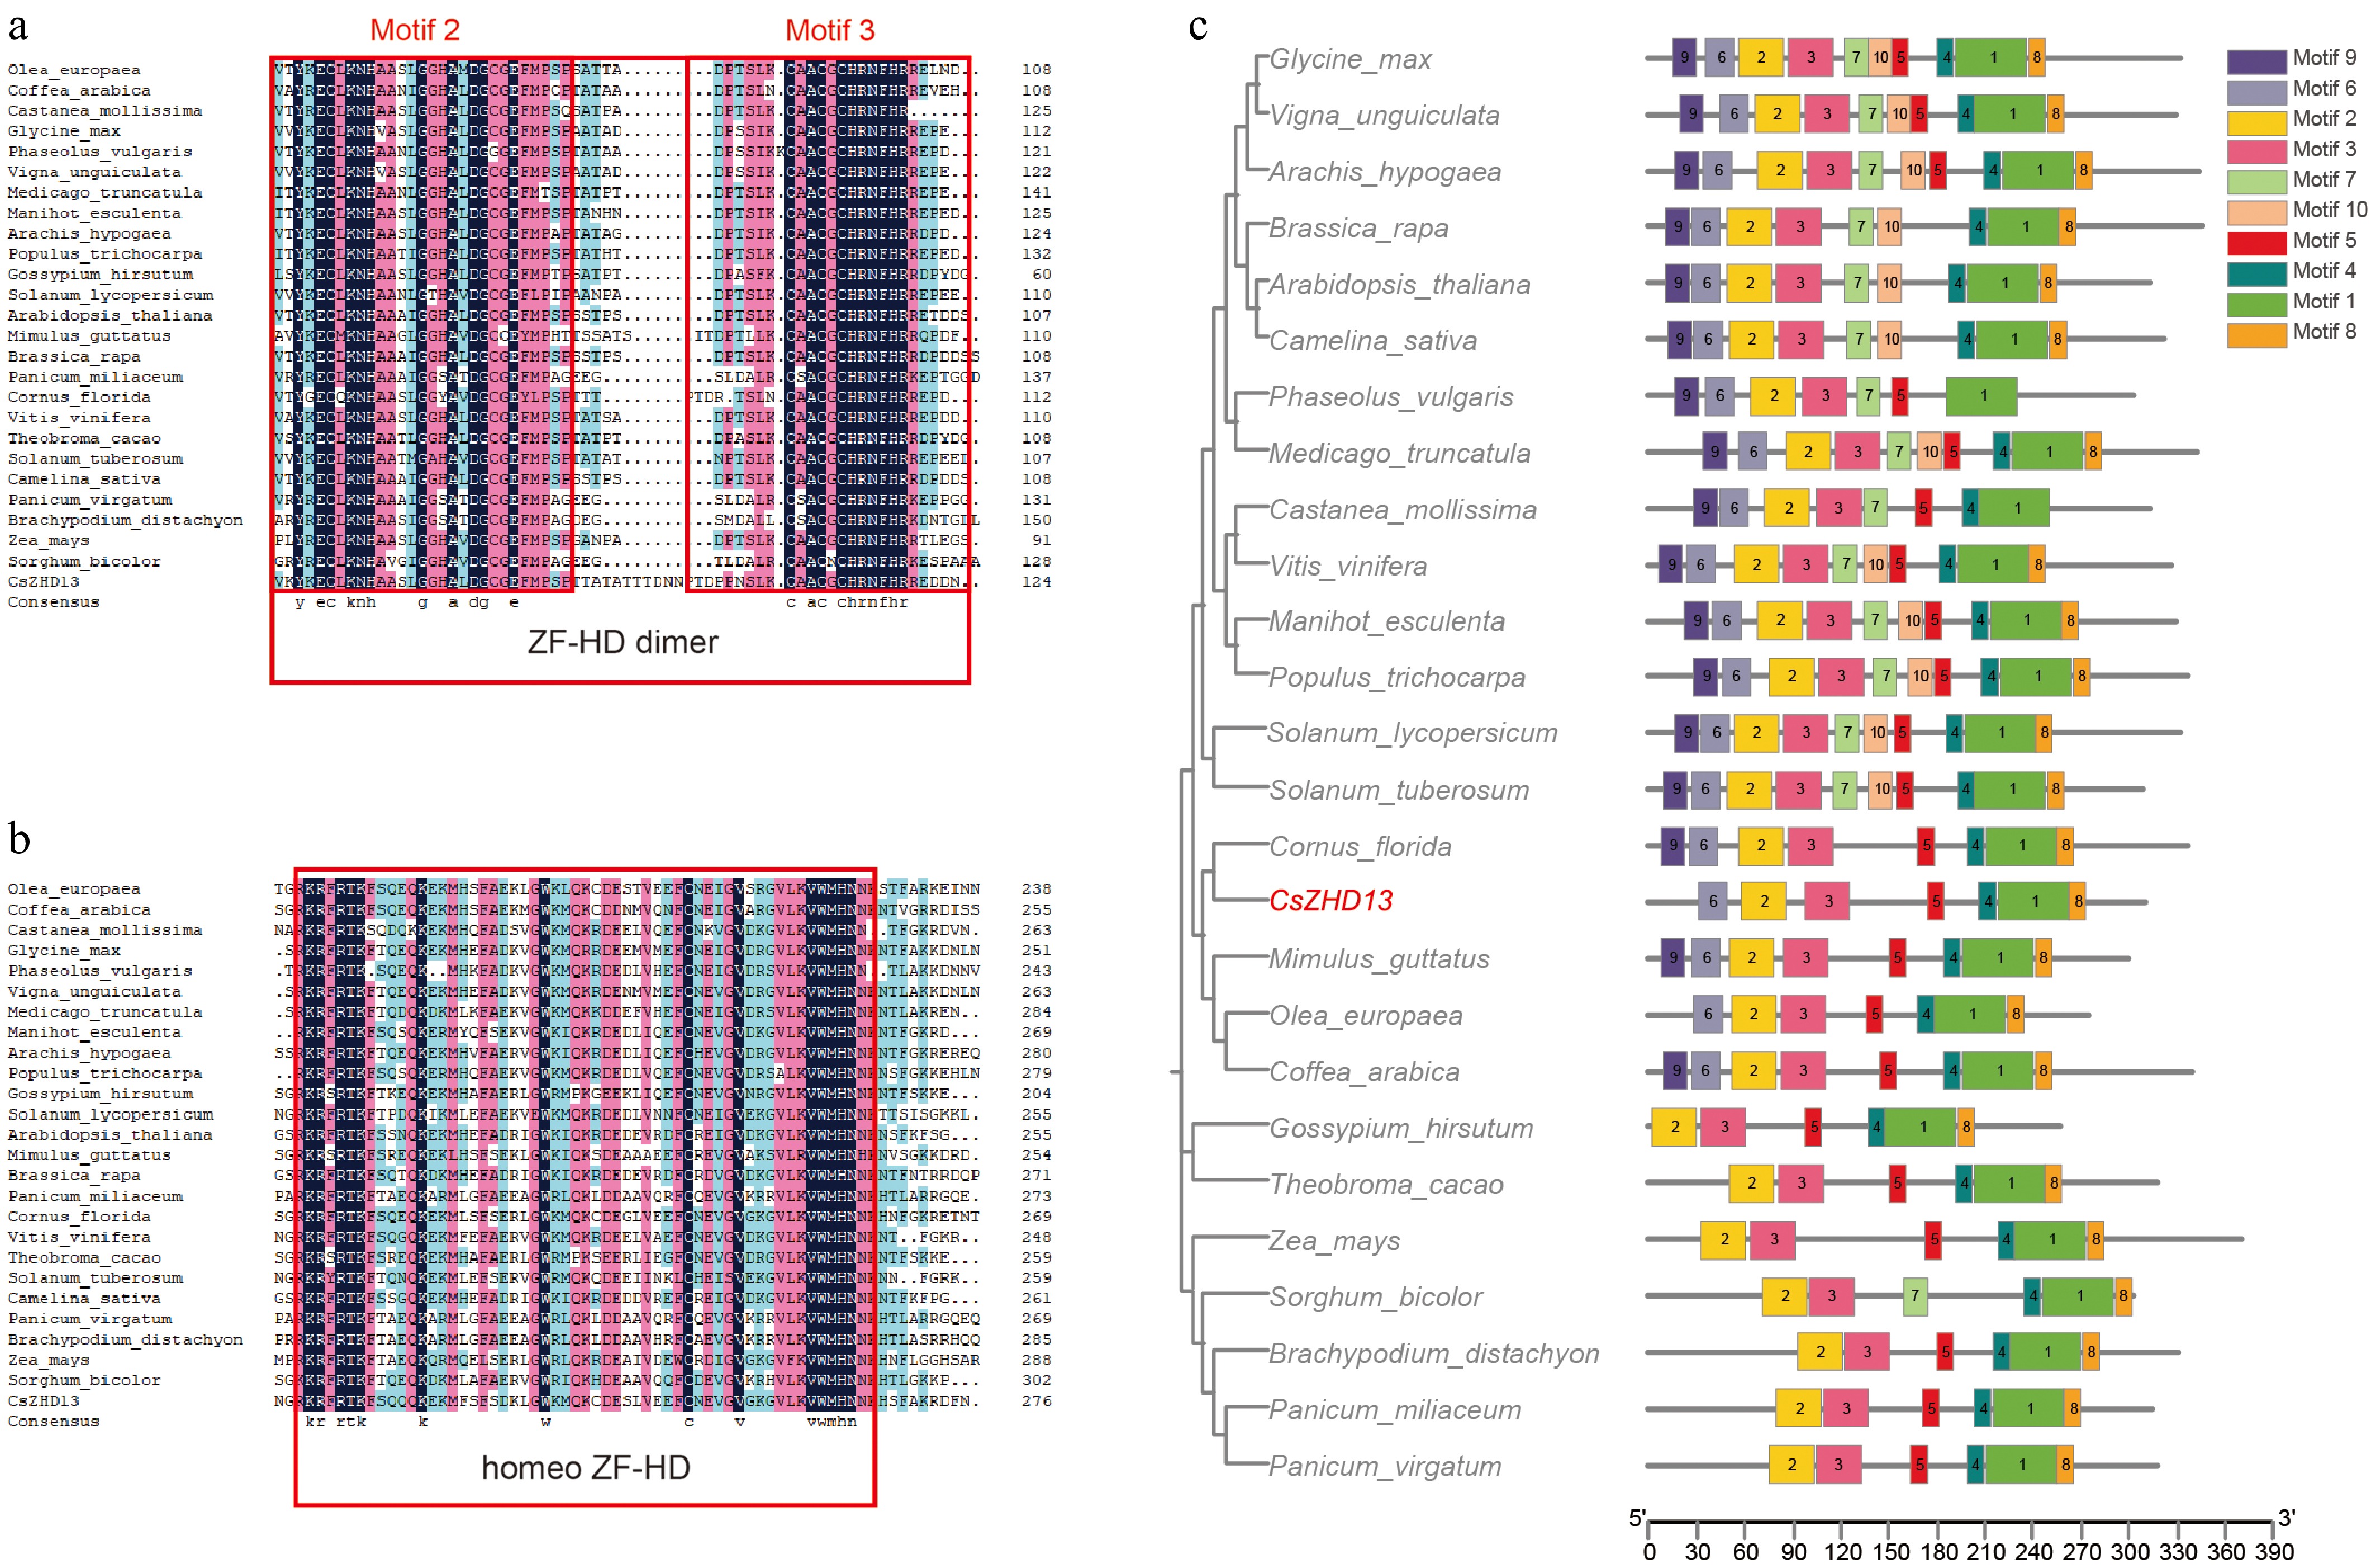
Figure 1.
Alignment of the conserved motif sequences across species. Phylogeny and motif architecture of ZF-HD13 proteins across 26 plant species. (a) ZF-HD dimer signature sequences. (b) Homeo ZF-HD signature sequences. (c) The phylogenetic tree of ZF-HD13 across species.
-
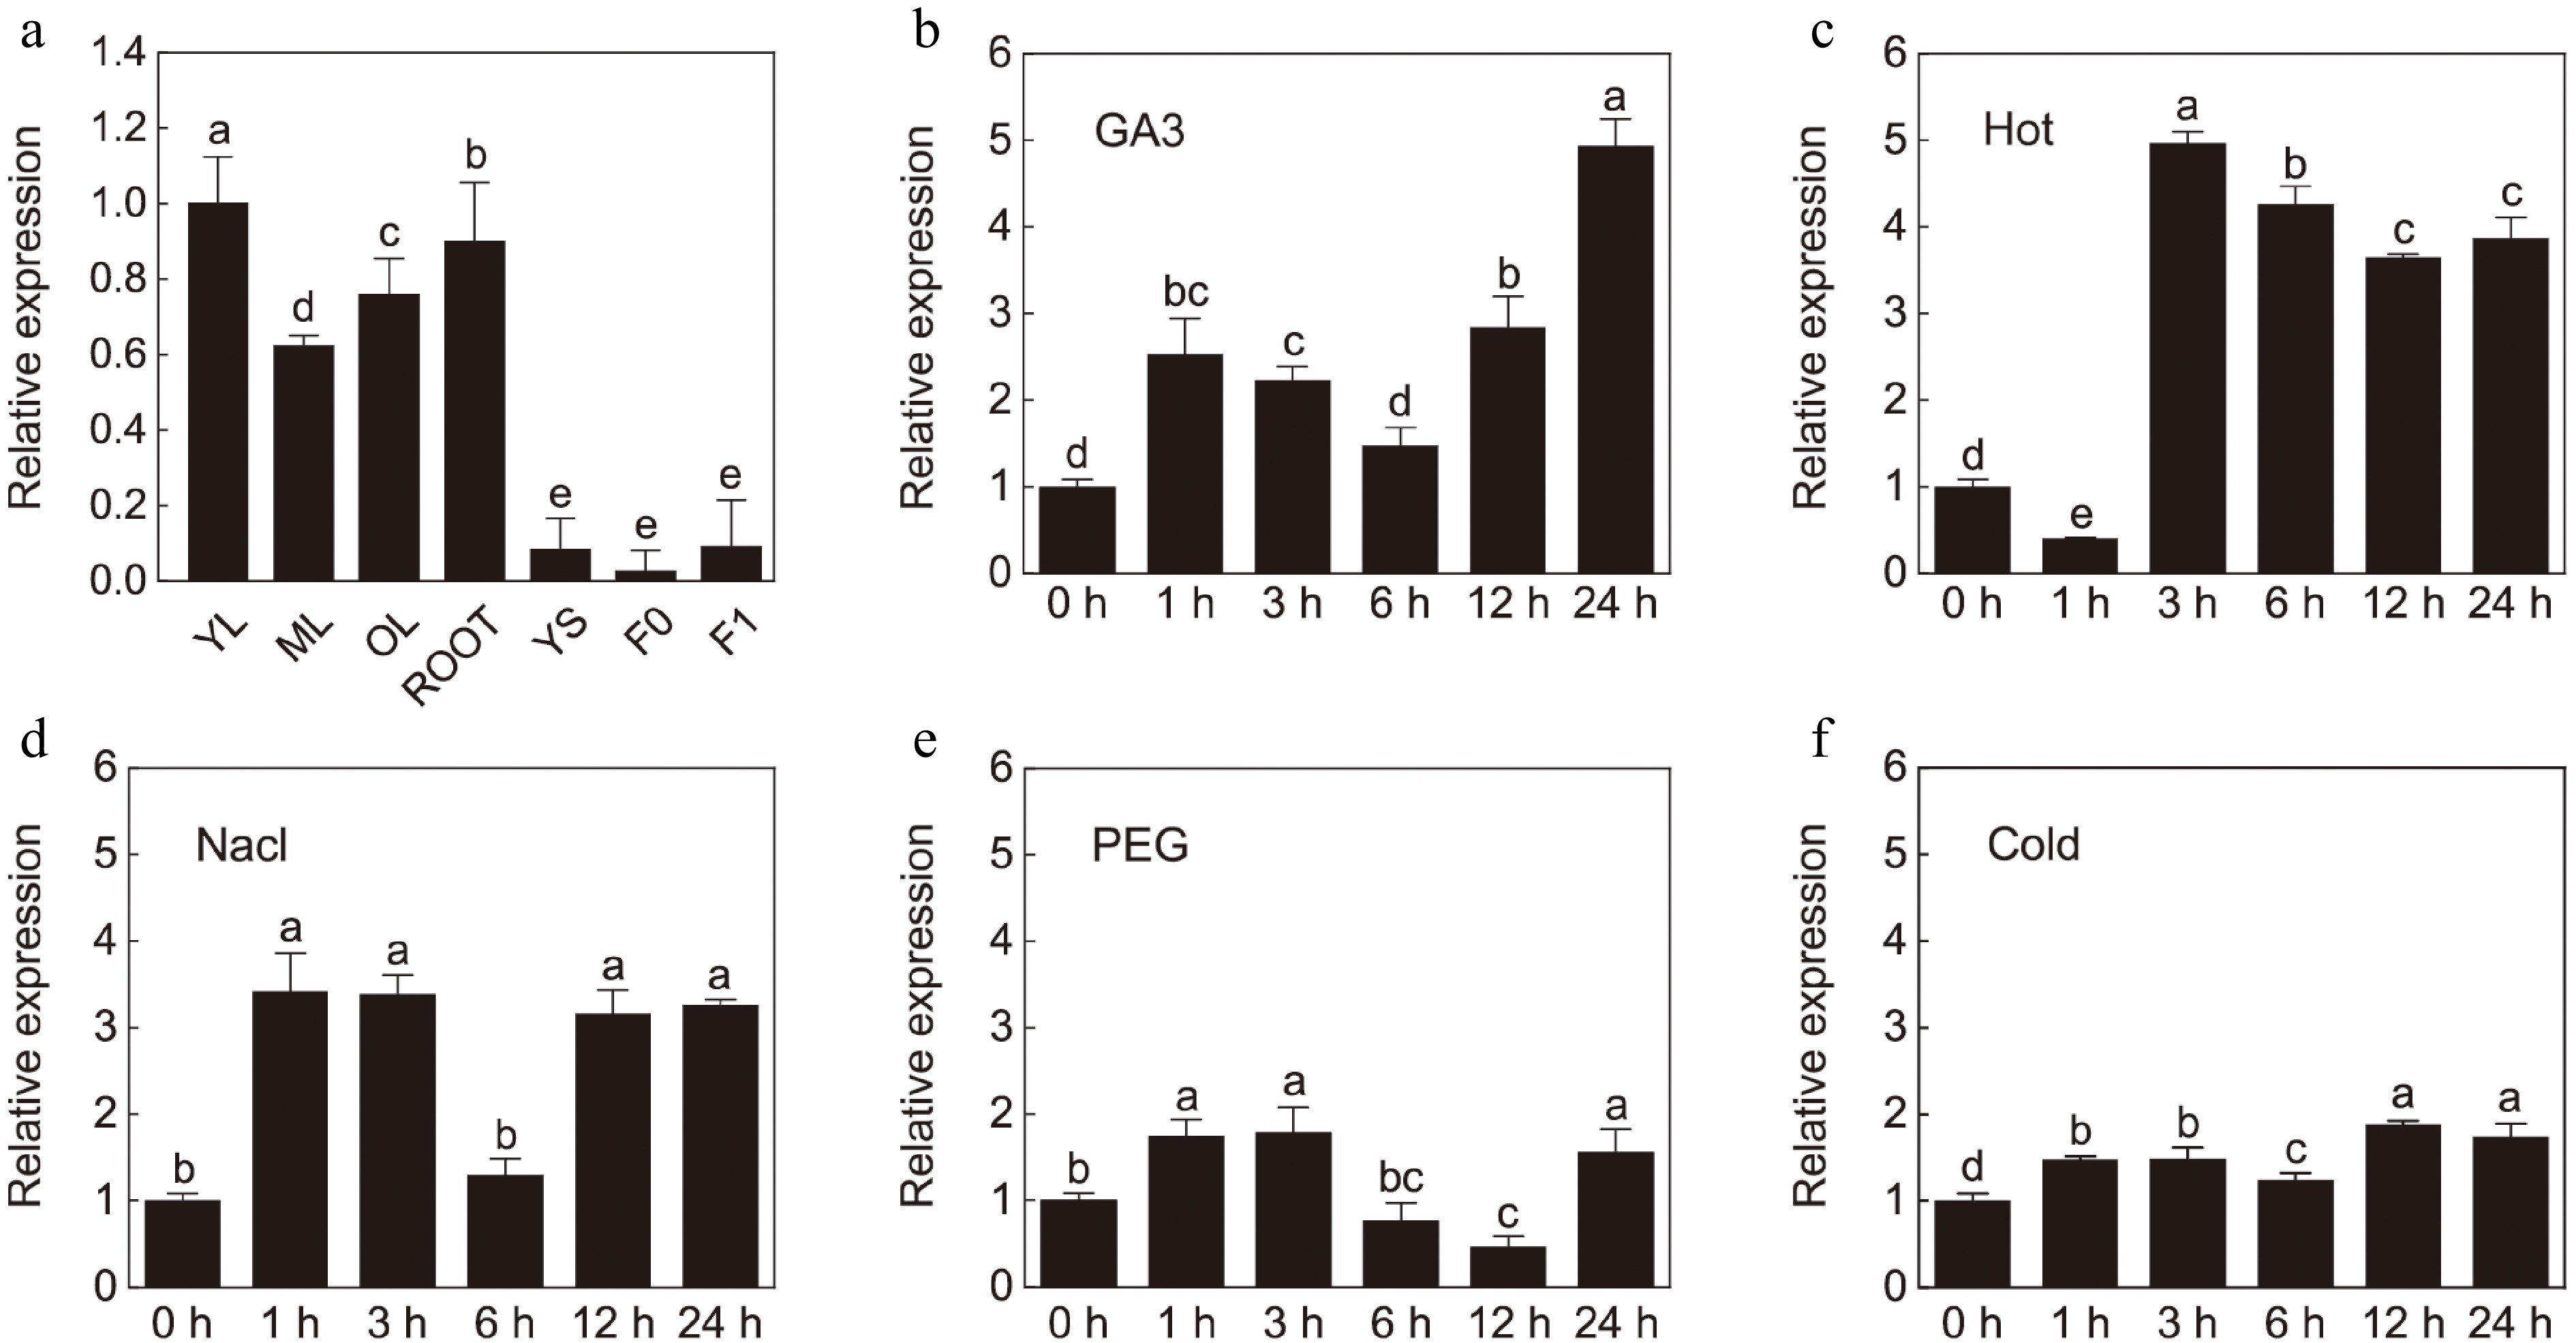
Figure 2.
CsZF-HD13 expression profiles. (a) Organ-specific transcriptional analysis of CsZF-HD13 in C. sinensis 'Shuchazao' (YL: young leaves; ML: mature leaves; OL: old leaves; YS: young stems; F0: bud stage; F1: white stage). (b) 1 mM GA3; (c) 38 °C; (d) 200 mM NaCl; (e) 20% PEG-6000; (f) 4 °C. Transcript levels at 0 h (multiple stress treatments) and in leaf samples (organ expression profiling) were assigned a relative value of 1.0 for normalization. Error bars depict standard deviations (SD). Each data point represents the mean ± SD from triplicate biological experiments. Different letters indicate significant differences (p < 0.05).
-
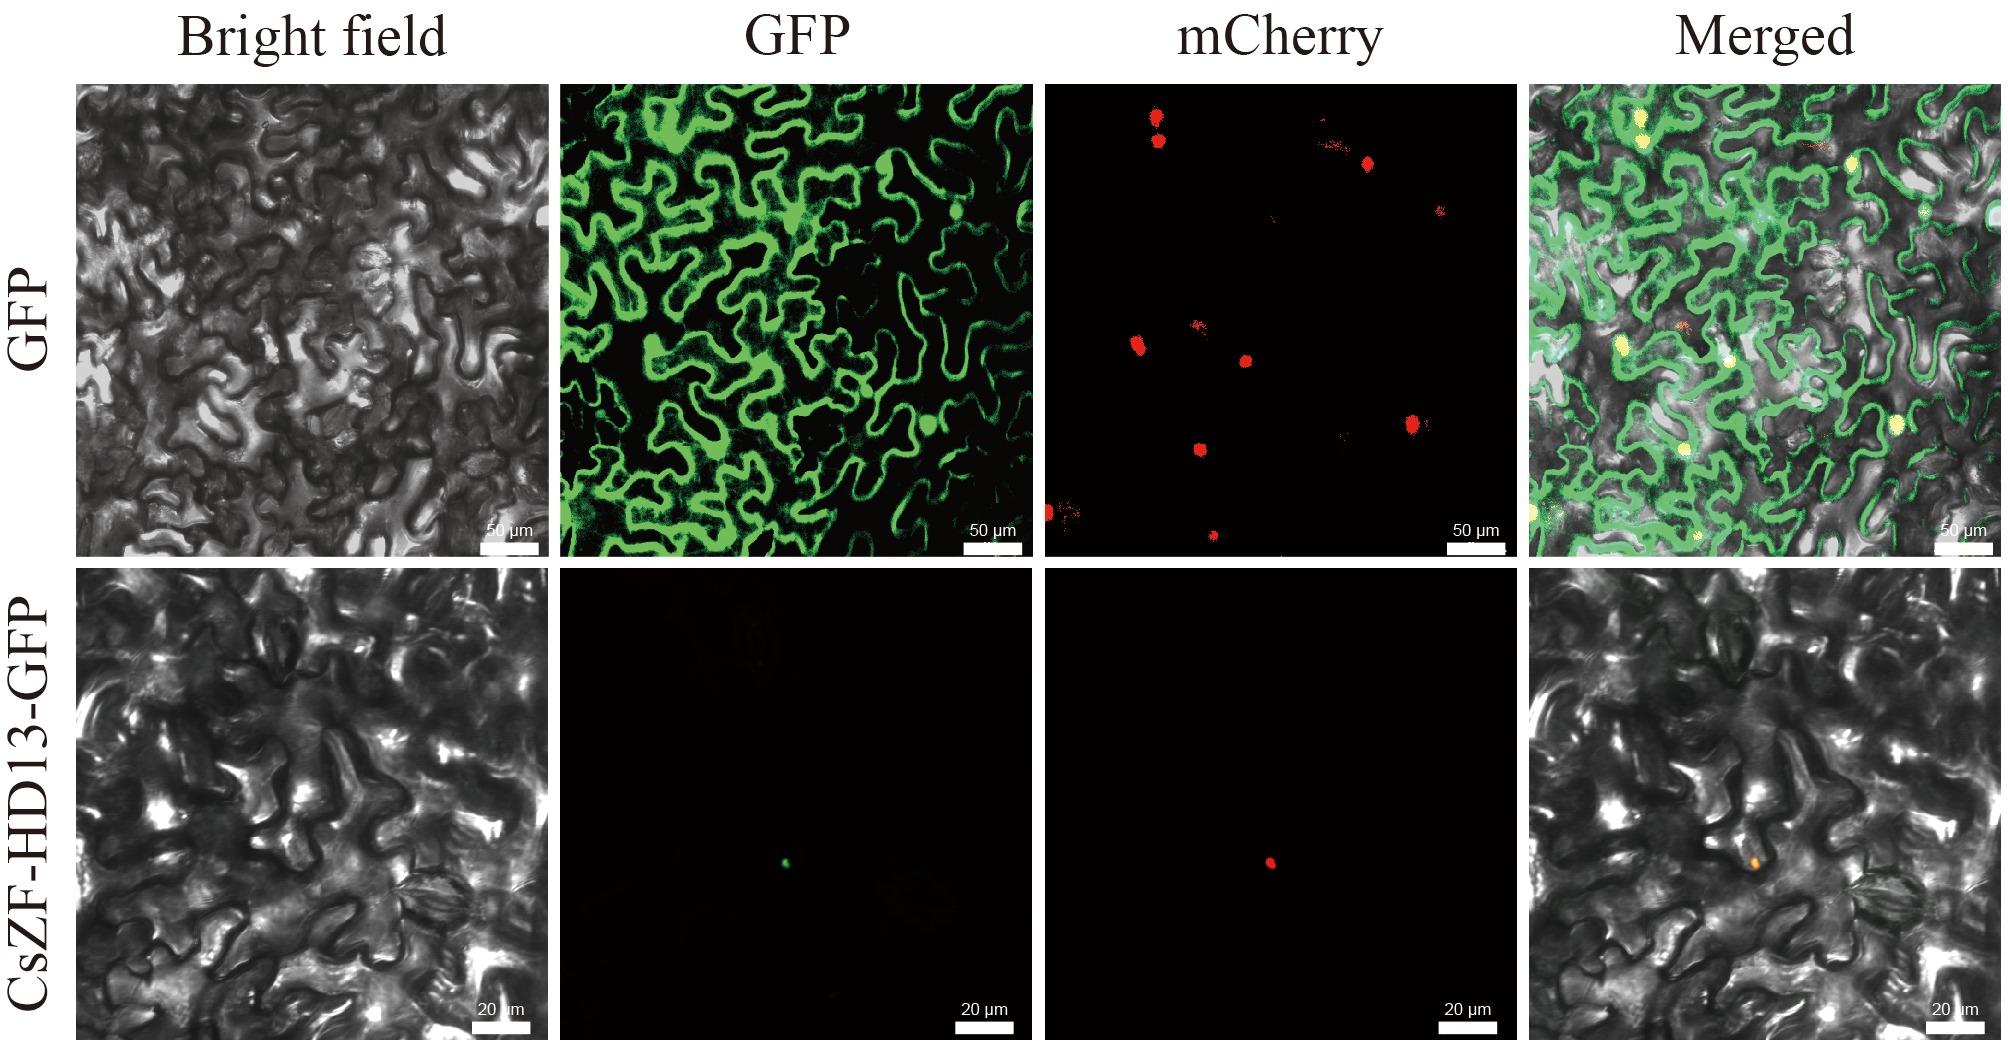
Figure 3.
Subcellular localization of CsZF-HD13-GFP. Subcellular distribution of the CsZF-HD13-GFP fusion protein and free GFP in Nicotiana benthamiana leaf cells was imaged using a confocal microscope. Nuclear localization of the p35S::NLS-mCherry marker. Scale bars indicate 20 and 50 μm.
-
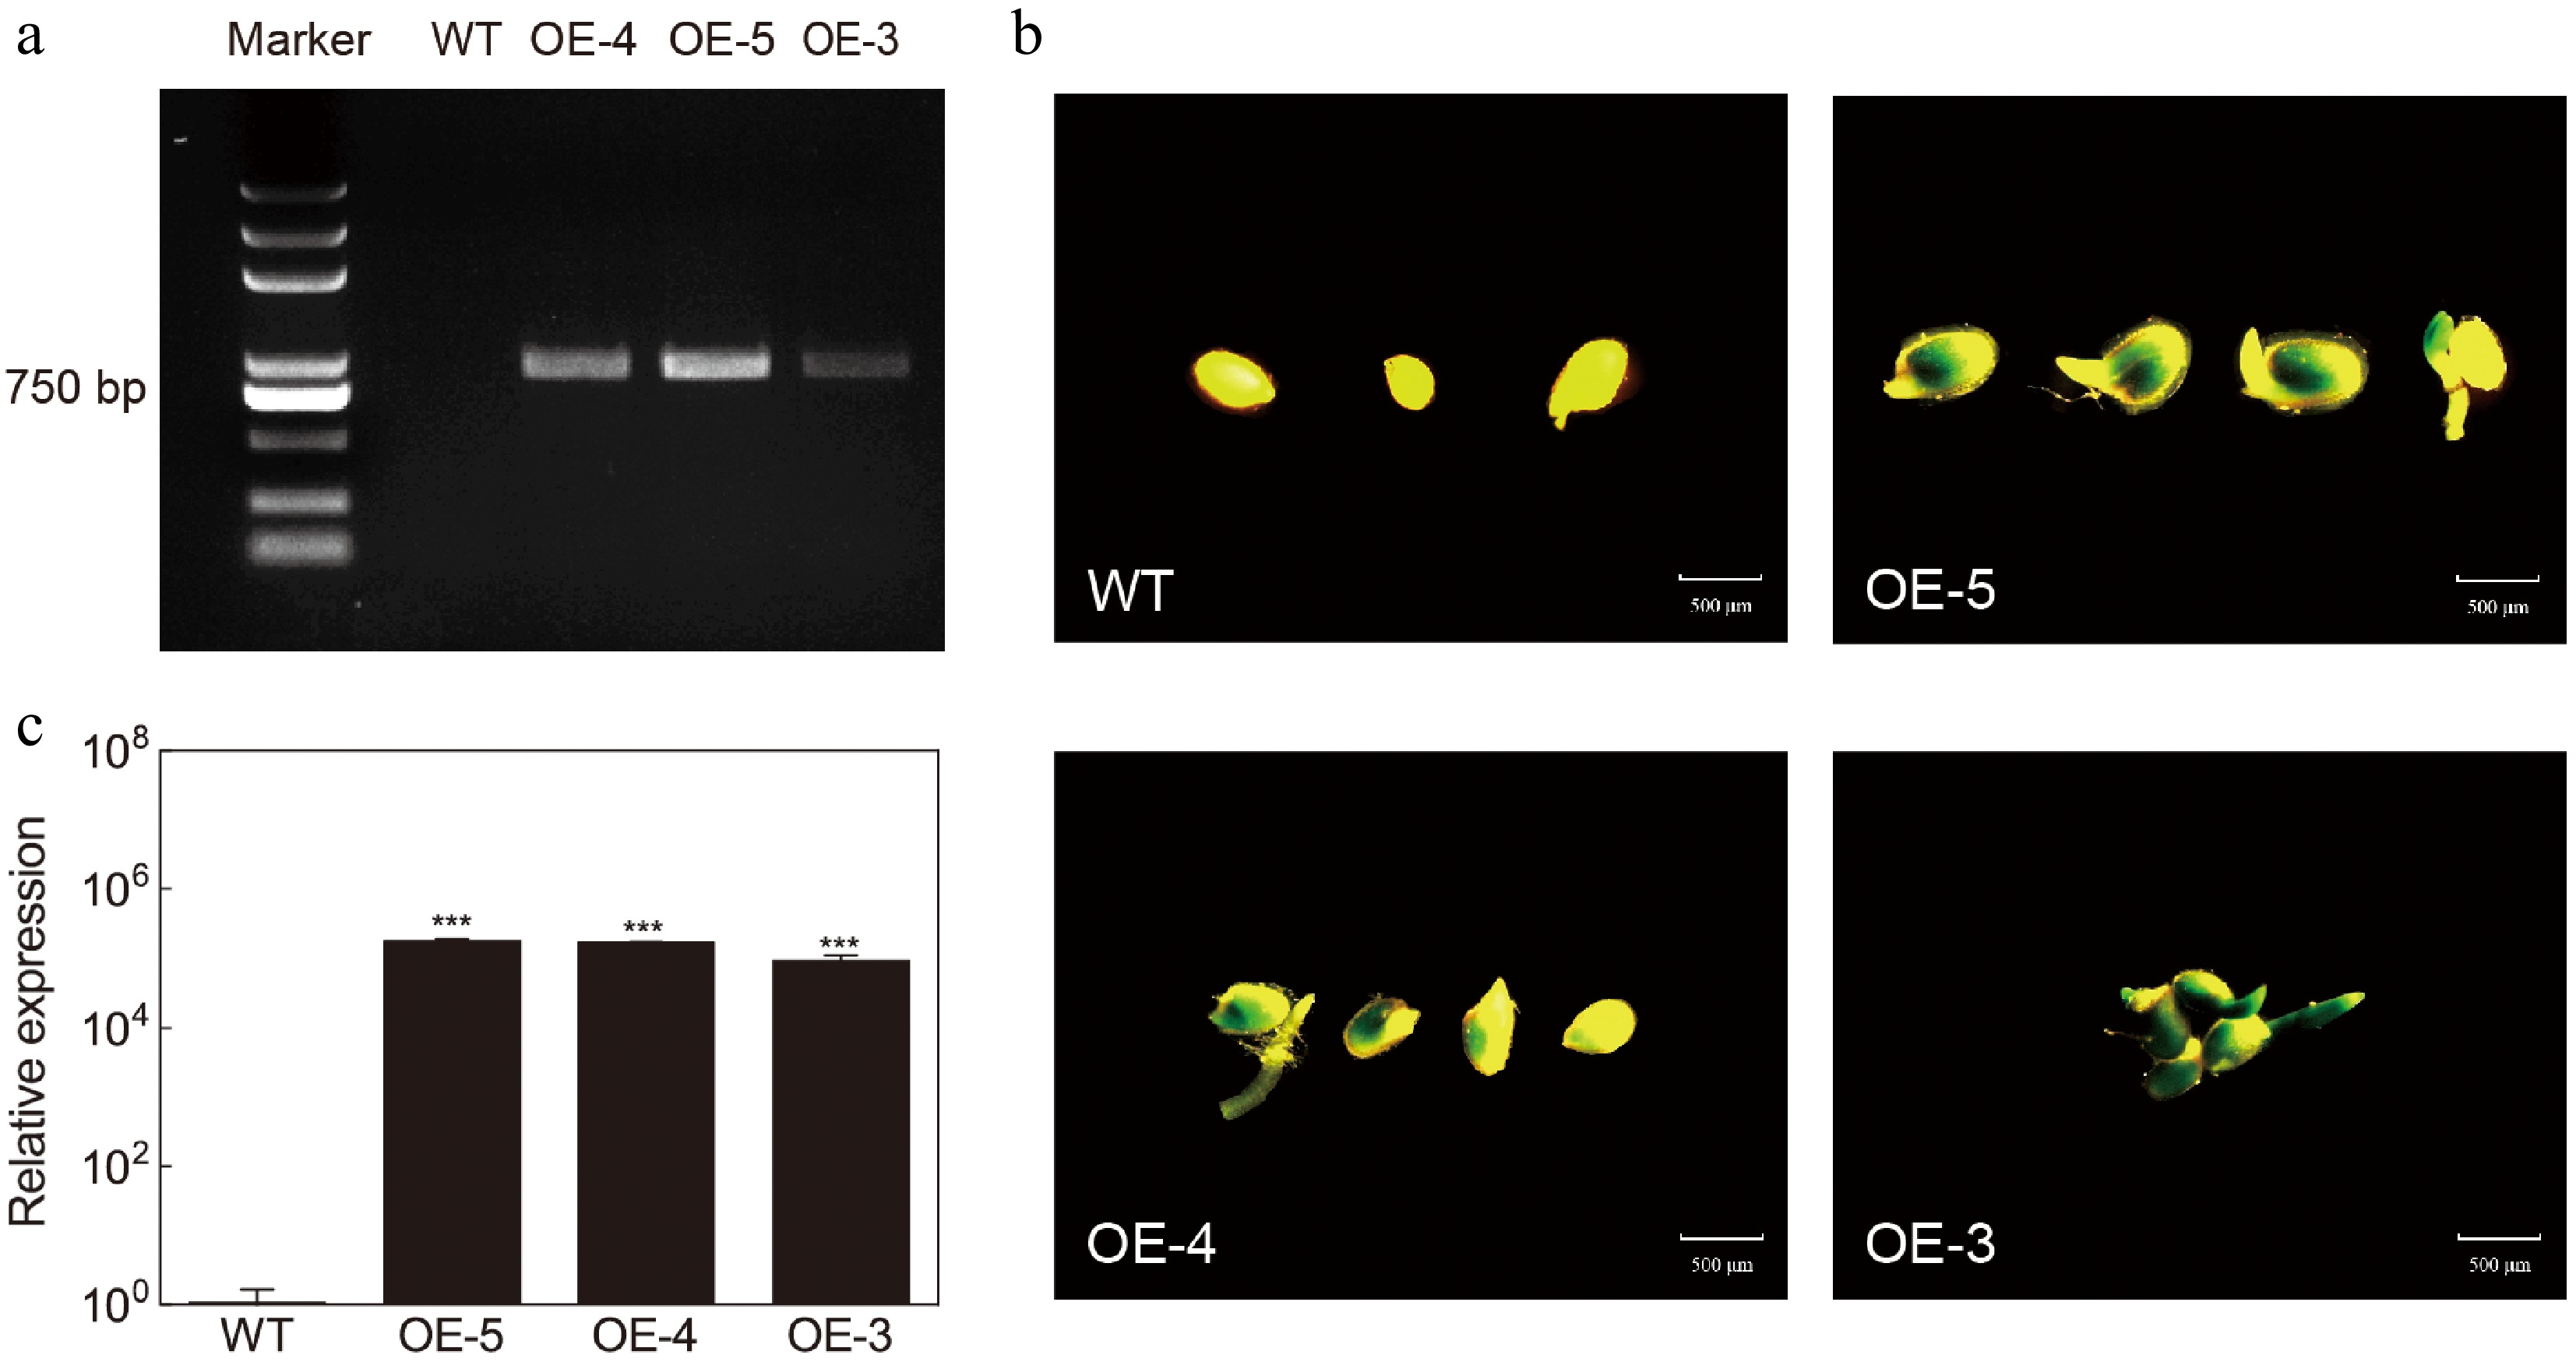
Figure 4.
Heterologous overexpression of CsZF-HD13 in A. thaliana. (a) PCR-based detection of the CsZF-HD13 transgene in cDNA templates derived from WT and three independent transgenic lines. (b) Histochemical GUS staining of T3 transgenic Arabidopsis seeds harboring the 35S::CsZF-HD13-35S::GUS overexpression construct. Scale bars indicate 500 μm. (c) Transcript levels of CsZF-HD13 in WT and transgenic Arabidopsis lines. Values represent means ± standard deviation (SD). Asterisks indicate significant deviations from the WT (* p < 0.05; ** p < 0.01; *** p < 0.001).
-
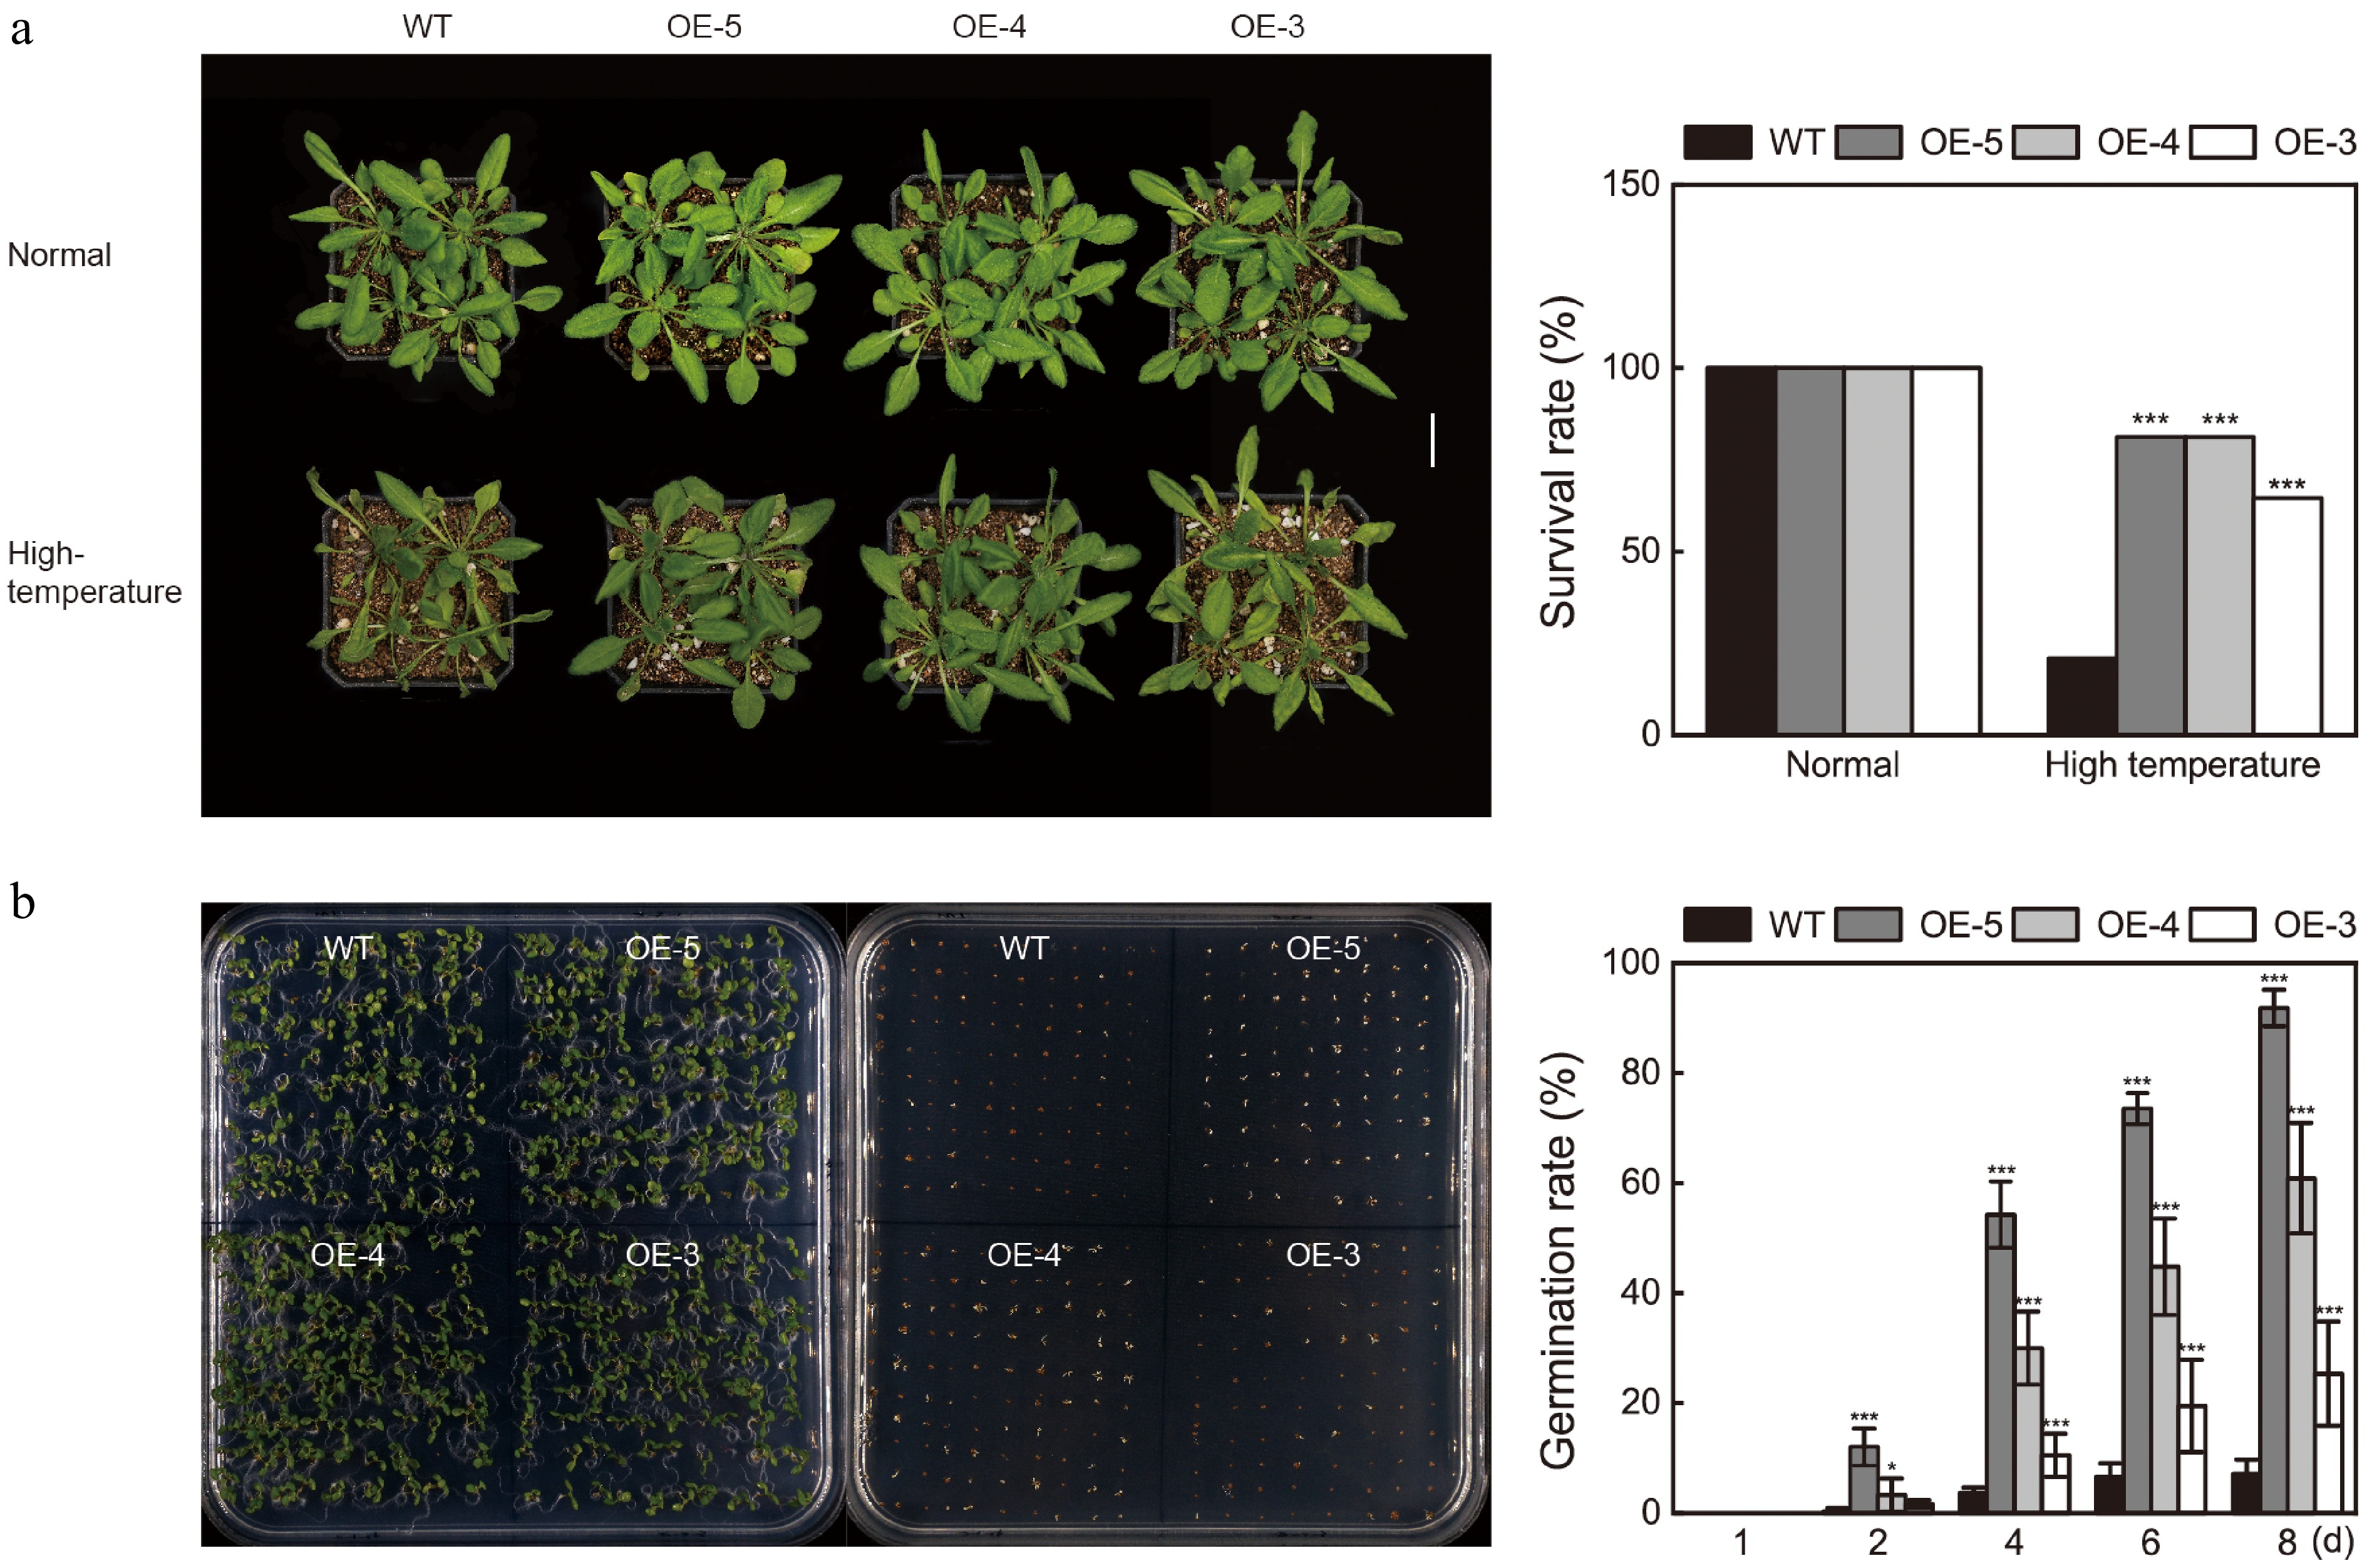
Figure 5.
The phenotypes of transgenic Arabidopsis under high-temperature stress treatment. (a) WT and transgenic Arabidopsis phenotypes and survival (pre-/post-38 °C heat). Scale bars indicate 2 cm. (b) Germination phenotypes and rates of WT and transgenic Arabidopsis seeds under high temperature and room temperature. Values represent means ± standard deviation (SD). Asterisks indicate significant deviations from the WT (* p < 0.05; ** p < 0.01; *** p < 0.001).
-
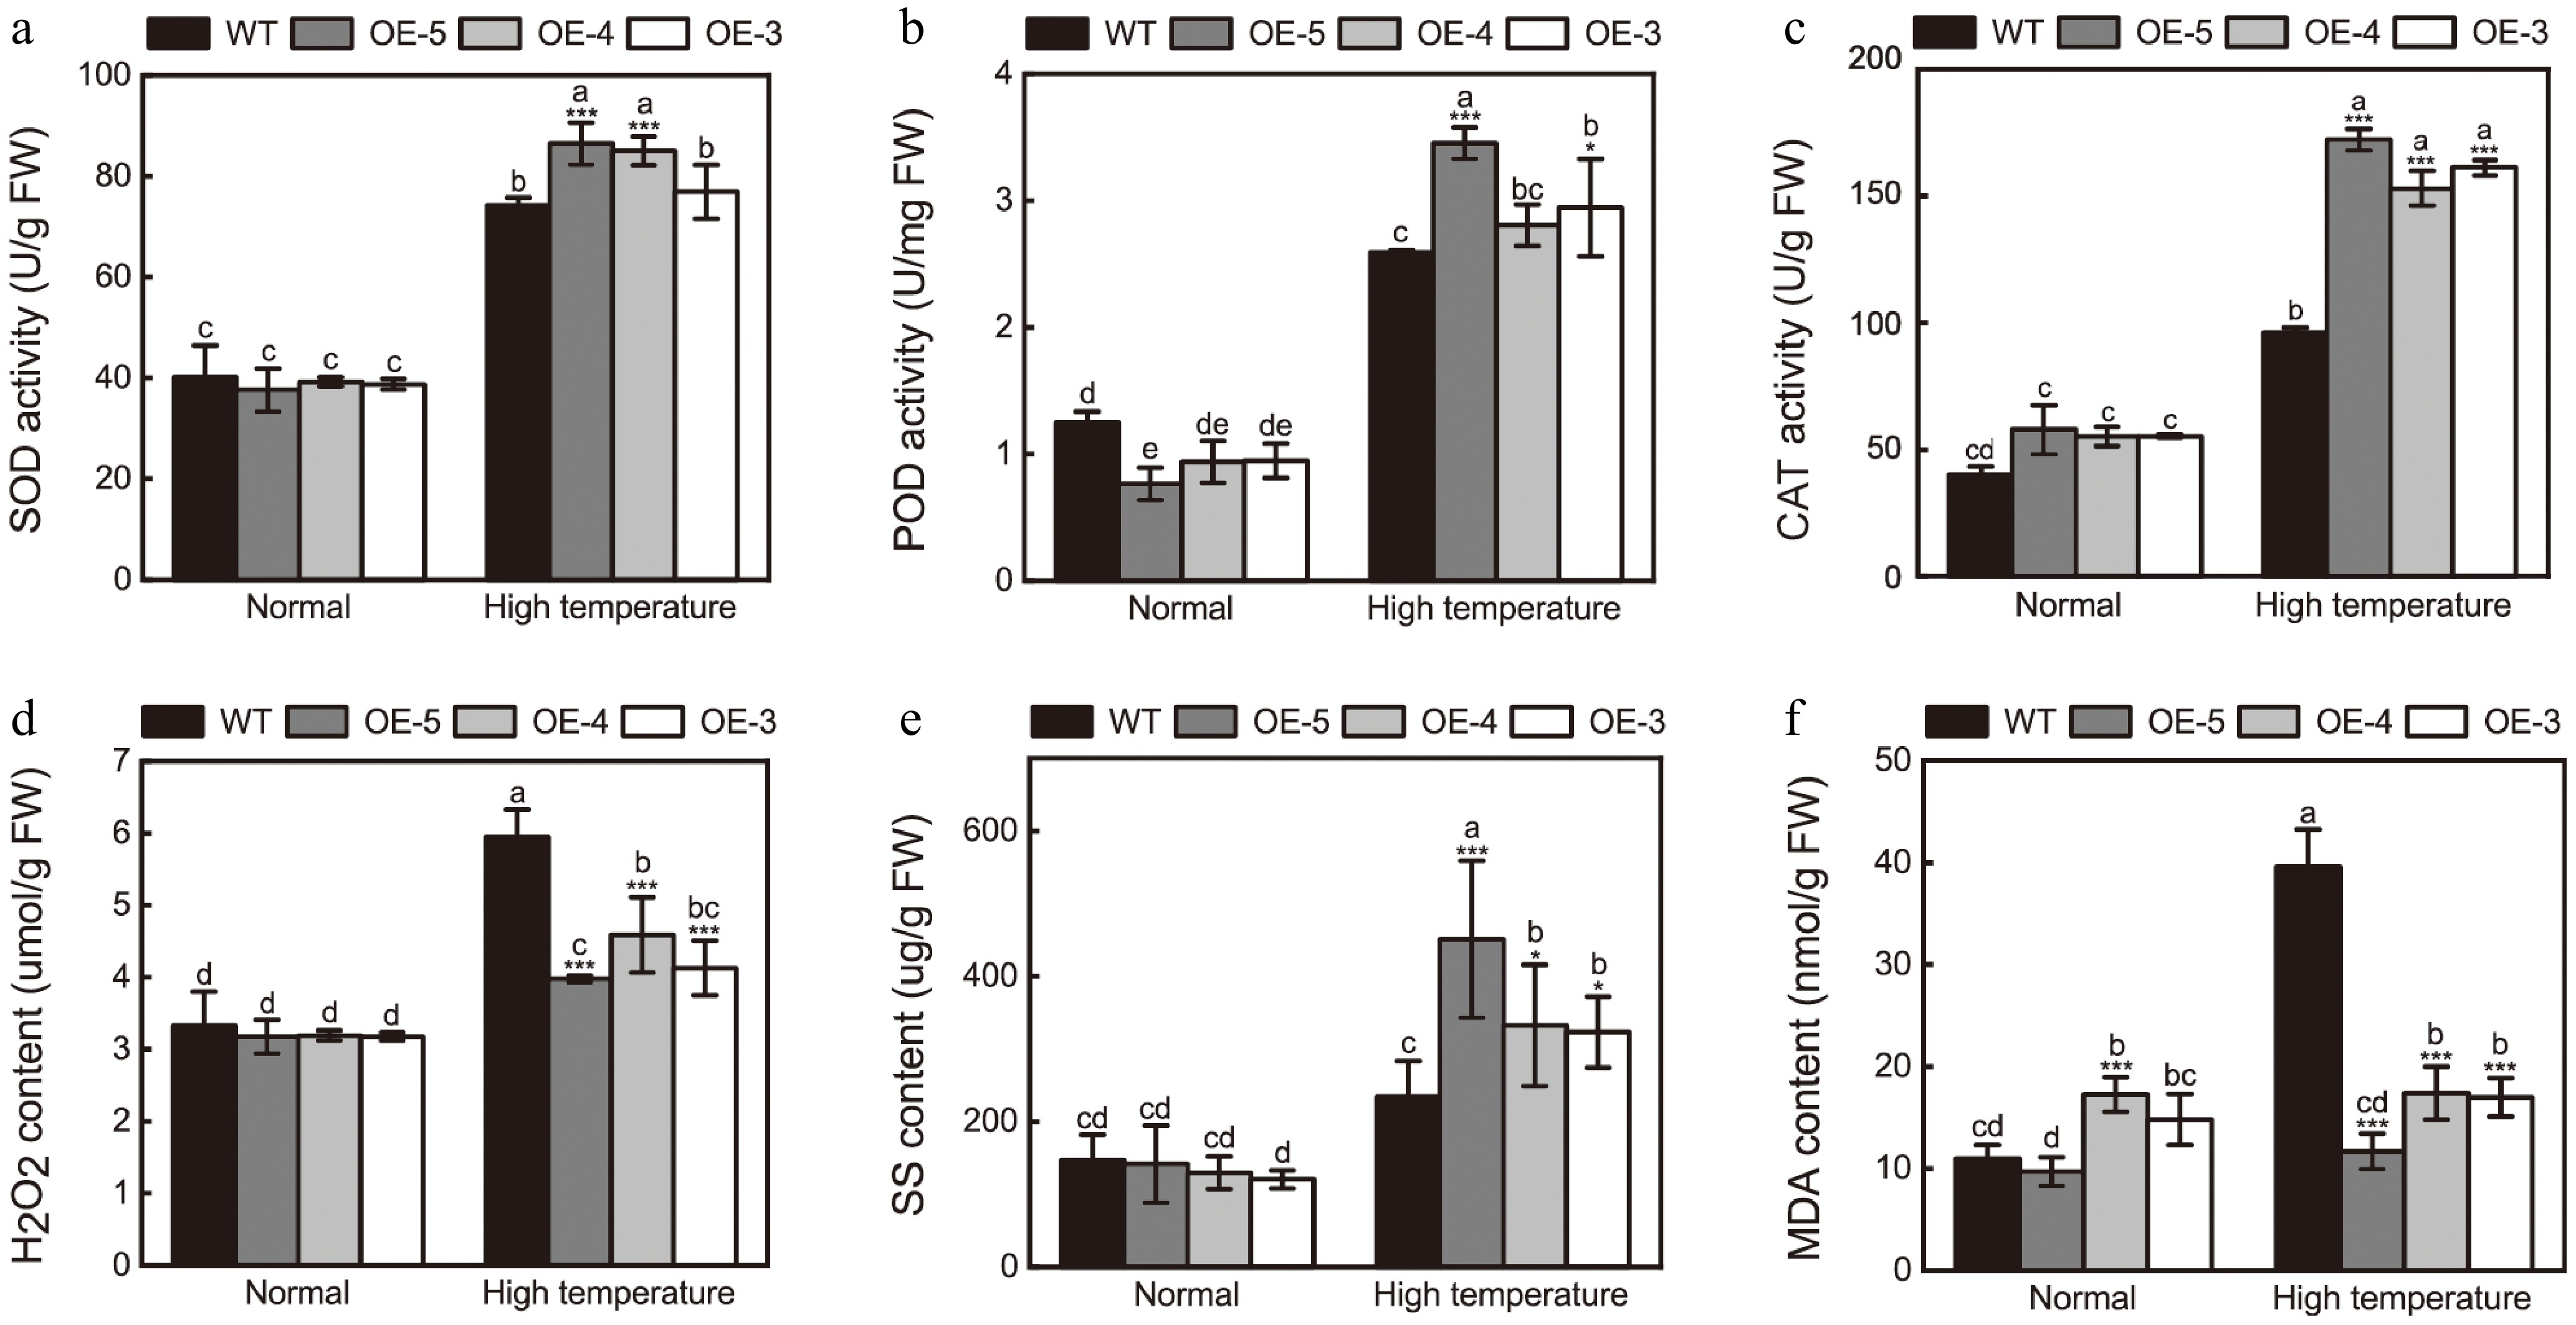
Figure 6.
Heat stress-induced physiological changes in WT and CsZF-HD13 transgenic Arabidopsis. (a)–(c) SOD, POD, and CAT activities under normal conditions and after 3 d at 38 °C. (d)–(f) MDA, H2O2, and SS levels under normal conditions and after 3 d at 38 °C. Error bars indicate SD. Asterisks mark significant WT vs transgenic differences (* p < 0.05; ** p < 0.01; *** p < 0.001); different letters indicate significant inter-line differences (p < 0.05).
-
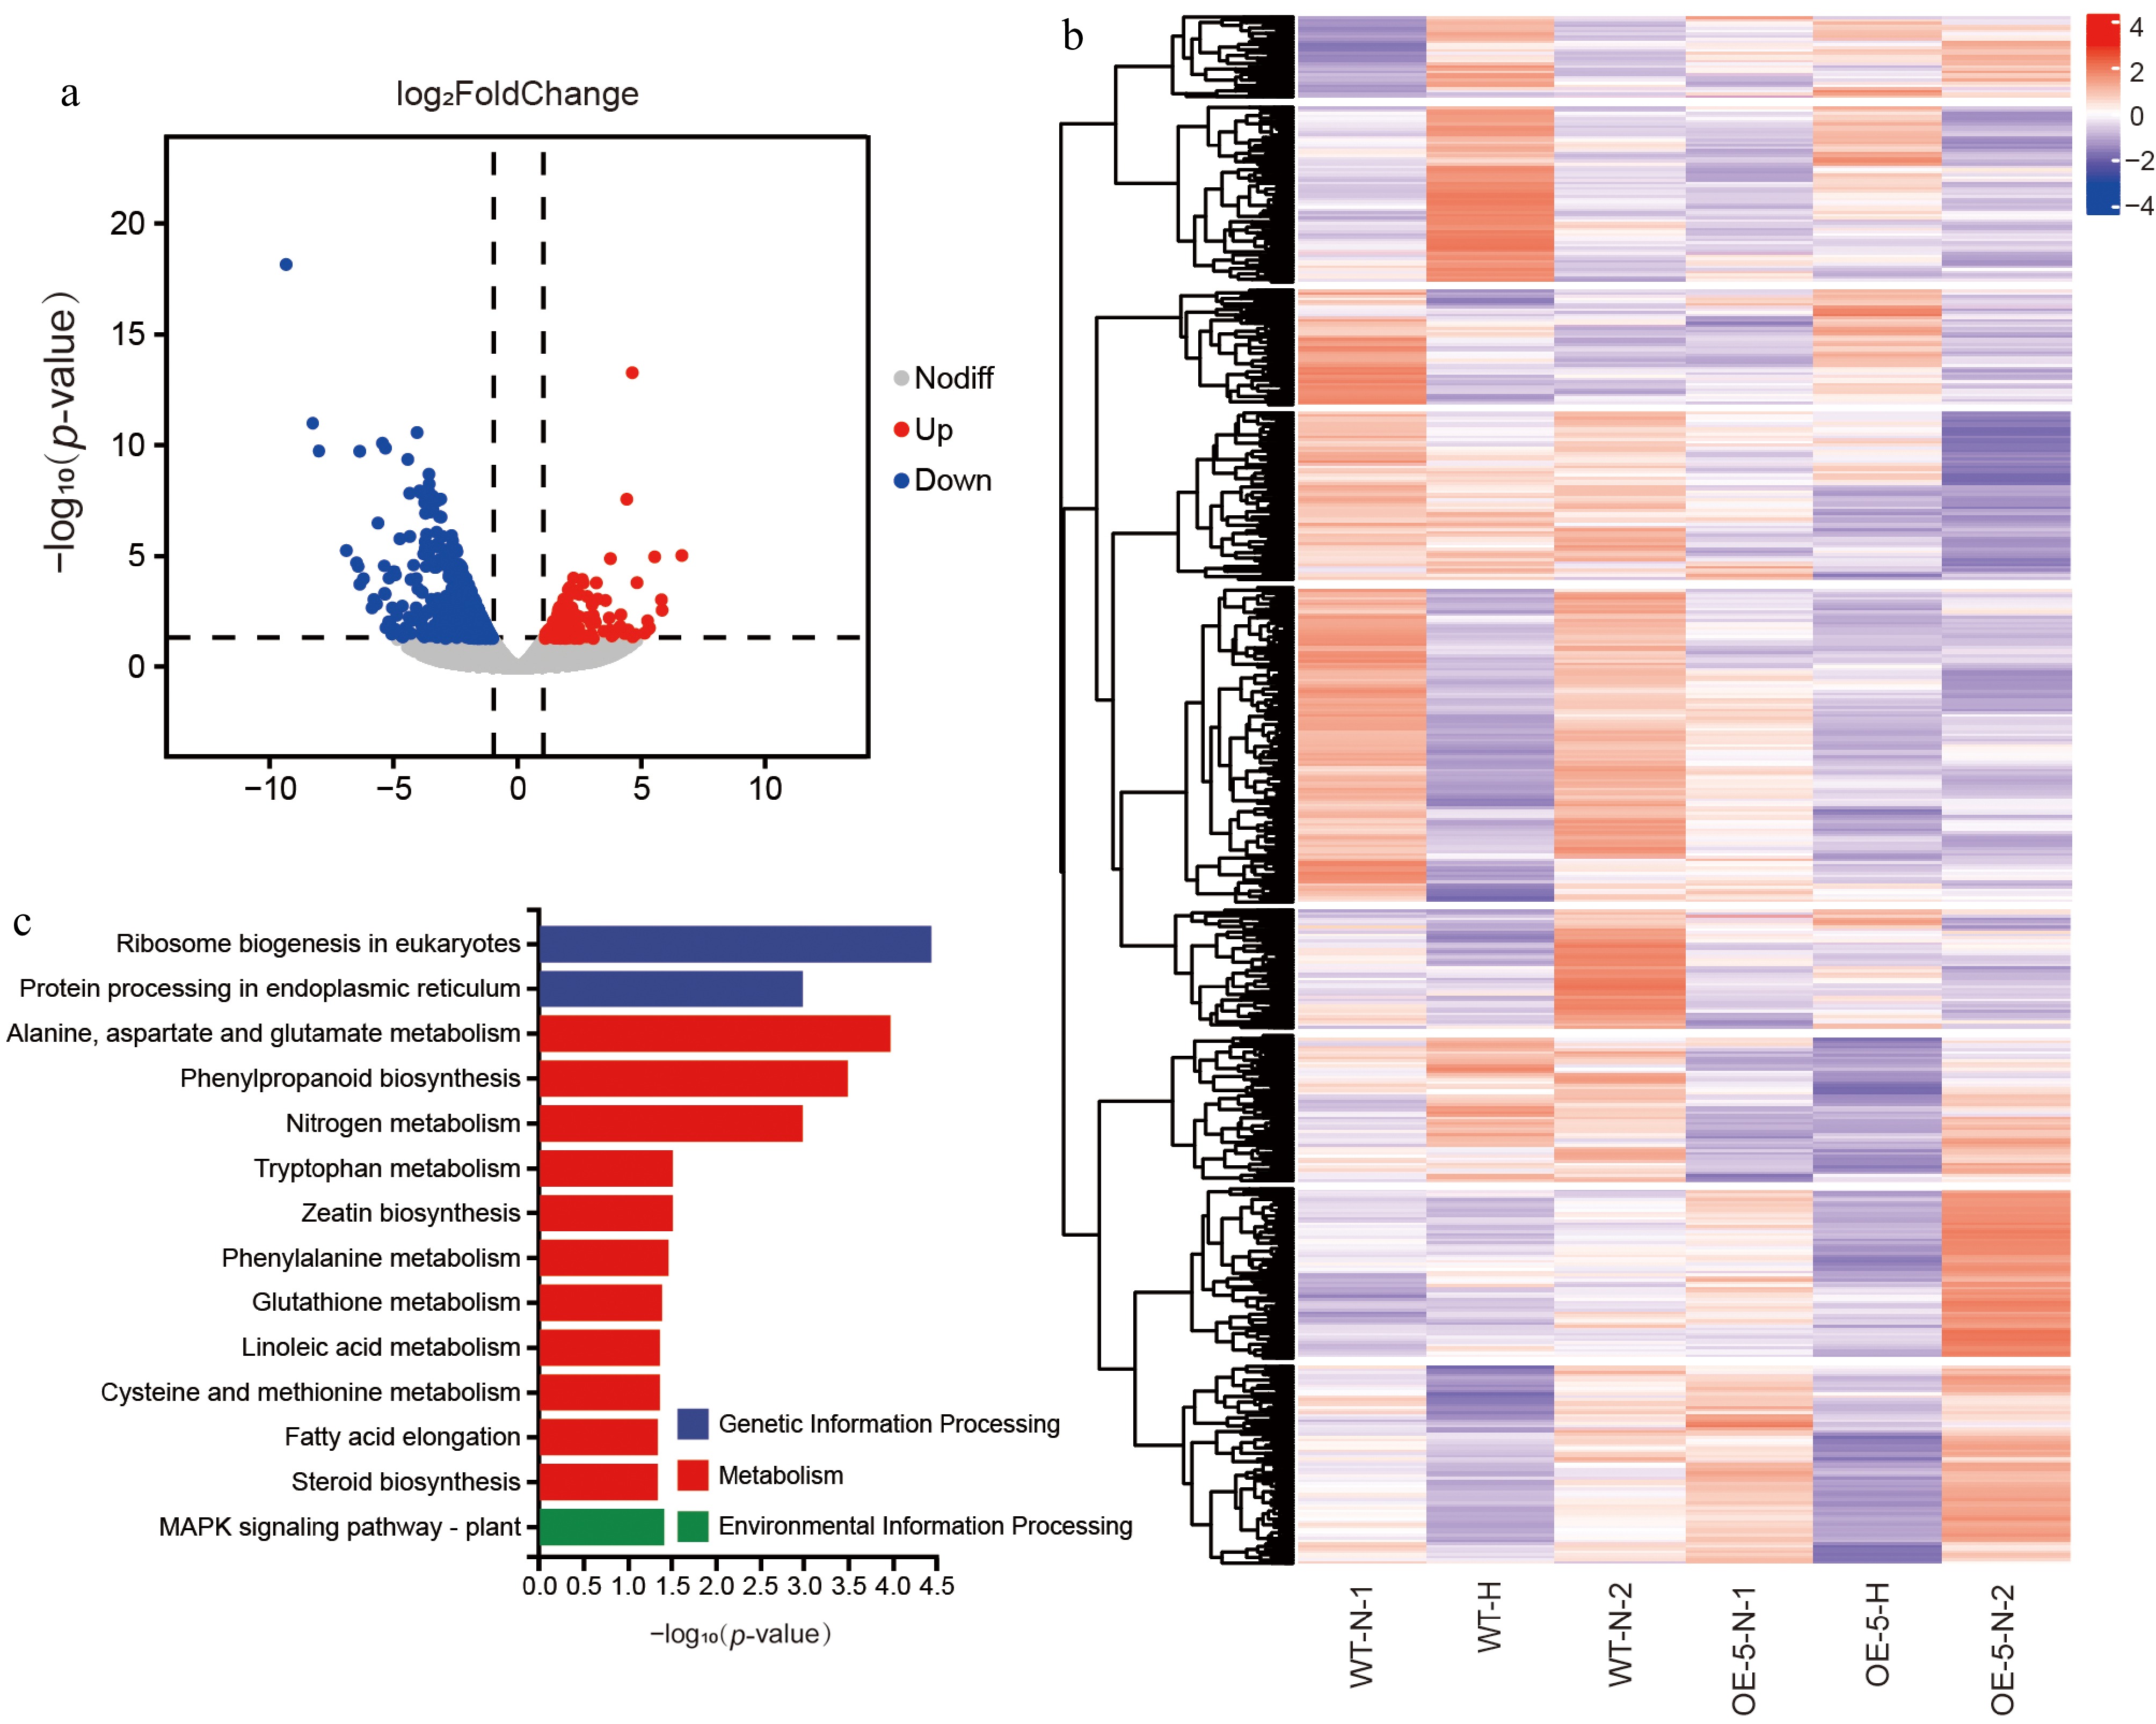
Figure 7.
Transcriptome analysis of transgenic plant and WT Arabidopsis. (a) Volcano plot of DEGs. Each point represents a gene. The two vertical dashed lines in the figure represent the thresholds for fold change in differential expression; the horizontal dashed line represents the threshold for statistical significance. Differentially expressed genes were identified using the criteria of |log2FoldChange| > 1 and p-value < 0.05. (b) Heatmap of clustered expression patterns of DEGs. (c) KEGG pathway enrichment analysis of upregulated genes.
-
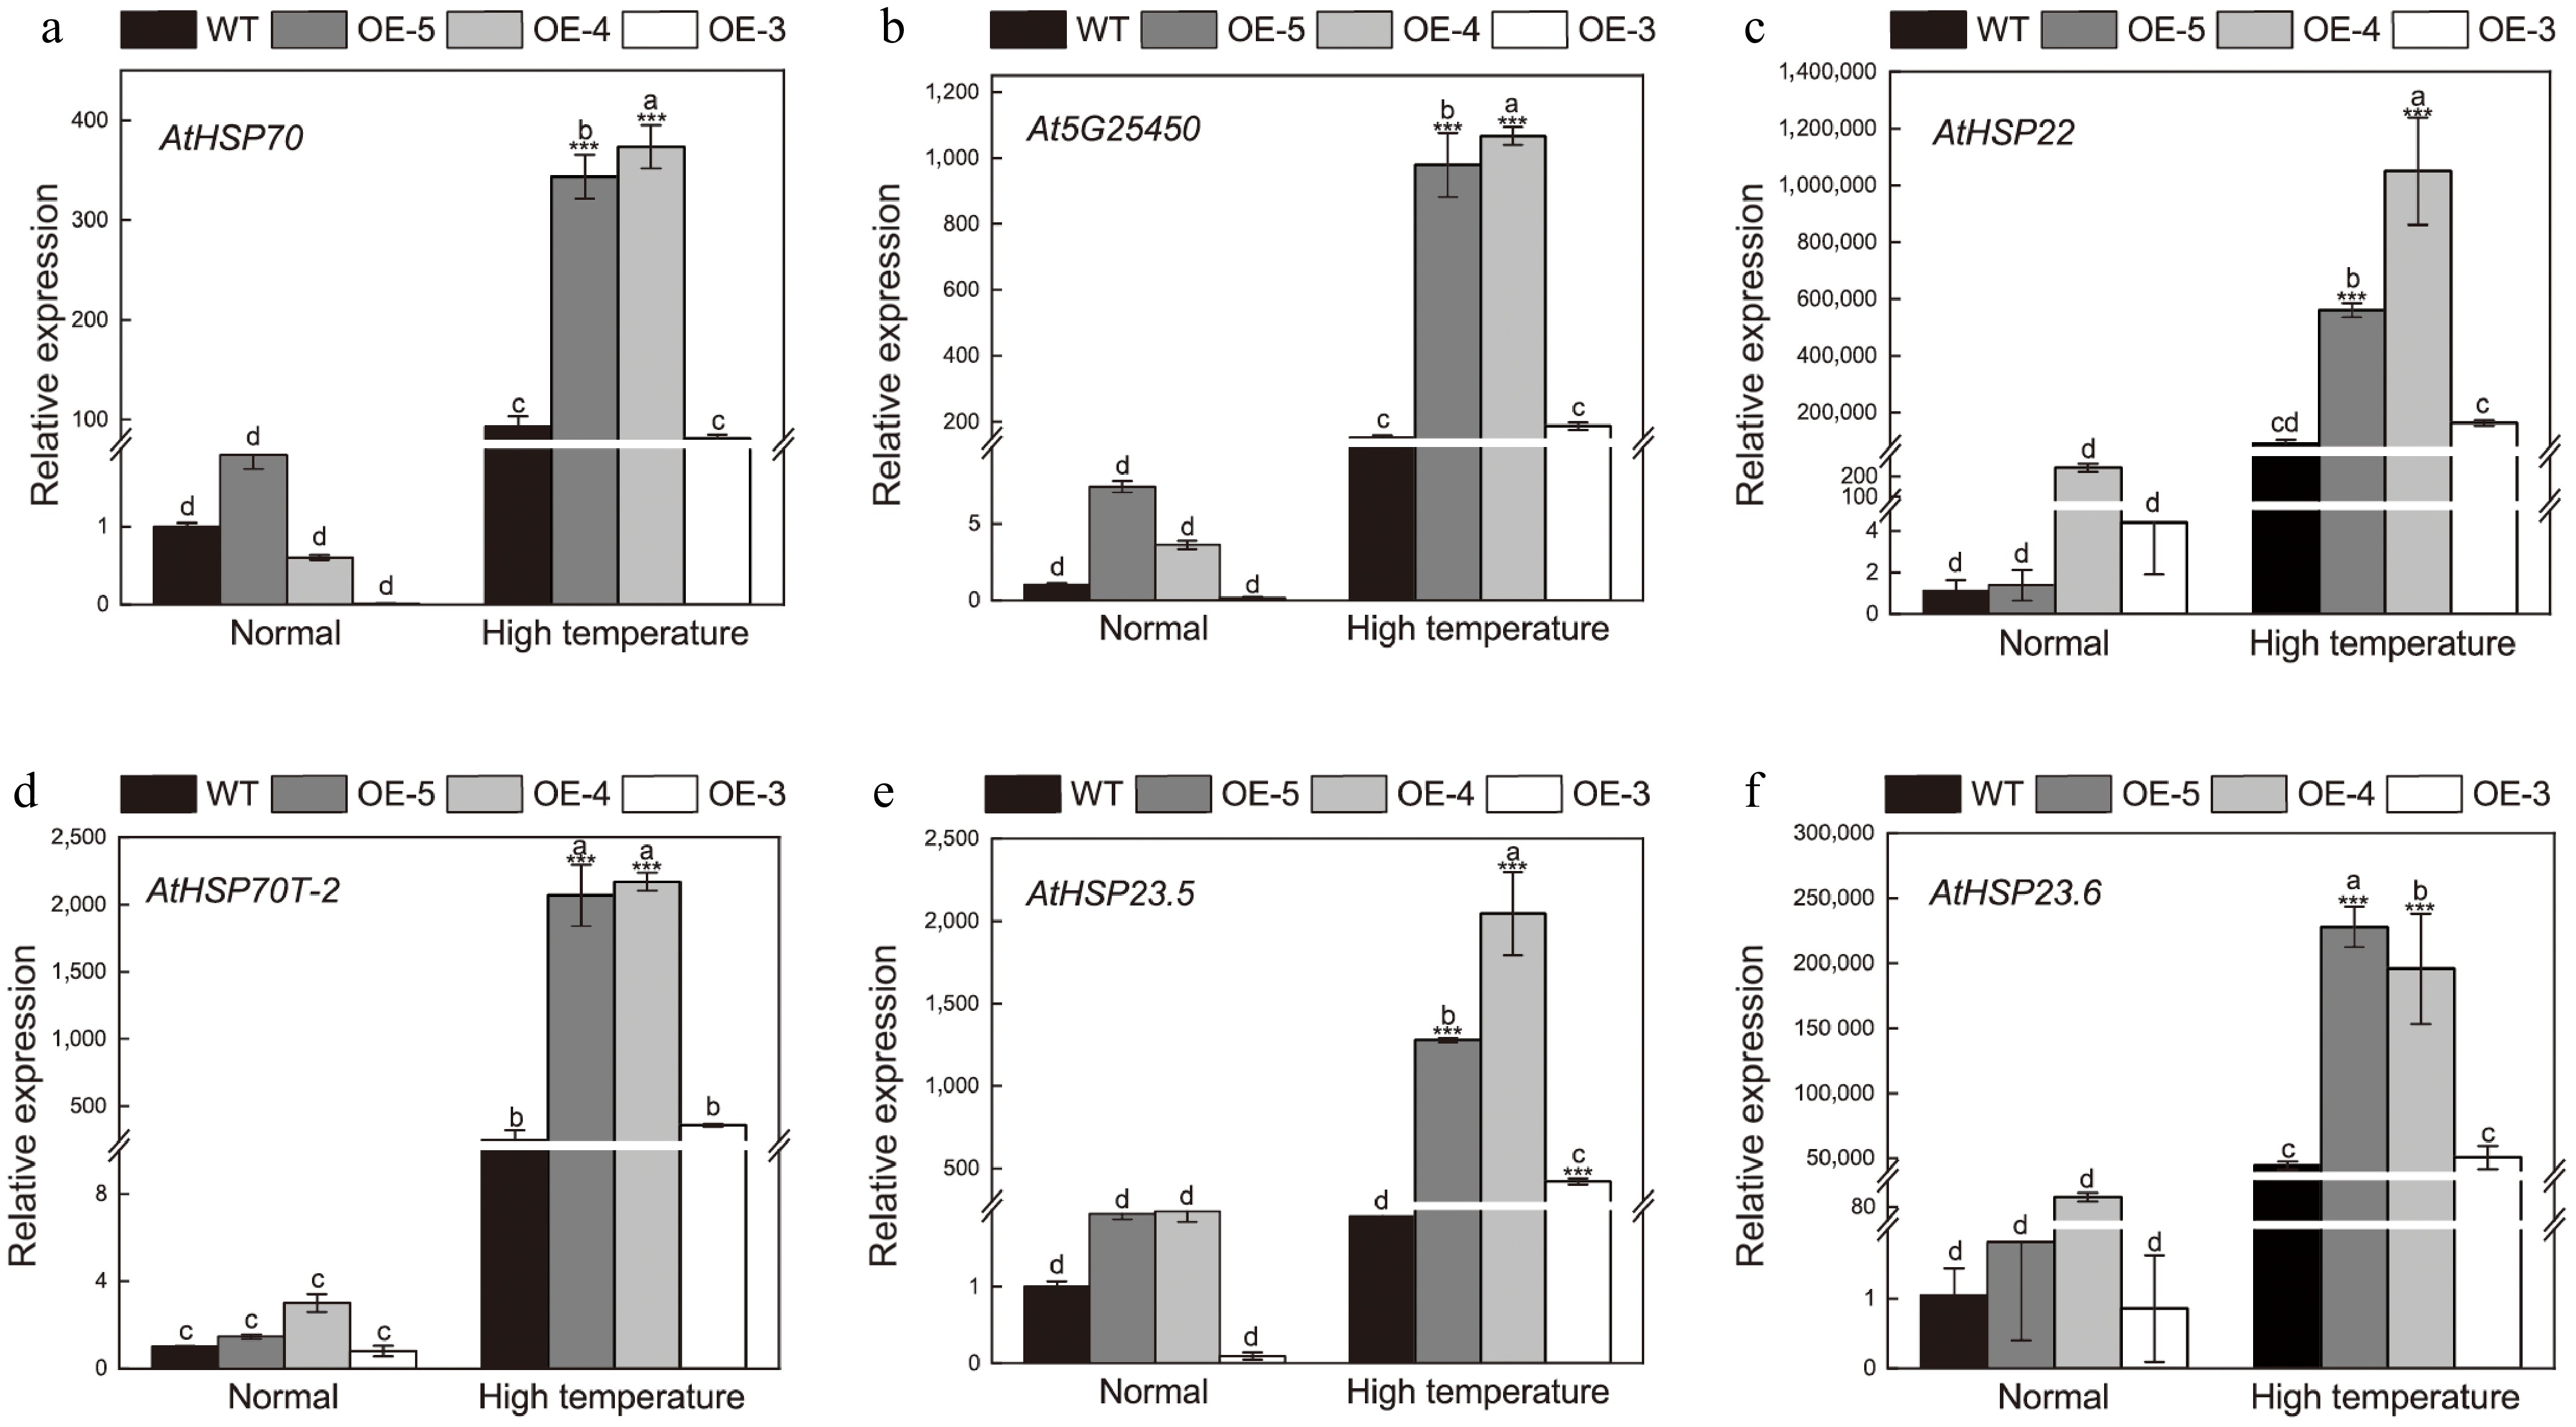
Figure 8.
Expression of heat-stress-responsive genes regulated by CsZF-HD13. Error bars indicate standard deviations (SD). Significant deviations of transgenic lines from the WT control are marked by asterisks (* p < 0.05; ** p < 0.01; *** p < 0.001).
Figures
(8)
Tables
(0)