-
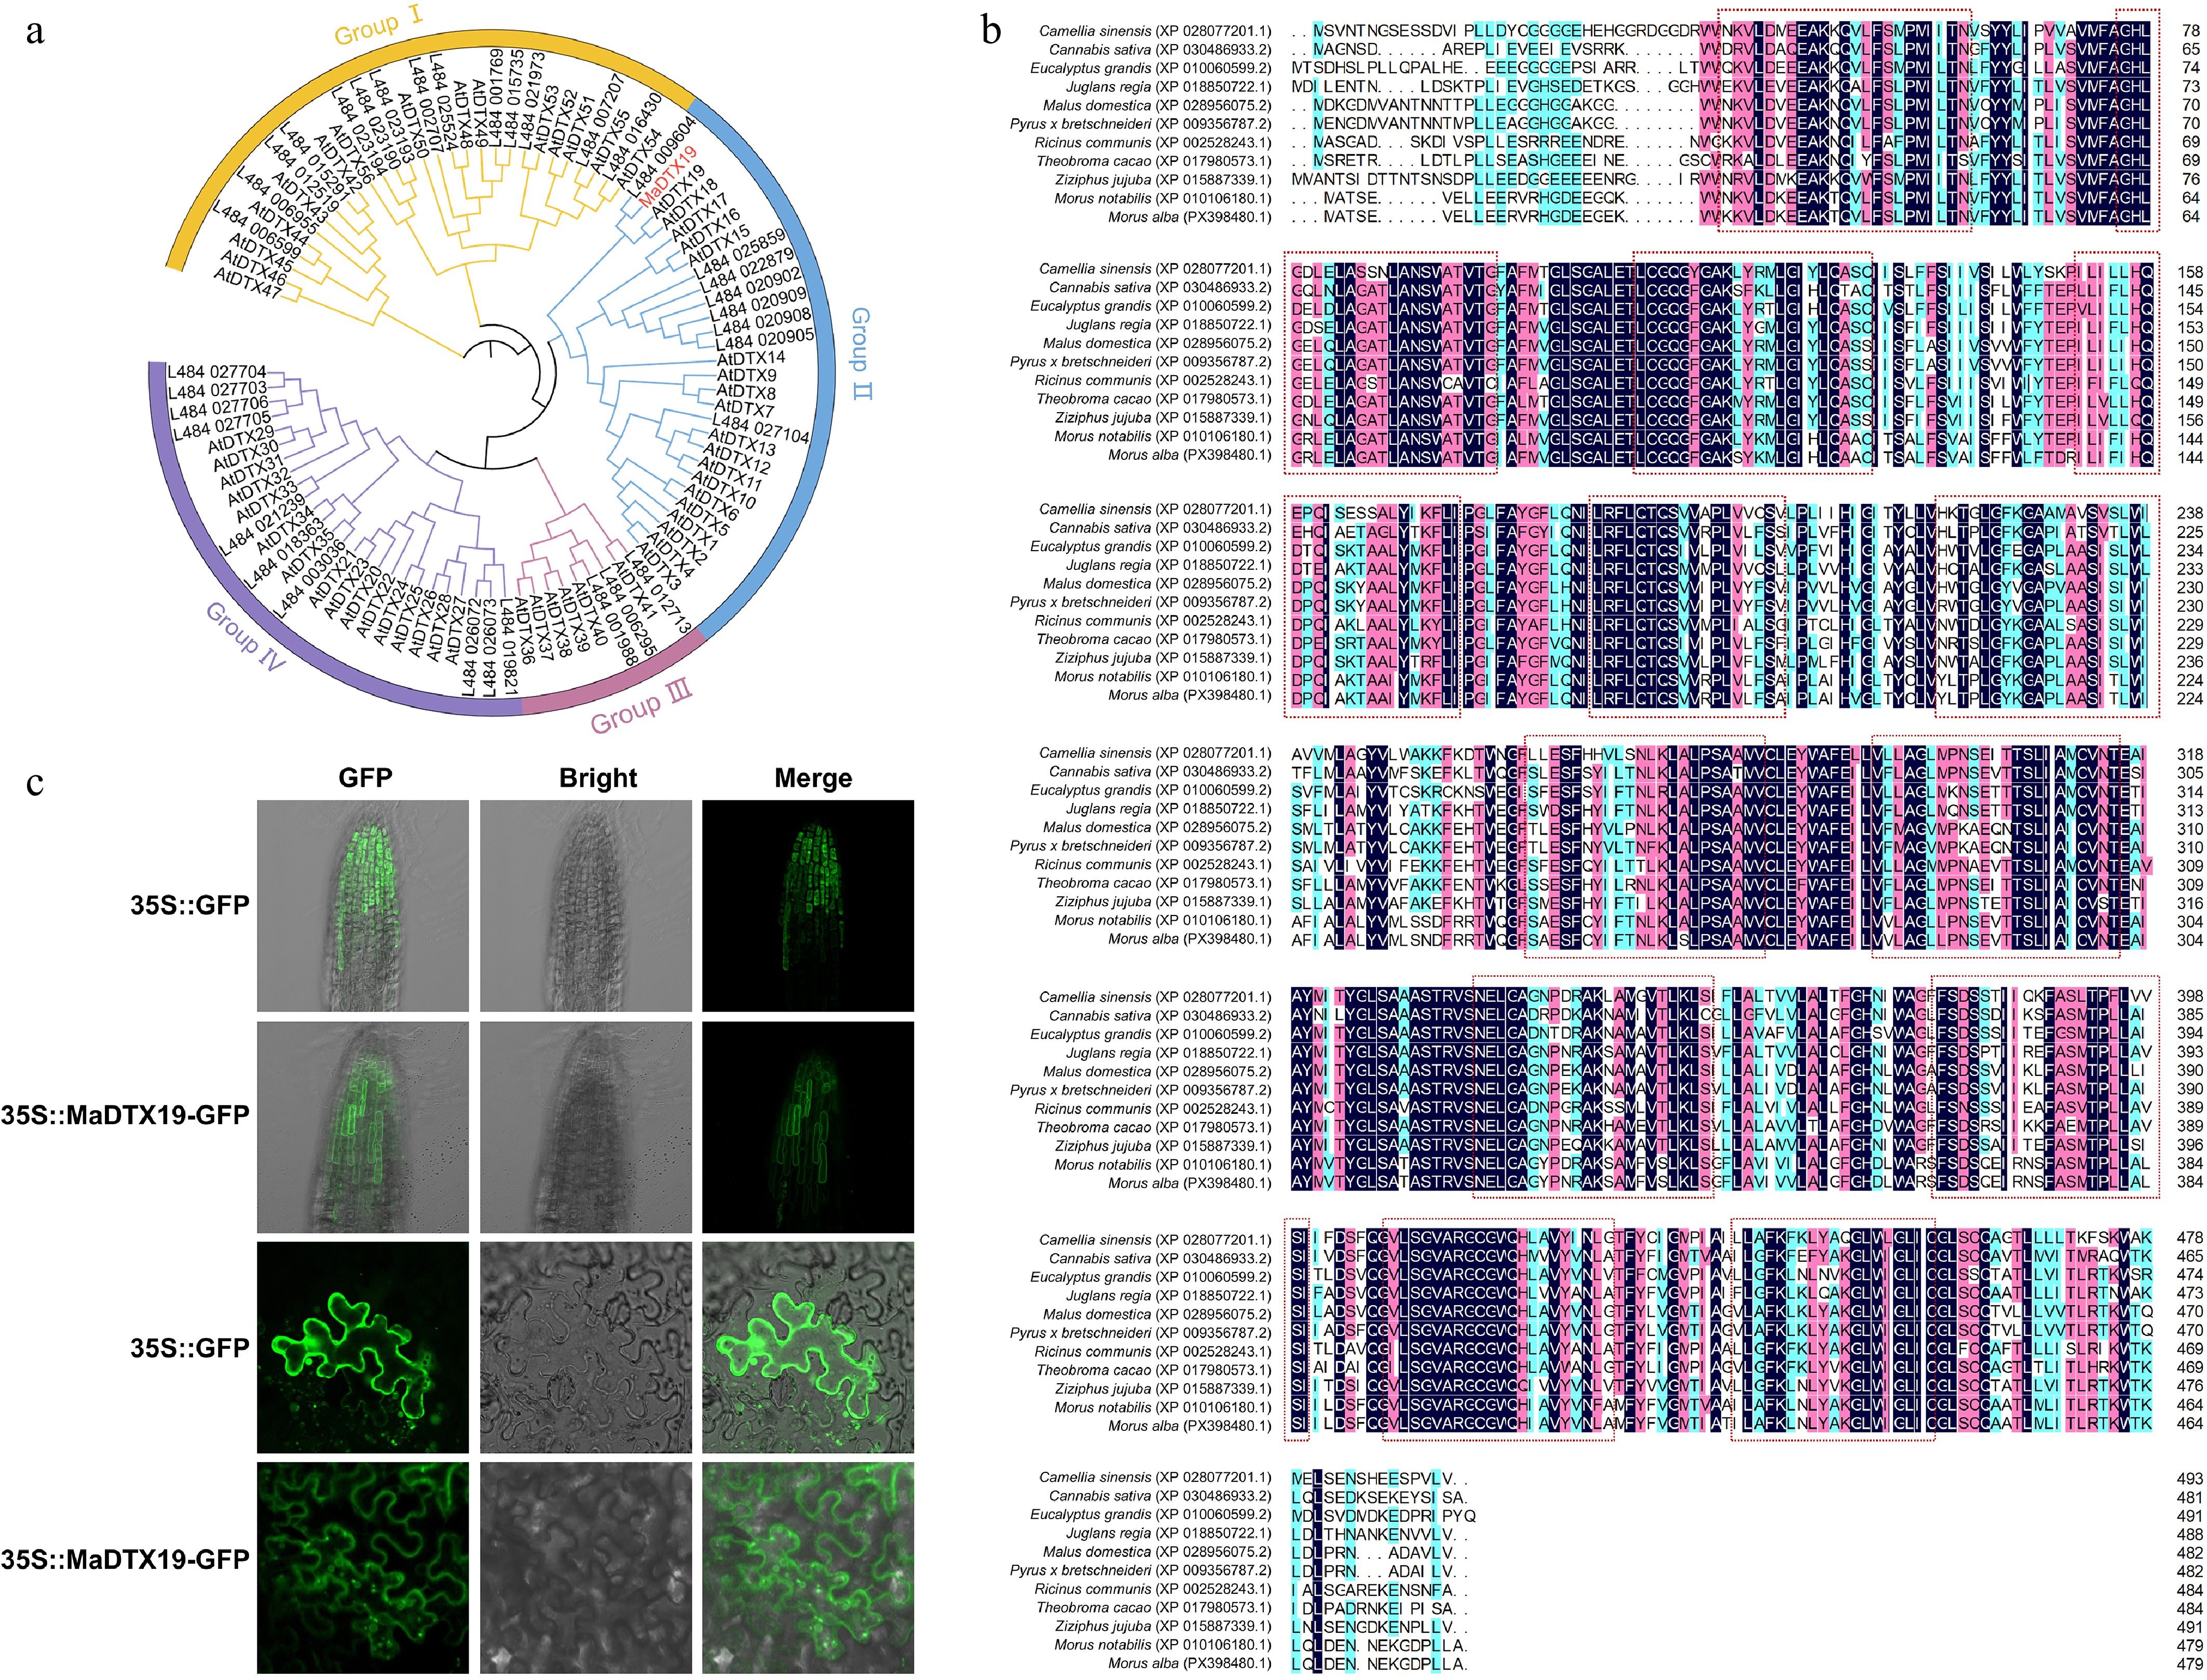
Figure 1.
Molecular characterization and subcellular localization of MaDTX19. (a) Phylogenetic analysis of MaDTX19 and MATE family proteins from Arabidopsis and mulberry. The phylogenetic tree was constructed using the neighbor-joining method with 1,000 bootstrap replicates. MaDTX19 (highlighted in red) clusters within MATE Group II with AtDTX18 and AtDTX19. (b) Transmembrane domain prediction of MaDTX19 and its homologs. The transmembrane regions are marked with dashed boxes. (c) Subcellular localization of MaDTX19 in N. benthamiana leaf epidermal cells and Arabidopsis root tips.
-
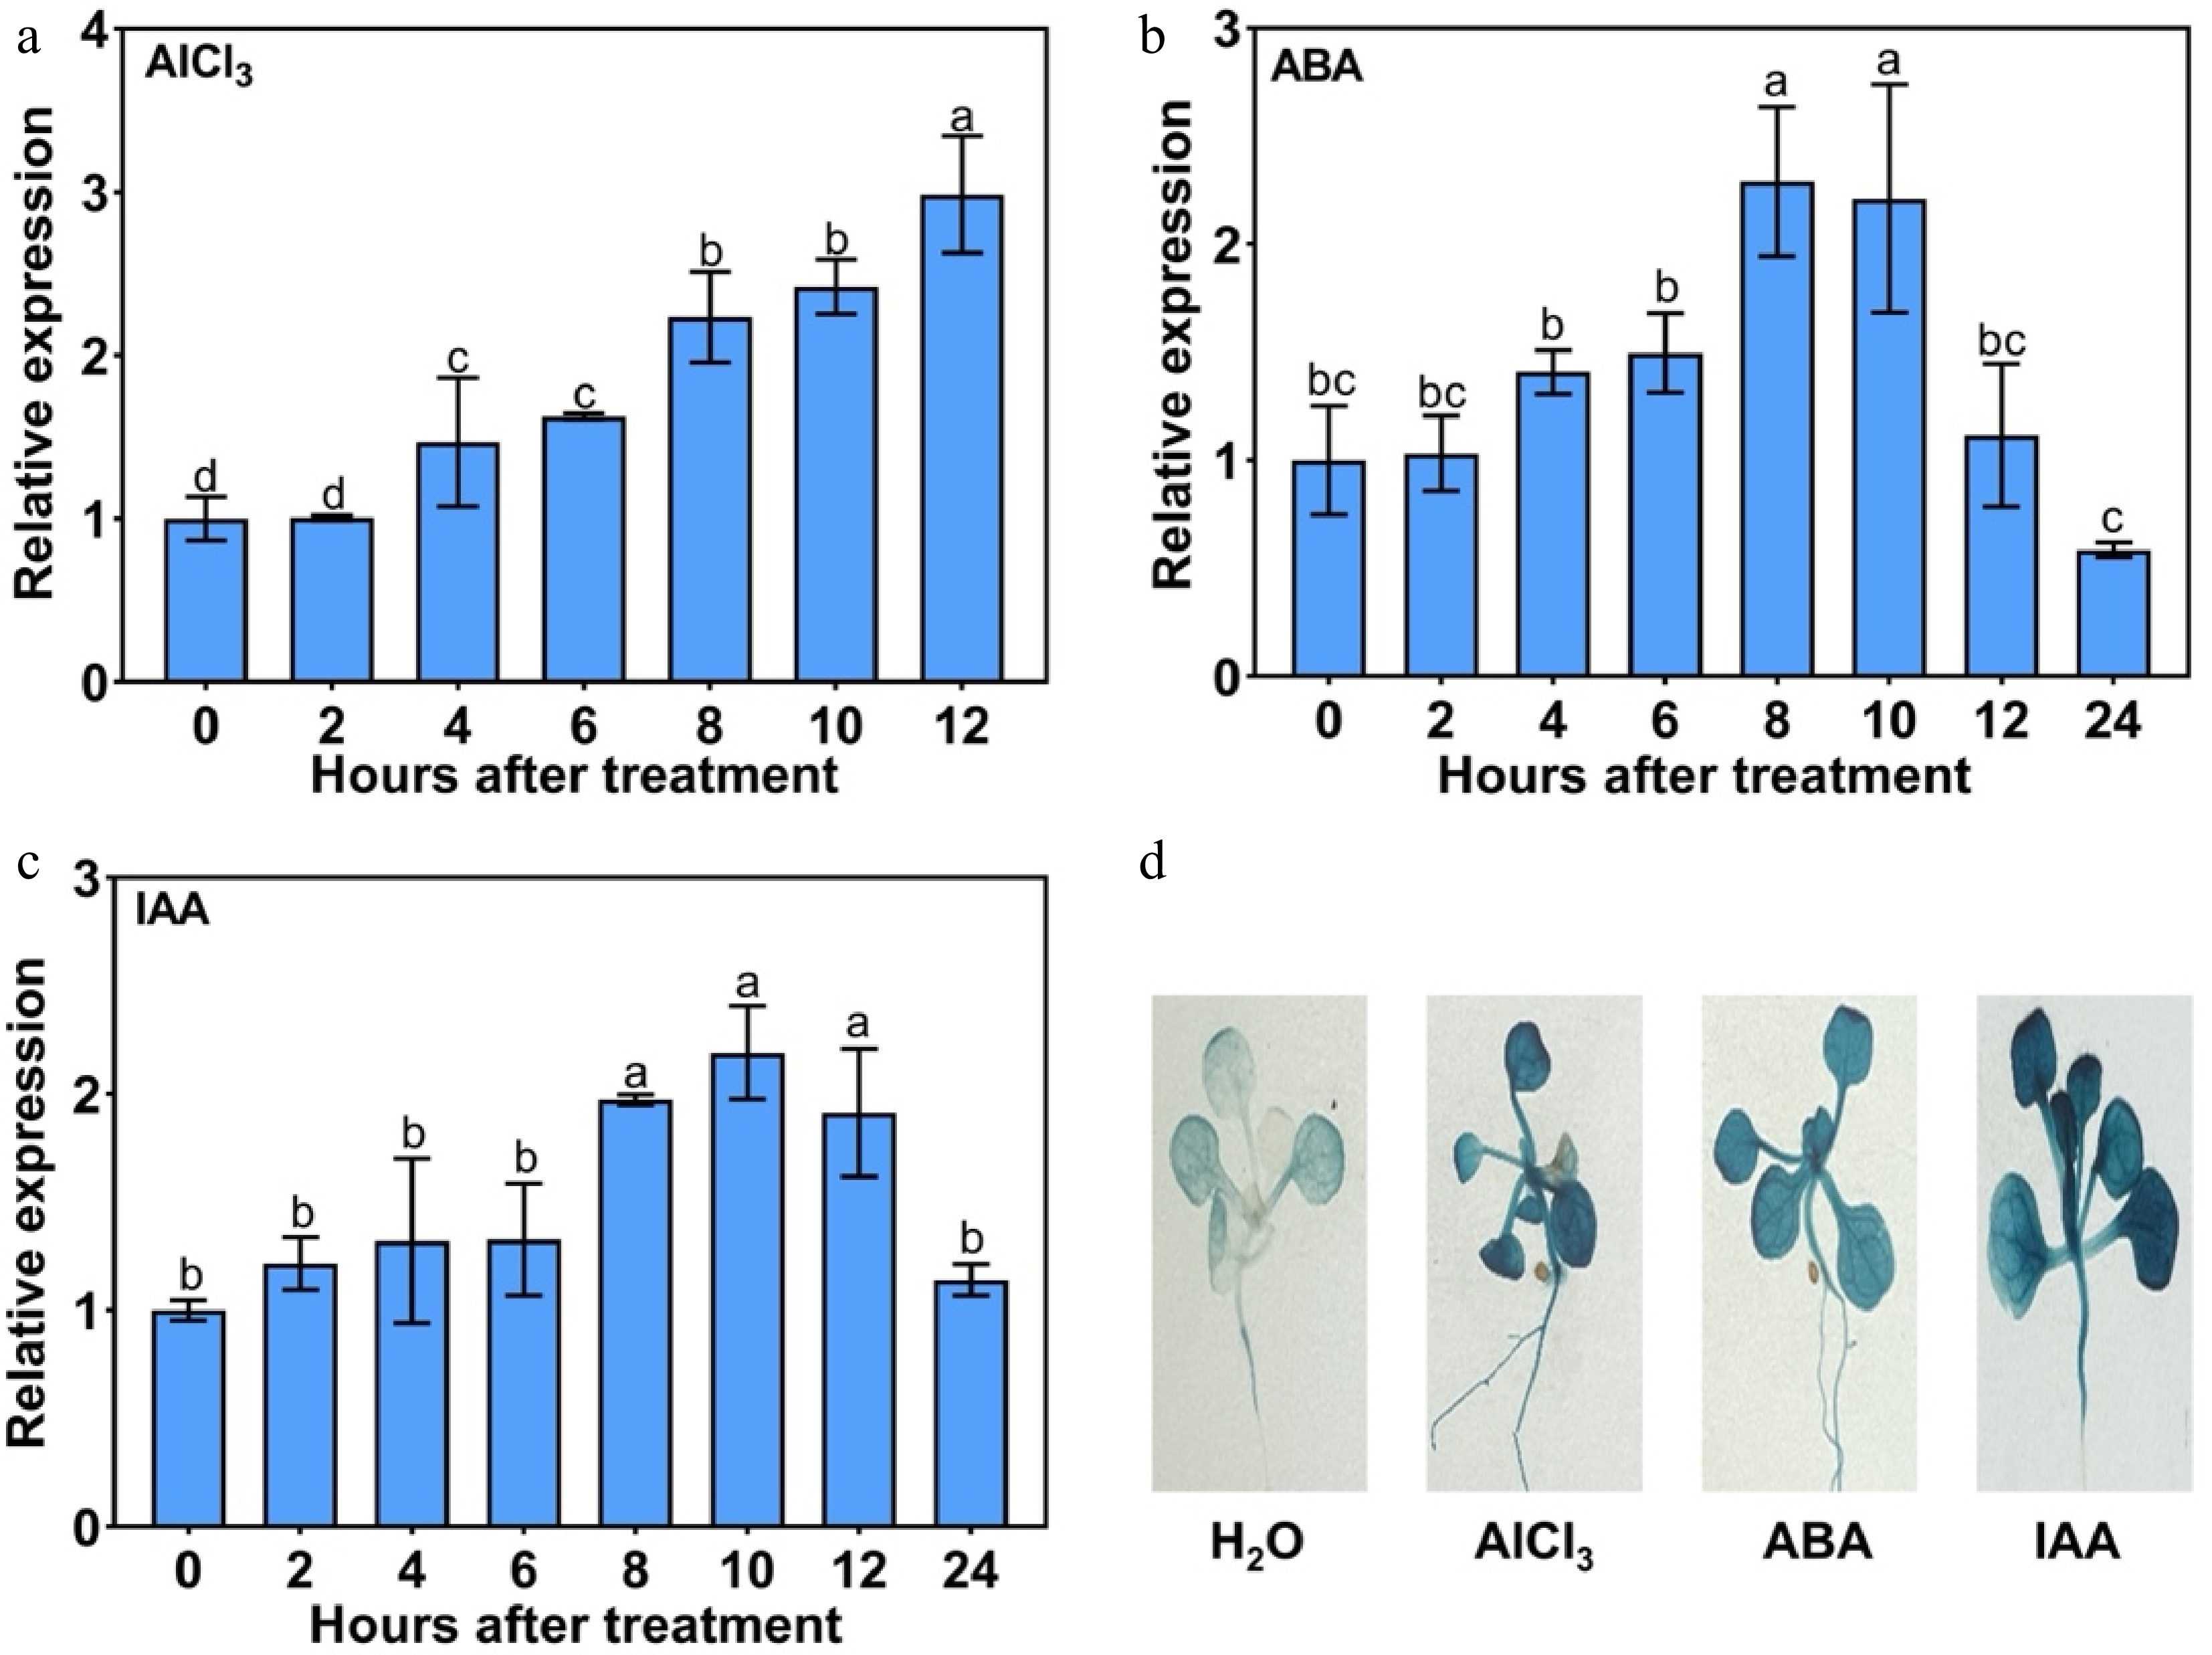
Figure 2.
Expression pattern of MaDTX19 in response to Al3+ stress and phytohormone treatments. (a) Time-course analysis of MaDTX19 transcript levels in mulberry seedlings under 80 mmol·L−1 Al3+ stress, detected by RT-qPCR. MaDTX19 expression in mulberry seedlings treated with (b) 50 μmol·L−1 ABA and (c) 50 μmol·L−1 IAA. (d) GUS staining analysis of pMaDTX19::GUS transgenic Arabidopsis seedlings under different treatments (H2O, 0.8 mmol·L−1 AlCl3, 50 μmol·L−1 ABA, 50 μmol·L−1 IAA). All RT-qPCR data are presented as mean ± SD of three biological replicates with three technical replicates each. Different letters indicate significant differences (p < 0.05).
-
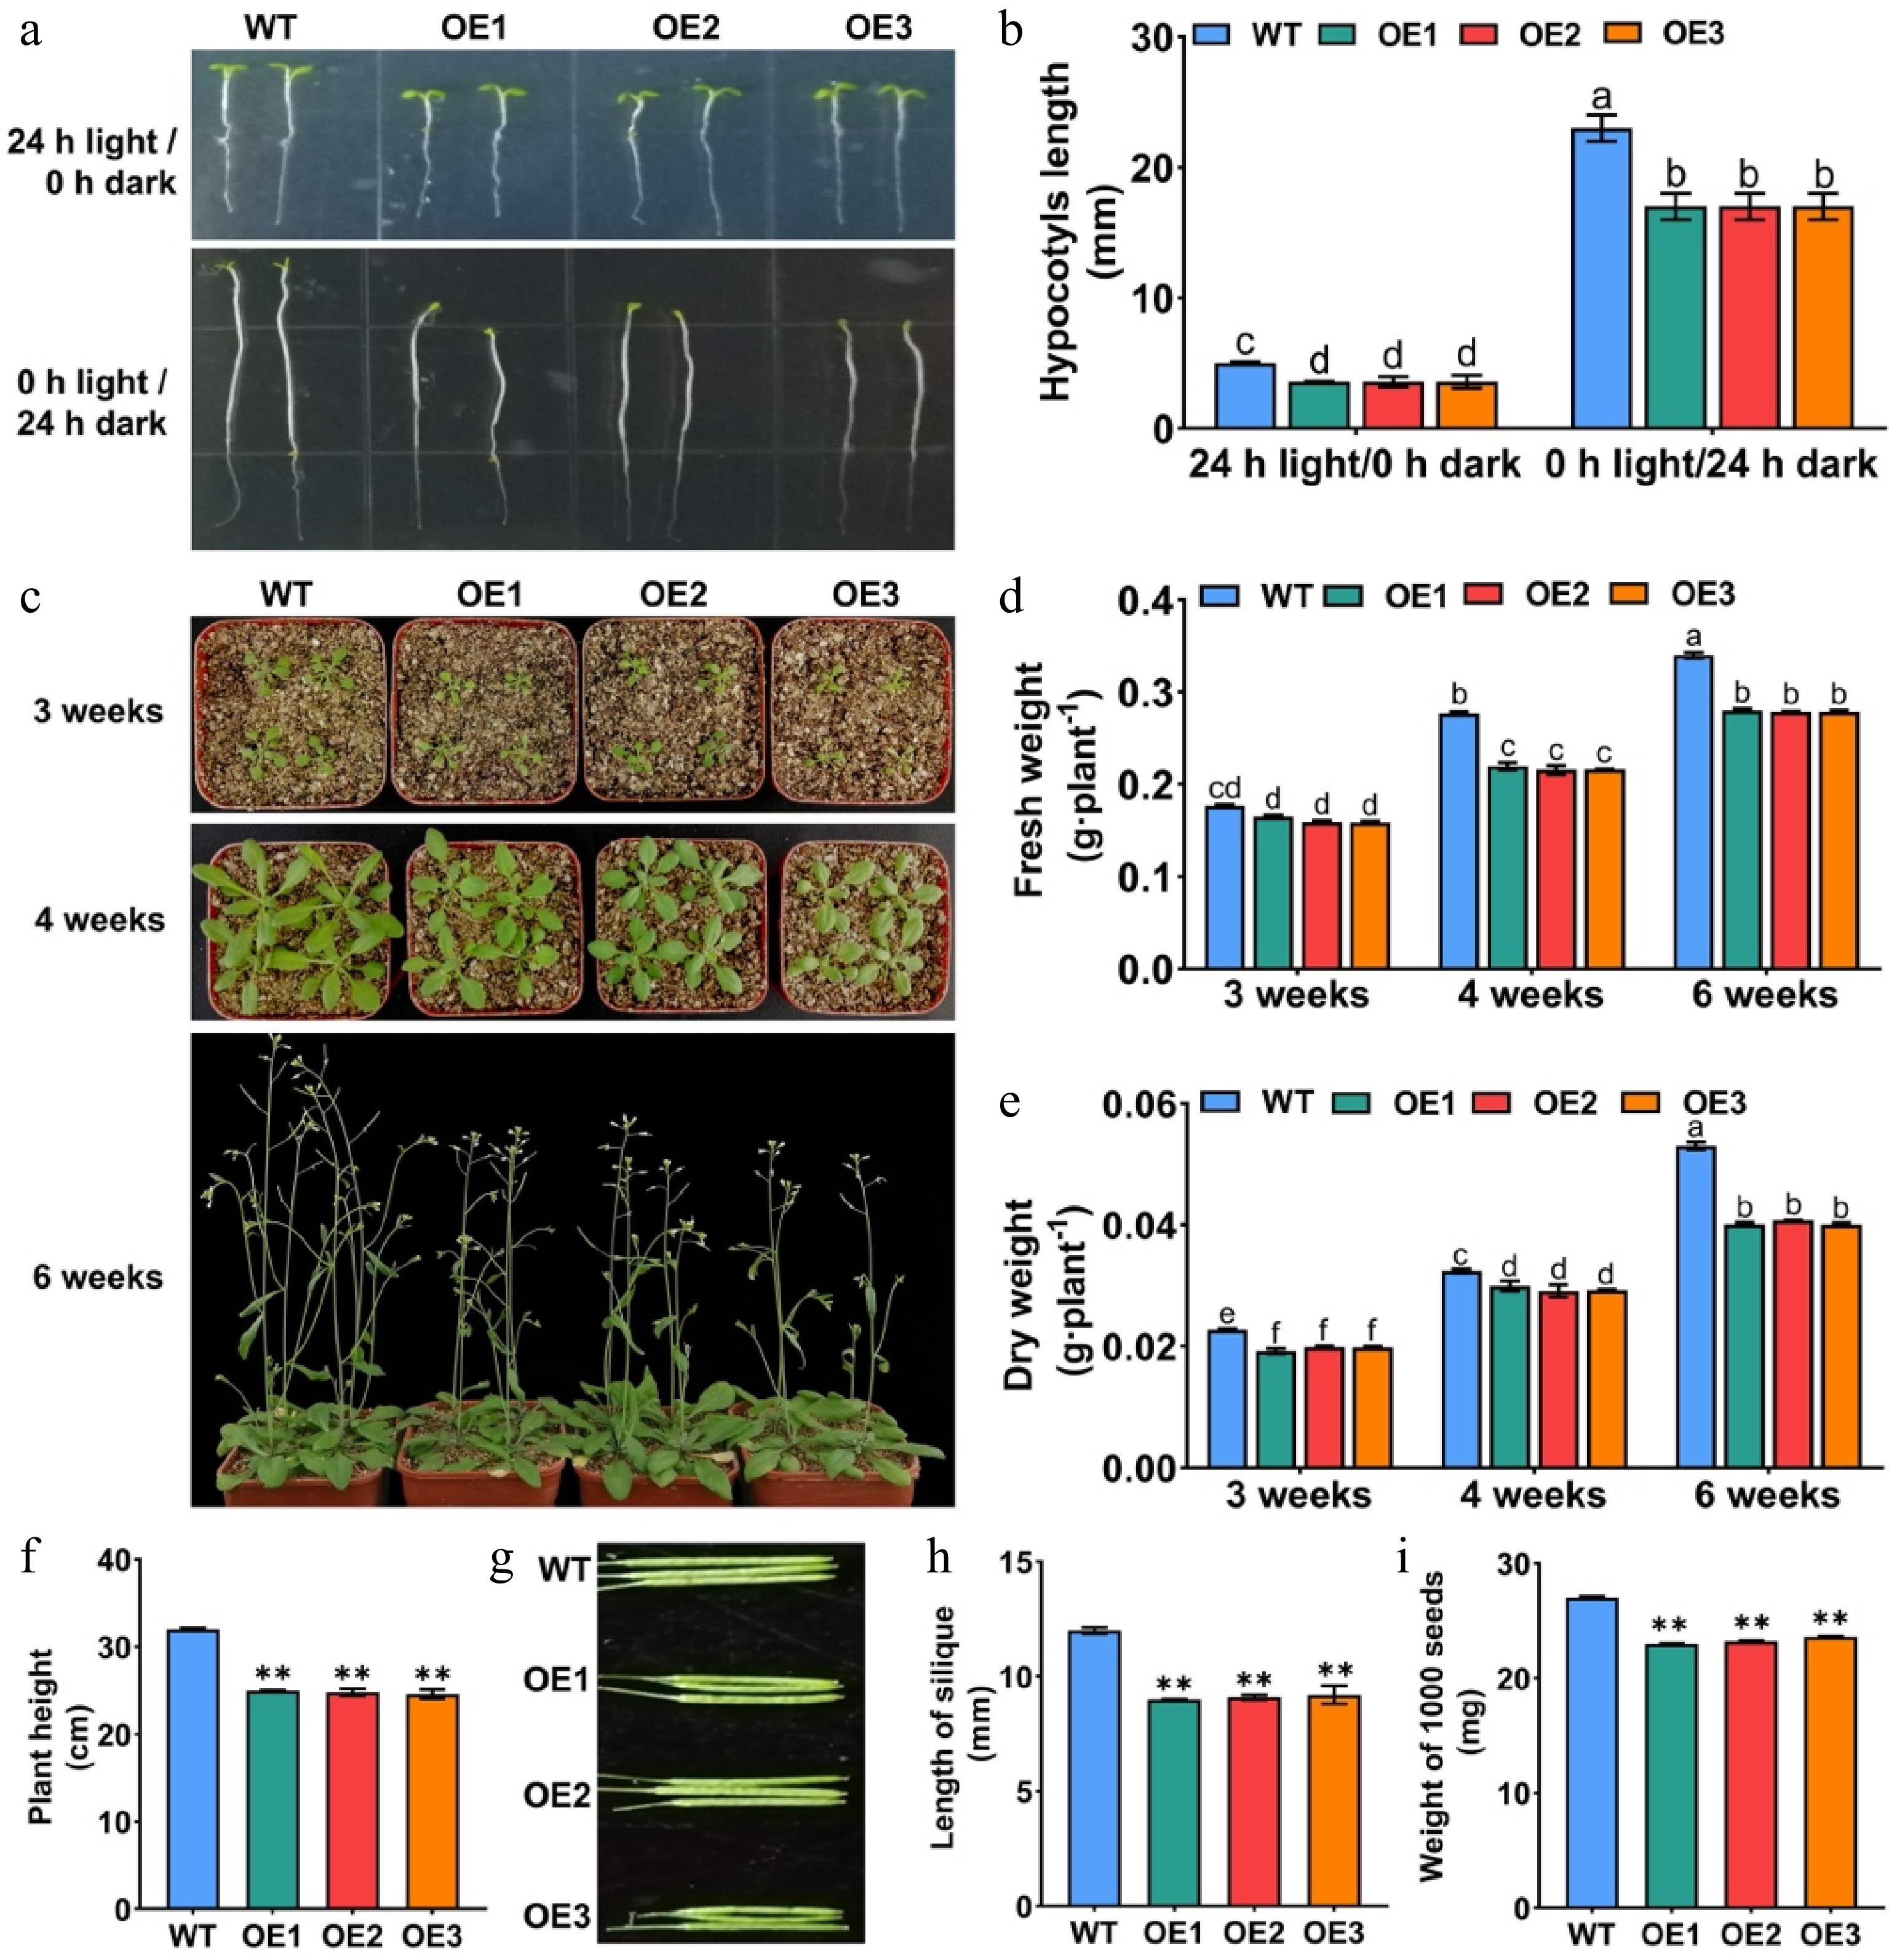
Figure 3.
Ectopic expression of MaDTX19 suppresses plant growth and development in Arabidopsis. (a) Hypocotyl phenotypes of seven-day-old wild-type (WT) and MaDTX19-overexpressing (OE) Arabidopsis seedlings grown under (a) continuous light (24 h light/0 h dark) and dark (0 h light/24 h dark) conditions. (b) Hypocotyl length of seven-day-old WT and OE Arabidopsis seedlings grown under continuous light and dark. (c) Representative phenotypes of WT and MaDTX19-OE plants under standard photoperiod. Quantitative analysis of growth and reproductive traits: (d) fresh weight, (e) dry weight, (f) plant height, (g) silique phenotype, (h) silique length, and (i) thousand-seed weight. Data represent the mean ± SD. Asterisks indicate significant differences between WT and OE transgenic lines (t-test, ** p < 0.01). Different letters indicate statistically significant differences among treatments (p < 0.05).
-
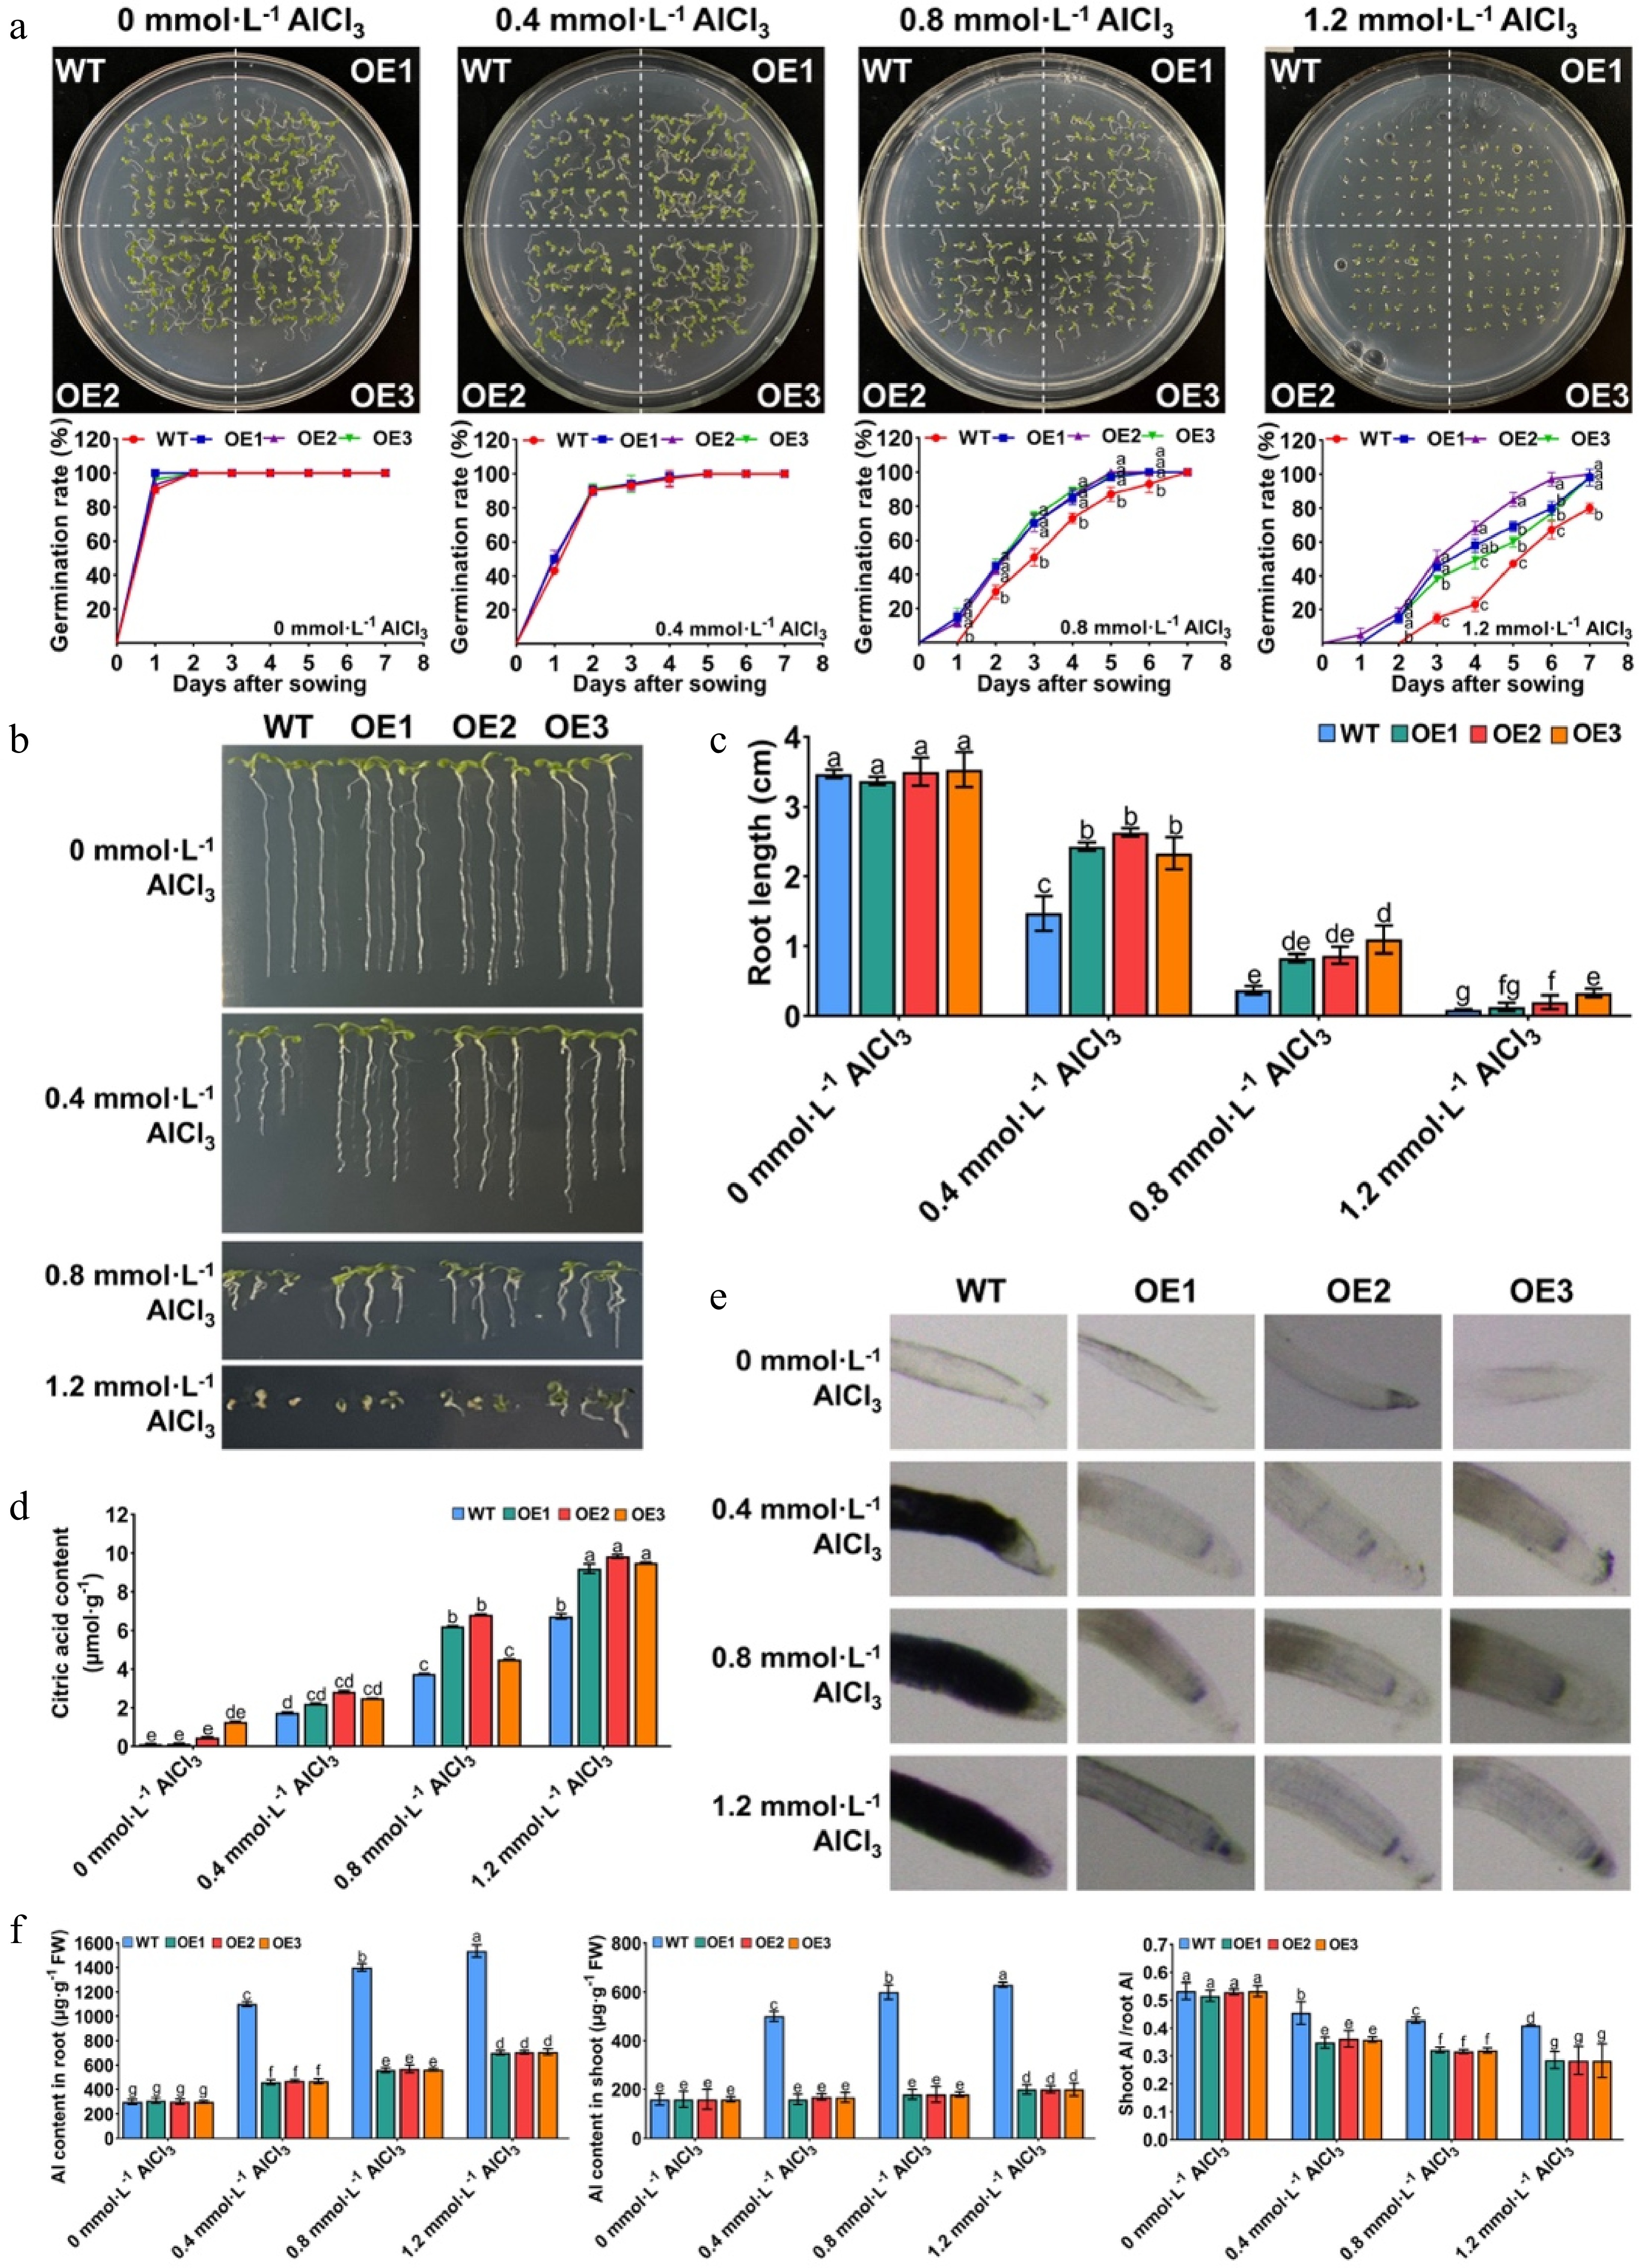
Figure 4.
MaDTX19 enhances Al3+ tolerance by promoting citrate secretion and reducing Al3+ accumulation in transgenic Arabidopsis. (a) Germination kinetics of WT and MaDTX19-OE seeds under 0, 0.4, 0.8, 1.2 mmol·L−1 AlCl3 stress. Germination rate was recorded daily for 7 d. Primary root length of seedlings grown on MS medium supplemented with (b) 0, 0.4, 0.8, 1.2 mmol·L−1 AlCl3 and (c) its quantitative analysis. (d) Citrate content in root tips under AlCl3 stress. (e) Hematoxylin staining of root tips (red color indicates Al3+ accumulation). (f) Al3+ content in roots and shoots, and the calculated translocation factor (shoot Al3+/root Al3+ ratio) of WT and OE lines under Al3+ stress. OE1-3 represent different MaDTX19-OE lines. Data are presented as mean ± SD. Different lowercase letters above bars indicate significant differences (p < 0.05).
-
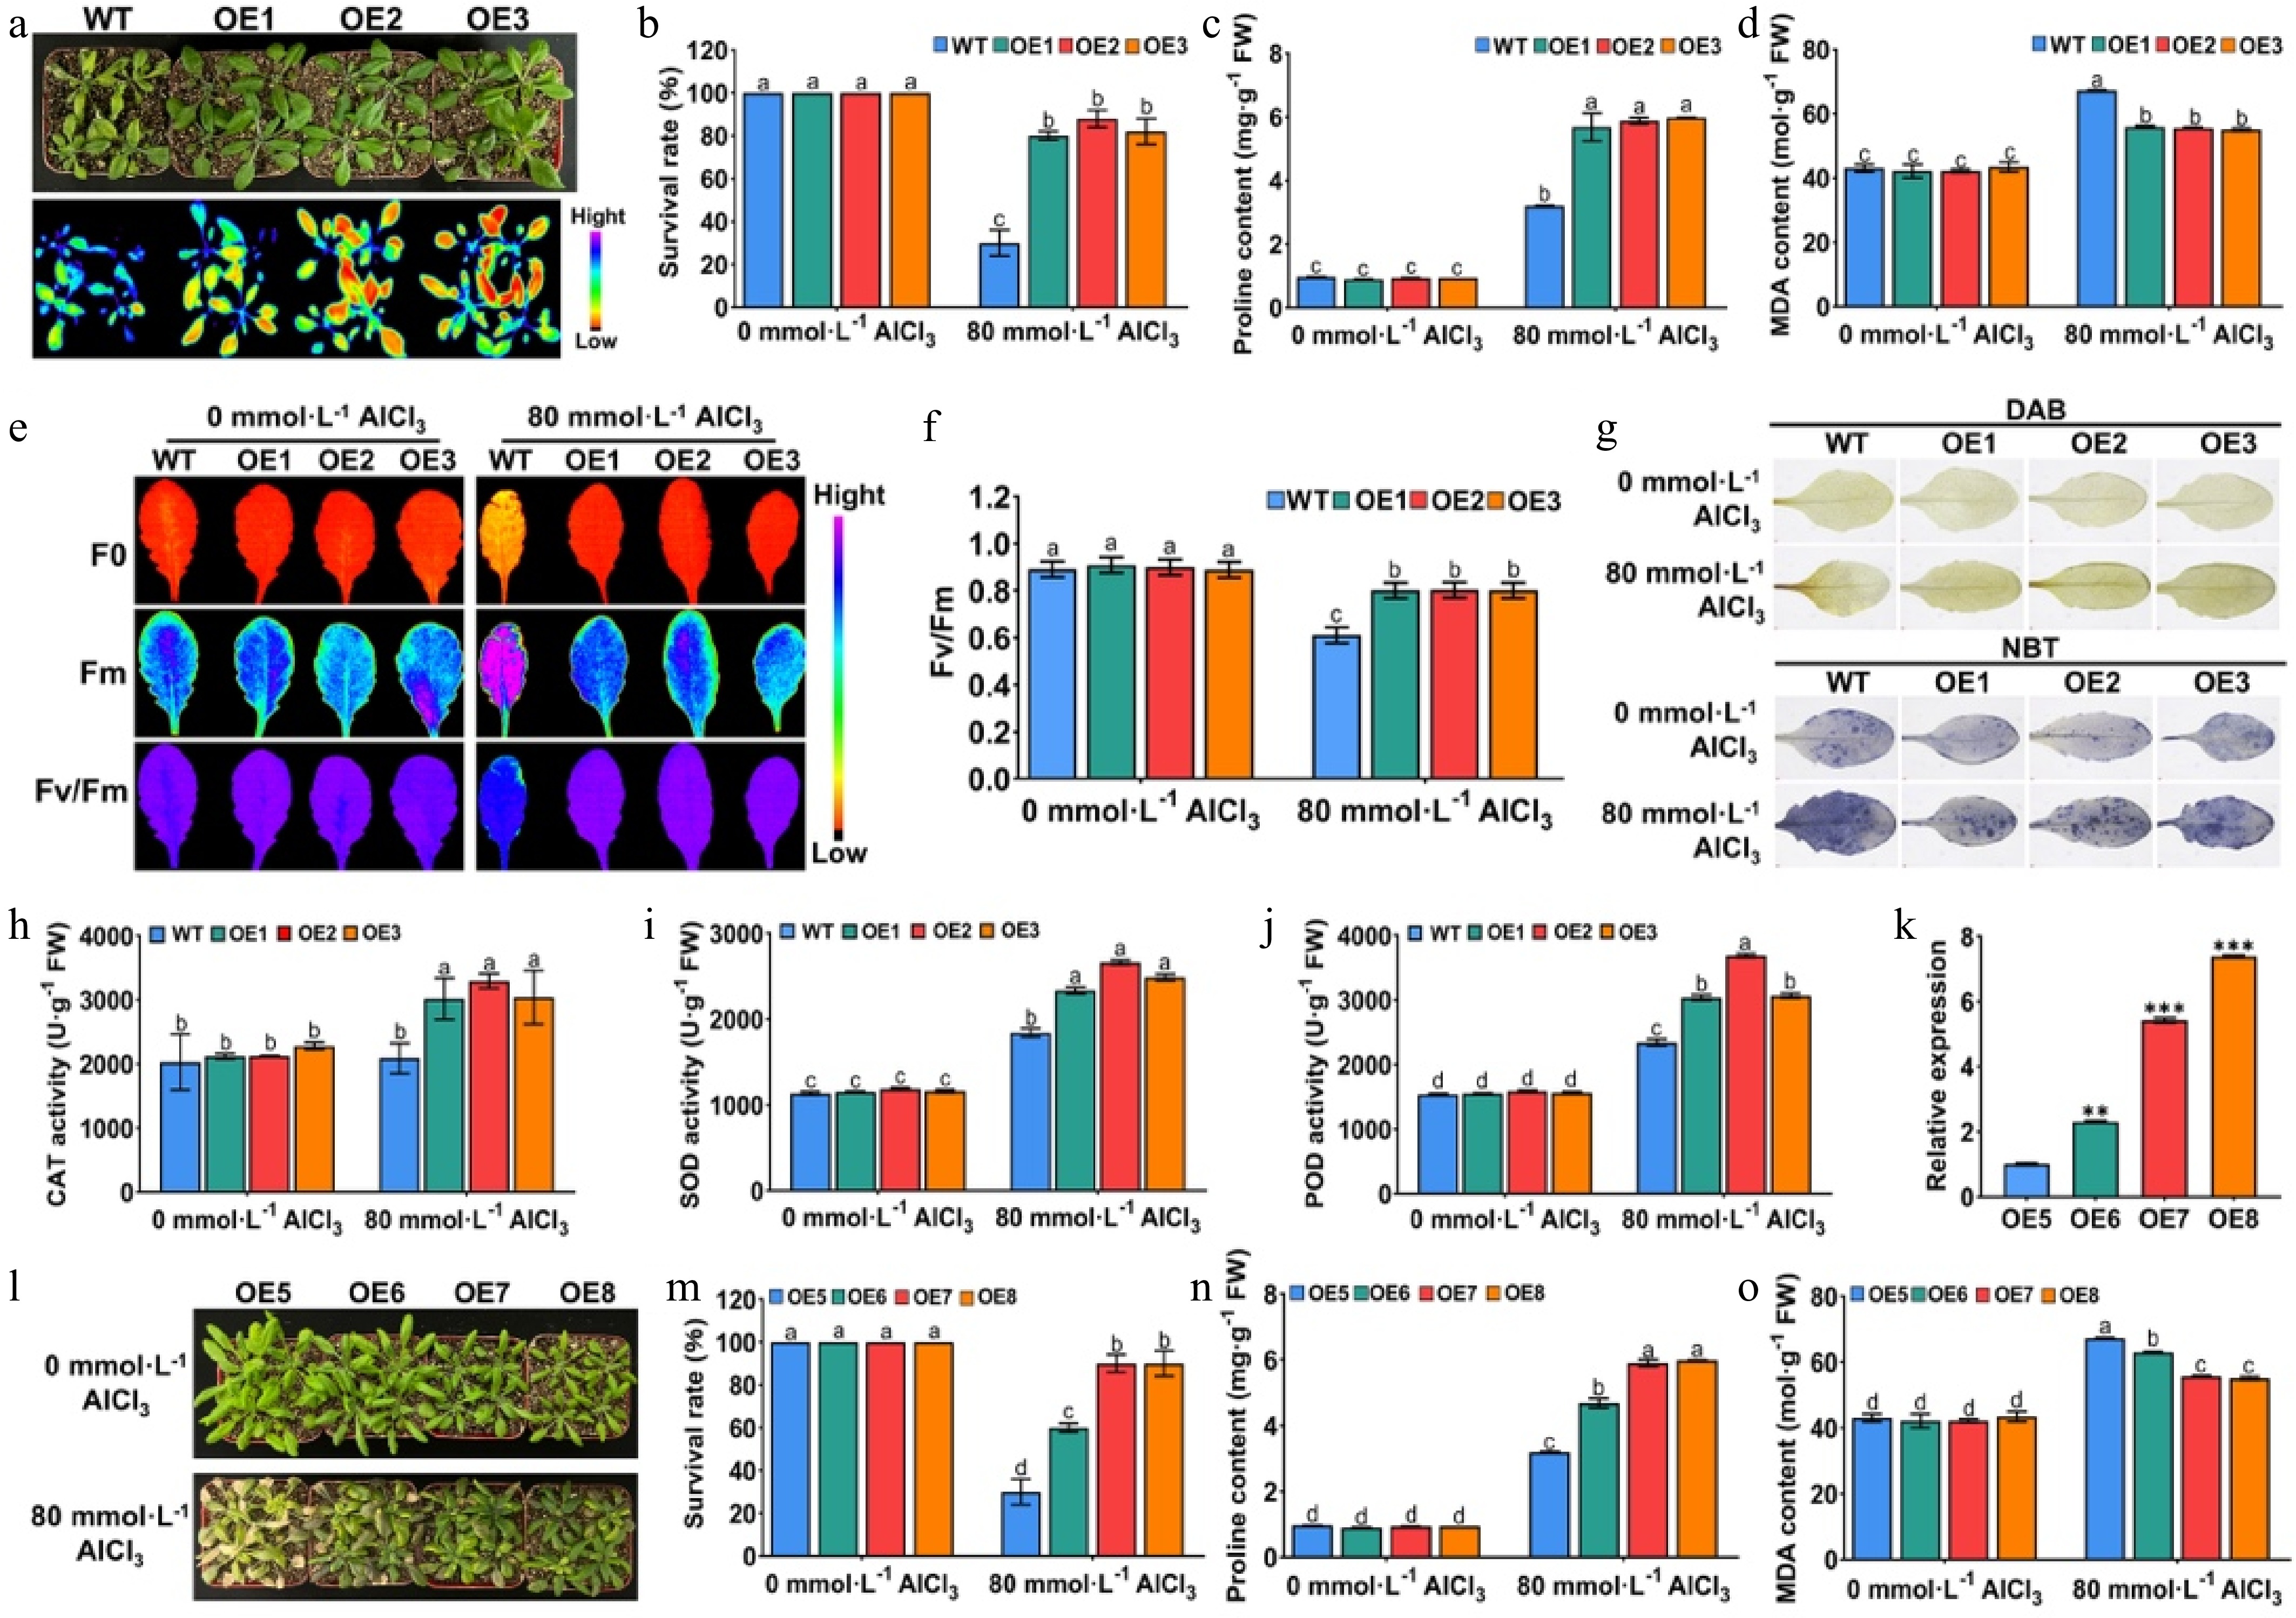
Figure 5.
MaDTX19 confers Al3+ tolerance by enhancing antioxidant capacity and protecting photosynthetic function in transgenic Arabidopsis. (a) Phenotypes and chlorophyll fluorescence images and (b) survival rate of four-week-old WT and MaDTX19-OE plants under 80 mmol·L−1 AlCl3 stress. (c) Proline and (d) MDA content in leaves under AlCl3 stress. (e) Chlorophyll fluorescence images and (f) quantitative analysis of maximum photochemical efficiency of PSII (Fv/Fm). (g) Histochemical staining of H2O2 (DAB) and O2·− (NBT) in leaves under AlCl3 stress. (h) Activities of CAT, (i) SOD, and (j) POD in leaves under AlCl3 stress. Correlation analysis of growth inhibition and Al3+ tolerance in transgenic lines with graded MaDTX19 expression levels: relative expression of MaDTX19 in (k) independent OE lines, (l) phenotypes under Al3+ stress, (m) survival rate, (n) proline content, and (o) MDA accumulation. OE1-8 represent different MaDTX19-OE lines. Data are presented as mean ± SD. Different lowercase letters above bars indicate significant differences (p < 0.05).
-
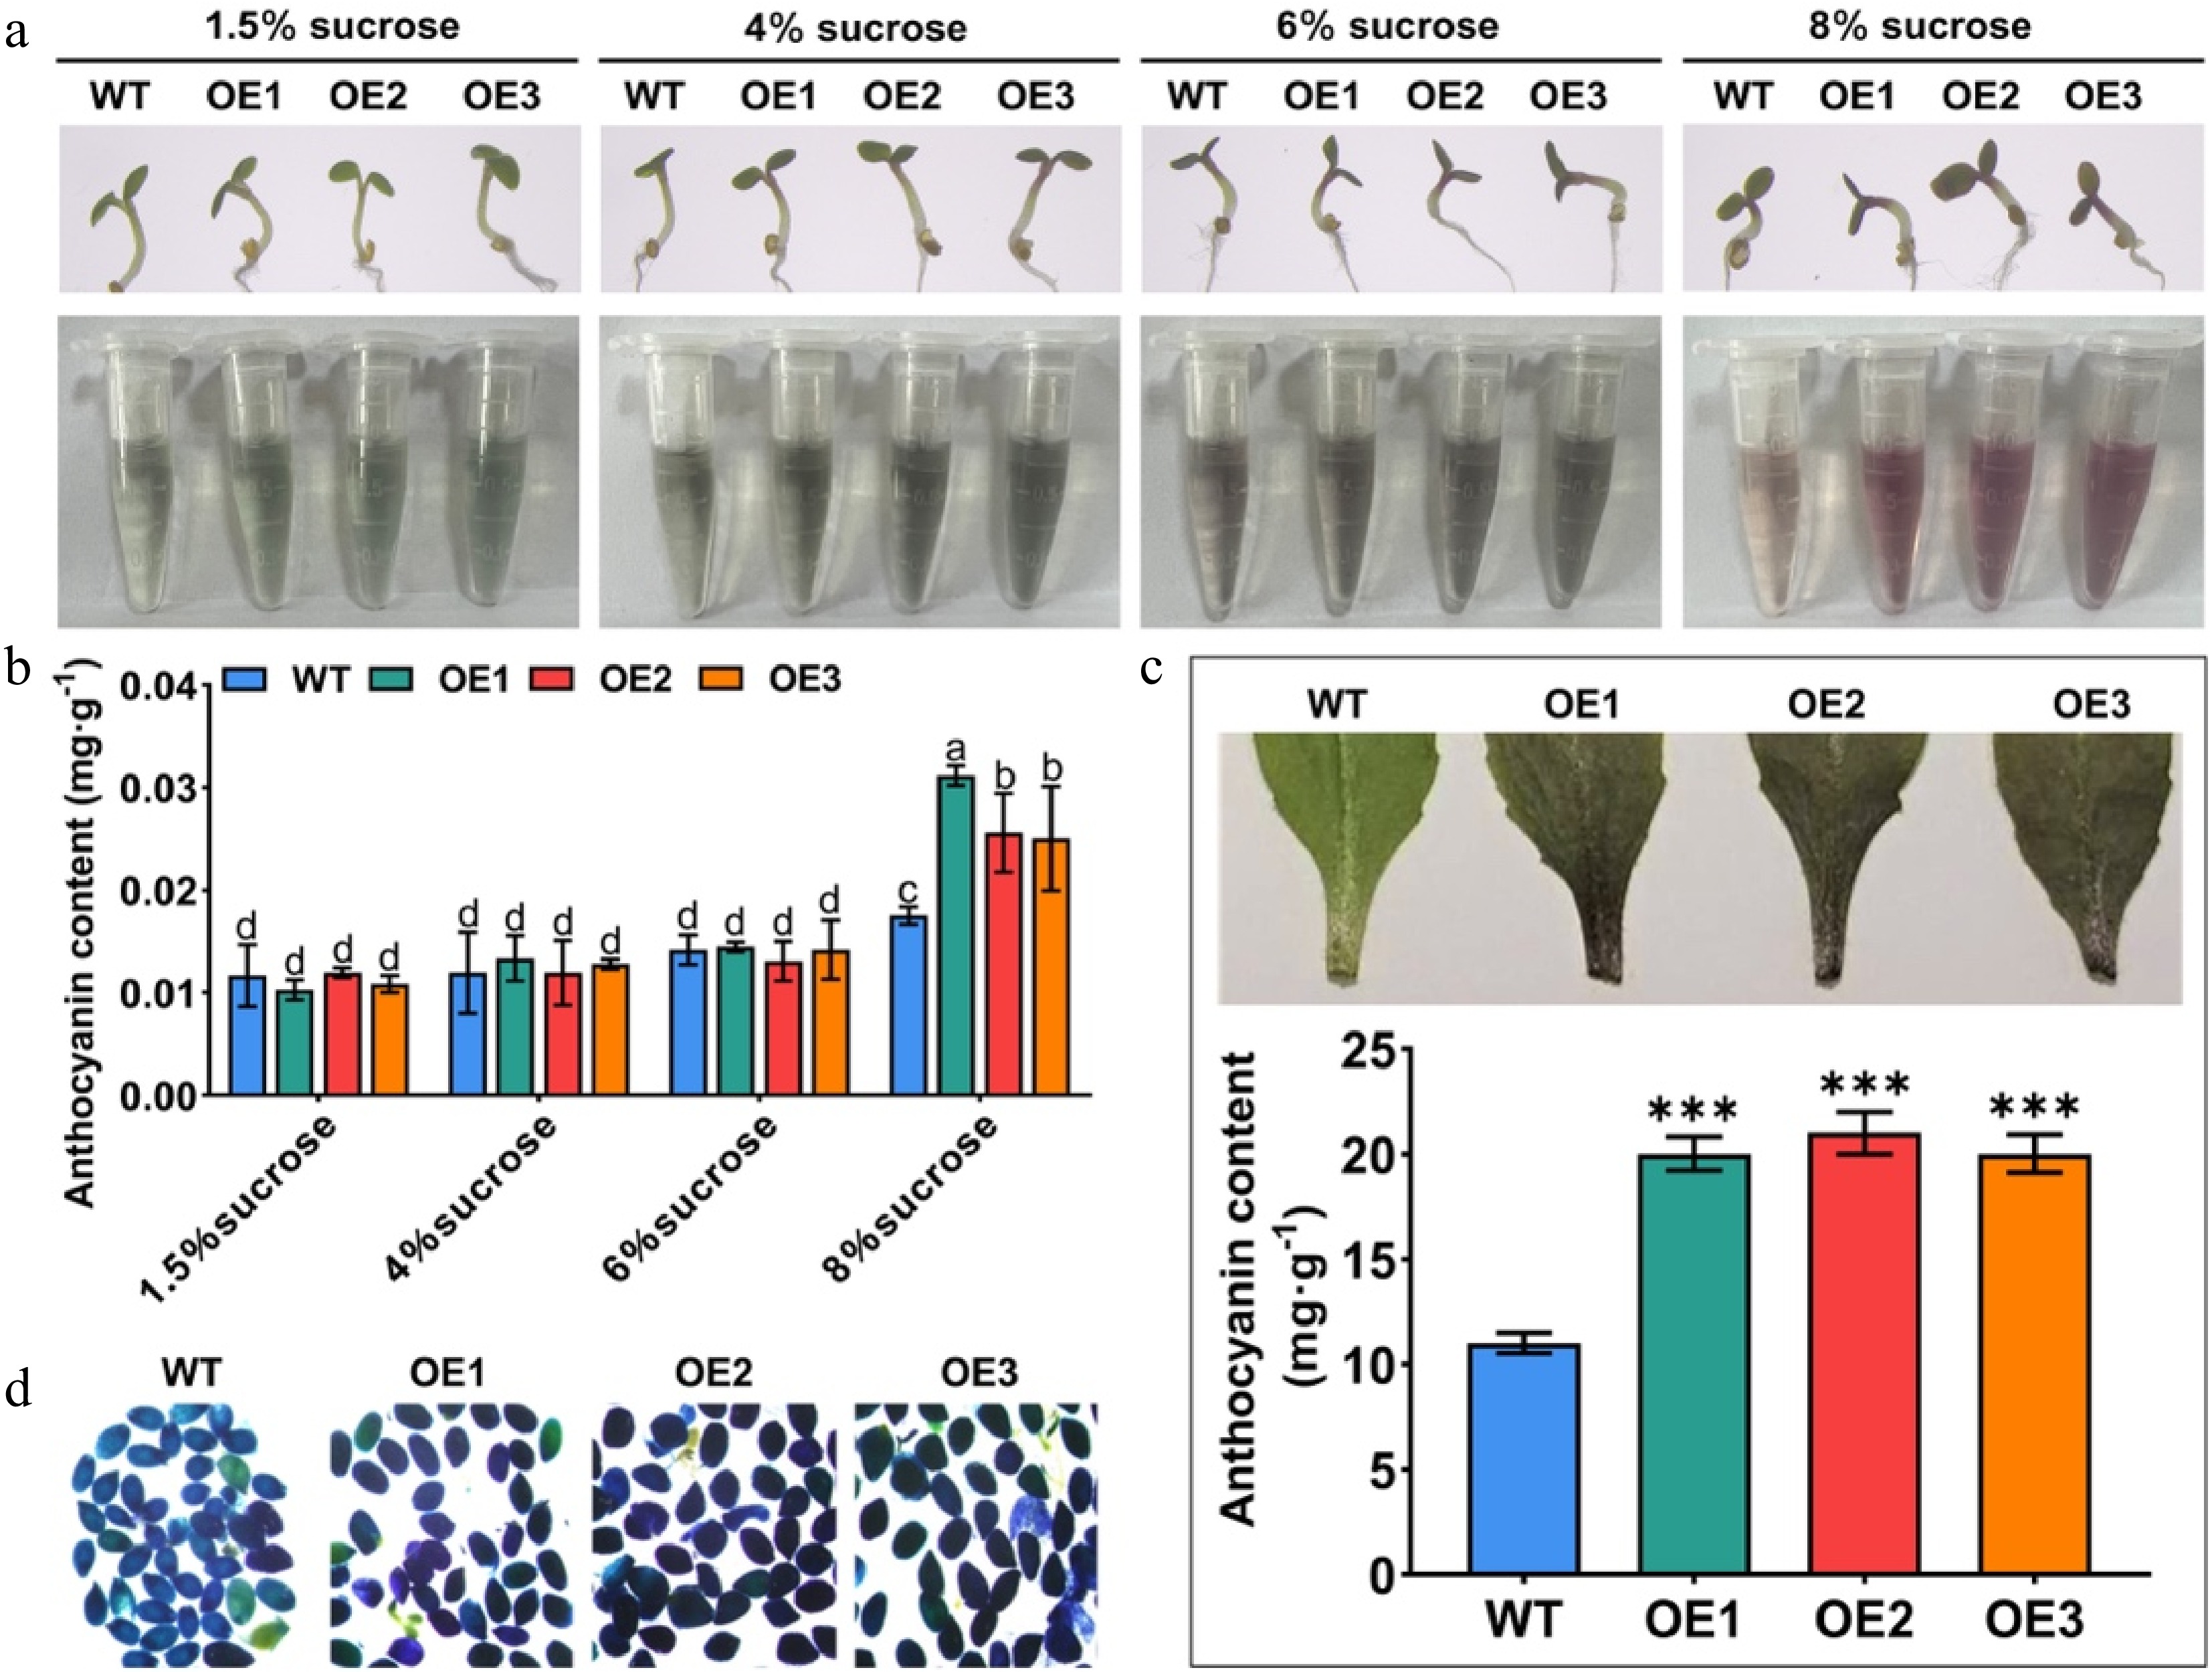
Figure 6.
MaDTX19 promotes anthocyanin and proanthocyanidin accumulation in transgenic Arabidopsis. (a) Cotyledon phenotypes and (b) quantitative analysis of anthocyanin content of WT and MaDTX19-OE seedlings grown on MS medium with 1.5%, 4%, 6%, and 8% sucrose. (c) Phenotypes and anthocyanin content of leaves and petioles of WT and MaDTX19-OE Arabidopsis seedlings. (d) DMACA staining of proanthocyanidins in seed coats (magenta color indicates proanthocyanidin accumulation). OE1-3 represent different MaDTX19-OE lines. Data represent the mean ± SD. Asterisks denote significant differences (t-test, *** p < 0.001), while different letters indicate significant differences at p < 0.05.
-
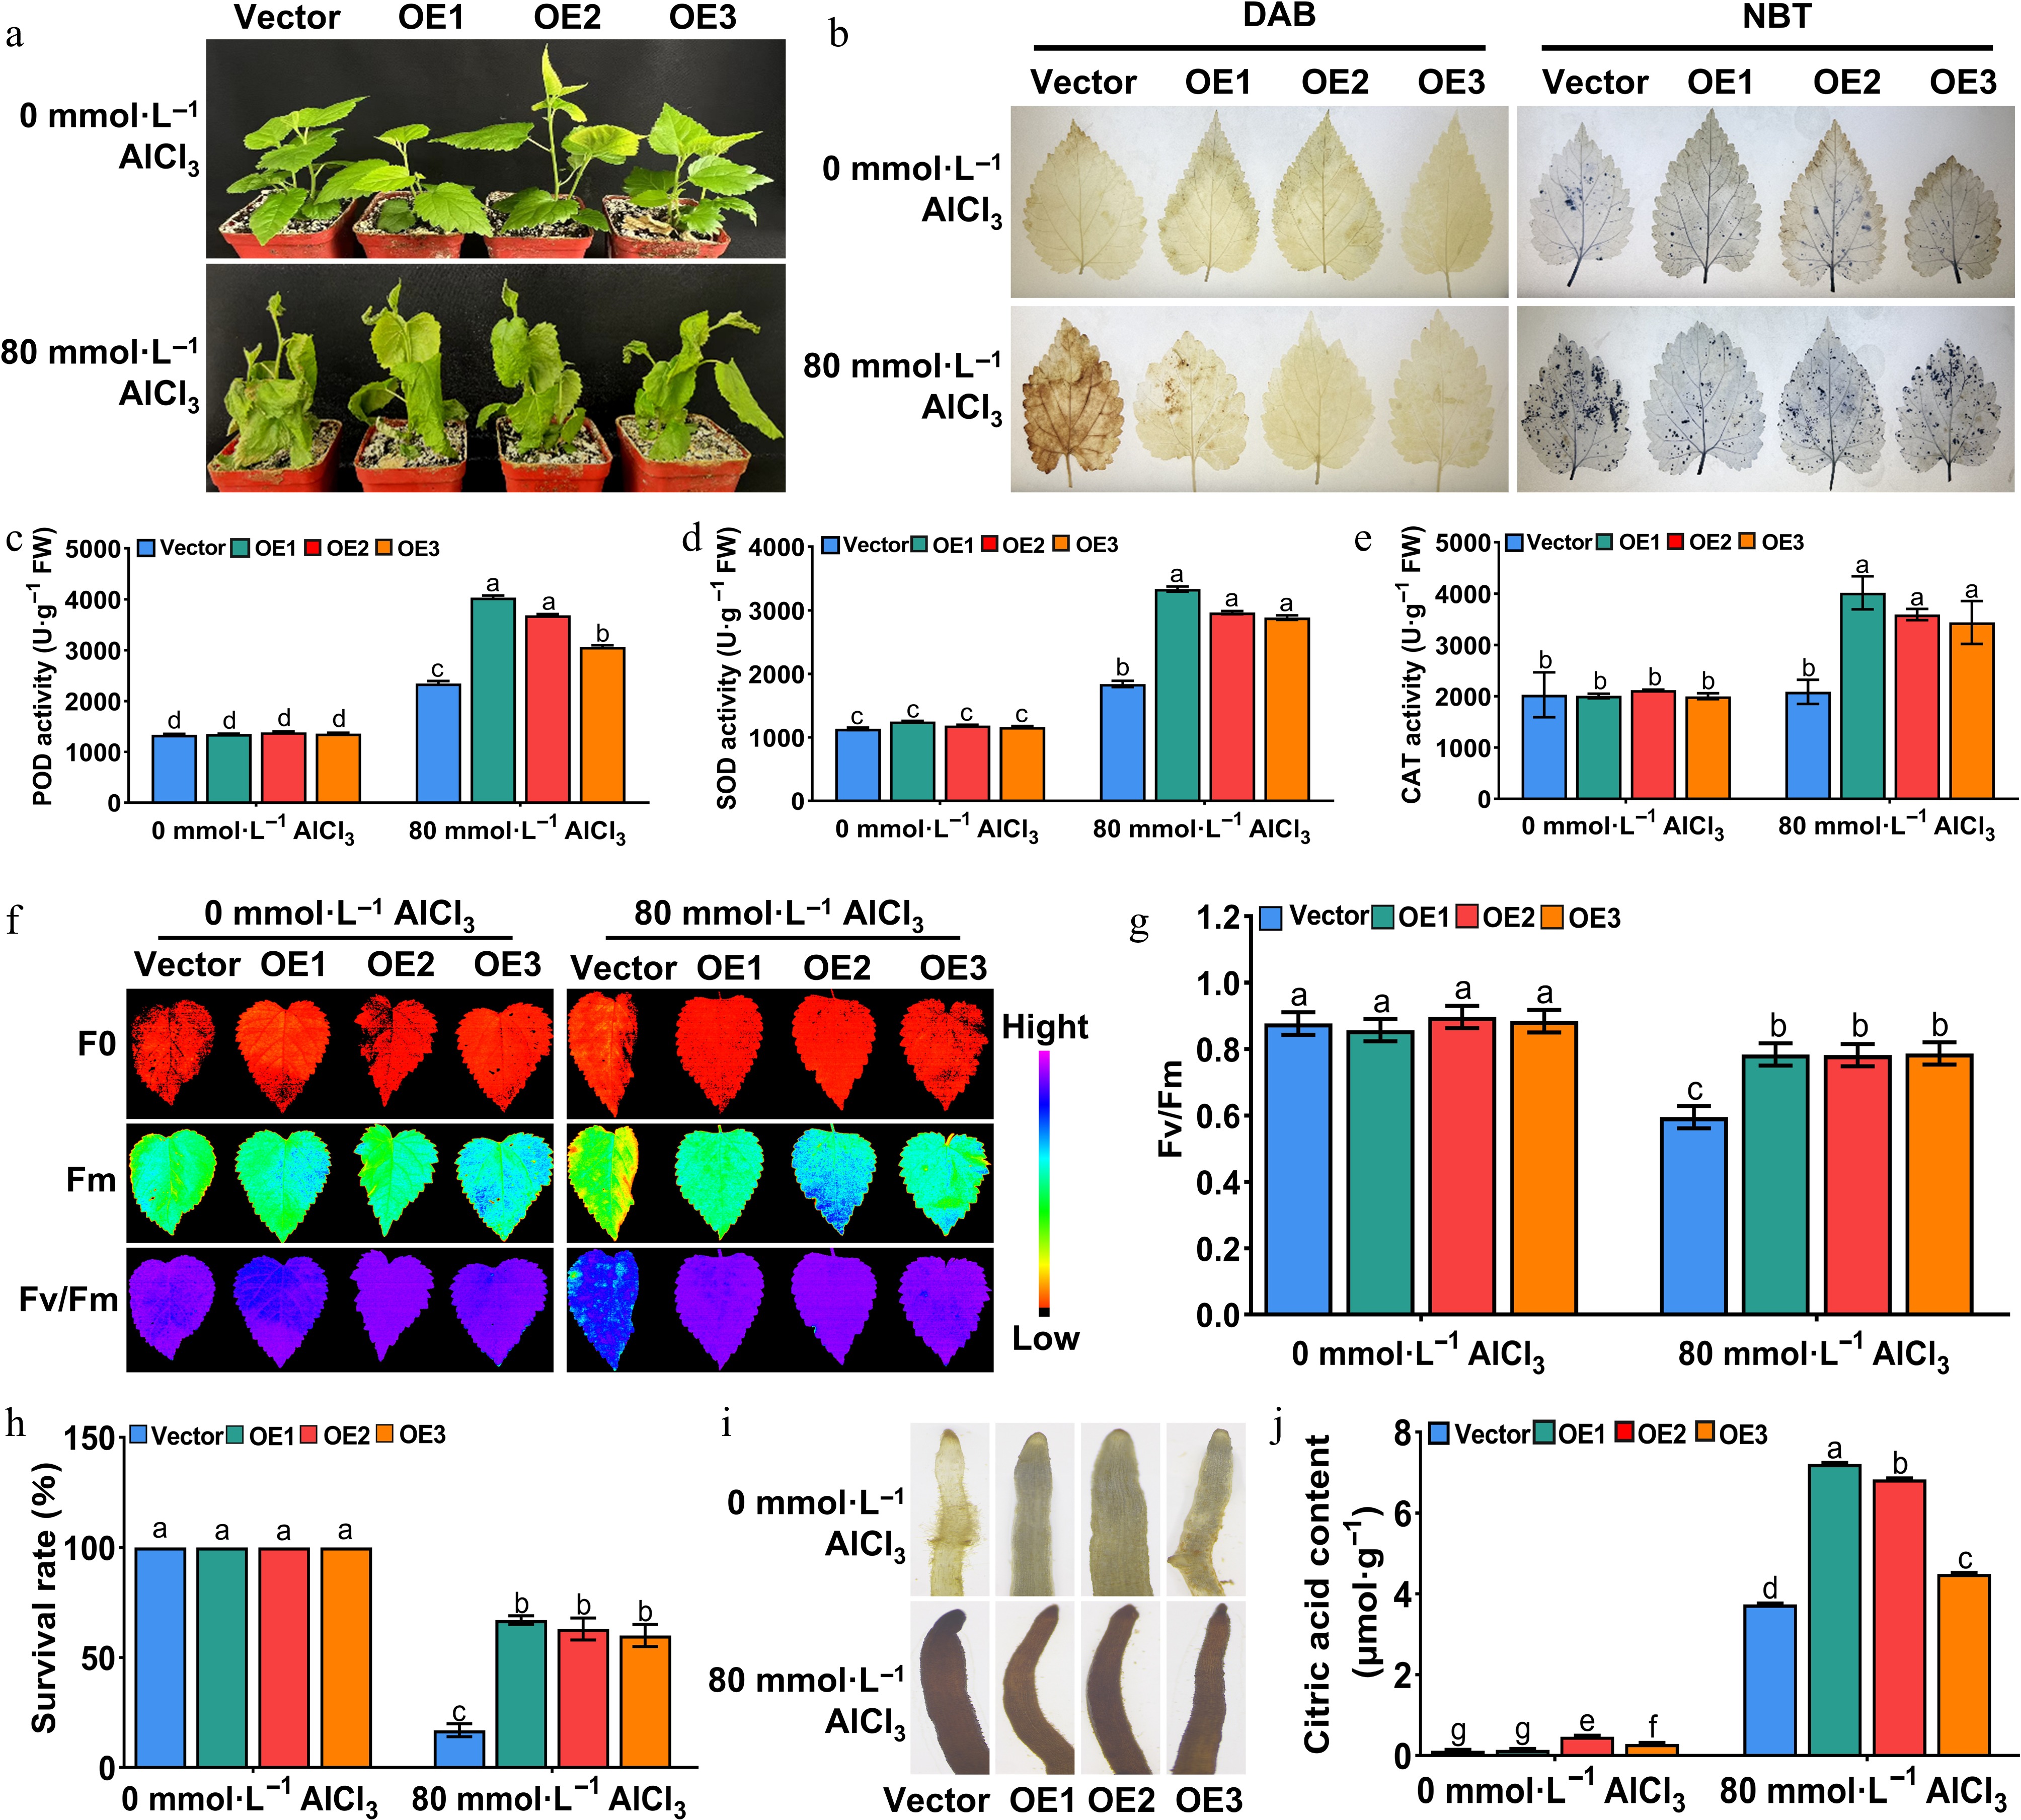
Figure 7.
Overexpression of MaDTX19 enhances Al3+ tolerance in hairy root-transformed mulberry seedlings. (a) Phenotypes of empty vector (Vector) control and MaDTX19-OE (OE1-3) mulberry seedlings under 80 mmol·L−1 AlCl3 stress. (b) DAB and NBT staining of mulberry leaves under AlCl3 stress. (c) POD, (d) SOD, and (e) CAT activities in leaves under AlCl3 stress. (f) Chlorophyll fluorescence images and (g) Fv/Fm values of seedlings under AlCl3 stress. (h) Survival rate of seedlings under AlCl3 stress. (i) Hematoxylin staining of hairy root tips. (j) Citrate content in hairy root tips under AlCl3 stress. Data represent mean ± SD. Different letters indicate significant differences (p < 0.05).
-
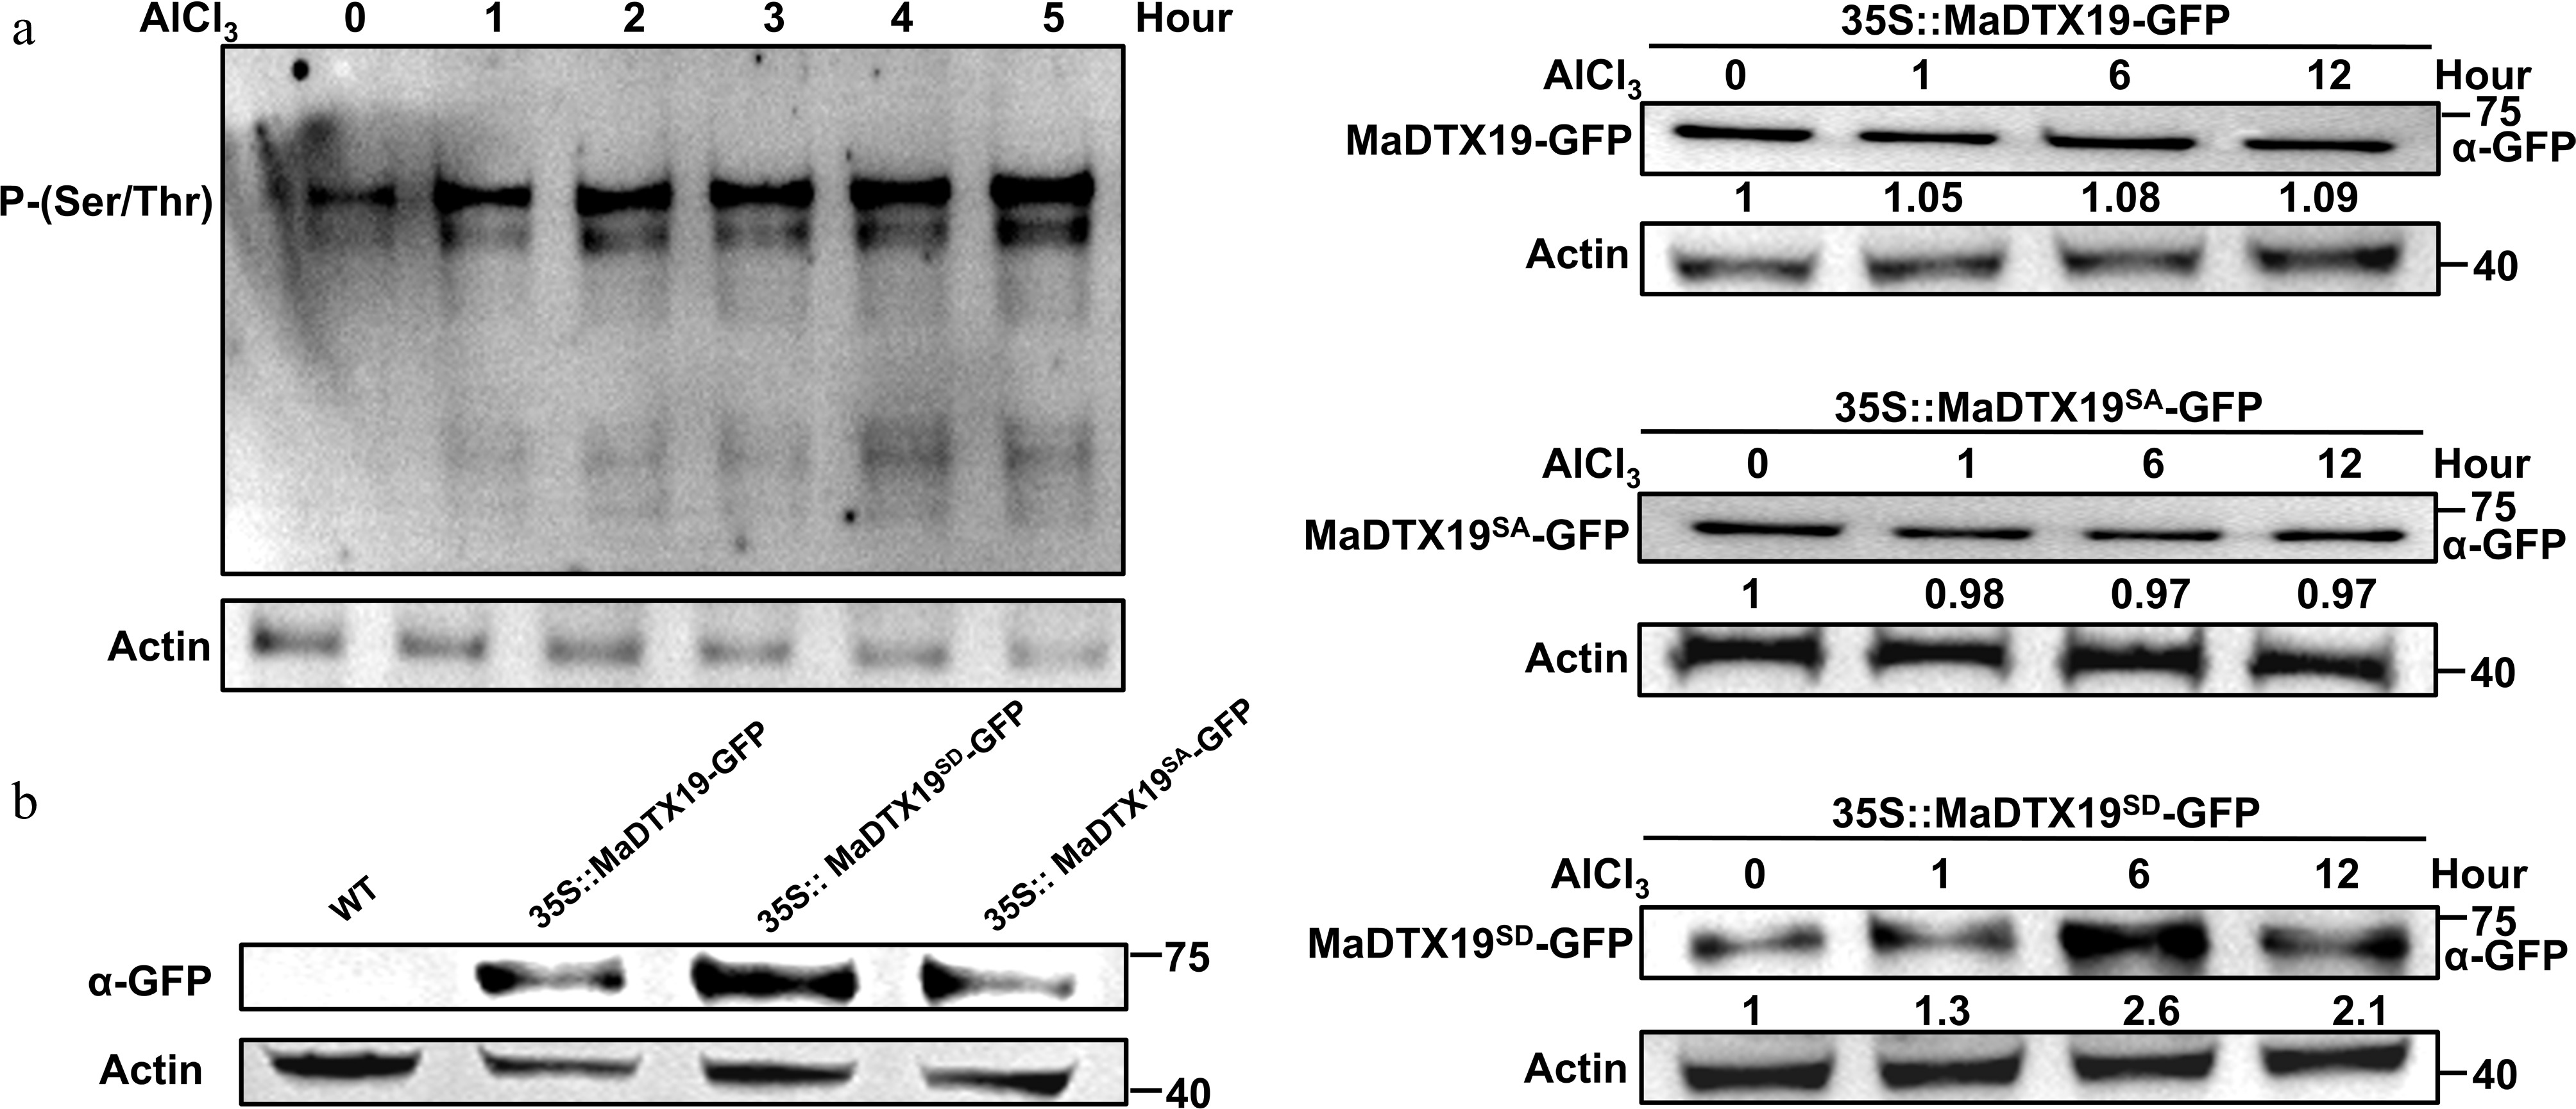
Figure 8.
Al3+ stress induces in vivo phosphorylation of MaDTX19 at Ser4 and modulates its protein stability. (a) Time-course analysis of Ser4 phosphorylation level of MaDTX19 in MaDTX19-OE Arabidopsis root tips under 0.8 mmol·L−1 AlCl3 stress, detected by western blot using an anti-phospho-(Ser/Thr) antibody. (b) Protein stability of MaDTX19-GFP, MaDTX19SA-GFP, and MaDTX19SD-GFP in Arabidopsis root tips under AlCl3 stress detected by western blot using an anti-GFP antibody.
-
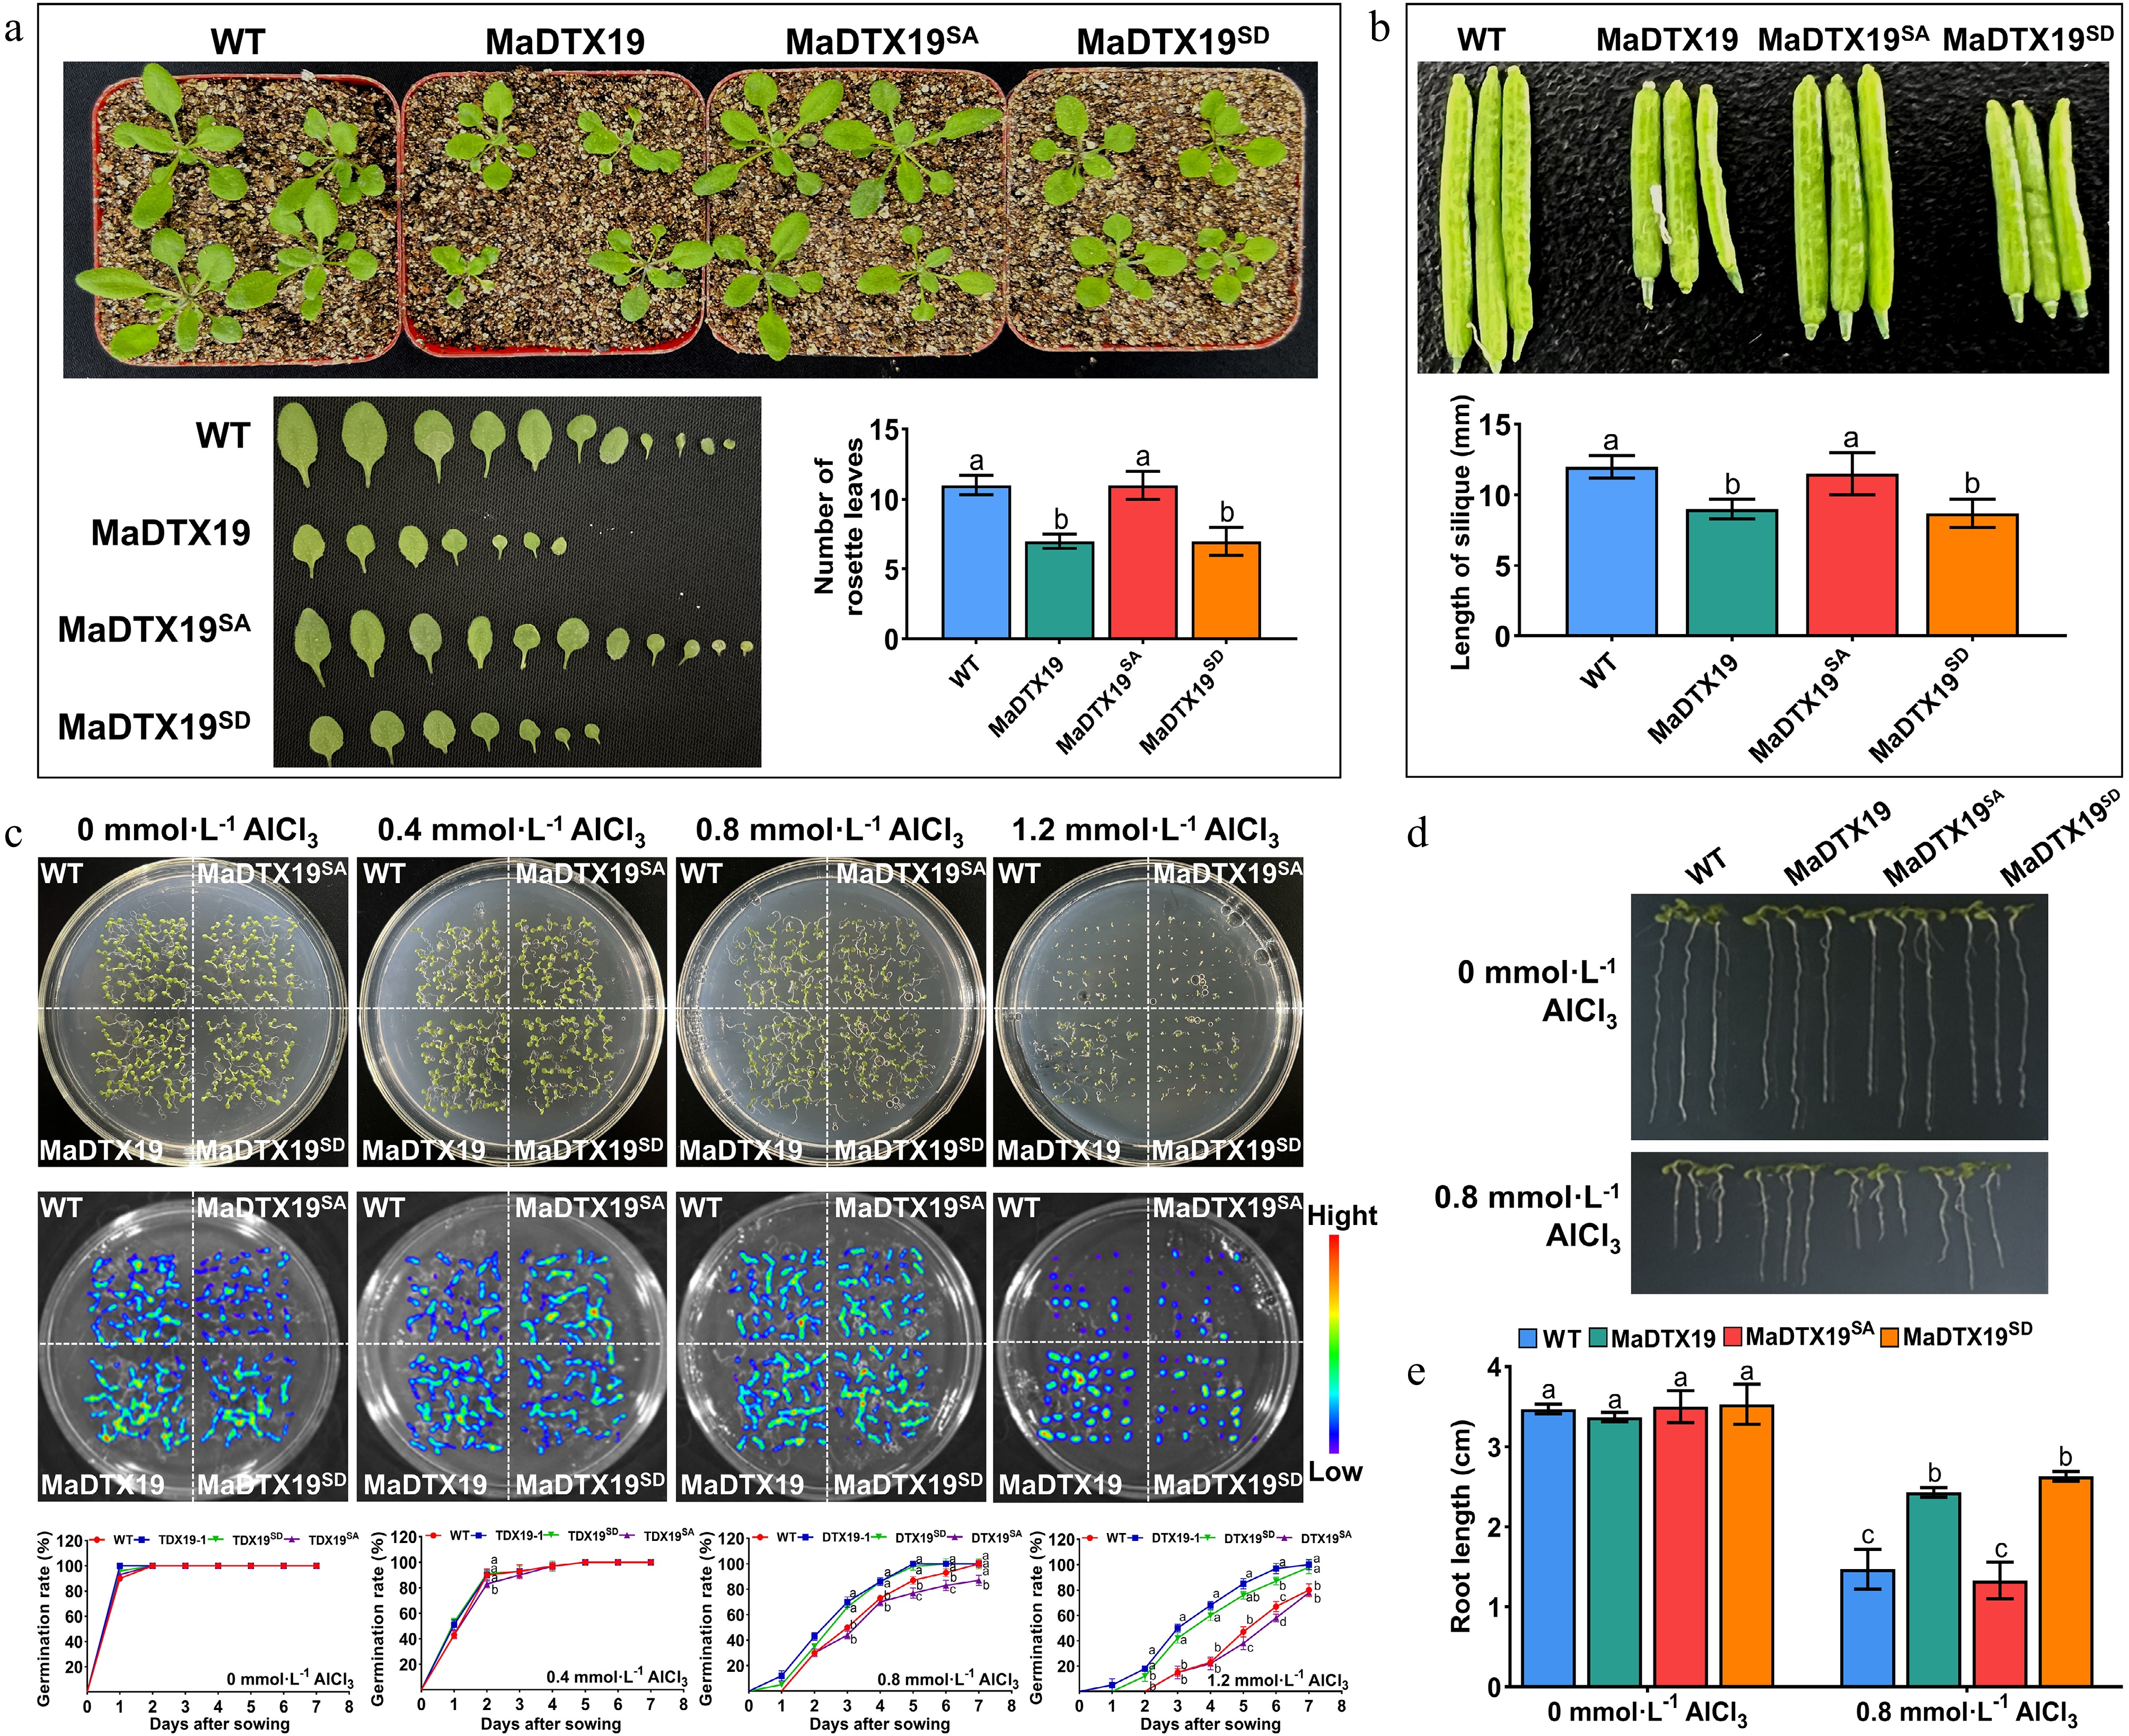
Figure 9.
Ser4 phosphorylation is essential for MaDTX19-mediated growth inhibition and Al3+ tolerance. (a) Growth phenotypes of four-week-old WT, MaDTX19-OE, MaDTX19SD-OE, and MaDTX19SA-OE Arabidopsis under normal conditions. (b) Silique length of the same plants under normal conditions. (c) Seed germination rate under 0, 0.4, 0.8, 1.2 mmol·L−1 AlCl3 stress. (d) Primary root phenotypes of seedlings grown on MS medium supplemented with 0 or 0.8 mmol·L−1 AlCl3. (e) Primary root length of seedlings on MS medium supplemented with 0 or 0.8 mmol·L−1 AlCl3. Different lowercase letters above the bars indicate statistically significant differences among treatments (p < 0.05).
-
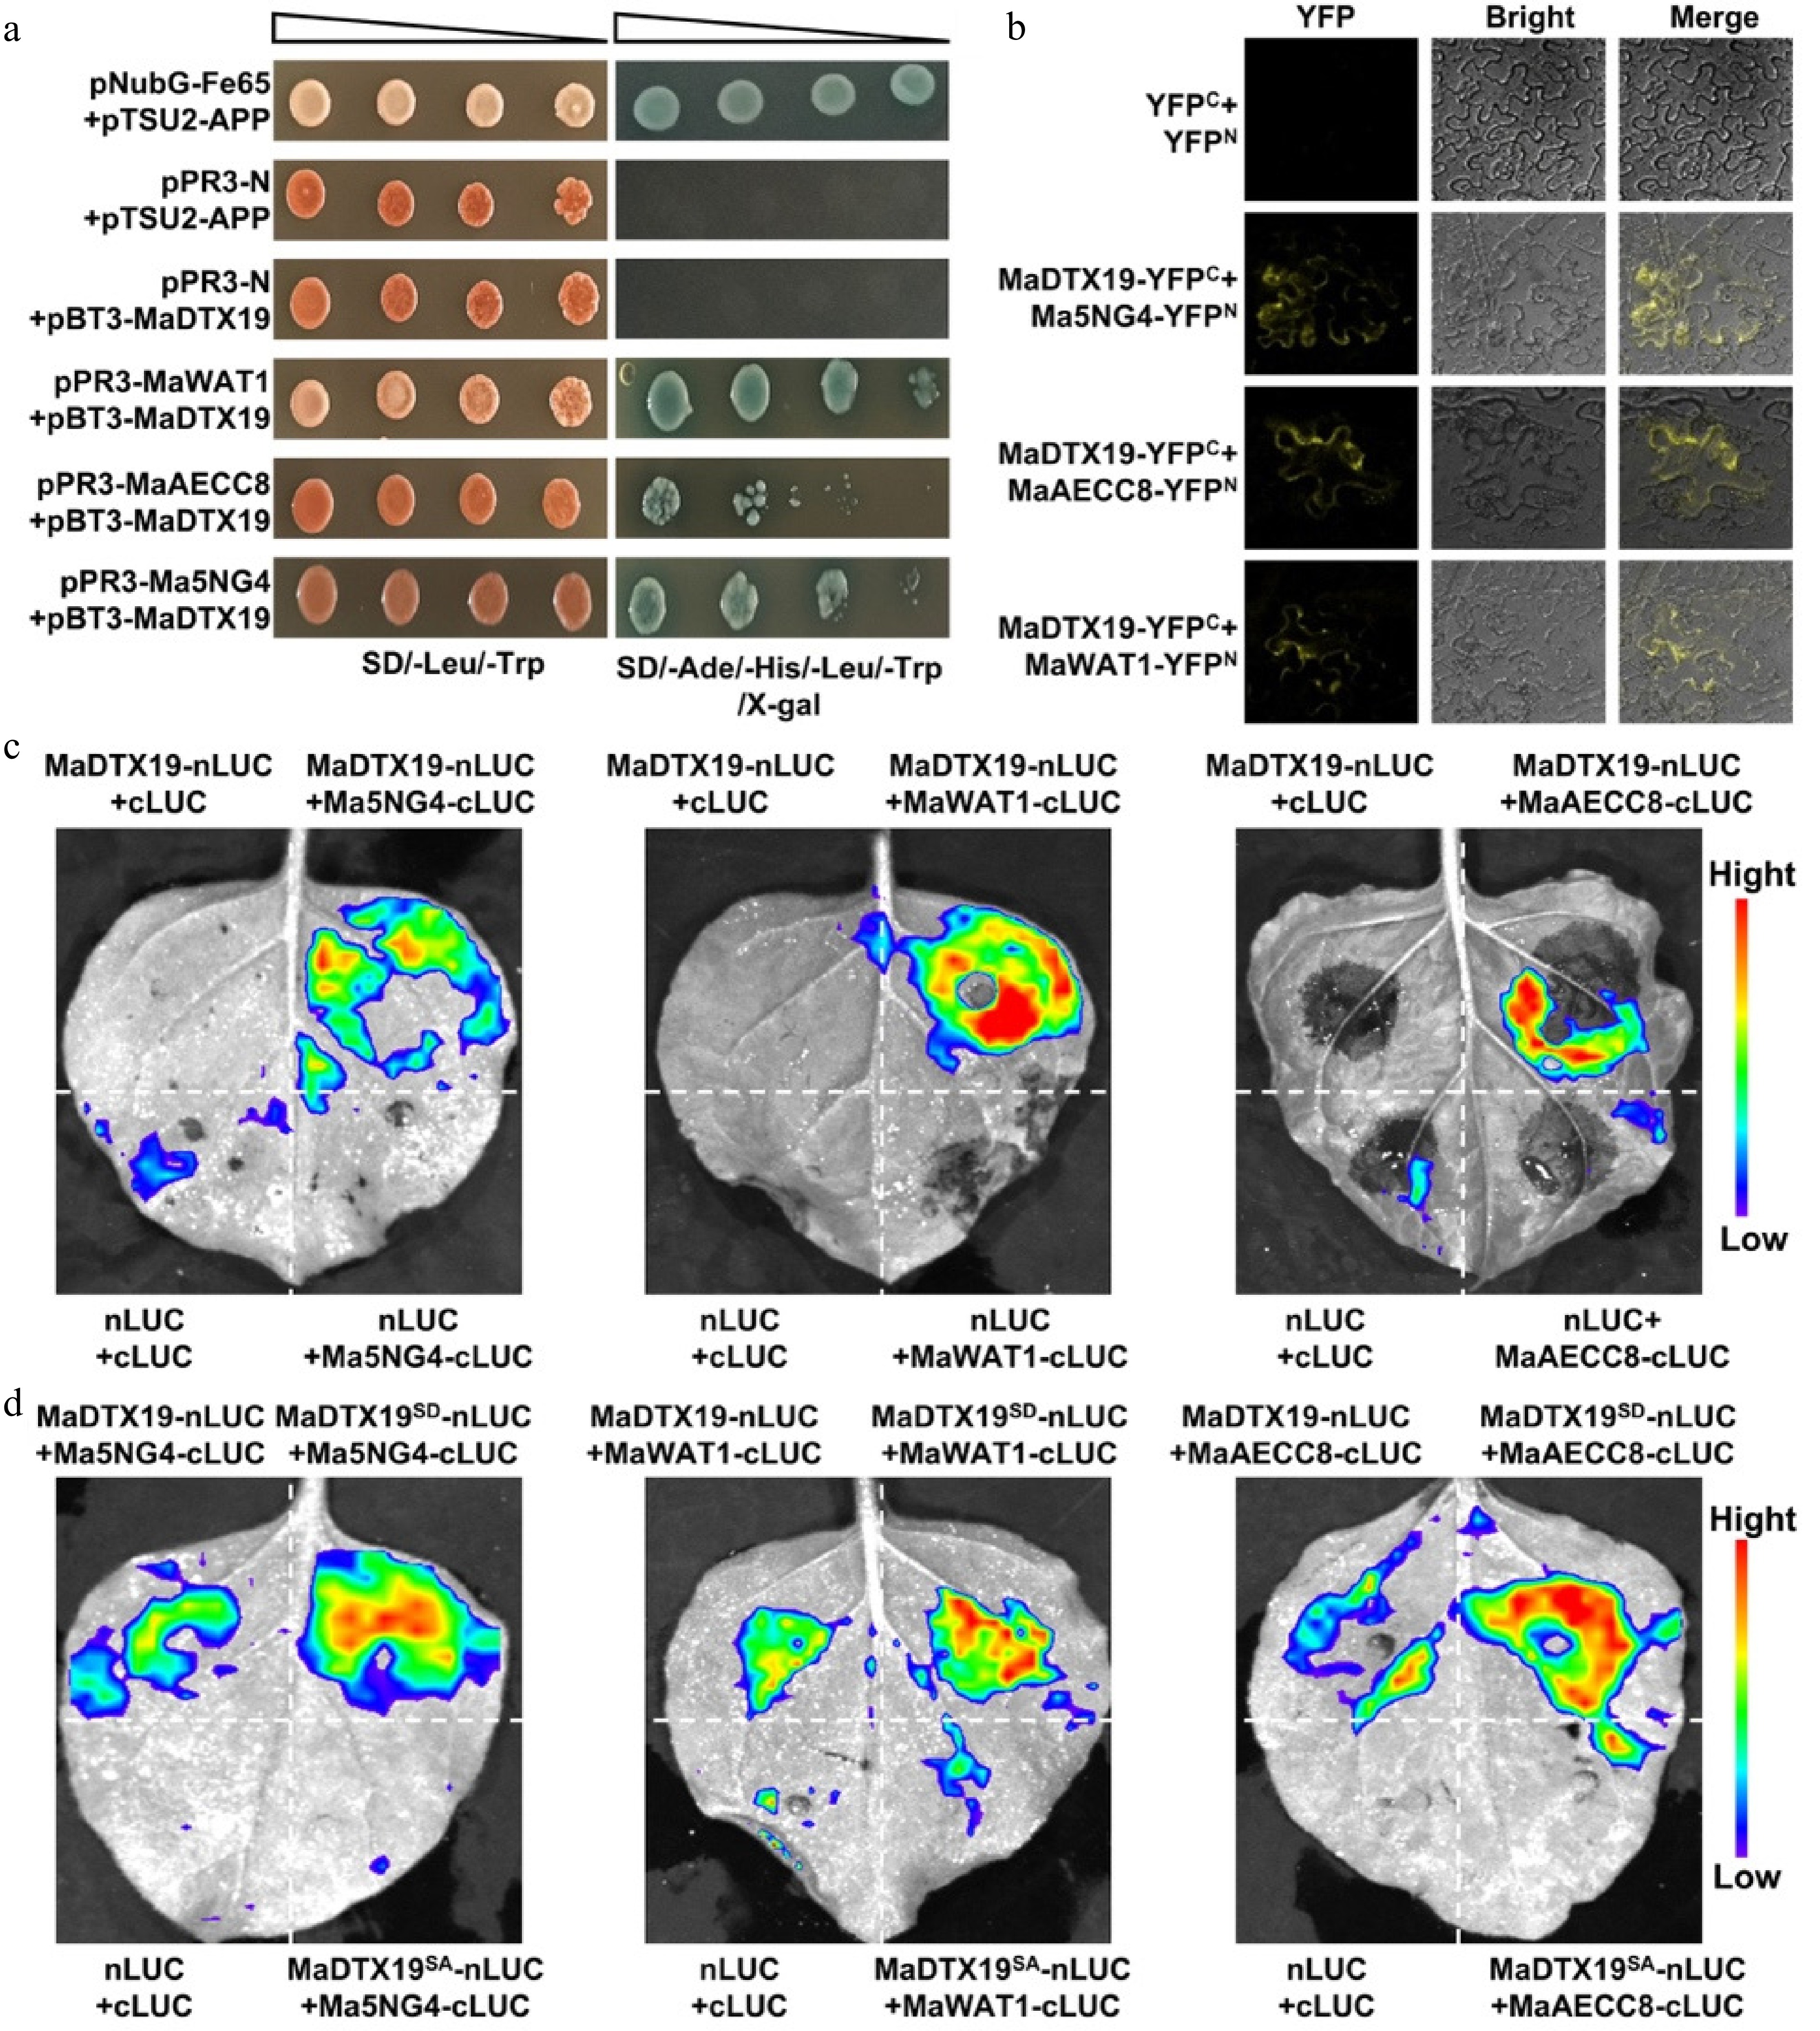
Figure 10.
Ser4 phosphorylation enhances the interaction of MaDTX19 with auxin-related proteins. (a) Membrane yeast two-hybrid assay showing the interaction of MaDTX19 with Ma5NG4, MaWAT1, and MaAECC8. Growth on QDO medium indicates a positive interaction. (b) Bimolecular fluorescence complementation (BiFC) assay confirming the interactions in N. benthamiana leaf epidermal cells. YFP fluorescence indicates protein-protein interaction. (c) Luciferase complementation assay (LCA) validating the interactions. (d) LCA comparing the interaction strength of MaDTX19 (WT), MaDTX19SD (phosphomimetic), and MaDTX19SA (phosphodeficient) with auxin-related proteins. Luminescence intensity reflects interaction strength.
-
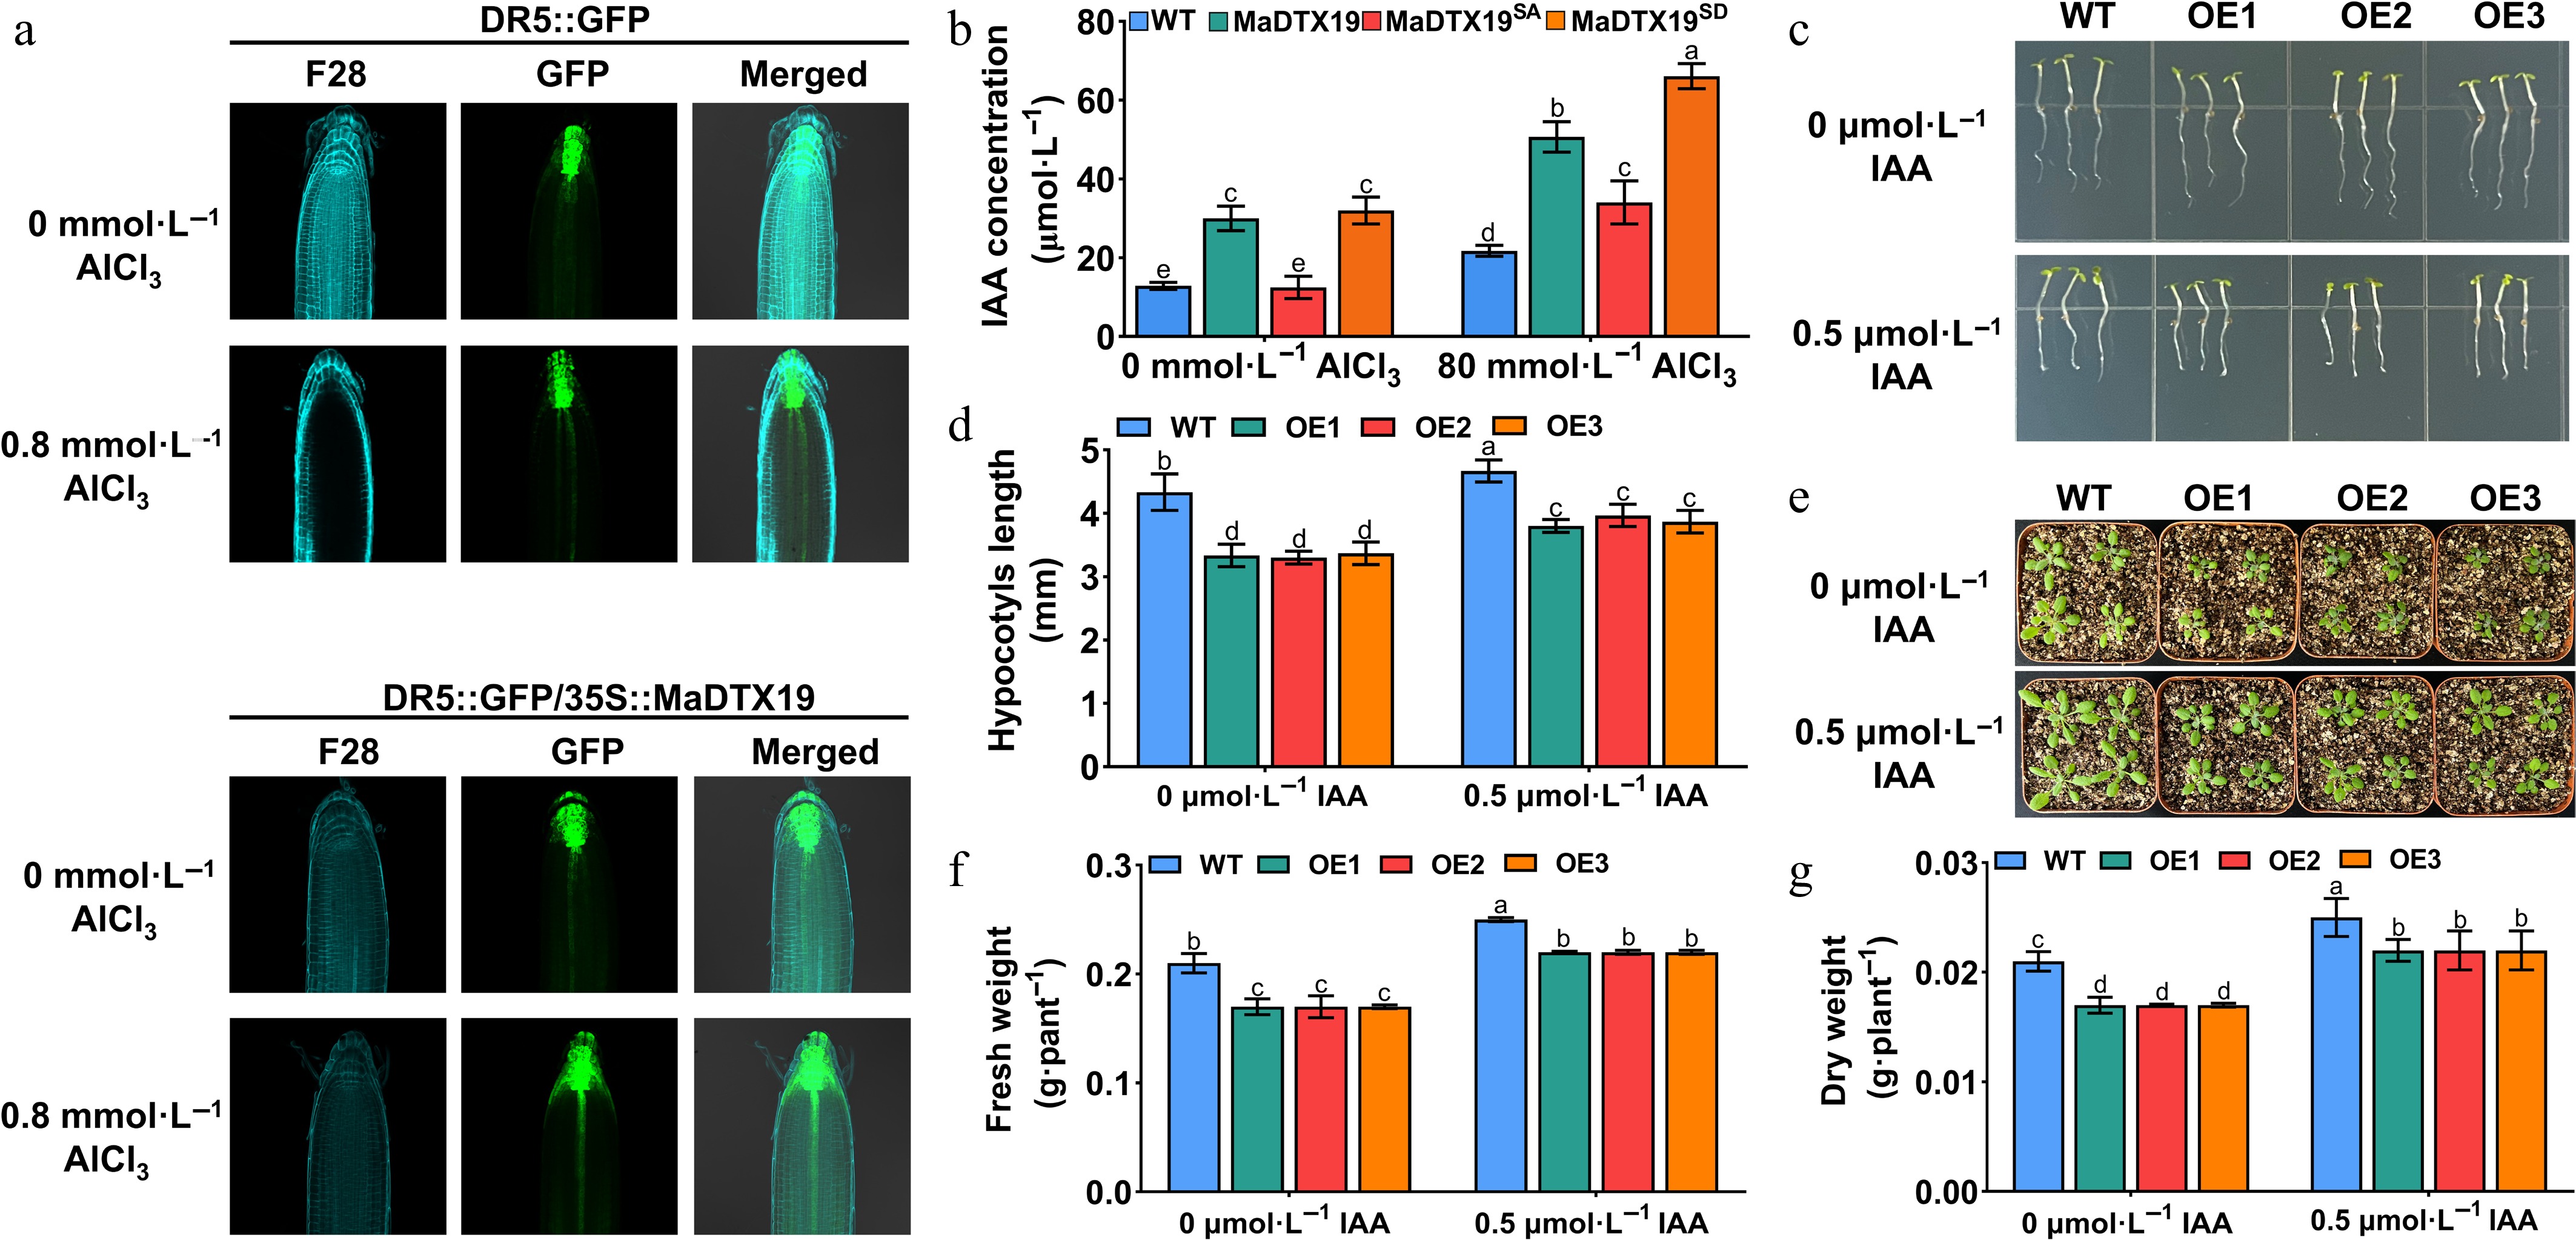
Figure 11.
MaDTX19 modulates auxin homeostasis and spatial distribution in root tips under Al3+ stress. (a) DR5::GFP fluorescence imaging of auxin distribution in root tips of WT and MaDTX19-OE Arabidopsis seedlings under 0 and 0.8 mmol·L−1 AlCl3 stress. (b) Quantitative analysis of auxin (IAA) content in root tips of WT and MaDTX19-OE seedlings under the same conditions. Effects of exogenous IAA treatment on growth phenotypes of WT and MaDTX19-OE seedlings: (c) hypocotyl phenotype, (d) hypocotyl length, (e) seedling phenotype, (f) fresh weight, and (g) dry weight under standard light conditions. Data are mean ± SD. Different letters indicate significant differences (p < 0.05).
-
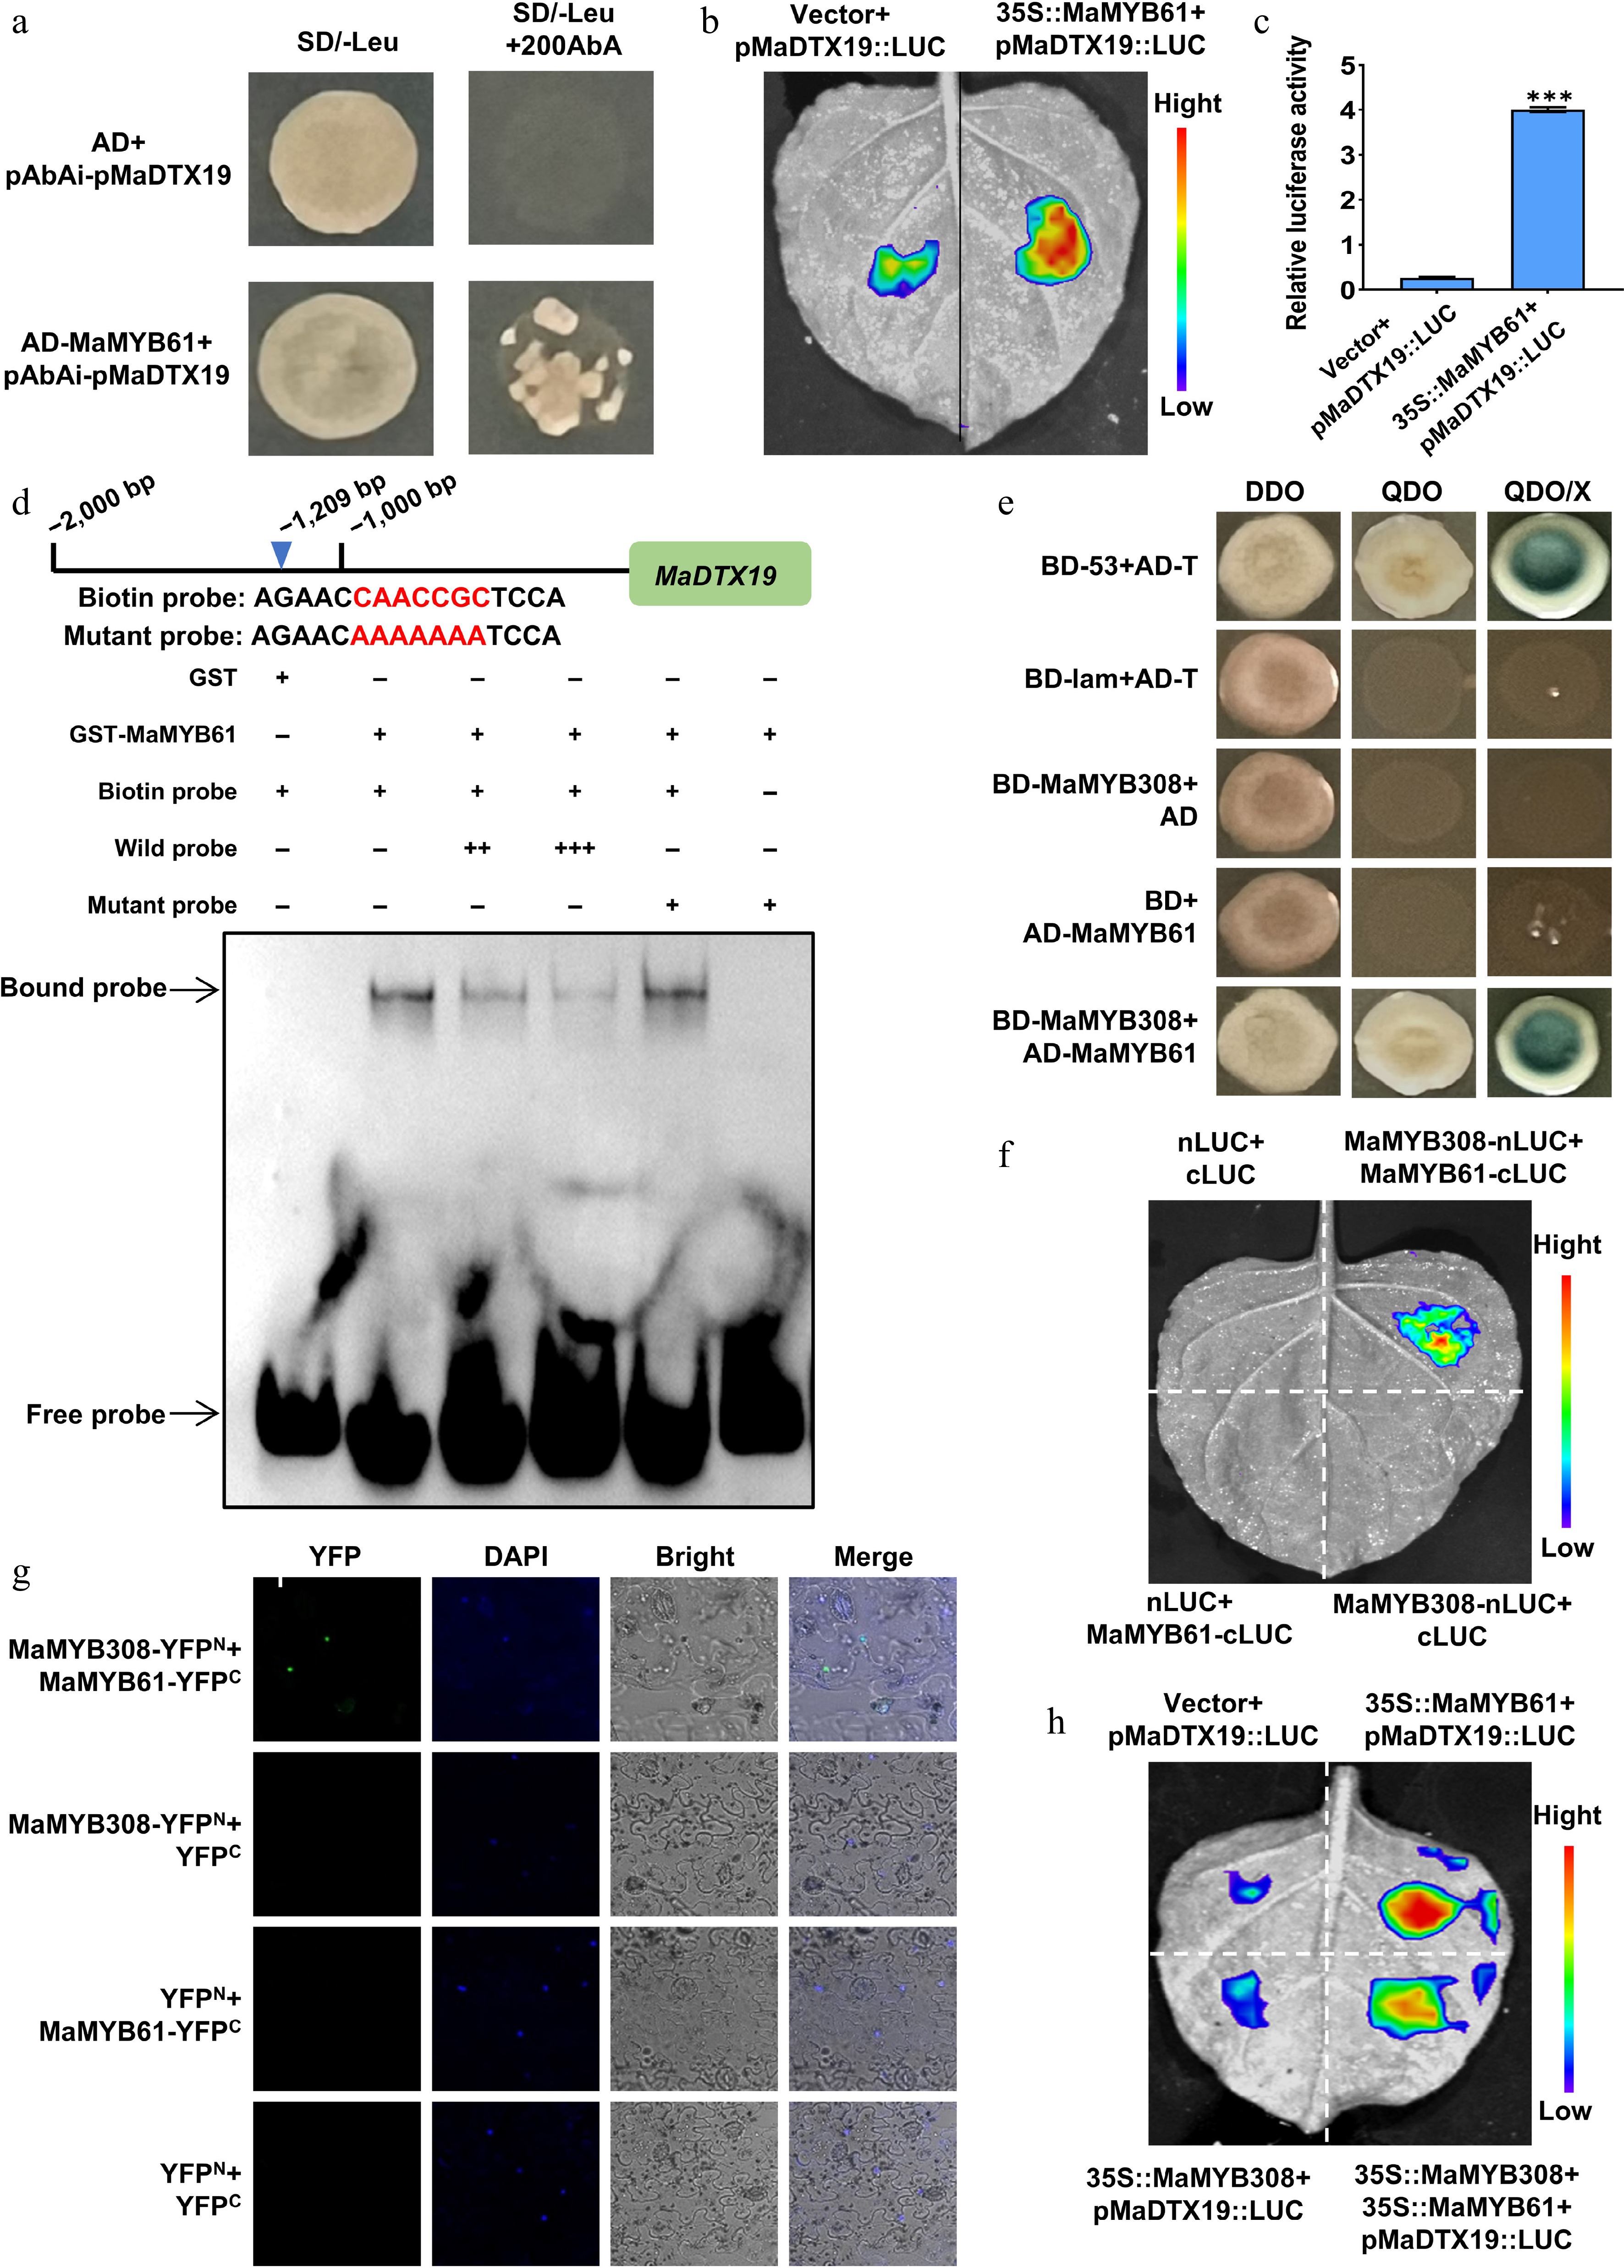
Figure 12.
The MaMYB61/MaMYB308 module fine-tunes MaDTX19 expression via transcriptional activation and repression. (a) Yeast one-hybrid (Y1H) assay confirming the binding of MaMYB61 to the MaDTX19 promoter (pMaDTX19). Growth on SD/-Leu/AbA medium indicates a positive interaction. (b) Dual-luciferase reporter assay showing that MaMYB61 activates pMaDTX19 in tobacco leaf epidermal cells. (c) Quantitative analysis of the LUC/REN ratio. (d) EMSA confirming sequence-specific binding of MaMYB61 to the MaDTX19 promoter. Labeled probes were incubated with recombinant MaMYB61 protein; unlabeled probes were used as competitors. (e) Y2H assay confirming the physical interaction between MaMYB61 and MaMYB308. (f) LCA confirming the physical interaction between MaMYB61 and MaMYB308. (g) BiFC assay localizing the MaMYB61-MaMYB308 interaction to the nucleus. DAPI was used as the nuclear marker. (h) Dual-luciferase reporter assay showing that MaMYB308 attenuates MaMYB61-mediated activation of pMaDTX19. All data are mean ± SD of three independent biological replicates. Asterisks indicate significant differences (t-test, *** p < 0.001).
-
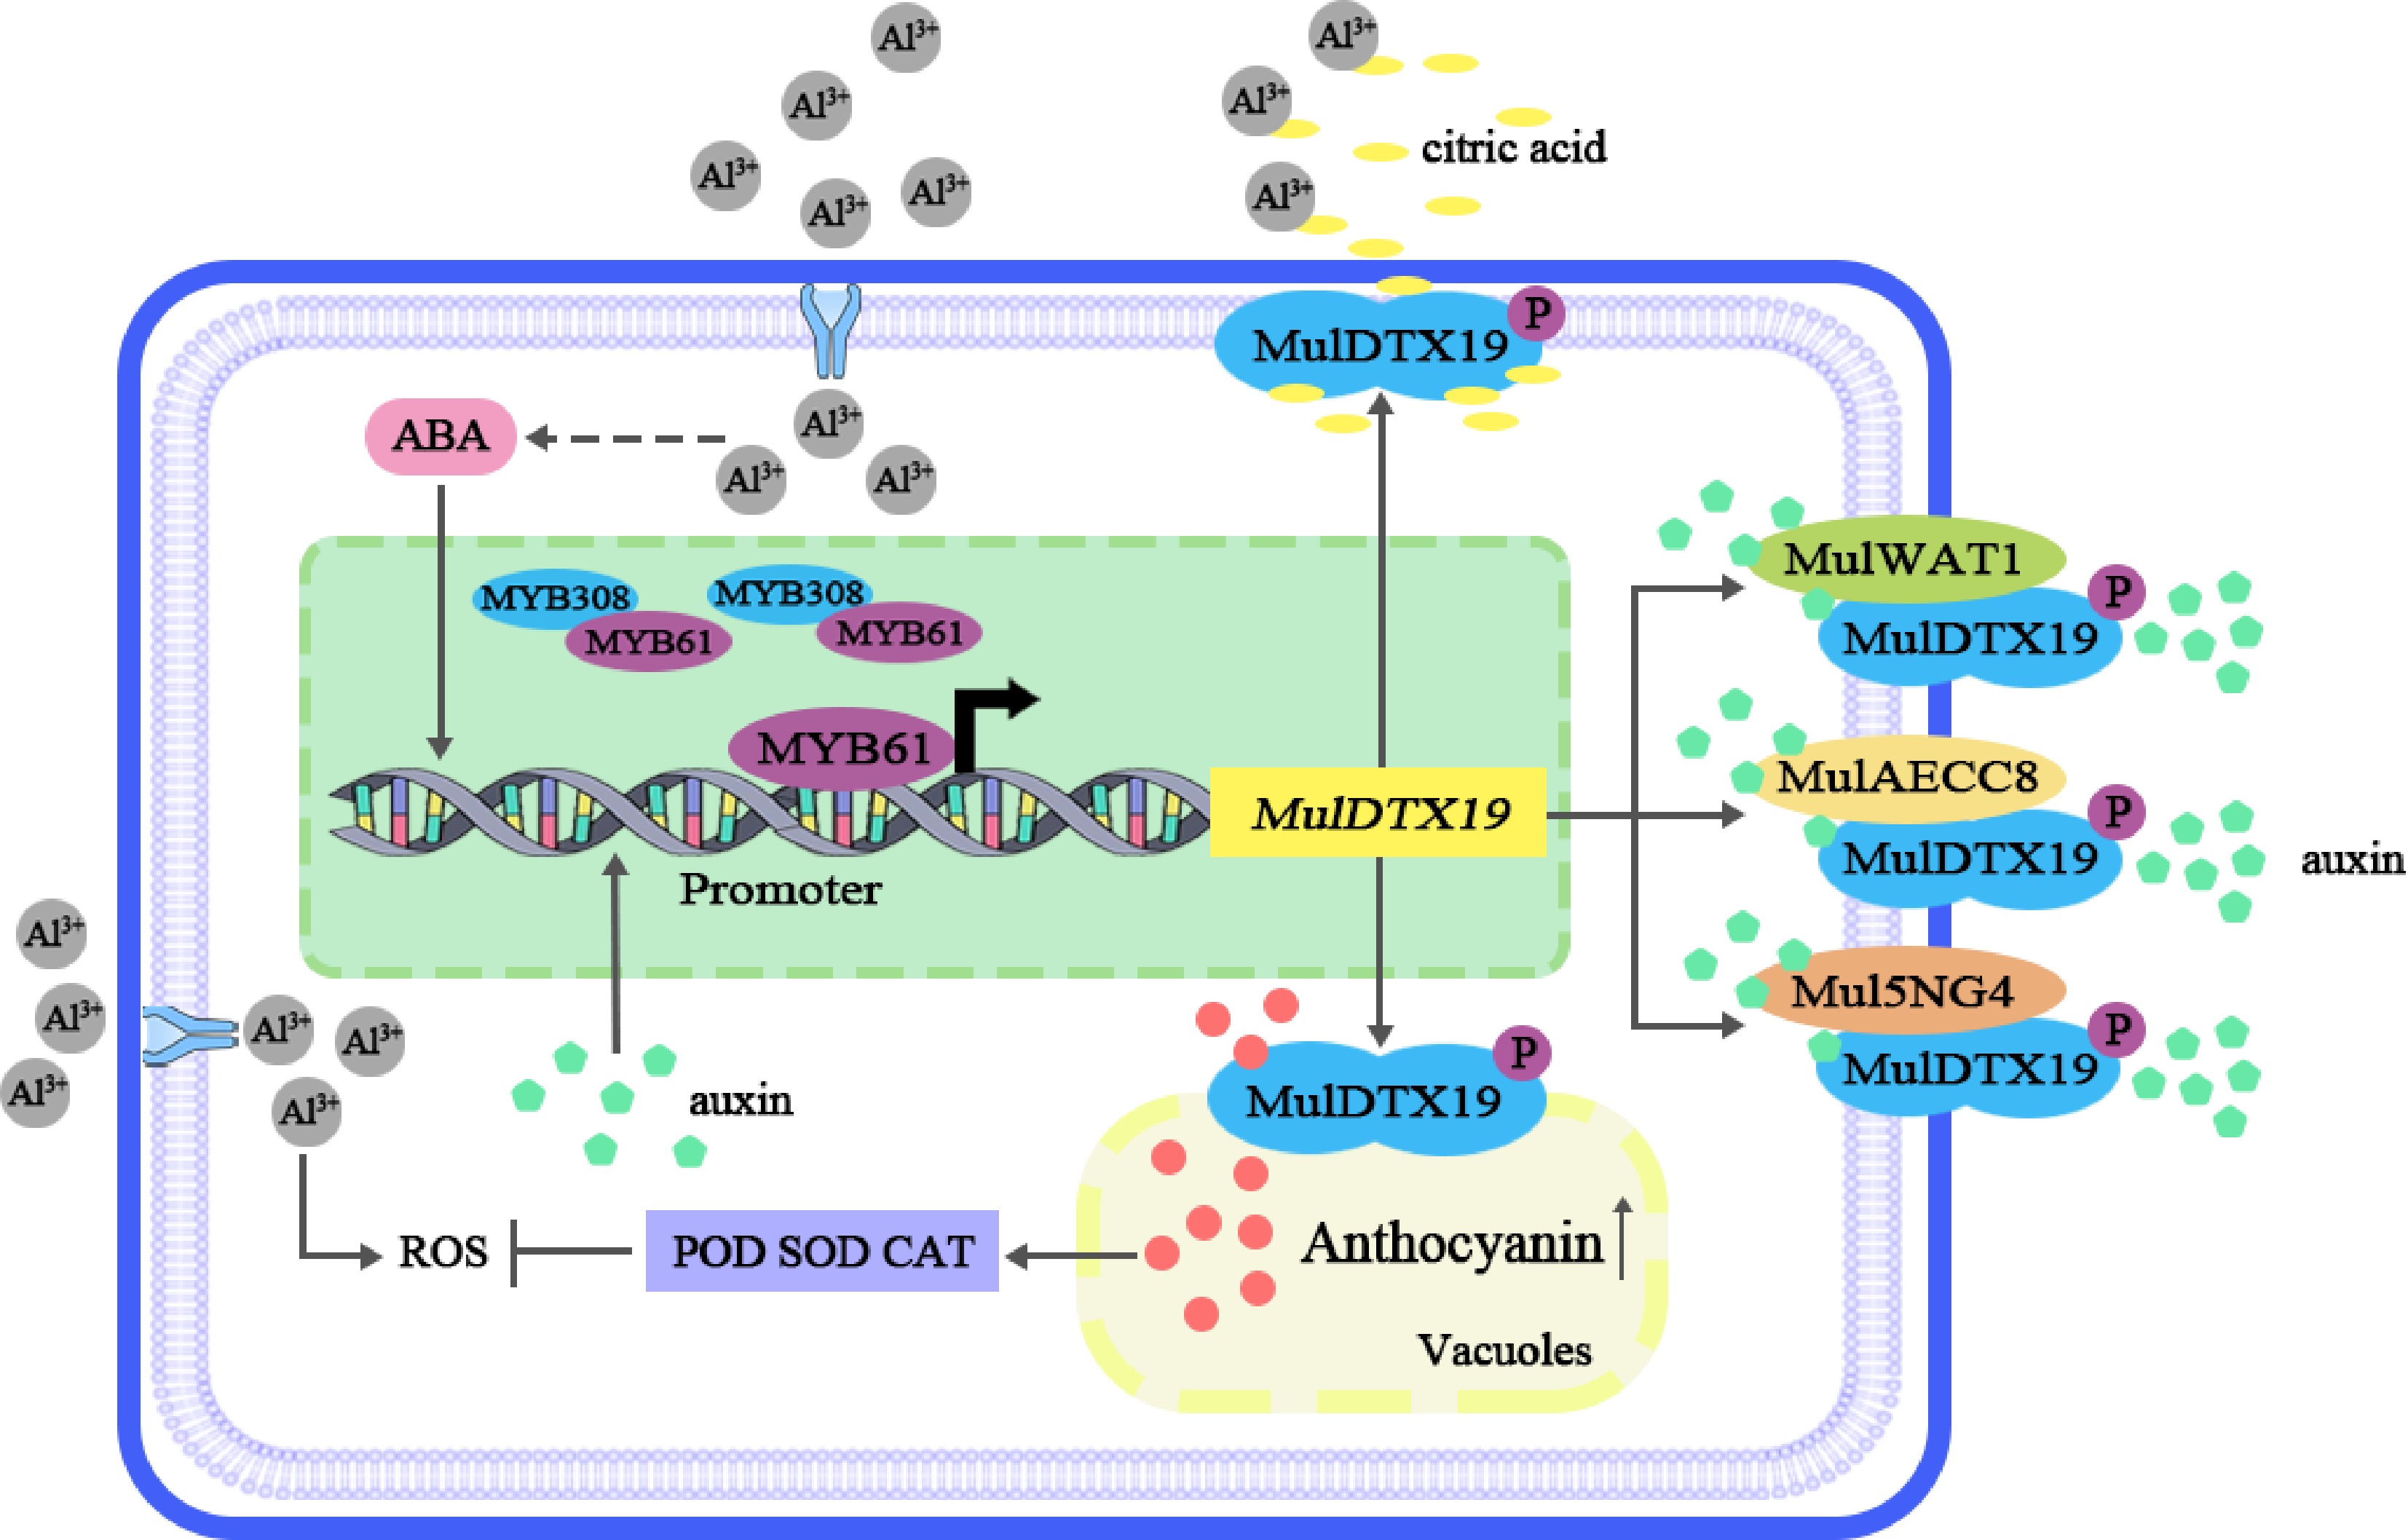
Figure 13.
Hierarchical regulatory model of MaDTX19-mediated growth-defense trade-off in mulberry under Al3+ stress. Under optimal conditions, low MaDTX19 expression and basal Ser4 phosphorylation maintain normal auxin transport and growth. Upon Al3+ stress, the MaMYB61-MaMYB308 module induces MaDTX19 transcription, while a yet-unidentified kinase phosphorylates Ser4, switching MaDTX19 to its active conformation. Phosphorylated MaDTX19 then exerts dual functions: inhibiting growth by interacting with auxin transport components (MaAECC8, Ma5NG4, MaWAT1) and activating Al3+ tolerance through citrate secretion and flavonoid-mediated antioxidant defense. The MaMYB308-mediated negative feedback prevents excessive MaDTX19 expression, minimizing sustained fitness costs.
Figures
(13)
Tables
(0)