-
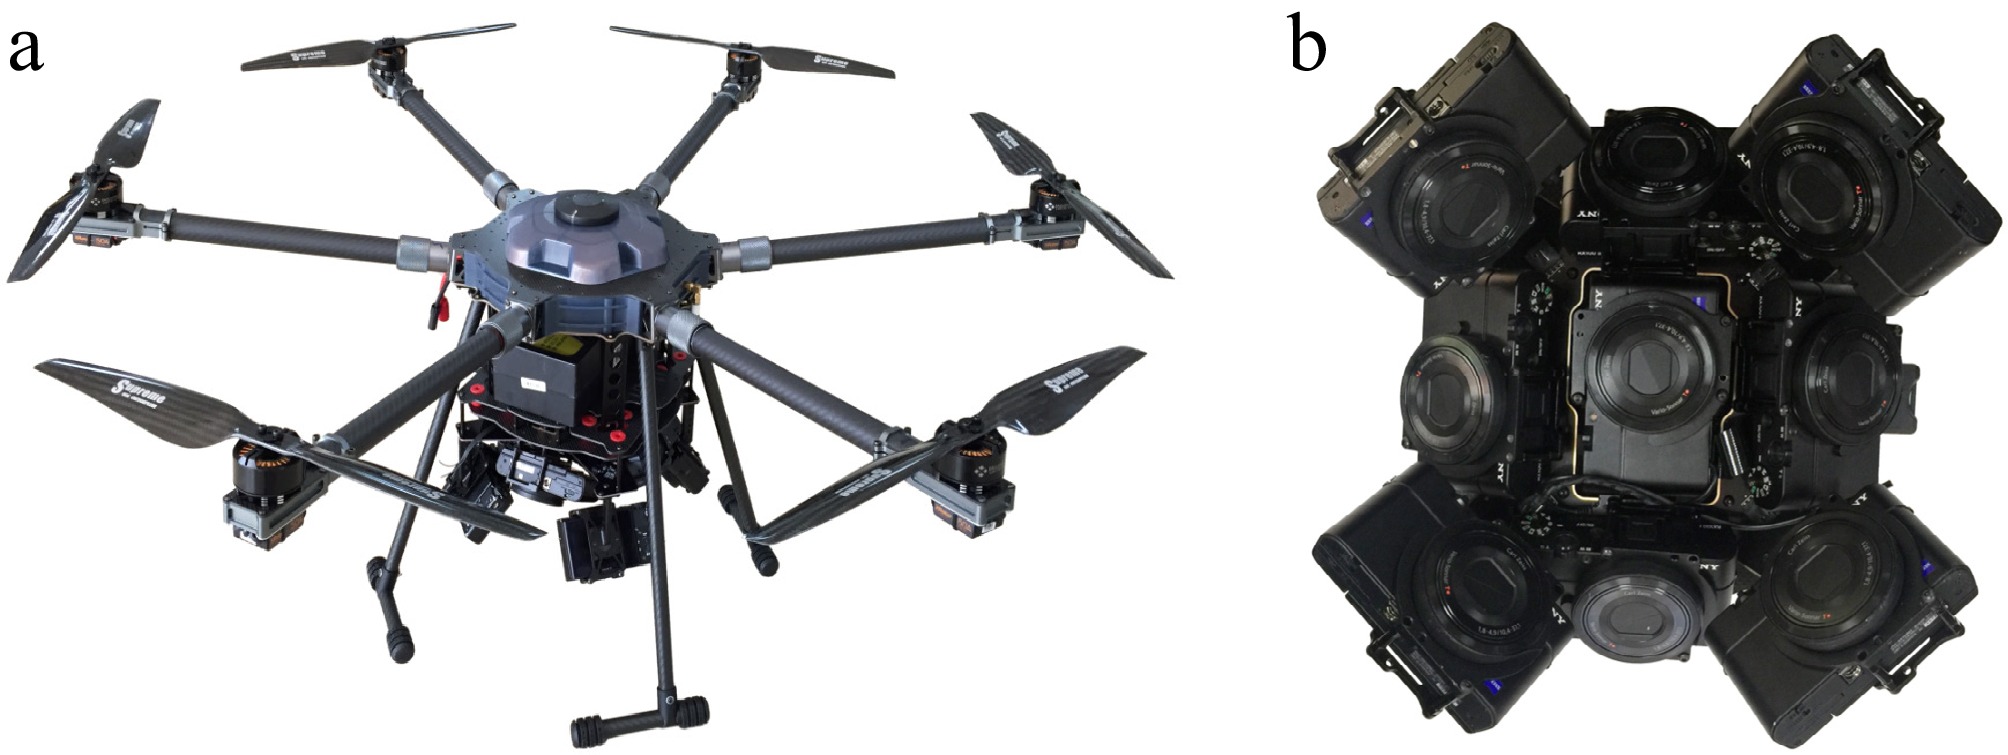
Figure 1.
(a) The six-rotor UAV. (b) The nine-camera oblique photography system.
-
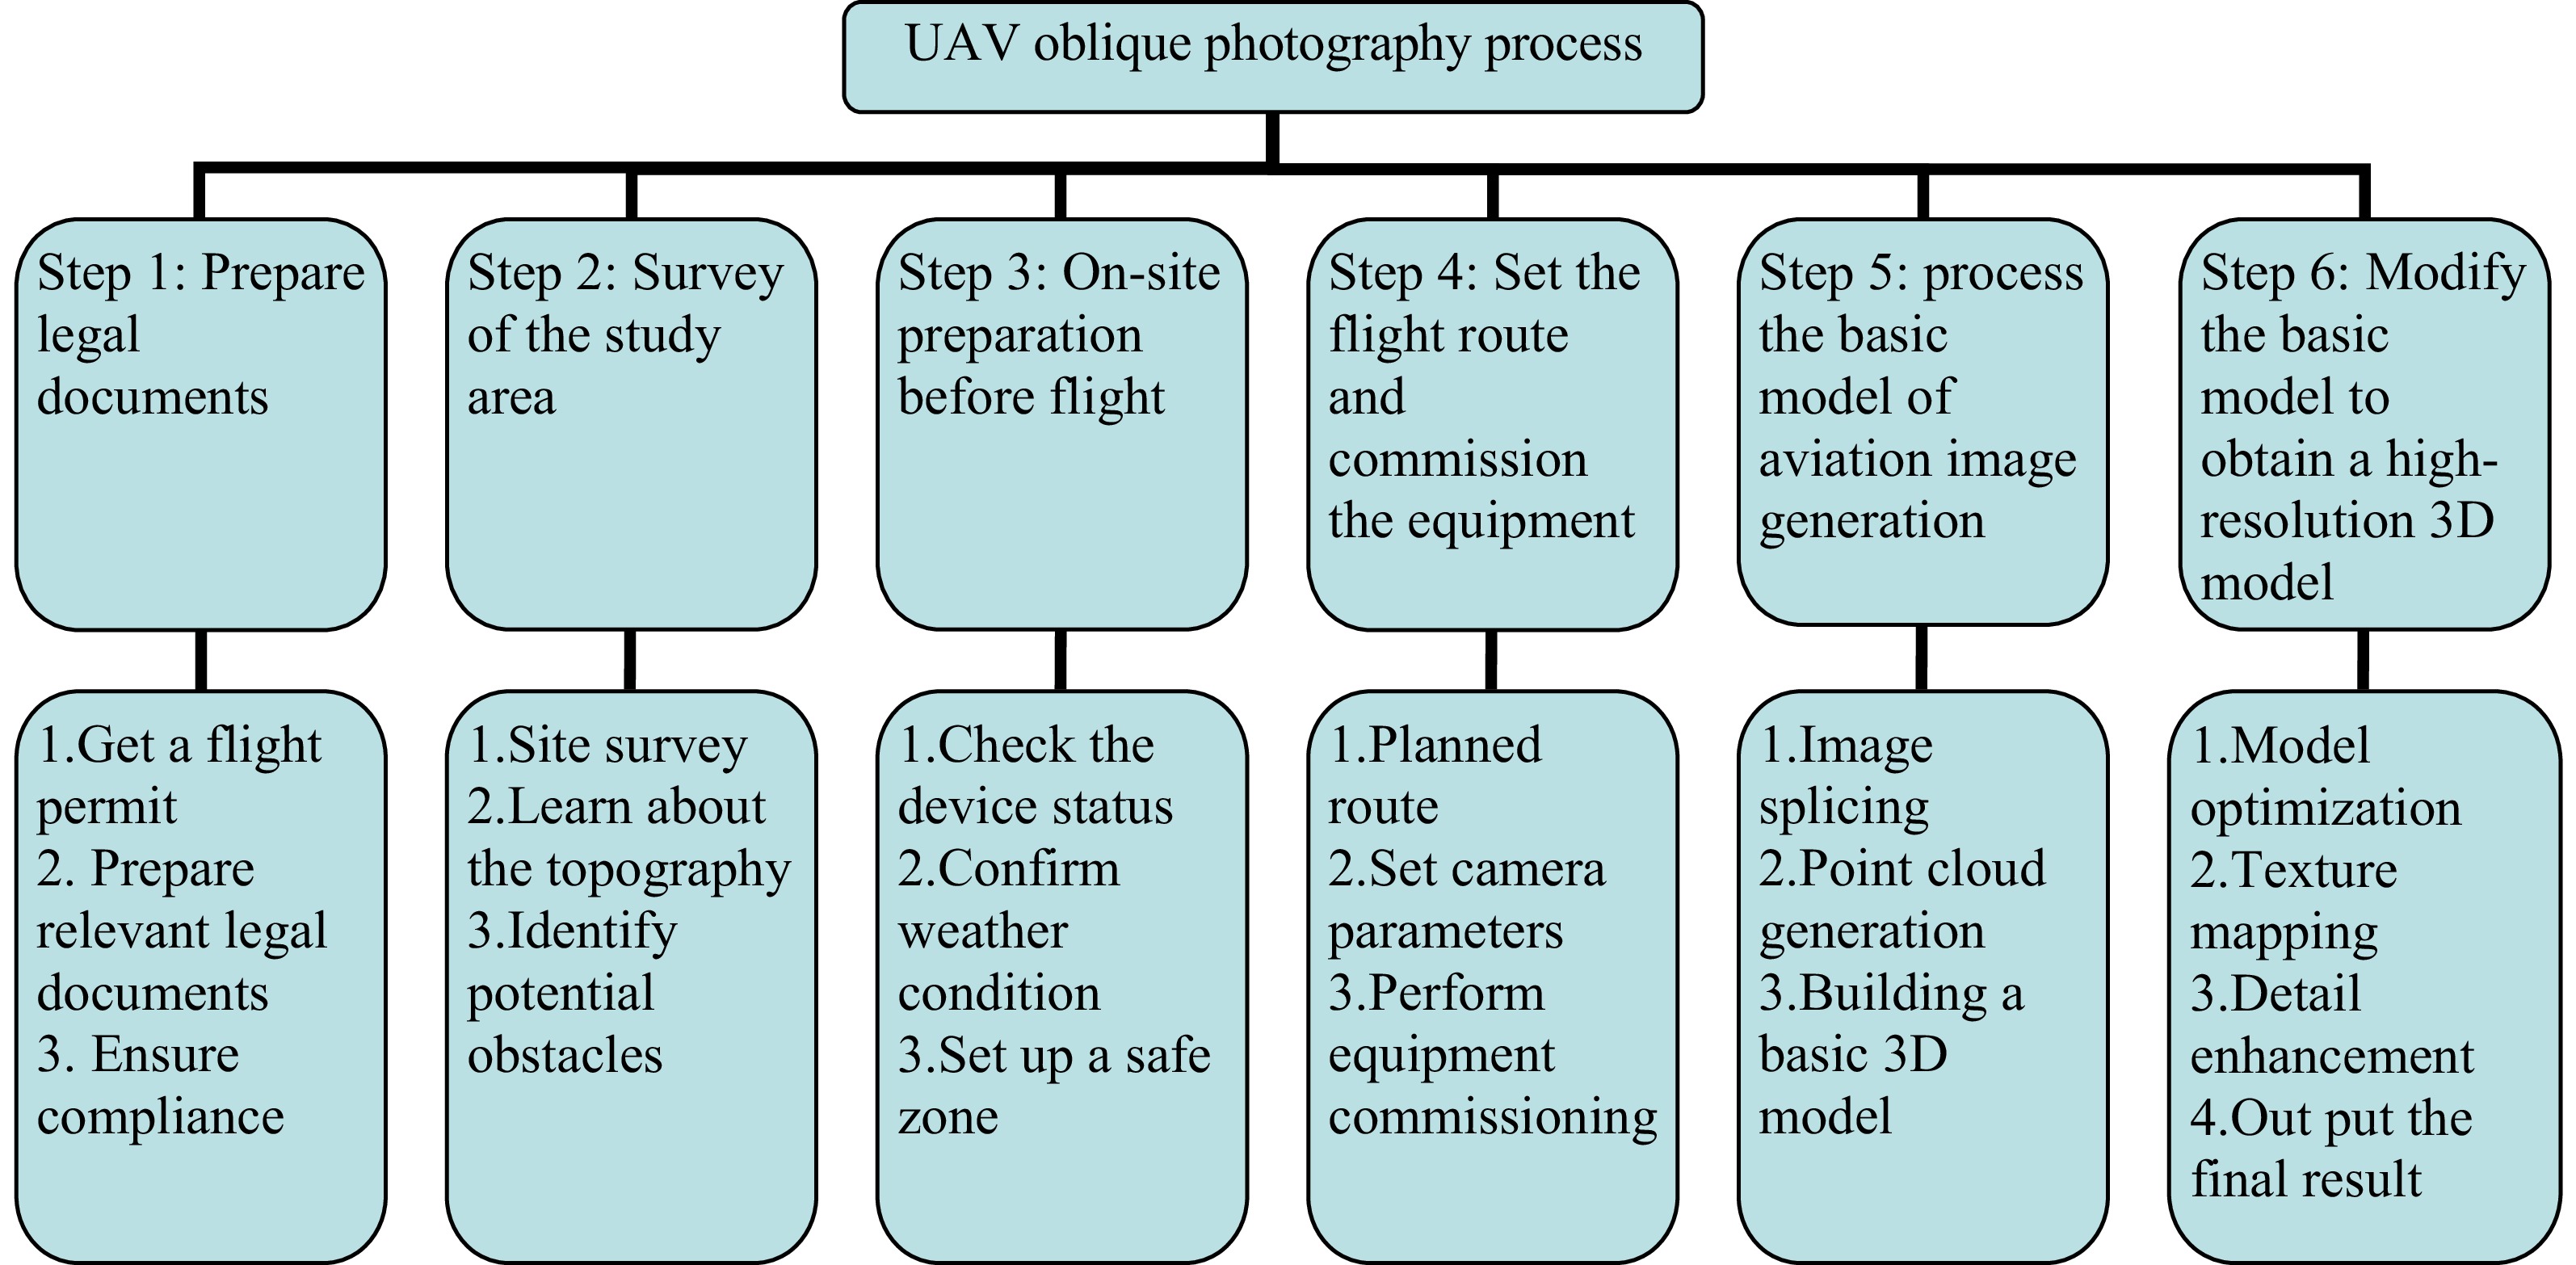
Figure 2.
The 3D modeling process using UAV-based oblique photography.
-
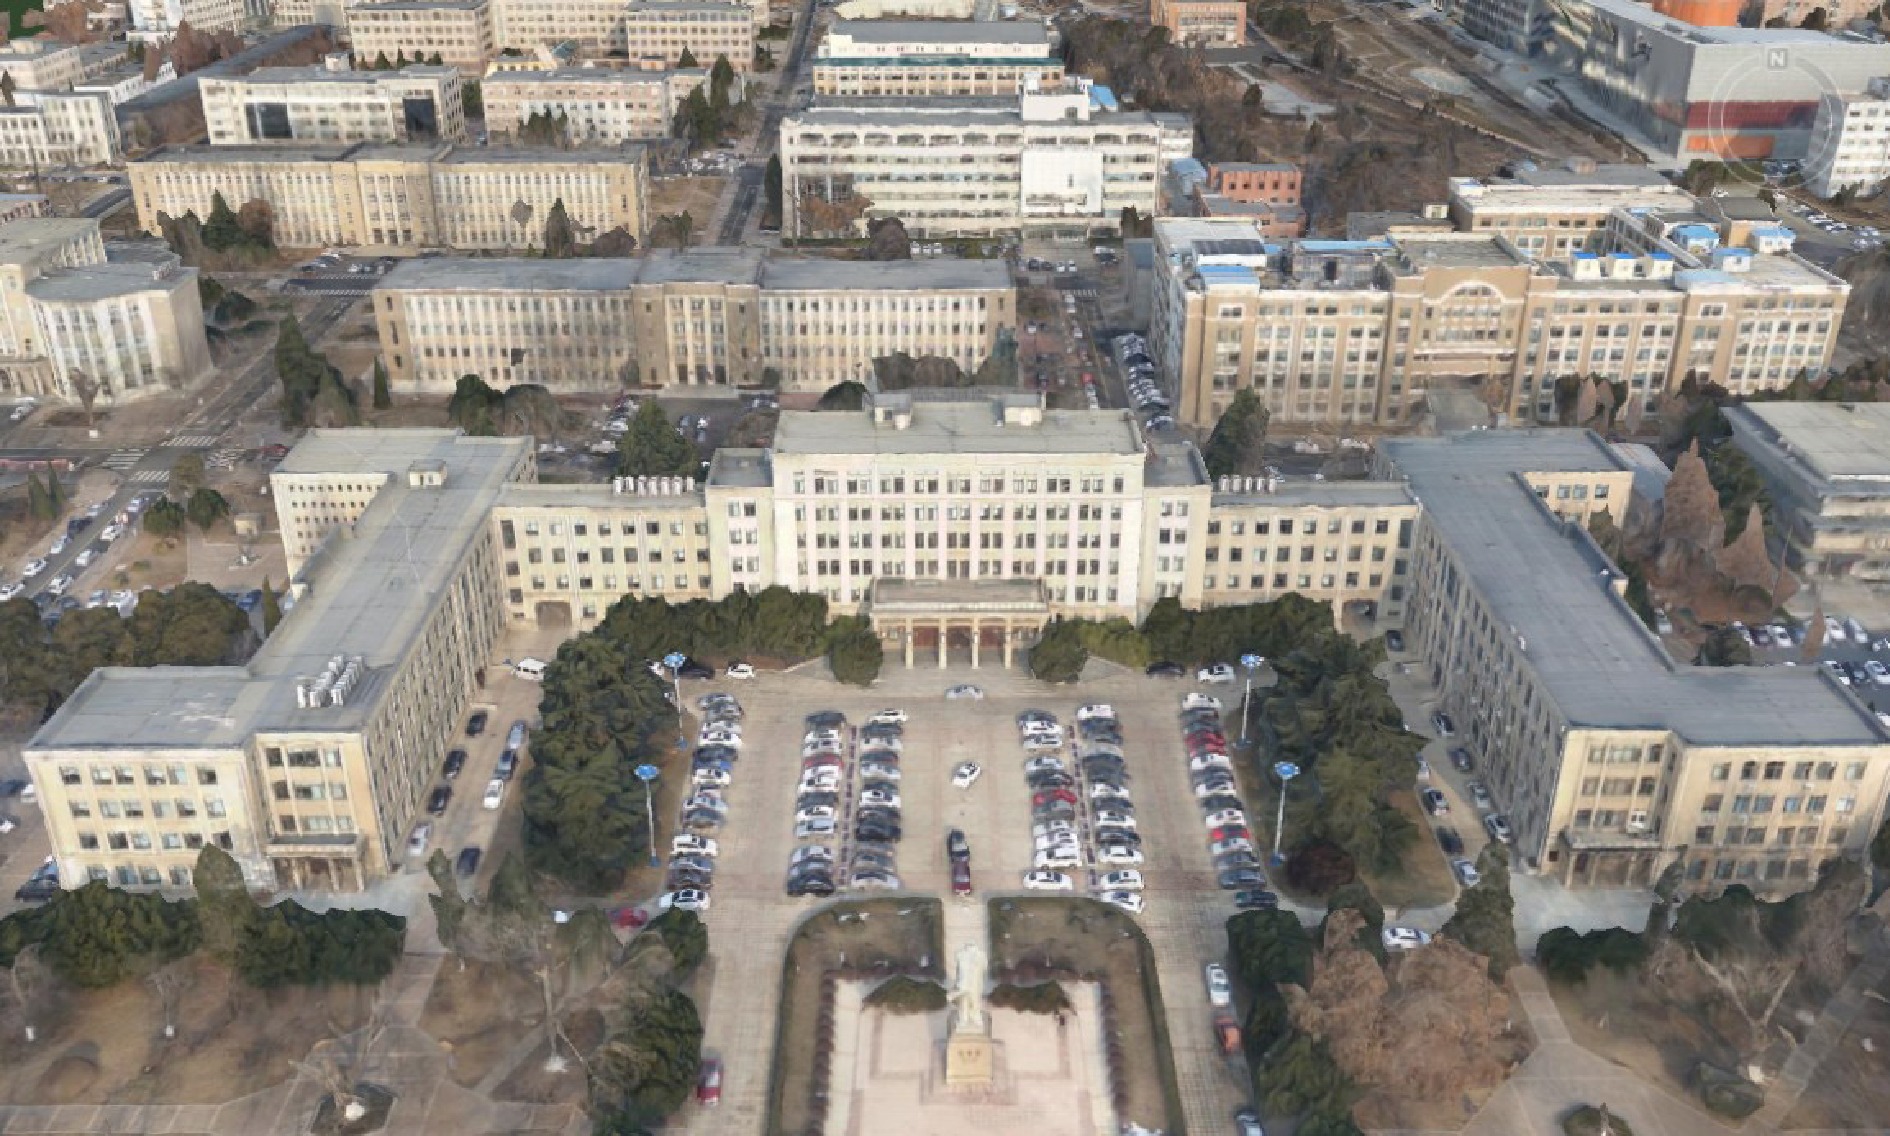
Figure 3.
A 3D texture model of the campus of Dalian University of Technology.
-
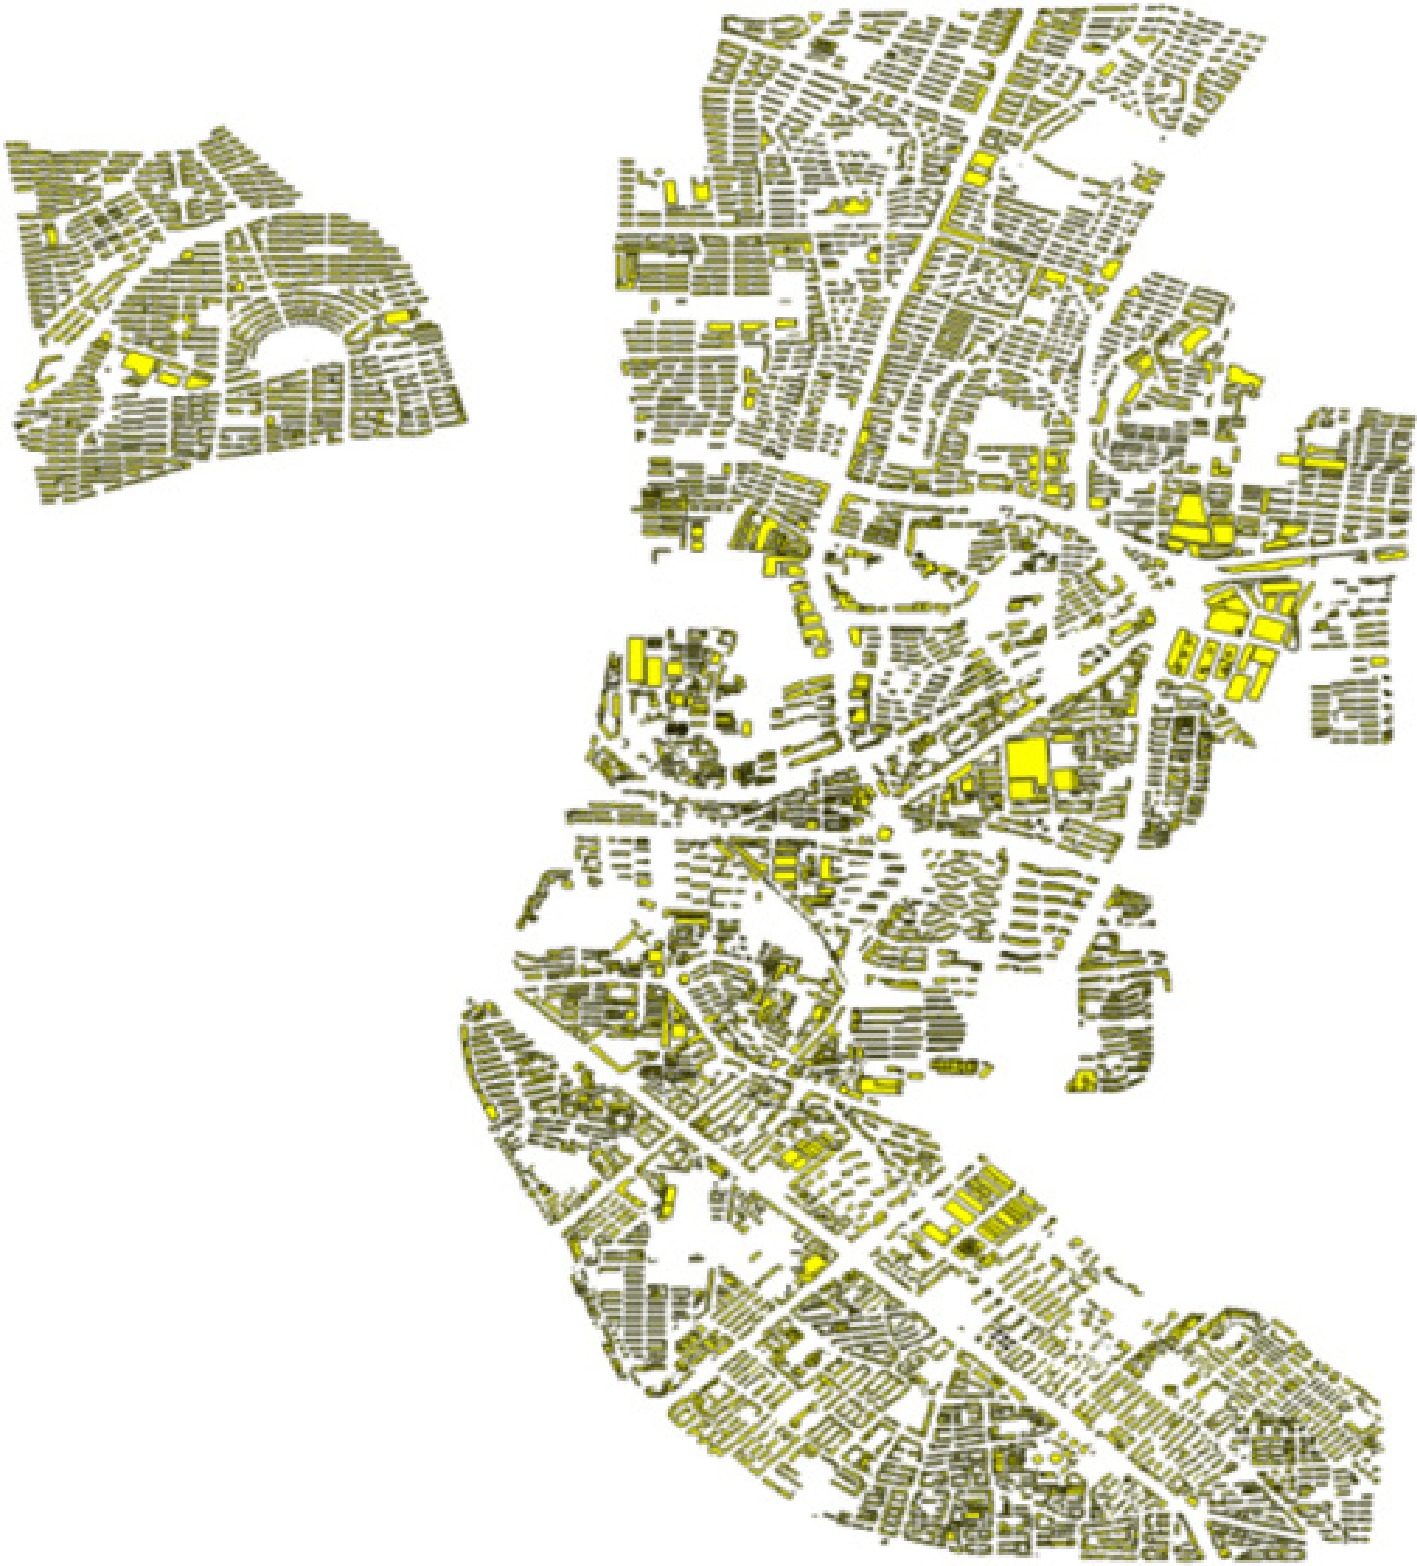
Figure 4.
Annotated sample data for Ganjingzi District.
-
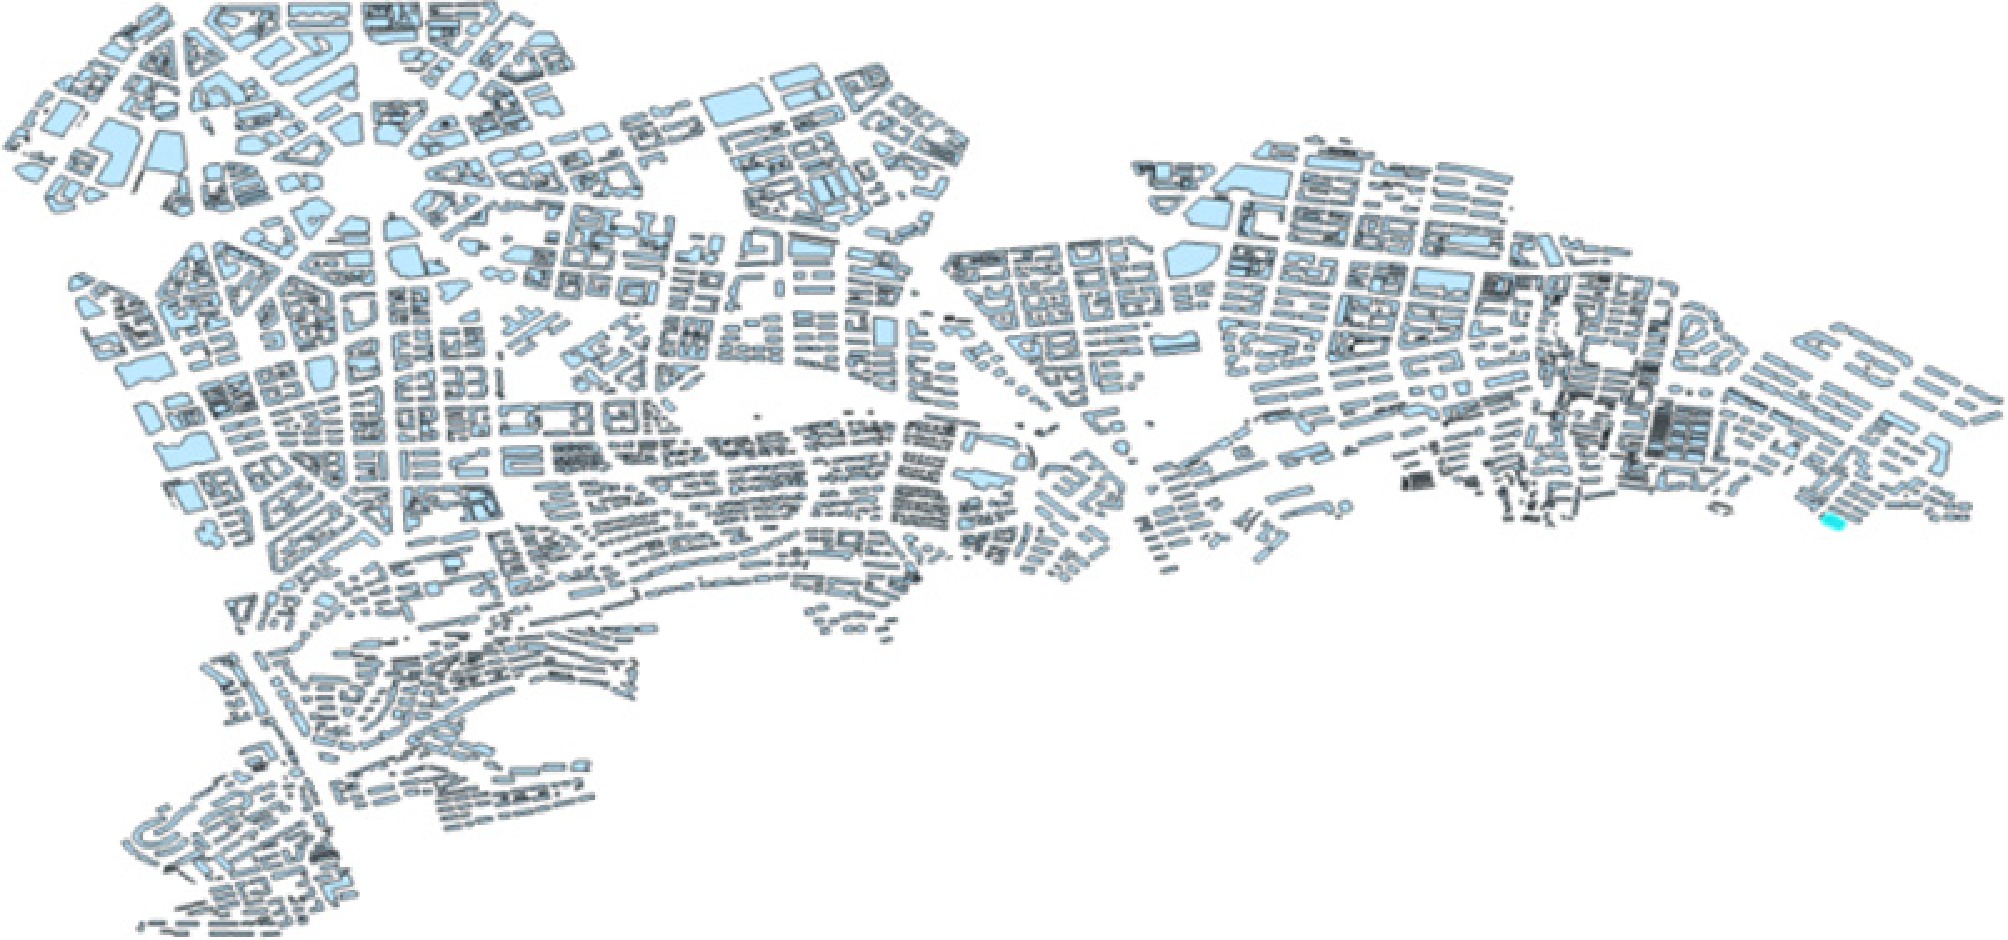
Figure 5.
Annotated sample data for Zhongshan District.
-
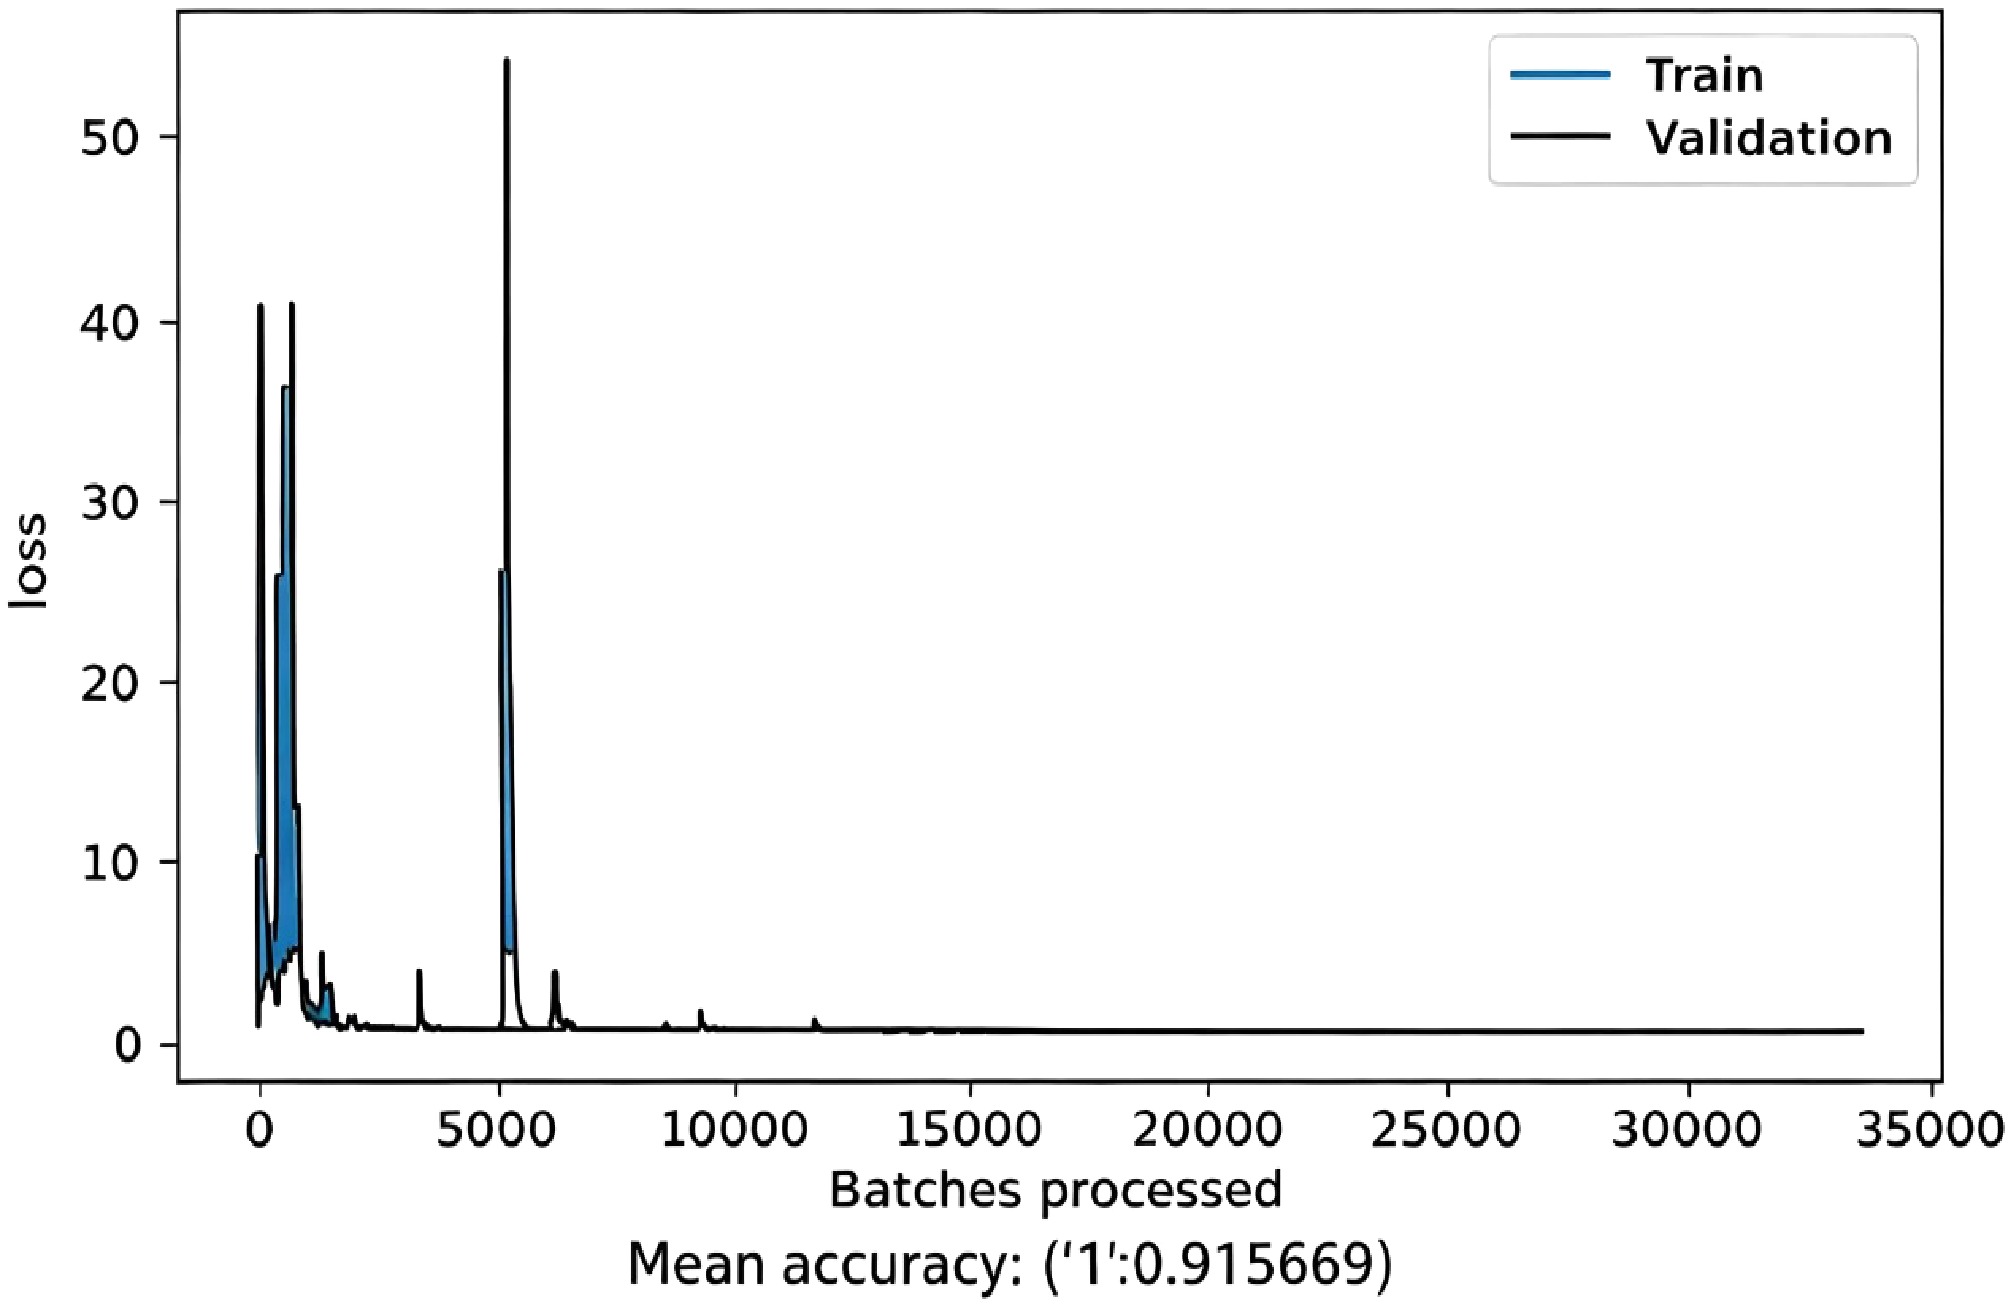
Figure 6.
Model training results.
-
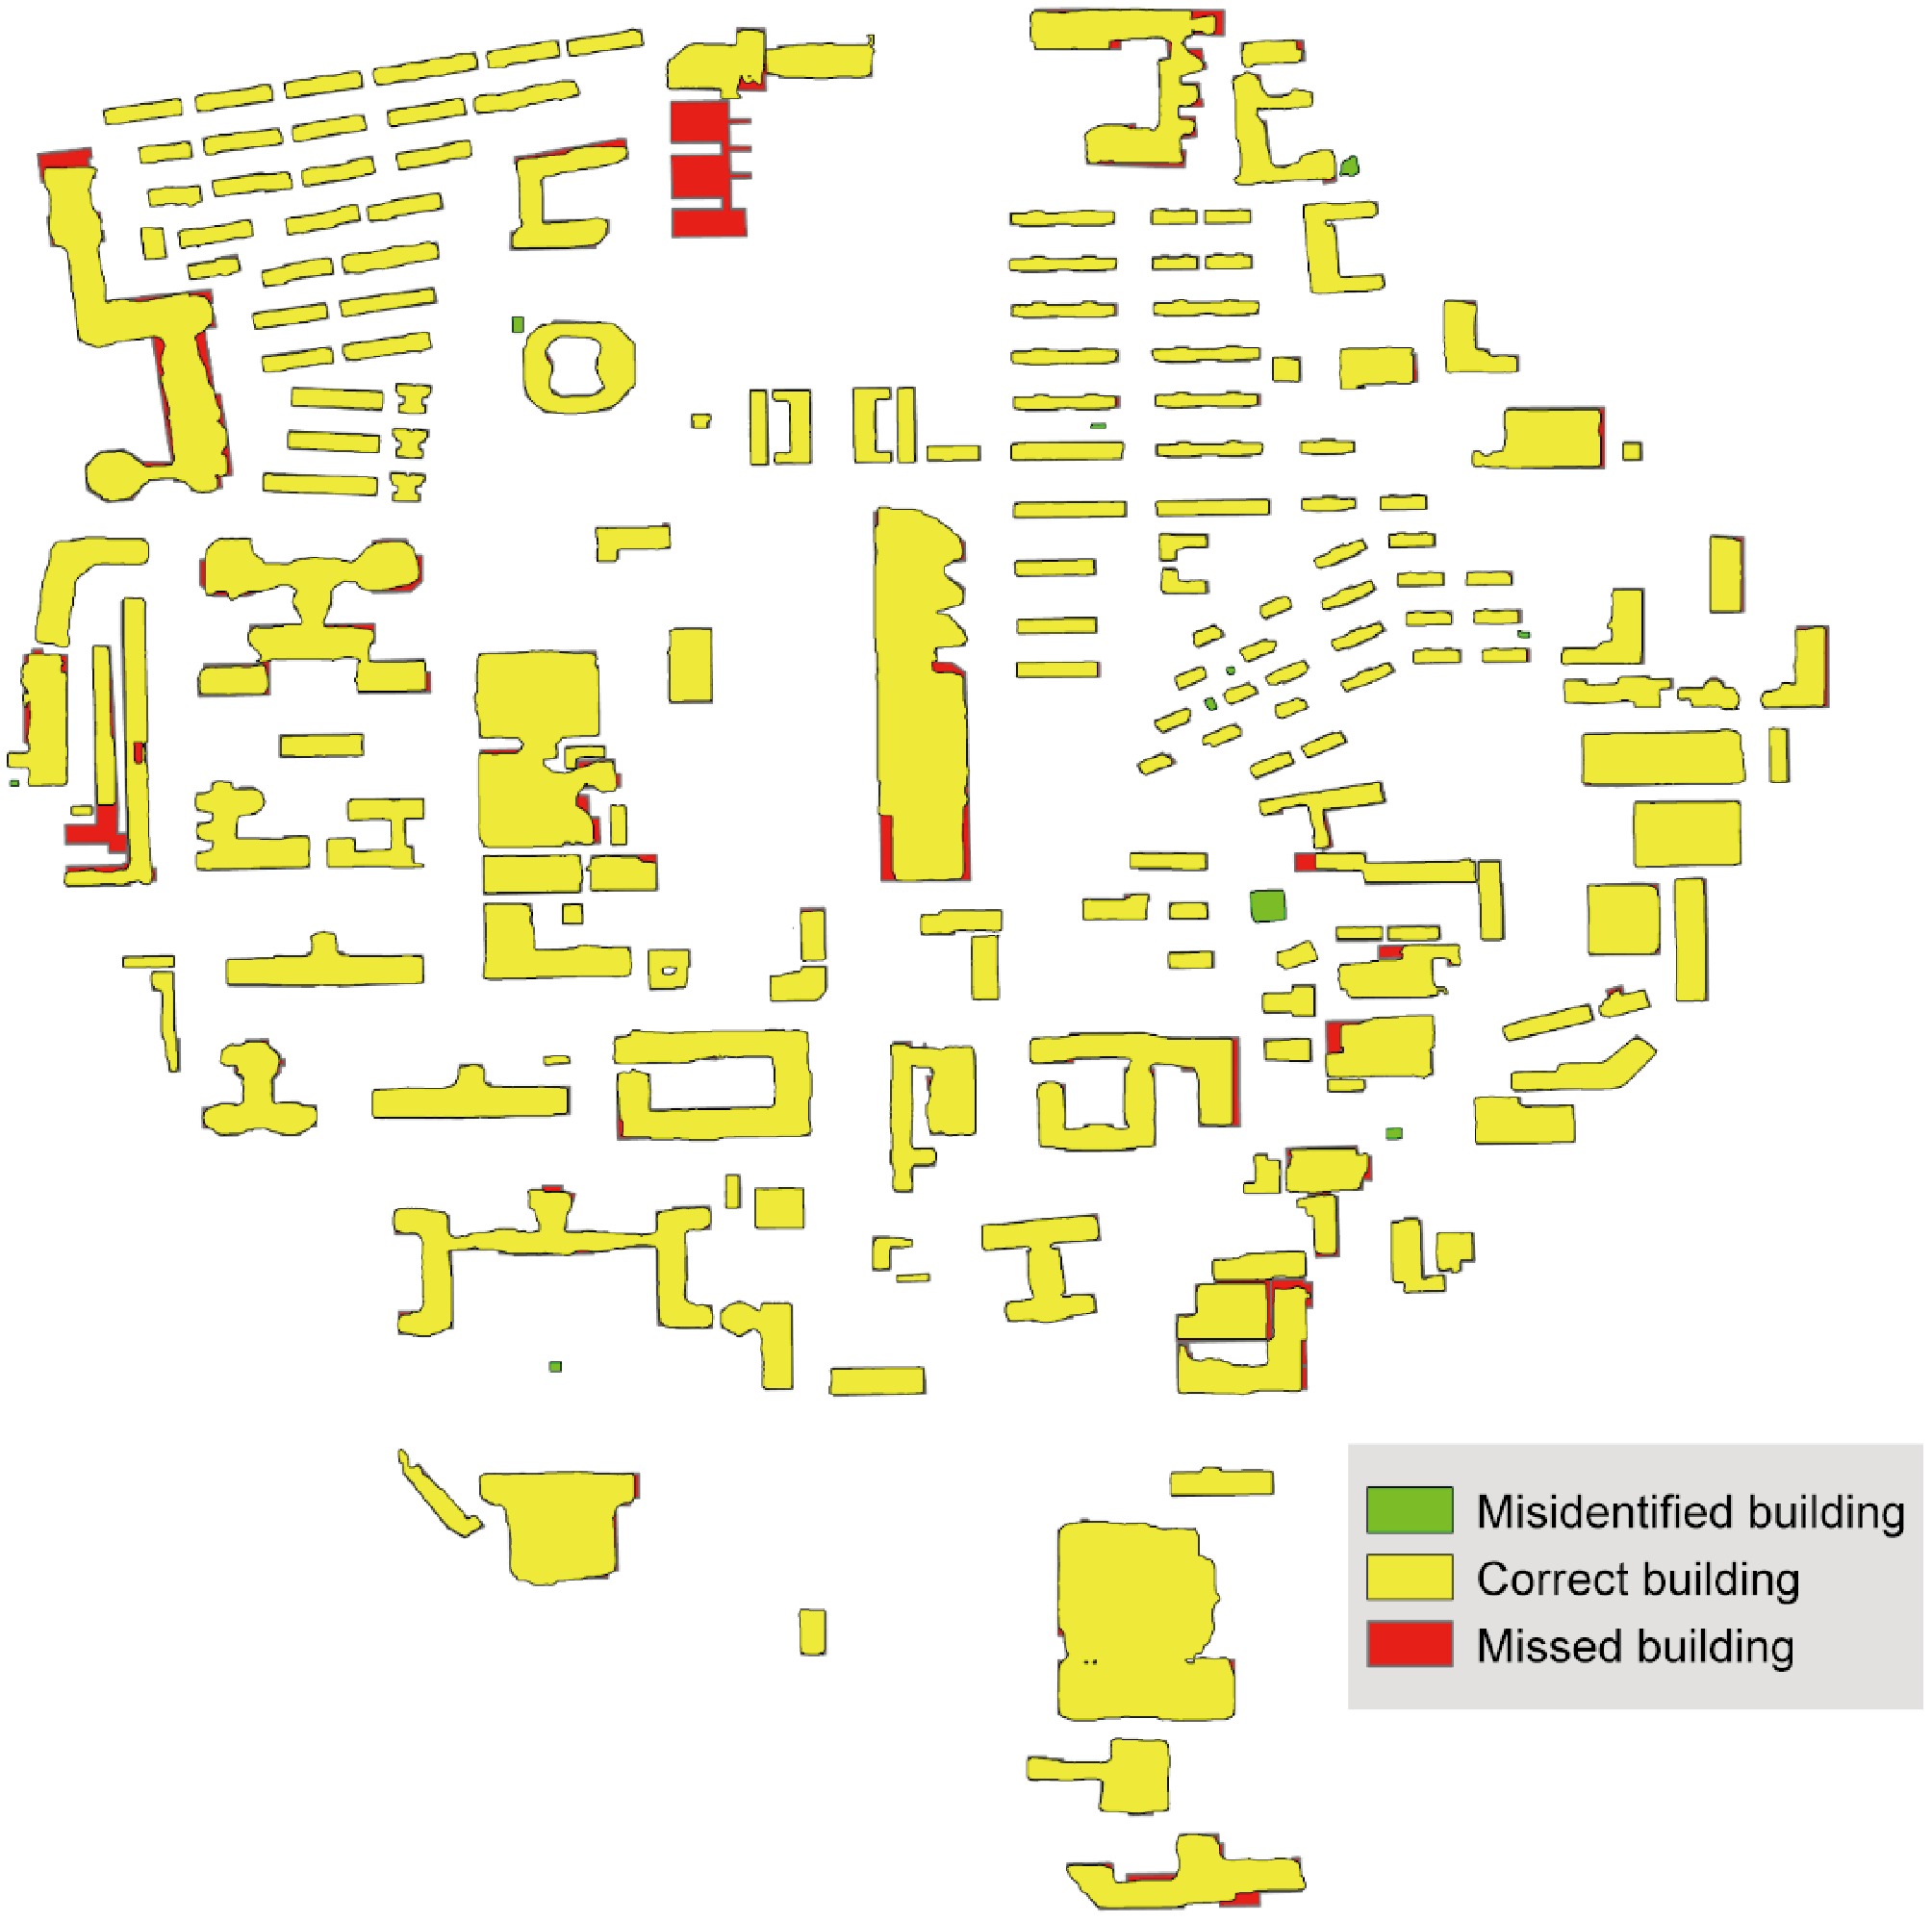
Figure 7.
Output results of Dataset 1 after post-processing.
-
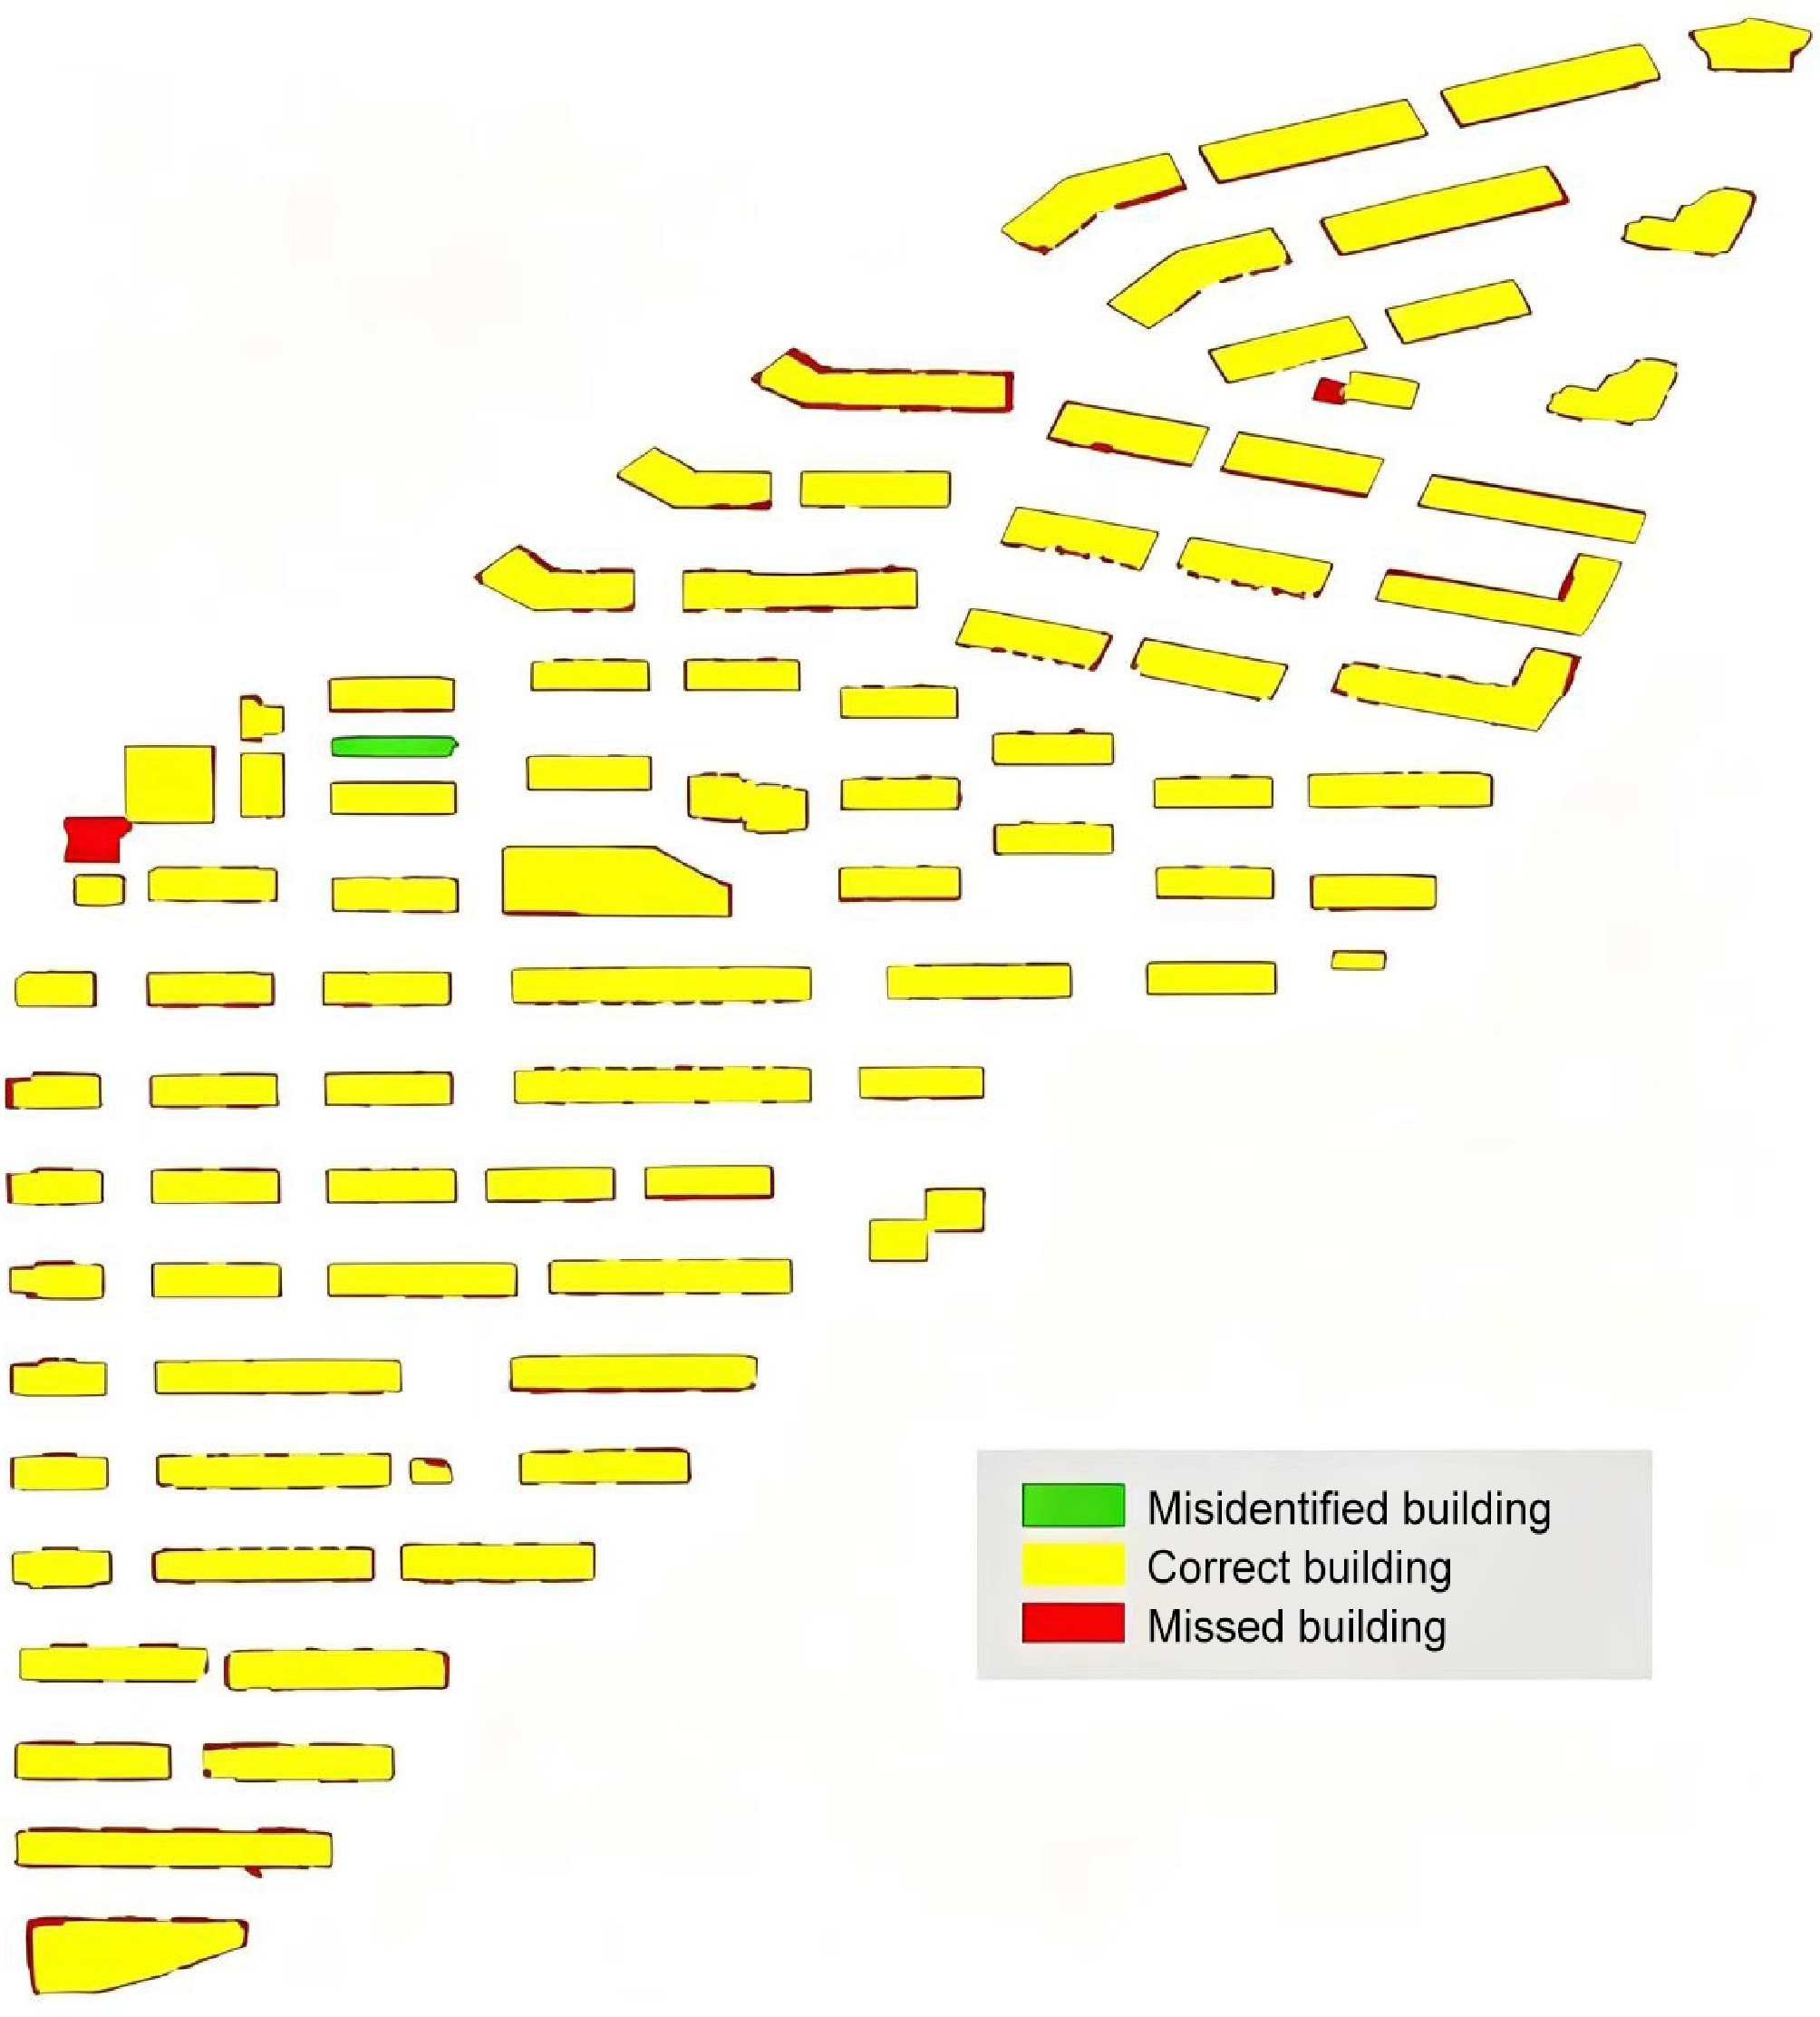
Figure 8.
Extraction results of building footprint contours from Dataset 2.
-
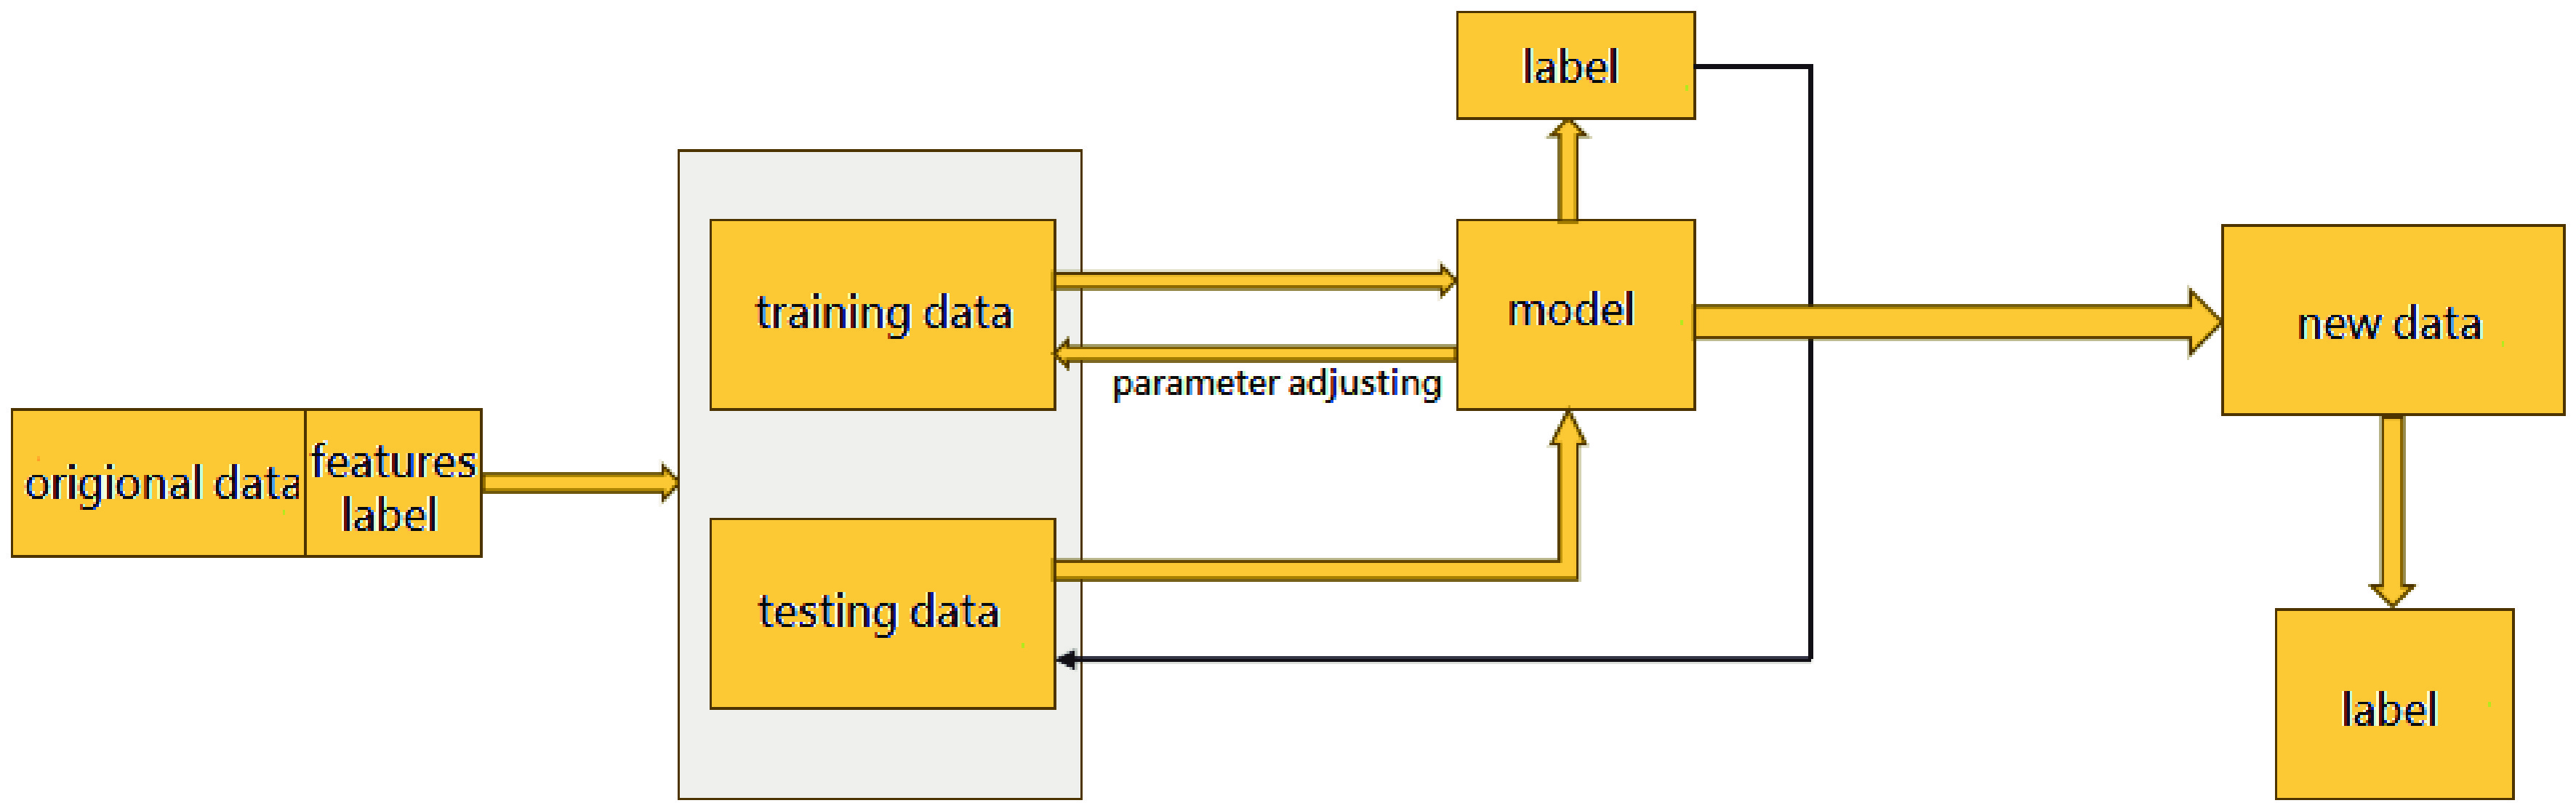
Figure 9.
Supervised learning process.
-
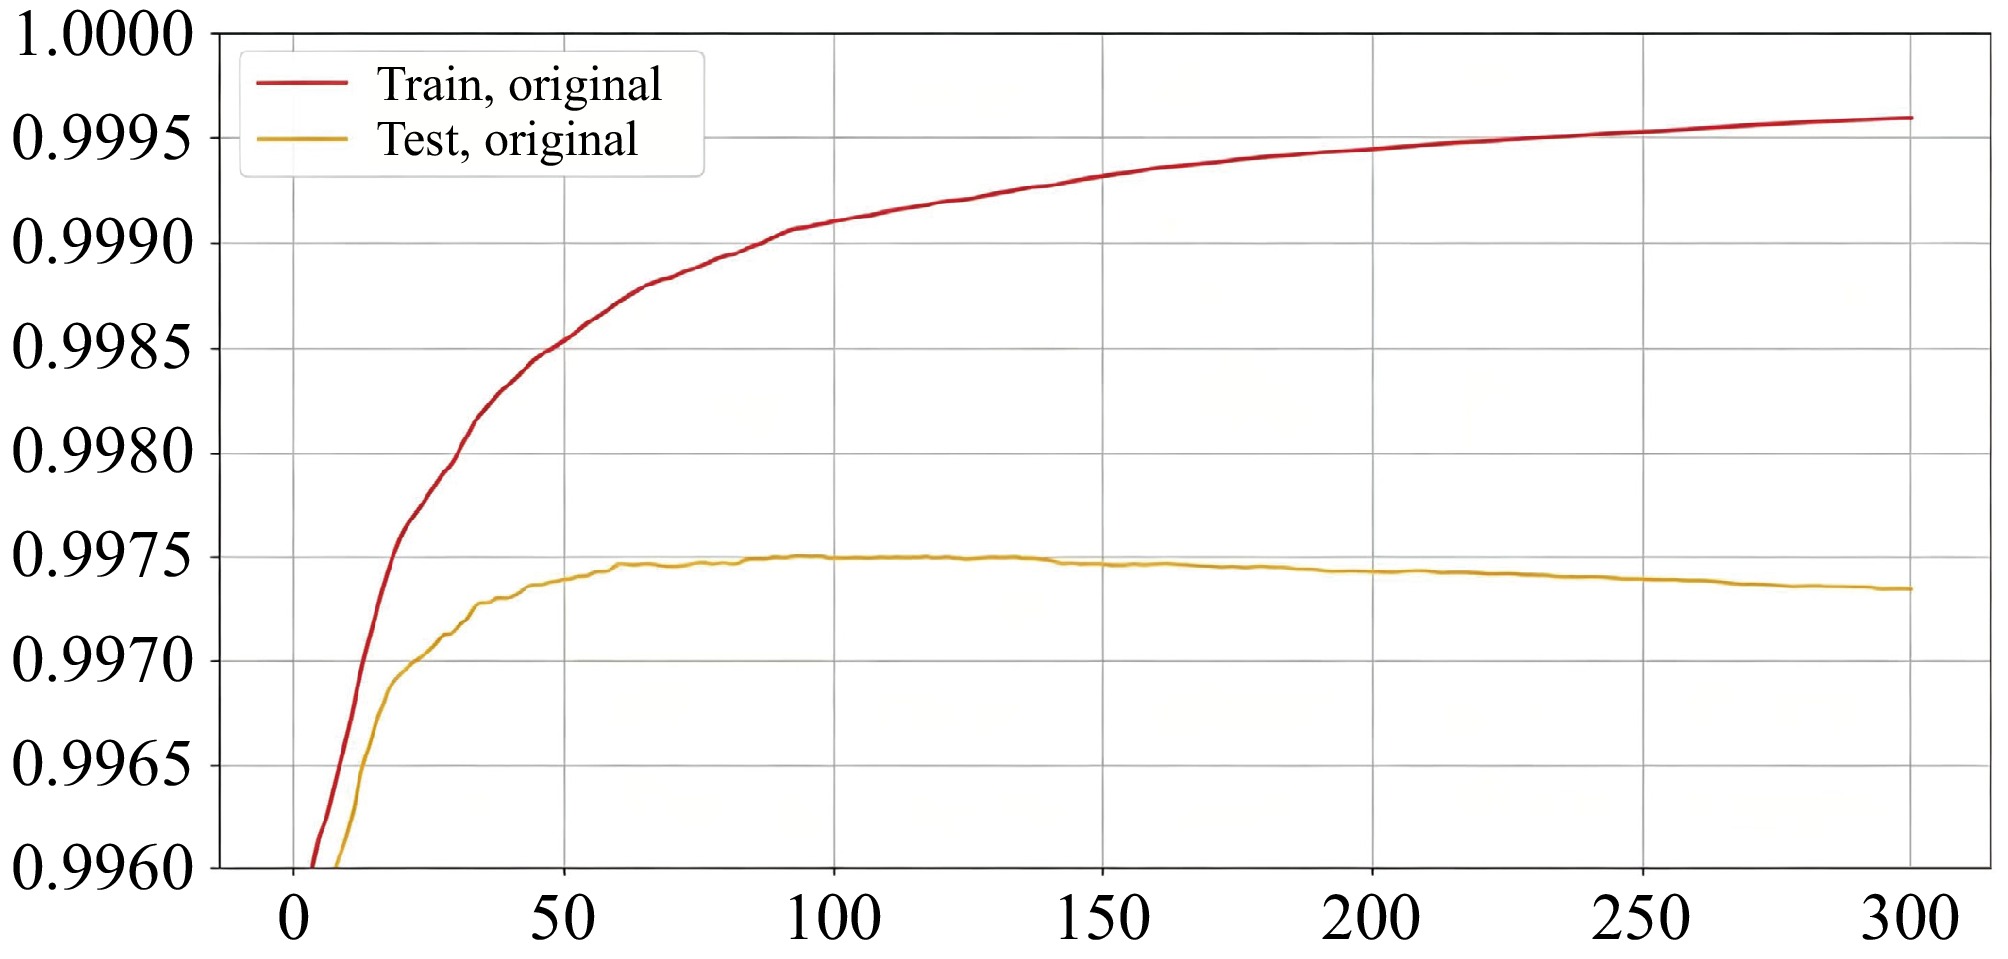
Figure 10.
Mean AUC for the learning curve of XGBoost with the training set and test set.
-
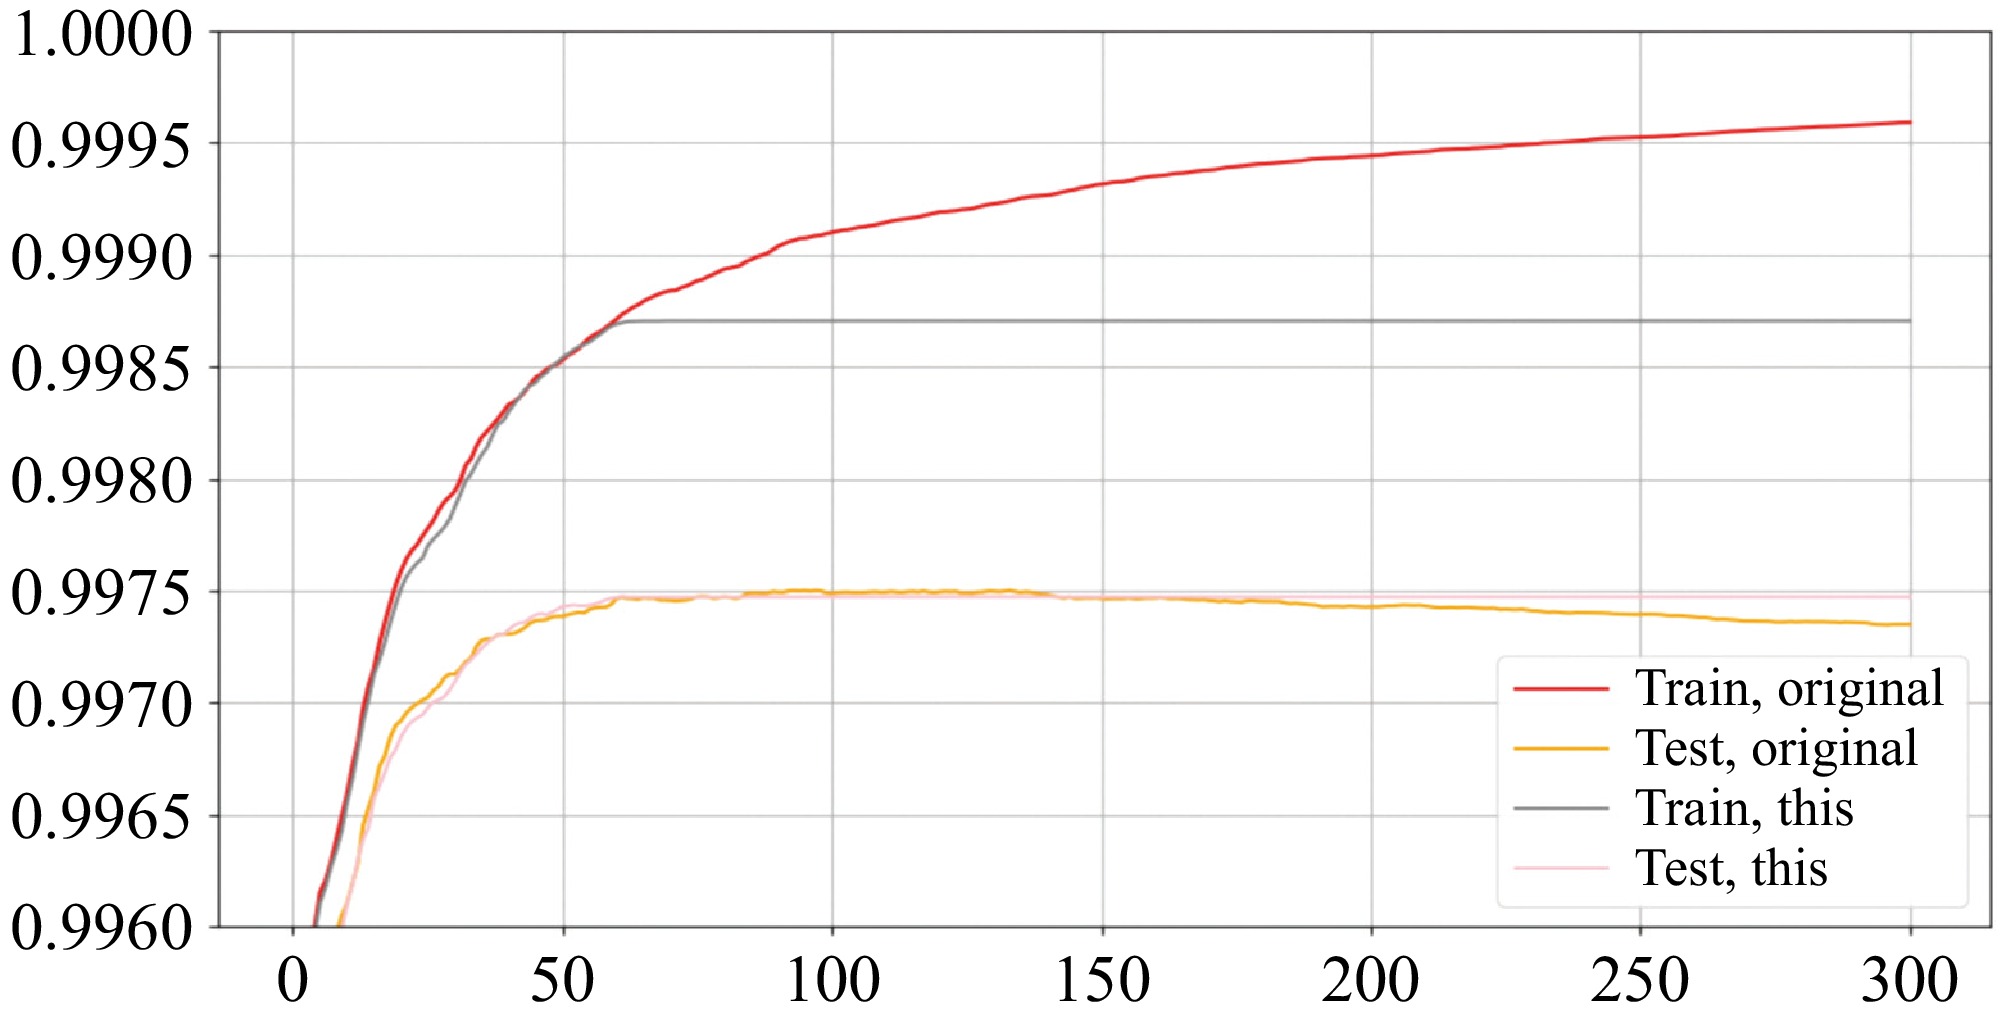
Figure 11.
Mean AUC for the learning curve of the training set and test set after parameter adjustment.
-
Horizontal Vertical Minimum error (m) 0.06 0.03 Maximum error (m) 0.31 0.23 Root mean square error 0.07 0.10 Mean error (m) 0.17 0.14 Table 1.
Accuracy analysis results of the 3D model.
-
Dataset TP FP FN Cm(%) Cr(%) QI(%) Dataset 1 163 28 19 89.56 85.34 77.62 Dataset 2 80 7 6 93.02 91.95 86.02 Mean − − − 91.29 88.65 81.82 Table 2.
Quantitative results of object-based evaluation.
-
Parameter Value Maximum iteration count 20 Validation percentage 10 Image film size 512 Learning rate − Monitoring metrics Loss validation Table 3.
Parameters used for model training.
-
Dataset TP FP FN Cm (%) Cr (%) QI (%) Dataset 1 172 6 10 94.51 96.63 91.40 Dataset 2 85 1 1 98.84 98.84 97.70 Mean − − − 96.68 97.74 94.60 Table 4.
Quantitative results of object-based evaluation.
-
Dataset TP FP FN Cm (%) Cr (%) QI (%) Dataset 1 180 10 2 98.90 94.74 93.75 Dataset 2 85 1 1 98.84 98.84 97.70 Mean − − − 98.87 96.79 95.73 Table 5.
Quantitative results of object-based evaluation.
-
Dataset TP FP FN Cm (%) Cr (%) QI (%) Dataset 1 180 4 2 98.90 97.83 96.77 Dataset 2 85 1 1 98.84 98.84 97.70 Mean − − − 98.87 98.34 97.24 Table 6.
Quantitative results of object-based evaluation.
-
Building ID Reference
value (m2)Estimated
value (m2)Relative
error (%)Average relative
error (%)Building 1 4,580.15 4,722.87 3.12 3.7 Building 2 6,105.44 6,297.73 3.15 Building 3 896.79 837.81 6.58 Building 4 1,023.57 1,076.19 5.14 Building 5 2,260.04 2,225.97 1.51 Dataset 1 − − − 5.76 Dataset 2 − − − 2.83 Table 7.
Analysis results of relative error of extracted building area information.
-
Evaluation metric Precision (%) Overall accuracy 98.56 Recall rate of single-story bungalows 100.00 Recall rate of masonry structures 99.14 Recall rate of frame structures 83.57 Table 8.
Initial training accuracy.
-
Evaluation metric Precision (%) Overall accuracy 98.59 Recall rate of single-story bungalows 100.00 Recall rate of masonry structures 99.15 Recall rate of frame structures 84.12 Table 9.
Adjusted model precision.
-
Evaluation metric Precision (%) Overall mean accuracy 99.13 Mean recall rate of single-story bungalows 100 Mean recall rate of masonry structures 99.18 Mean recall rate of frame structures 92.21 Table 10.
Prediction accuracy of structure types in small areas.
-
Evaluation metric Precision (%) Overall accuracy 98.82 Recall rate of single-story bungalows 100.00 Recall rate of masonry structures 99.69 Recall rate of frame structures 82.47 Table 11.
Model evaluation results.
-
Evaluation metric Precision (%) Overall mean accuracy 99.20 Mean recall rate of single-story bungalows 100.00 Mean recall rate of masonry structures 99.71 Mean recall rate of frame structures 89.69 Table 12.
Prediction accuracy of structure types in a small area.
-
Evaluation metric Precision (%) Overall accuracy 98.52 Recall rate of single-story bungalows 100.00 Recall rate of masonry structures 99.06 Recall rate of frame structures 83.86 Table 13.
Model evaluation results.
-
Evaluation metric Precision (%) Overall mean accuracy 99.13 Mean recall rate of single-story bungalows 100.00 Mean recall rate of masonry structures 99.43 Mean recall rate of frame structures 89.36 Table 14.
Prediction accuracy of structure types in a small area.
-
Evaluation metric Precision (%) Overall accuracy 98.15 Recall rate of single-story bungalows 100.00 Recall rate of masonry structures 98.52 Recall rate of frame structures 81.03 Table 15.
Model evaluation results.
-
Evaluation metric Precision (%) Overall mean accuracy 98.67 Mean recall rate of single-story bungalows 100.00 Mean recall rate of masonry structures 98.50 Mean recall rate of frame structures 91.08 Table 16.
Prediction accuracy of structure types in a small area.
-
Data Evaluation parameters Random forest XGBoost Adaboost MLP neural network Test set Precision 98.59% 98.82% 98.52% 98.15% f1 0.9558 0.9599 0.9540 0.9396 Recall ratio 0.9442 0.9406 0.9431 0.9318 Accuracy 0.9687 0.9732 0.9662 0.9480 AUC area 0.9963 0.9981 0.9949 0.9956 Recall rate of masonry structures 99.15% 99.69% 99.06% 98.52% Recall rate of frame structures 84.12% 82.47% 83.86% 81.03% Recall rate of single-story bungalows 100% 100% 100% 100% 150 buildings Overall mean accuracy 99.13% 99.20% 99.13% 98.67% Mean recall rate of masonry structures 99.18% 99.71% 99.43% 98.50% Mean recall rate of frame structures 92.21% 89.69% 89.36% 91.08% Mean recall rate of single-story bungalows 100% 100% 100% 100% Table 17.
Various indicators of the four algorithms.
Figures
(11)
Tables
(17)