













-
Earthquakes, as a natural geological phenomenon, pose a significant threat to human life and property, and are one of the primary natural disasters leading to substantial casualties and property losses[1], which are mainly caused by buildings' damage and collapse during earthquakes. Therefore, vulnerability assessments of buildings play a crucial role in mitigating earthquake disasters[2]. Such important work can explore the potential high-risk buildings in a research region by comprehensively considering the structural types, construction dates, geometric features, and other main building parameters of buildings and thus provide a strong decision-making basis for urban disaster prevention planning, seismic reinforcement measures, and earthquake emergency management[3]. However, the rapid advancement of urbanization has left most cities facing the dilemma of lacking building attribute databases or lagging information updates. Collecting building attributes has become the critical step to be addressed in earthquake disaster simulations. Previously, such work mainly relied on field surveys conducted by professionals, a process, which is often time-consuming, laborious, and costly, and is carried out by trained technicians using professional measuring tools. In view of this, in recent years, numerous scholars have begun to explore the application of unmanned aerial vehicle (UAV)-based oblique photography technology in the field of collecting building attributes [4].
In the process of using UAV-based oblique photography technology, the rich texture information and spatial structural features in derived data significantly enhance the universality and accuracy of building attribute extraction[5]. A widely adopted technical method is to perform contour recognition analysis on the constructed three-dimensional (3D) models. This method focuses on identifying and defining the contour set of buildings based on geometric attributes of their contours, such as their area, size, and shape characteristics. However, this technology has an inherent limitation, namely that its effectiveness highly depends on manually set threshold parameters, and it is difficult to achieve effective contour extraction when facing buildings with incomplete contours. At the same time, because of the inherent complexity of buildings' structural types, it is difficult to accurately determine the structural type of a building solely on the basis of the external features of the UAV imagery.
Given the aforementioned issues, this paper uses MaskRCNN to perform transfer learning on existing large models and train a deep learning model that is more suitable for identifying building contours in research areas. This deep learning model is utilized to infer building contours from DOMs (digital orthophoto maps) at different resolutions, thereby deriving information on the building area. Additionally, a method for identifying buildings' structure types based on machine learning is proposed.
Utilizing 82,856 buildings in the Shenyang and Dalian regions in China as training data, four different kinds of machine learning algorithms, namely Random Forest, XGBoost, AdaBoost, and multilayer perceptron (MLP) neural networks, were selected for model training and parameter tuning to find the optimal parameter combination for the model's performance. Then the models are compared according to different evaluation metrics to select the optimal model for identifying structural types in the research area. This provides an efficient and low-cost method for automatic identification of structural types, which is far more modern than traditional ways in regional earthquake disaster evaluations.
-
With the advancement of UAV technology, multicamera UAV-based oblique photography technology has undergone significant development[6]. This technology captures buildings from multiple angles and, combined with image matching algorithms, can generate three-dimensional point cloud data or texture mesh models of buildings[7], which greatly promotes the application and development of low-altitude remote sensing data in the field of building attribute extraction[8]. Regional 3D models generated using UAV-based oblique photography technology have demonstrated extensive application value in various visualization applications, such as post-earthquake emergency rescue planning[9], roof damage assessment[10], and managing building land registration[11]. These 3D models can present detailed textural features and geographic information locations of the scene, providing reliable data support for the building attributes required for earthquake damage simulations[12].
In this part of the study, the campus of Dalian University of Technology (Dataset 1) and Wencui Xuan community (Dataset 2) in Dalian, China, were selected as examples. An autonomous takeoff and landing UAV equipped with a nine-lens oblique photography system, as shown in Fig. 1, was used to construct regional structural 3D models meeting high-precision requirements, then we utilized Context Capture 3D modeling software to perform aerial triangulation as a key method for data processing. Furthermore, we developed a standardized 3D modeling process consisting of six steps, as detailed in Fig. 2.
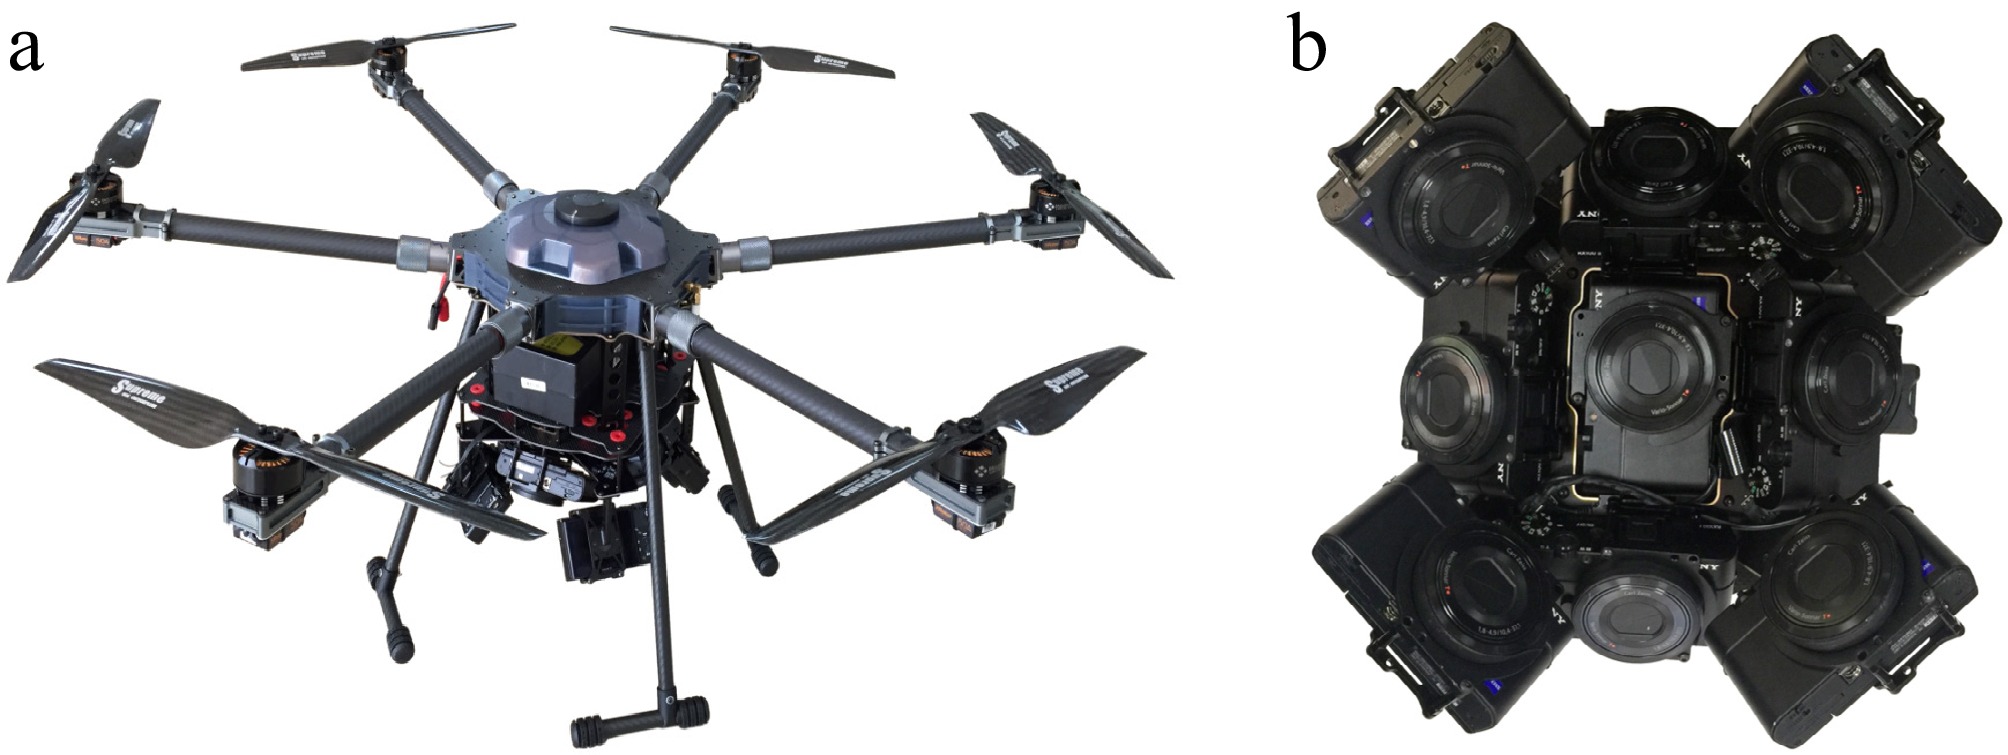
Figure 1.
(a) The six-rotor UAV. (b) The nine-camera oblique photography system.
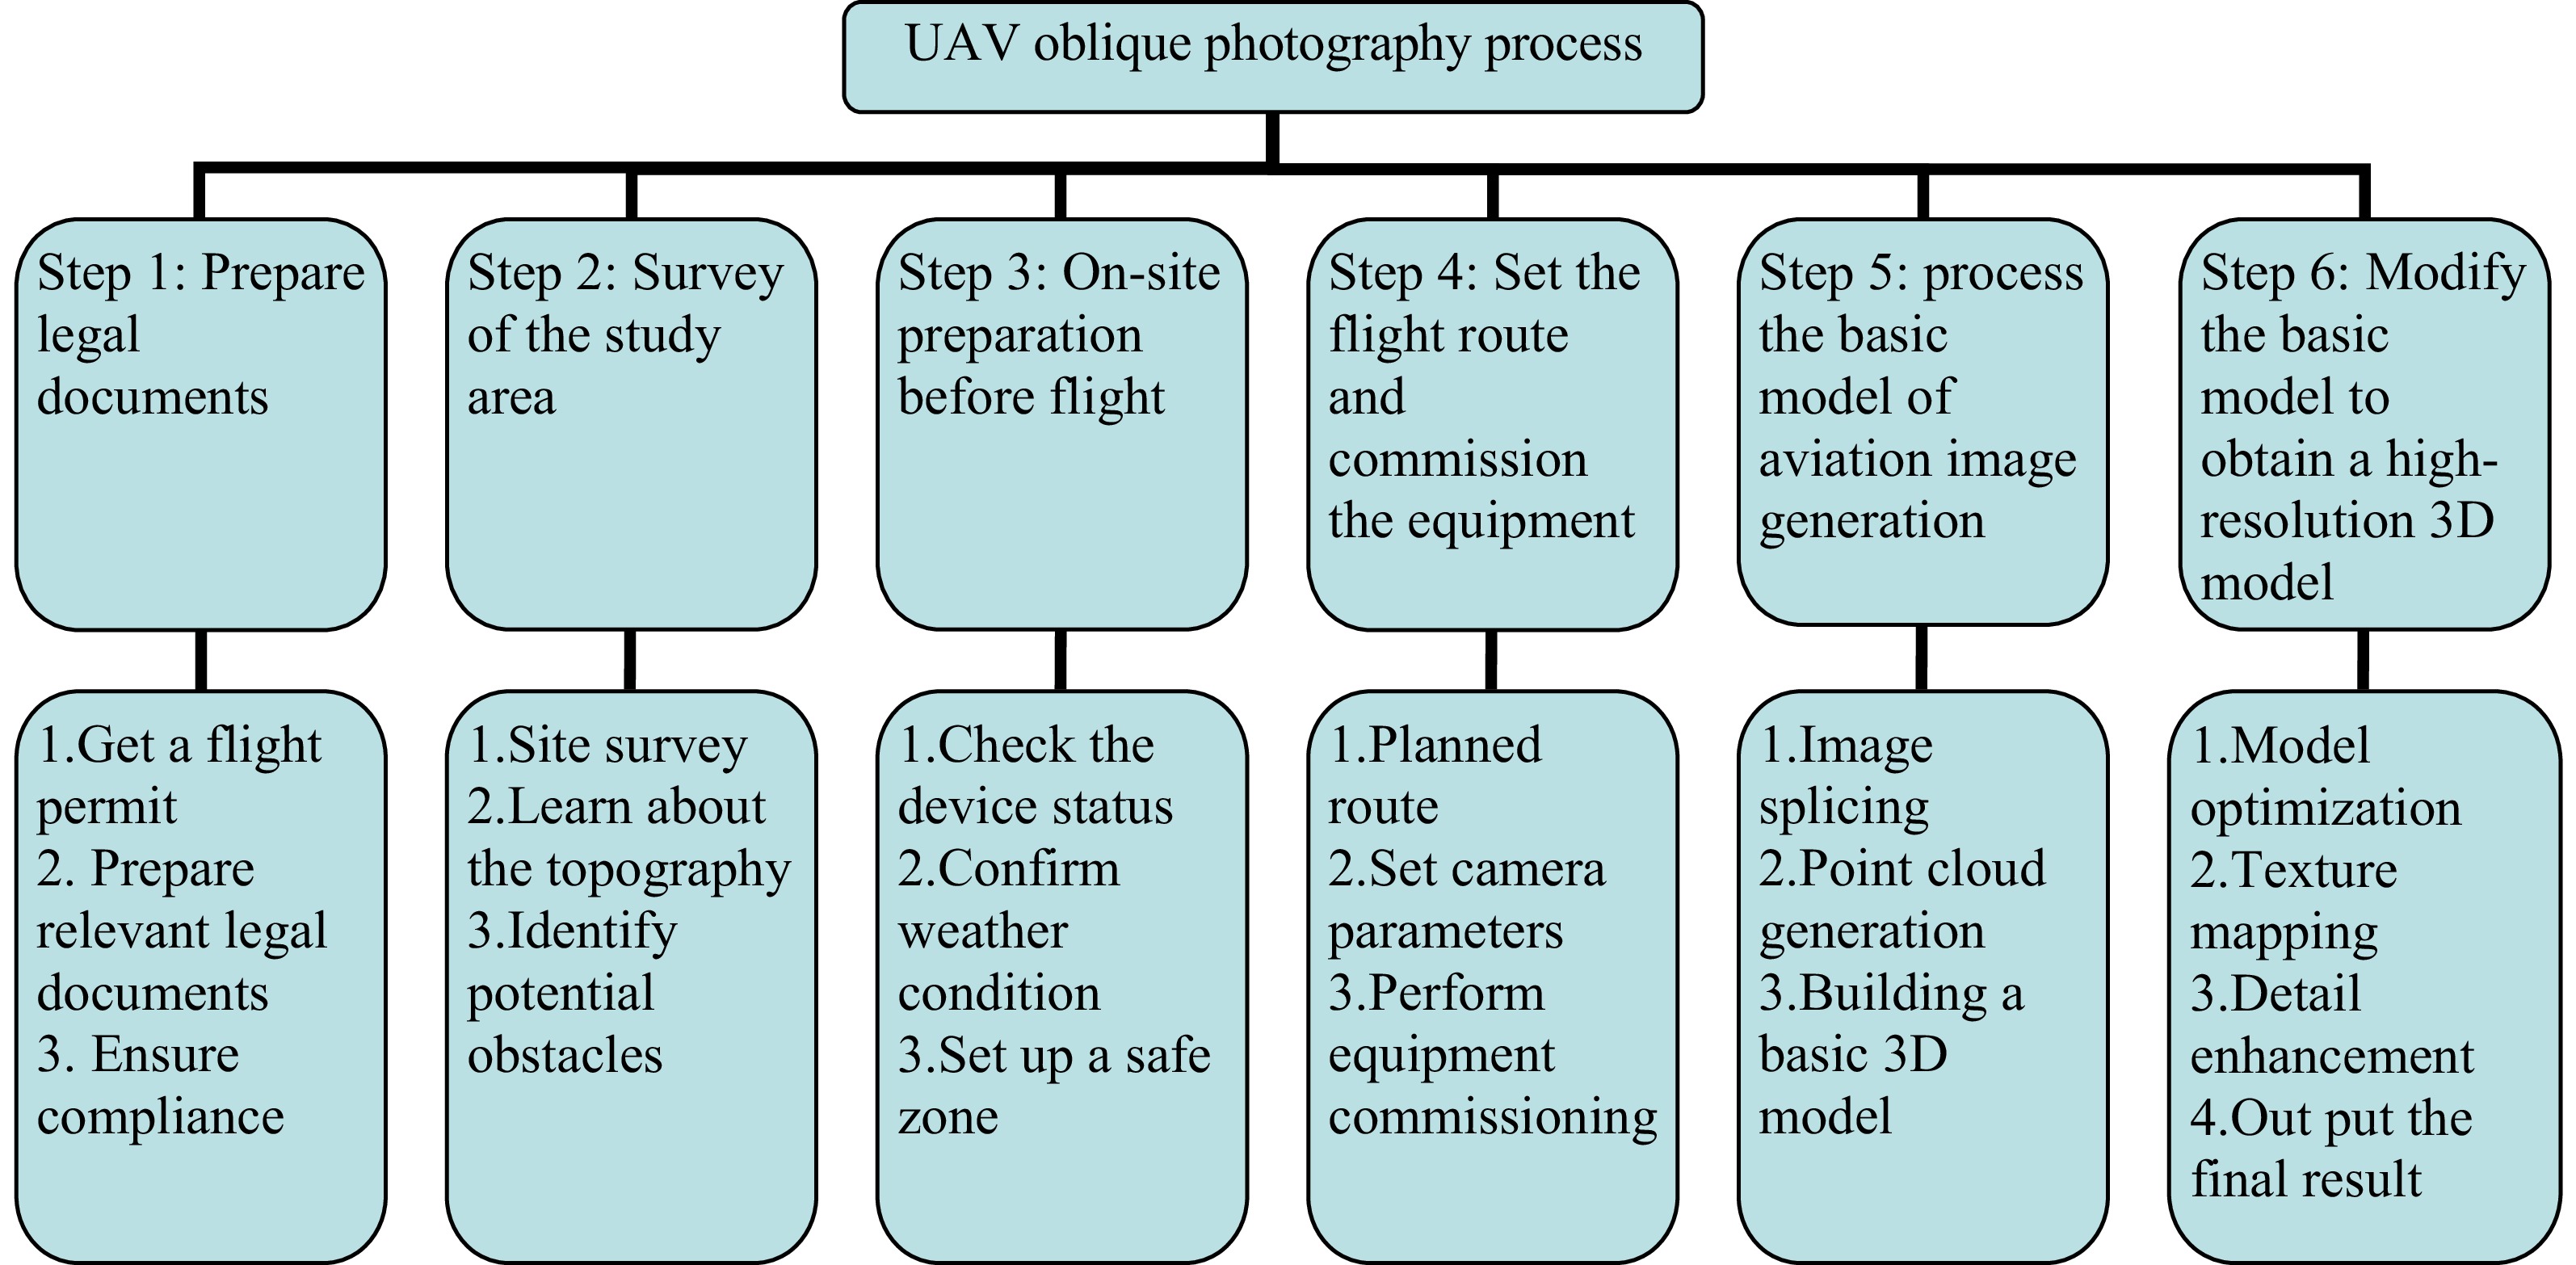
Figure 2.
The 3D modeling process using UAV-based oblique photography.
After following the six steps outlined in Fig. 2, a high-resolution and high-fidelity 3D texture model was ultimately created, as illustrated in Fig. 3. This experiment spanned a week, involving a total of four flight missions. The cumulative flight distance reached 21.89 km, the total flight duration was 80 min, and 20,000 photos were captured in total. Subsequently, through cluster computing and collaborative work between two computers, construction of the 3D model was completed over a period of 72 h. Table 1, which analyzes the accuracy of the model, demonstrates that its average errors in both the horizontal and vertical directions meet the 0.2-m error standard stipulated in the Technical Specifications for Urban 3D Modeling[13]. This indicates that the adopted workflow is appropriate and that following this process can produce high-fidelity, high-resolution 3D texture models.
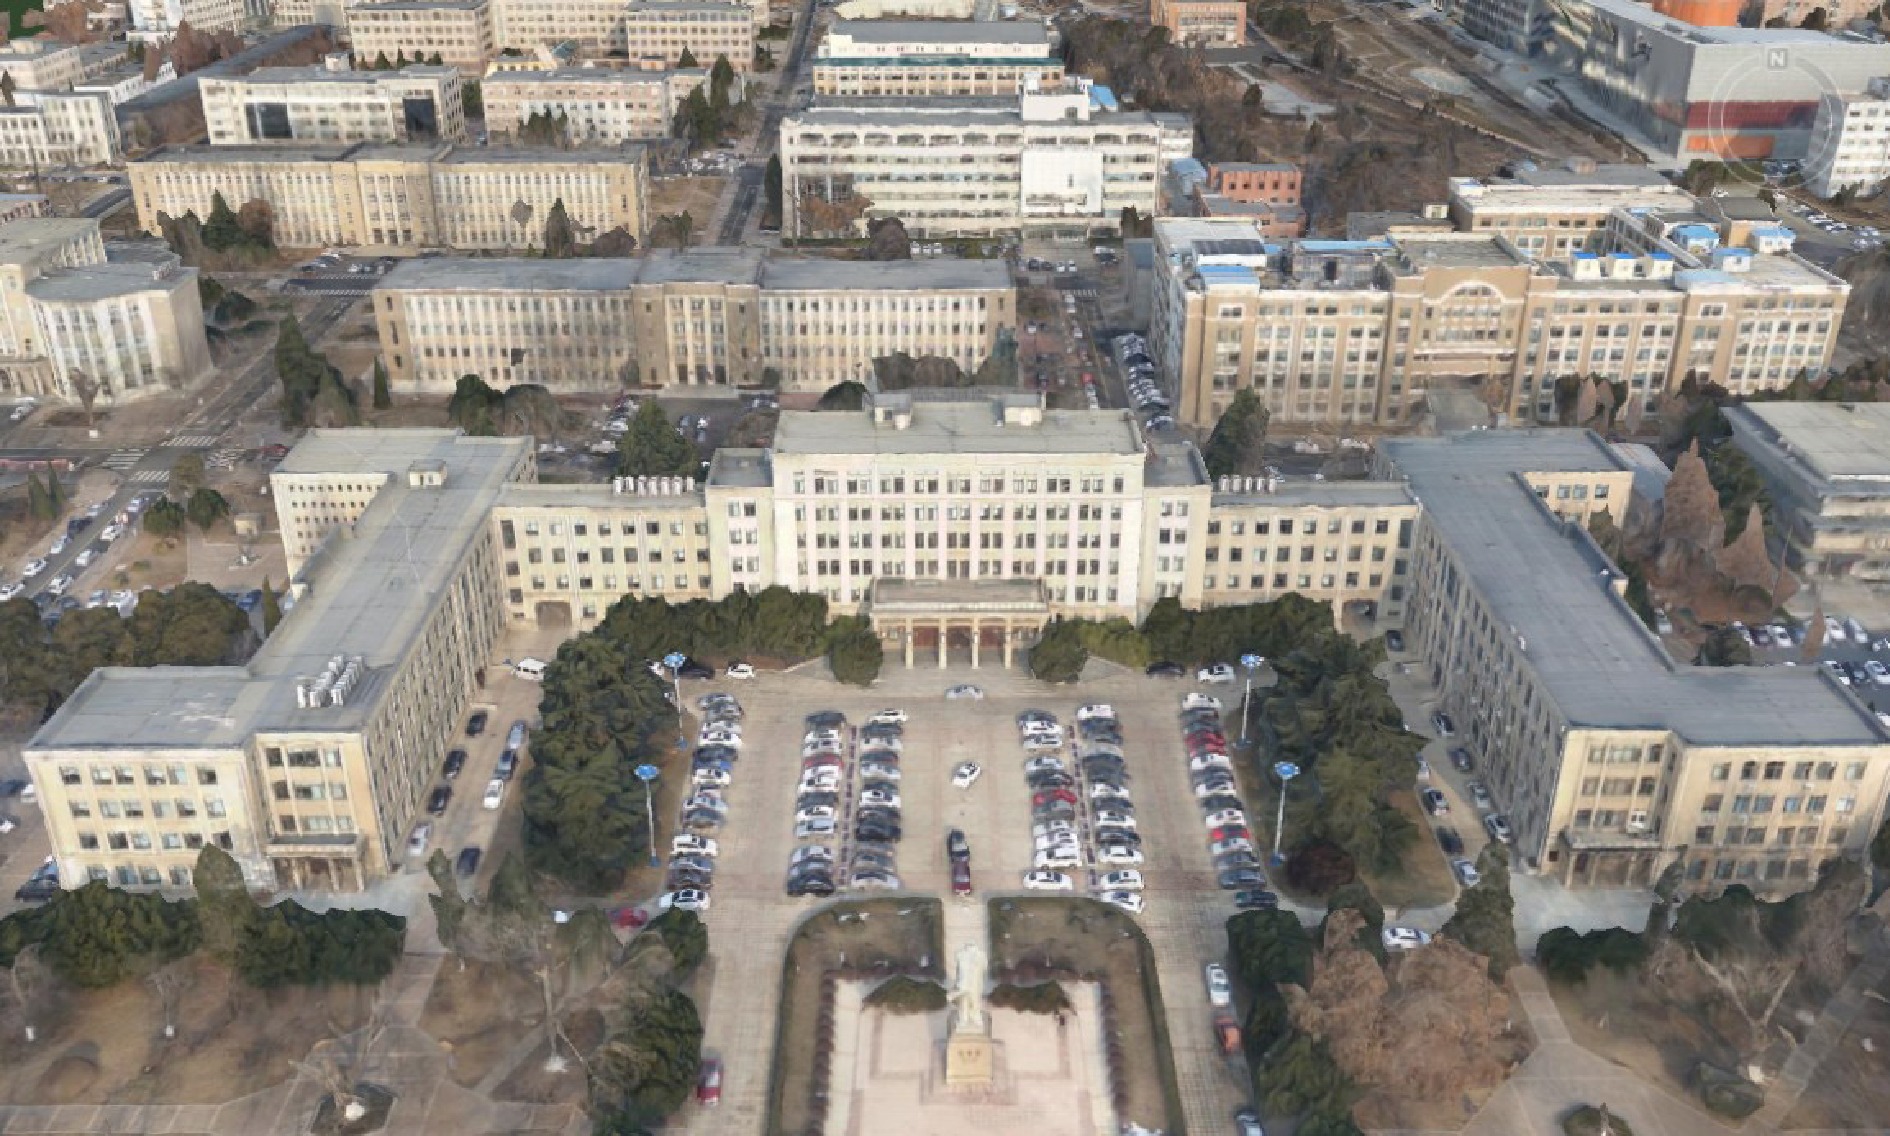
Figure 3.
A 3D texture model of the campus of Dalian University of Technology.
Table 1. Accuracy analysis results of the 3D model.
Horizontal Vertical Minimum error (m) 0.06 0.03 Maximum error (m) 0.31 0.23 Root mean square error 0.07 0.10 Mean error (m) 0.17 0.14 Extracting building contours and areas from UAV-based oblique photography images
-
Extracting building contours from DOMs is a time-consuming task, typically achieved through manual annotation of features. Deep learning models possess powerful image learning capabilities, allowing the automatic extraction of buildings' contours, thereby significantly reducing the time and effort required. This paper utilizes a publicly available pretrained deep learning model (Building Footprint Extraction–USA) from Esri to extract building contours from DOMs, which can be viewed and accessed in the ArcGIS Living Atlas of the World. This model uses the MaskRCNN algorithm and is implemented using the ArcGIS API for Python. The recommended resolution for the DOMs is 10−50 cm.
Based on the 3D model of the campus of Dalian University of Technology, established via 3D structural model sections, a DOM with a resolution of 0.3 m was obtained from the 3D model by Super Map. Drawing on the definitions of true positive (TP), false positive (FP), and false negative (FN) given by Lee et al.[14], we undertook an object-based quantitative evaluation using completeness (Cm = TP/(FN+TP)), correctness (Cr = TP/(TP + FP)), and quality (QI = TP/(TP + FP + FN)), as listed in Table 2. It can be seen that in Dataset 1, there are 28 misidentified buildings and 19 missed buildings, with a recognition quality of 77.62%. Dataset 2 has seven misidentified buildings and six missed buildings, with a recognition quality of 86.02%. The average recognition quality for buildings in the two datasets is 81.82%, which indicates that the model's recognition rate for building contours in the study area is not high enough to support subsequent contour analysis and extraction of the building area.
Table 2. Quantitative results of object-based evaluation.
Dataset TP FP FN Cm(%) Cr(%) QI(%) Dataset 1 163 28 19 89.56 85.34 77.62 Dataset 2 80 7 6 93.02 91.95 86.02 Mean − − − 91.29 88.65 81.82 Note that the training samples of this model are buildings from the US, and thus the model is only trained on images from the US, so it is expected to perform well in the US too. The performance of a deep learning model is limited by the characteristics, properties, and scope of its training data, so when applied to images of other any study area, high-quality results cannot be expected, as factors such as landscape characteristics and architectural styles (like the differences in roof materials) in the area will affect its performance.
To obtain the best inference results, the ideal approach is to ensure that the characteristics and scope of the training data closely match those of the study area. We took this model as a pretrained model and optimized it through transfer learning and using new training data; this process involved adjusting the model to suit the specific needs of the study area, thereby improving the accuracy of extraction.
To make this target be true, nearly 10,000 buildings in Ganjingzi District and Zhongshan District in Dalian, China, were used as training samples for annotation by marking the building outlines on the high-definition satellite map and labeling the buildings as positive samples. Figures 4 and 5 show the annotated samples. Since the validation loss tends to stabilize after the model has been trained for 20 epochs by using parameters shown in Table 3, considering the long training time per epoch, the maximum iteration count was set to 20 to reduce the time cost of training. The validation percentage was set to 10%, meaning that the training data were divided into 90% training data and 10% validation data. The image patch size was set to 512, which is the same as the pretrained model's training data. The learning rate was set to the default value, and ArcGIS Pro automatically set the optimal learning rate according to the characteristics of the model and training data. The monitoring metric was set to validation loss. The training results of the model are shown in Fig. 6, indicating that the accuracy of the trained model is 91.56%.
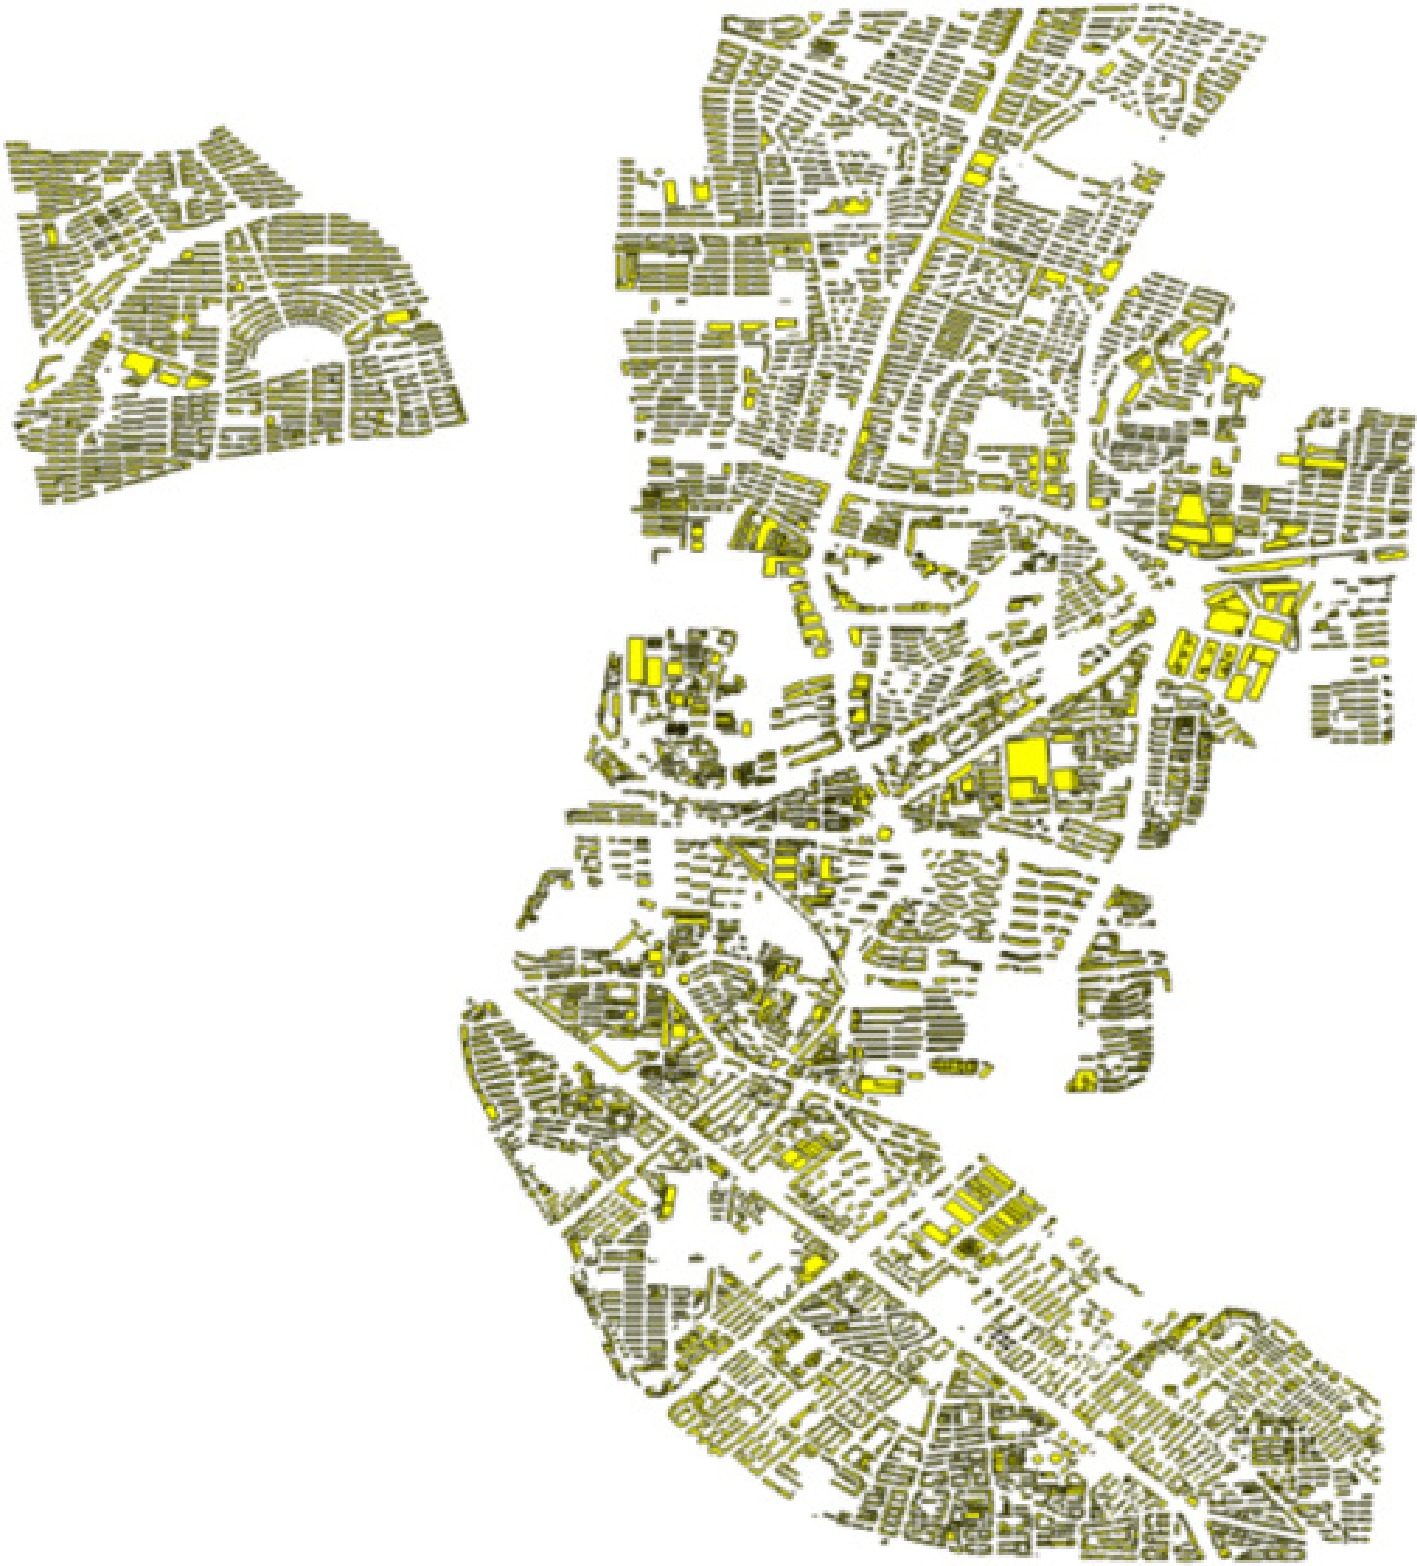
Figure 4.
Annotated sample data for Ganjingzi District.
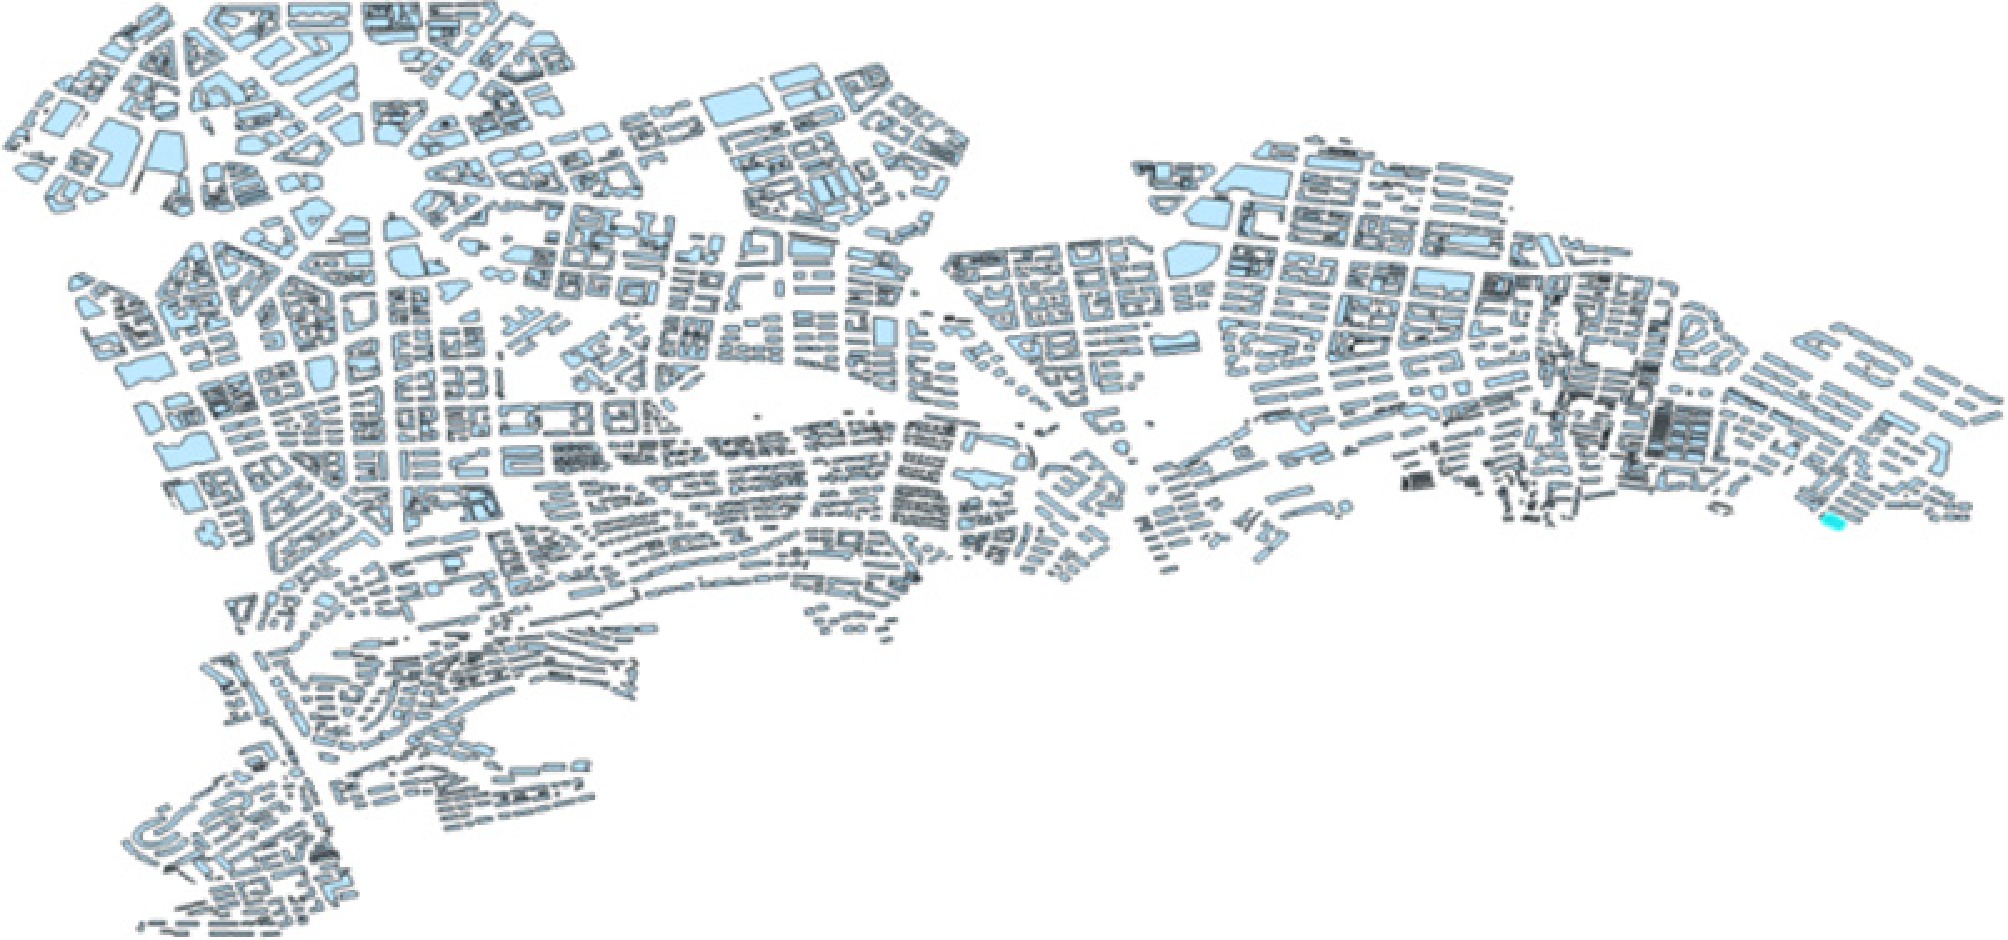
Figure 5.
Annotated sample data for Zhongshan District.
Table 3. Parameters used for model training.
Parameter Value Maximum iteration count 20 Validation percentage 10 Image film size 512 Learning rate − Monitoring metrics Loss validation 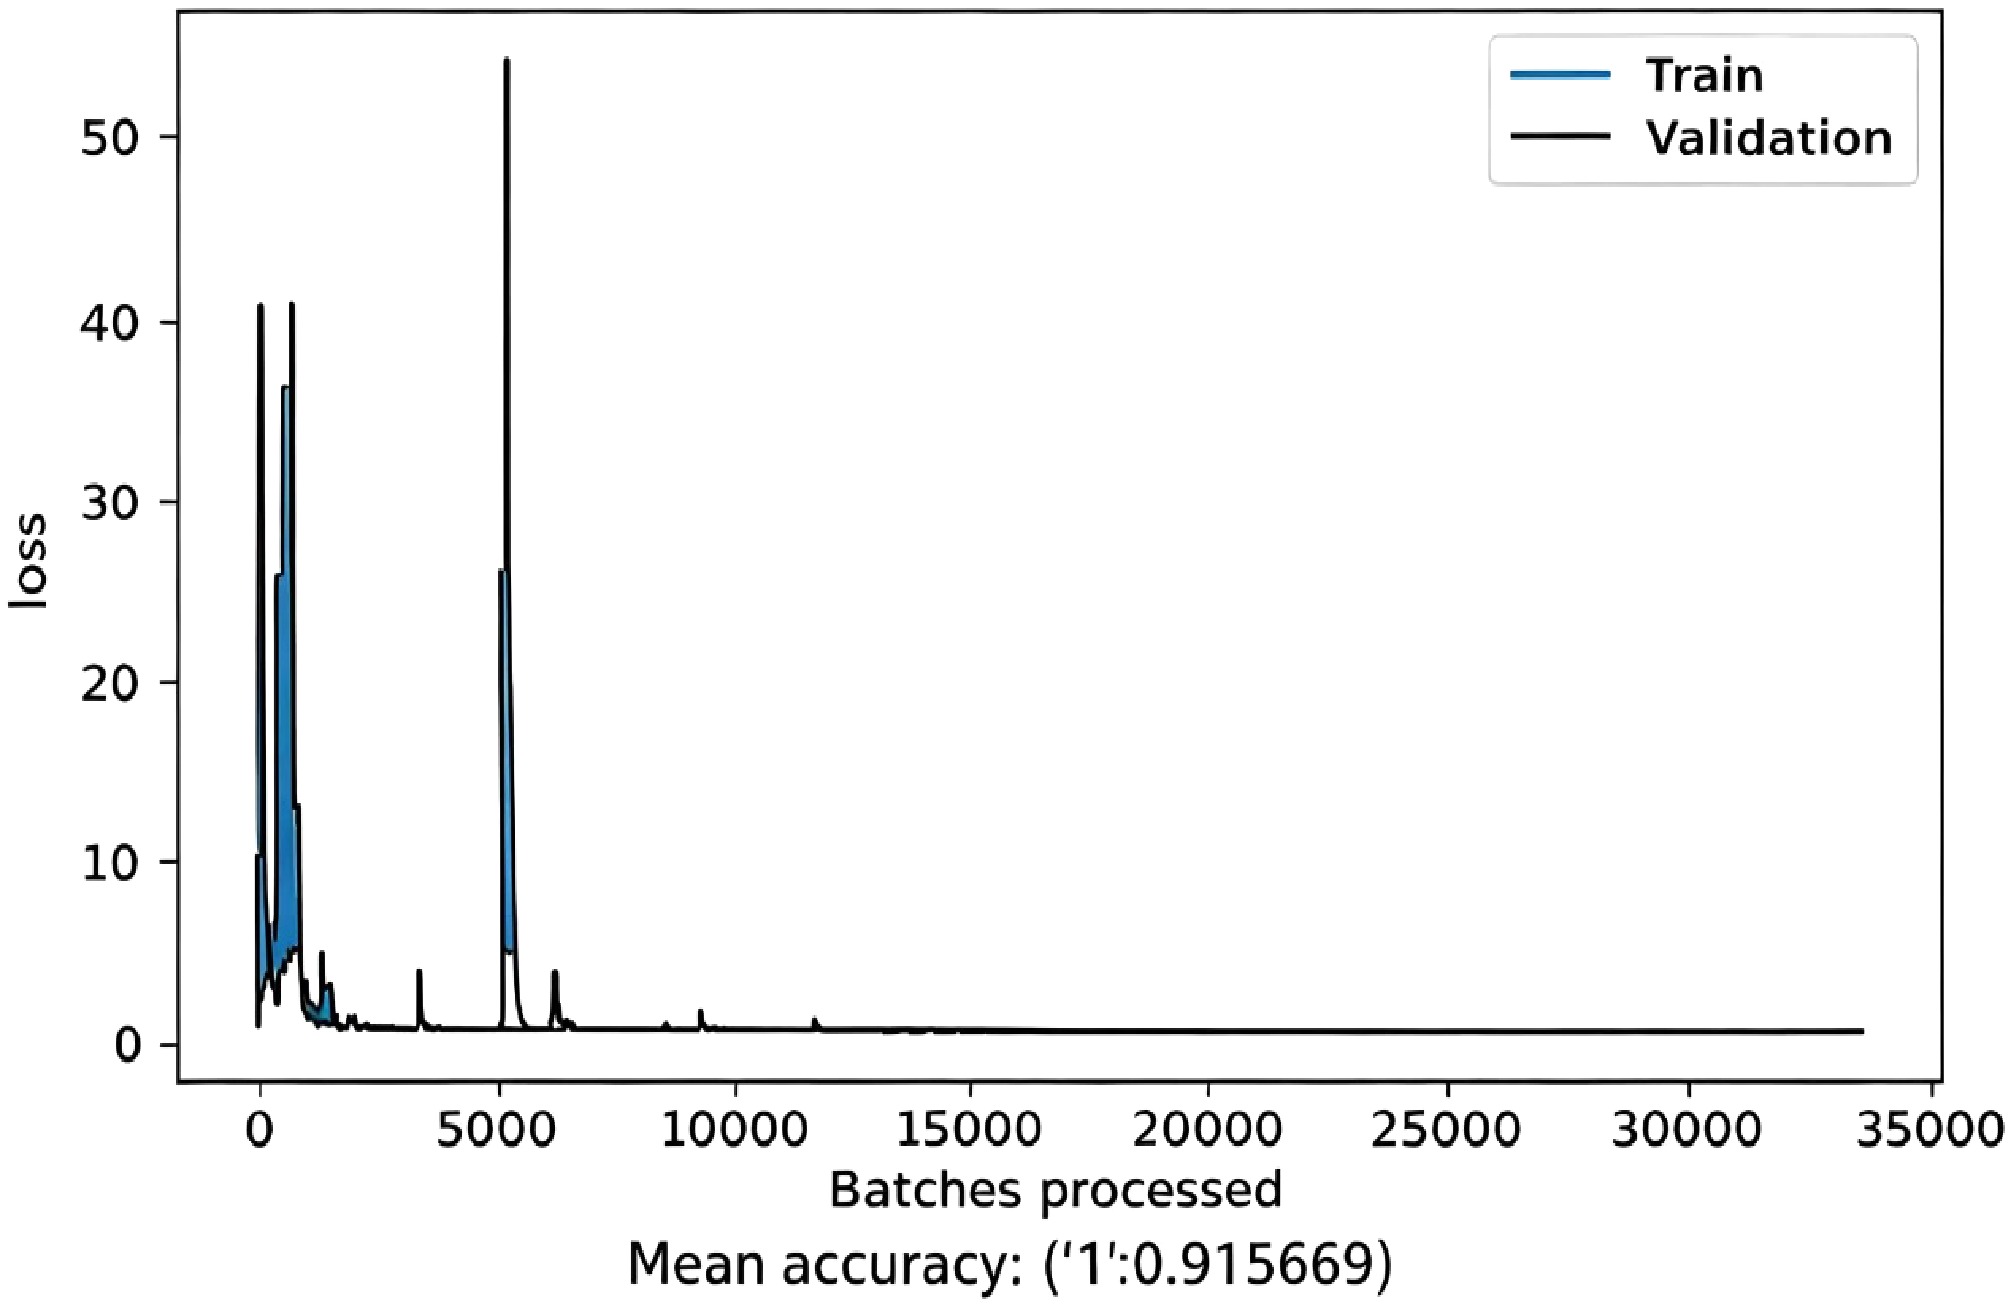
Figure 6.
Model training results.
The building contours were extracted using the trained model, and the quantitative results based on object evaluation are presented in Table 4, which indicates that the Cm, Cr, and QI of both Dataset 1 and Dataset 2 have reached over 90%. Specifically, the number of misidentified buildings in Dataset 1 has been reduced to 6, and the number of missed identifications has been reduced to 10; in Dataset 2, the number of misidentified and missed identifications have both been reduced to 1. Evidently, the new model, which underwent transfer learning by incorporating new training data, significantly enhances the extraction effect of building footprint contours in the study area.
Table 4. Quantitative results of object-based evaluation.
Dataset TP FP FN Cm (%) Cr (%) QI (%) Dataset 1 172 6 10 94.51 96.63 91.40 Dataset 2 85 1 1 98.84 98.84 97.70 Mean − − − 96.68 97.74 94.60 In light of this, we tried and conducted a series of postprocessing steps to reduce the number of unrecognized buildings in Dataset 1 to single digits. Considering the integration of different output layers to enhance the completeness of recognition in Dataset 1, different output layers were derived by setting different slice sizes (512, 256, and 512 for orthophotographs with varying resolutions of 0.3, 0.3, and 0.2 m, respectively) to generate three distinct output layers, which were then merged and fused. Subsequently, an object-based evaluation was conducted on the merged and fused output results, and the quantitative evaluation results are presented in Table 5.
Table 5. Quantitative results of object-based evaluation.
Dataset TP FP FN Cm (%) Cr (%) QI (%) Dataset 1 180 10 2 98.90 94.74 93.75 Dataset 2 85 1 1 98.84 98.84 97.70 Mean − − − 98.87 96.79 95.73 As can be seen from Table 5, after the merger and integration, the number of buildings missed in Dataset 1 decreased from 10 to 2, but the number of buildings misidentified increased from 6 to 10. Upon analysis, it was found that most of the elements misidentified as buildings were small features. To know the reasons exactly, we did field investigations which revealed that these small features were the outlines of piled construction waste, small temporary garages, small machine rooms, and pedestals of statues in the square. All of these small features can be eliminated by setting an area threshold like 50 m2, as shown in Figs 6−8; the quantitative results are presented in Table 6.
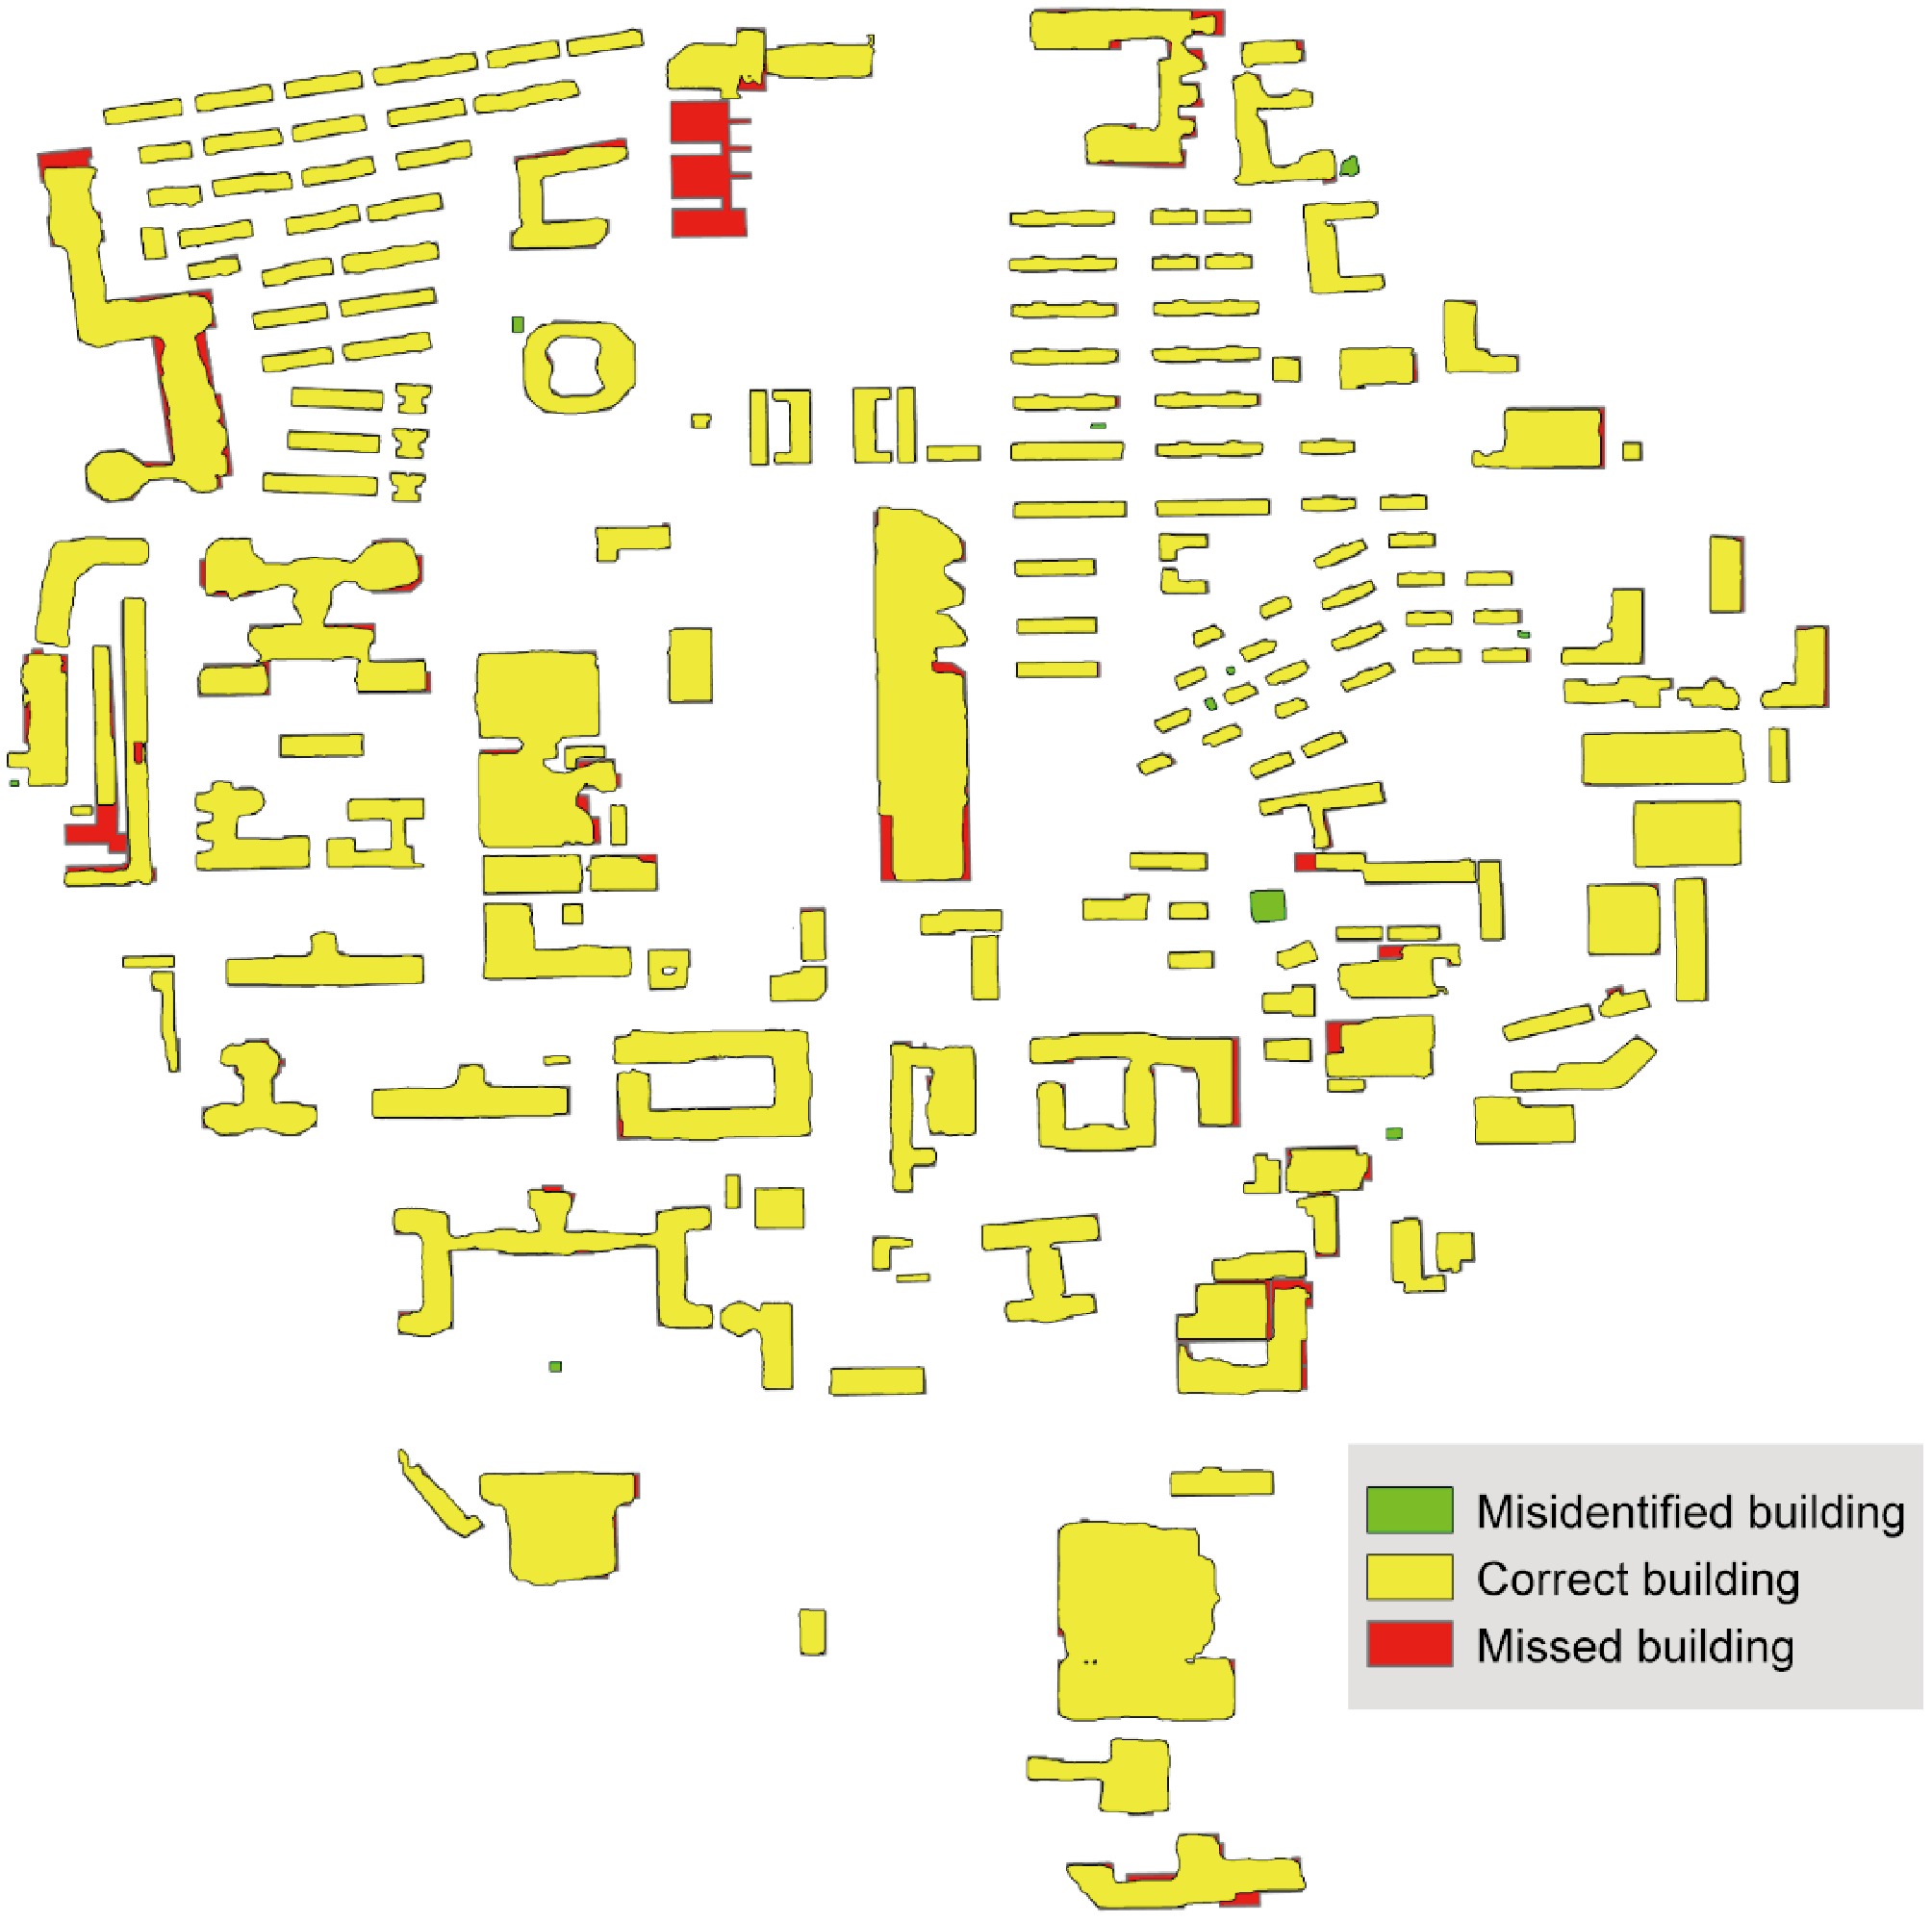
Figure 7.
Output results of Dataset 1 after post-processing.
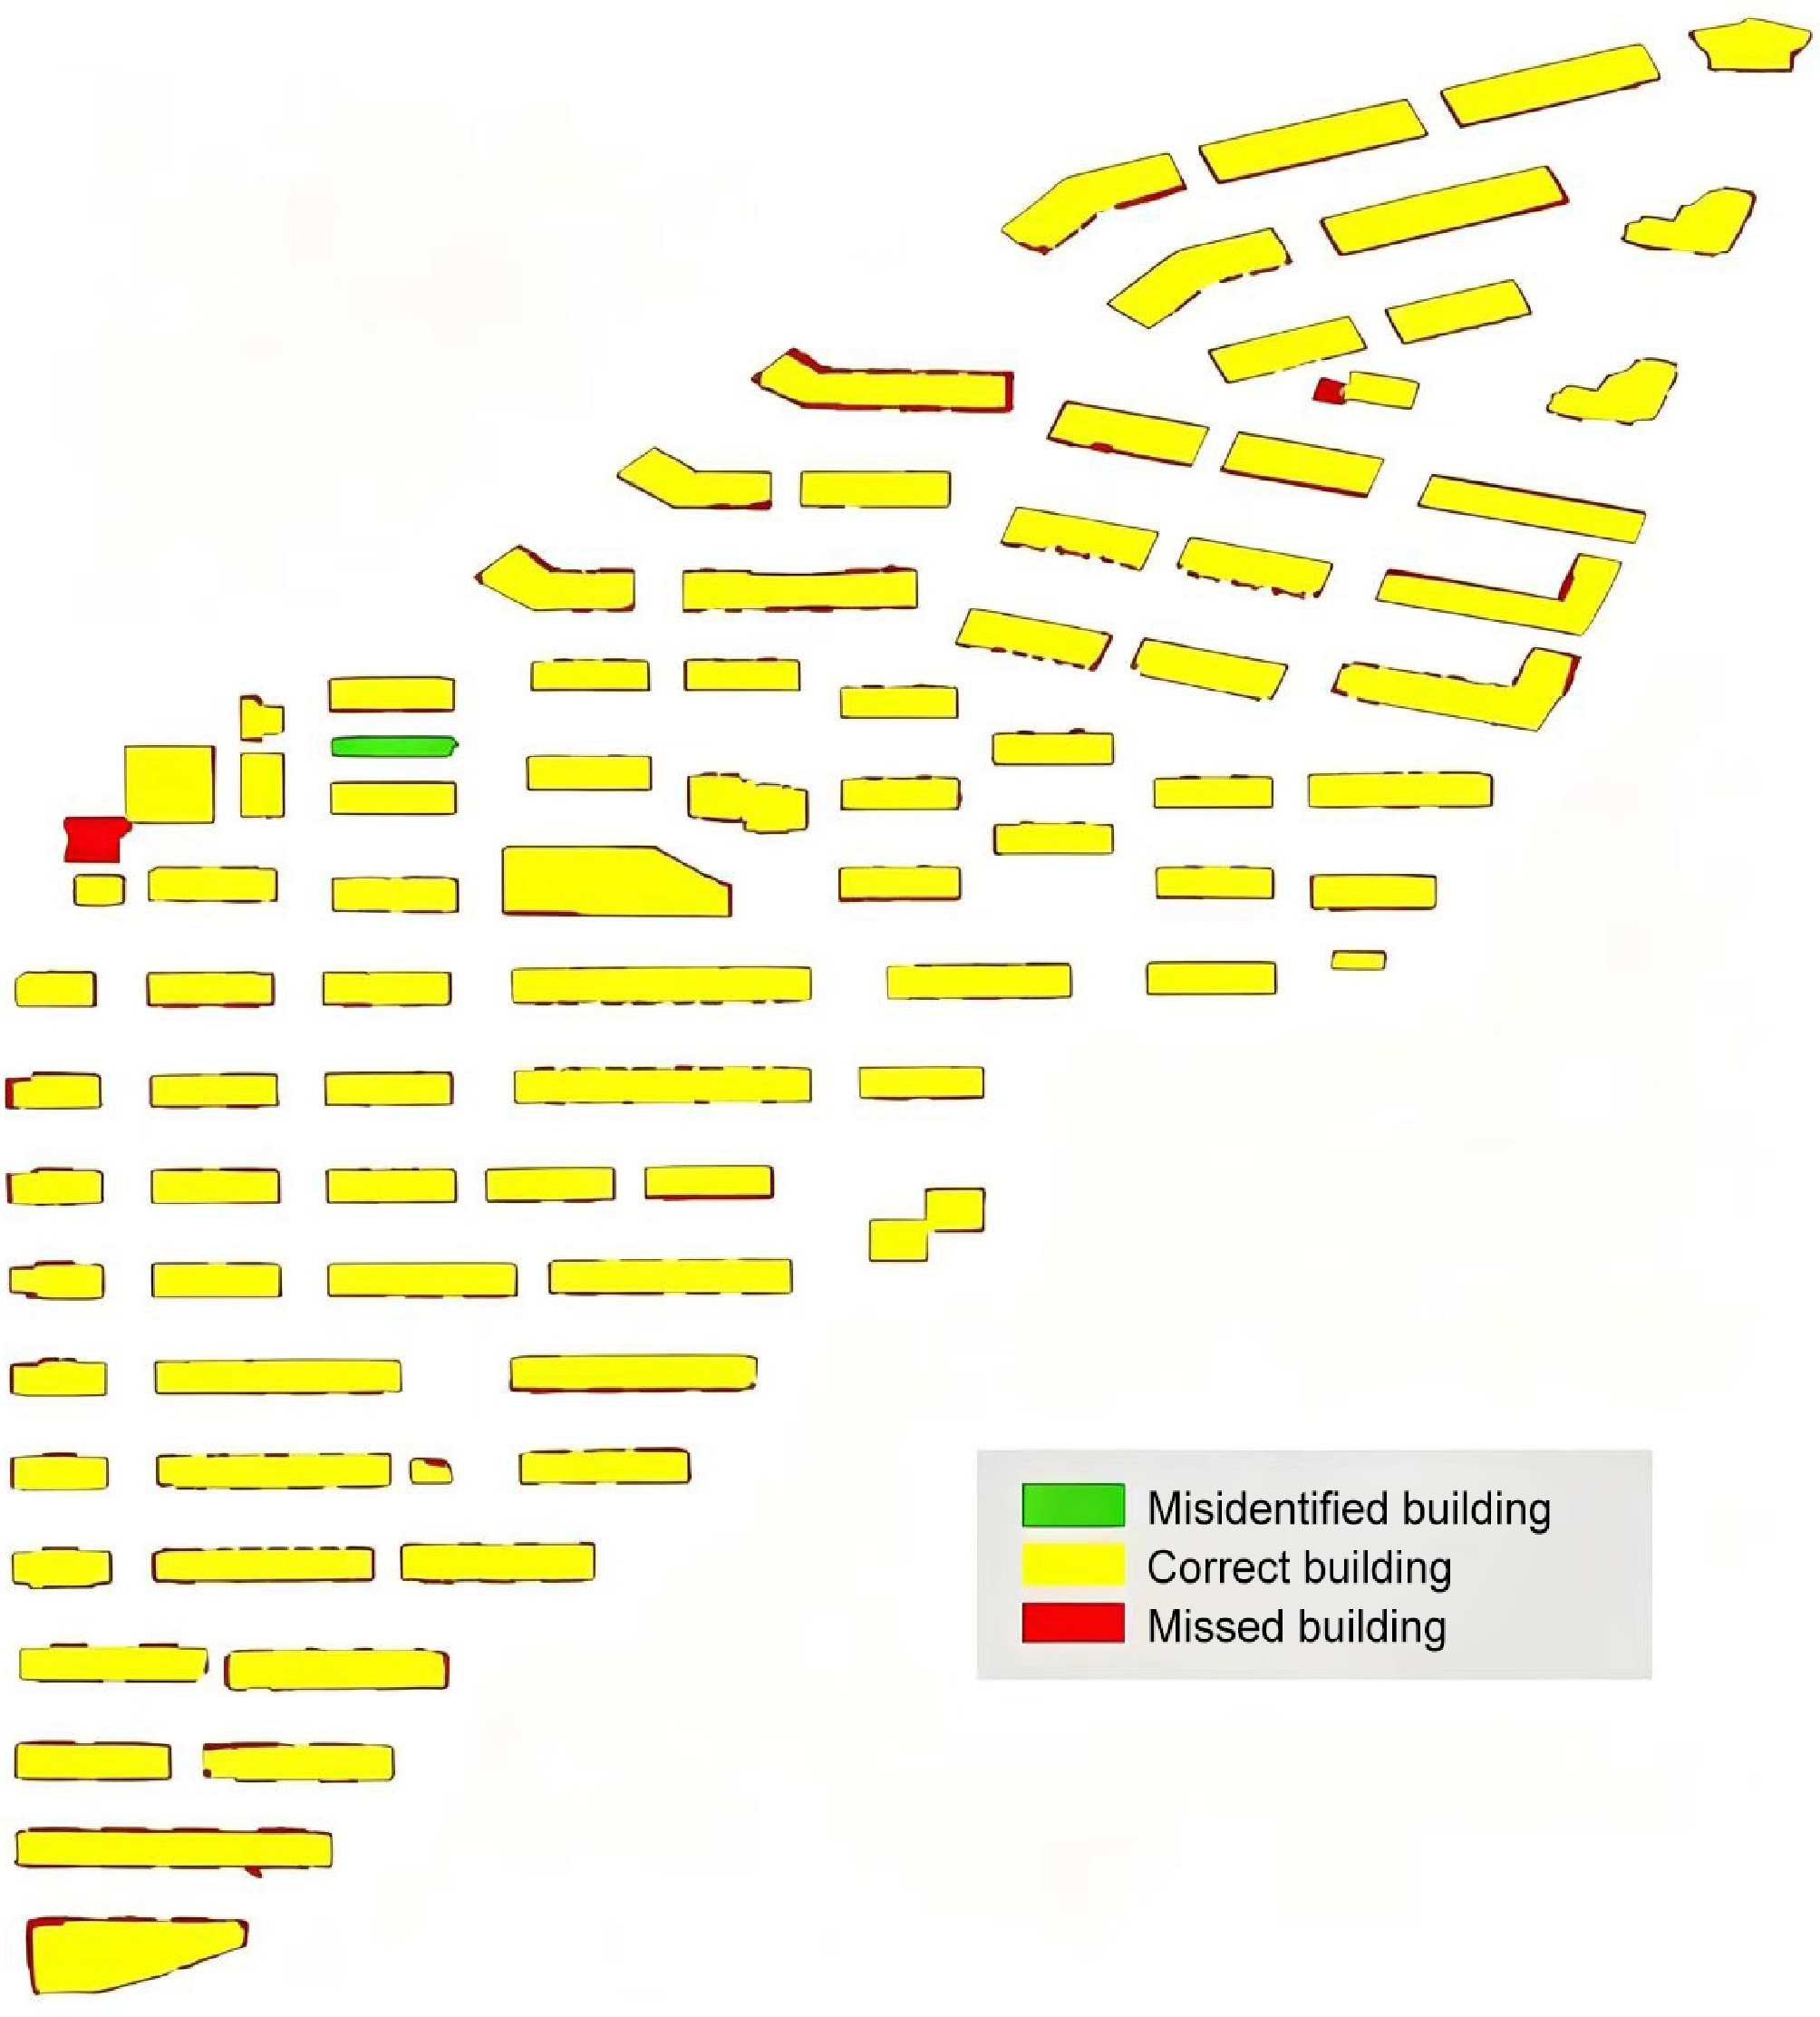
Figure 8.
Extraction results of building footprint contours from Dataset 2.
Table 6. Quantitative results of object-based evaluation.
Dataset TP FP FN Cm (%) Cr (%) QI (%) Dataset 1 180 4 2 98.90 97.83 96.77 Dataset 2 85 1 1 98.84 98.84 97.70 Mean − − − 98.87 98.34 97.24 As can be seen from Table 6, after removing features with an area less than 50 m2, the number of misidentified buildings in Dataset 1 decreased from 10 to 4. Furthermore, the completeness, correctness, and quality of building footprint recognition in both Dataset 1 and Dataset 2 are all above 95%. This indicates that the initial model, after undergoing transfer learning and a series of post-processing steps, exhibits high recognition rate and accuracy for building footprints across different Datasets. This recognition result can be utilized for subsequent extraction of building area information. Finally, the geographical coordinate system (WGS 1984) of the extracted building footprint vector map is projected and converted to a projected coordinate system (WGS 1984 UTM Zone 51N), thereby obtaining the building's footprint area information with projected coordinate system. A library (Building 1), a square-shaped building (Building 2), two student dormitory buildings (Building 3 and Building 4), and a circular laboratory building (Building 5) from Dataset 1 are selected as typical examples for analysis. Table 7 presents the error analysis results of building area information extracted using the method described above.
Table 7. Analysis results of relative error of extracted building area information.
Building ID Reference
value (m2)Estimated
value (m2)Relative
error (%)Average relative
error (%)Building 1 4,580.15 4,722.87 3.12 3.7 Building 2 6,105.44 6,297.73 3.15 Building 3 896.79 837.81 6.58 Building 4 1,023.57 1,076.19 5.14 Building 5 2,260.04 2,225.97 1.51 Dataset 1 − − − 5.76 Dataset 2 − − − 2.83 From the Table 7, it can be seen that the maximum relative error for the five typical buildings remains below 7%, and the average relative error for all datasets is below 6%. This result not only verifies that the accuracy of our method for extracting building area is acceptable, but also demonstrates the method's good applicability and stability across different datasets.
-
The objective of this part is to utilize other related building attribute data to identify structural types, classified into masonry, frames, steel structures, etc. The total number of types is usually limited, so in machine learning, the prediction of structural types is treated as a multiclass classification problem. Sklearn integrates many existing machine learning models, which users can directly call and freely use. Therefore, this study chose Sklearn as the implementation platform, and all models were trained using supervised learning methods as shown in Fig. 9.
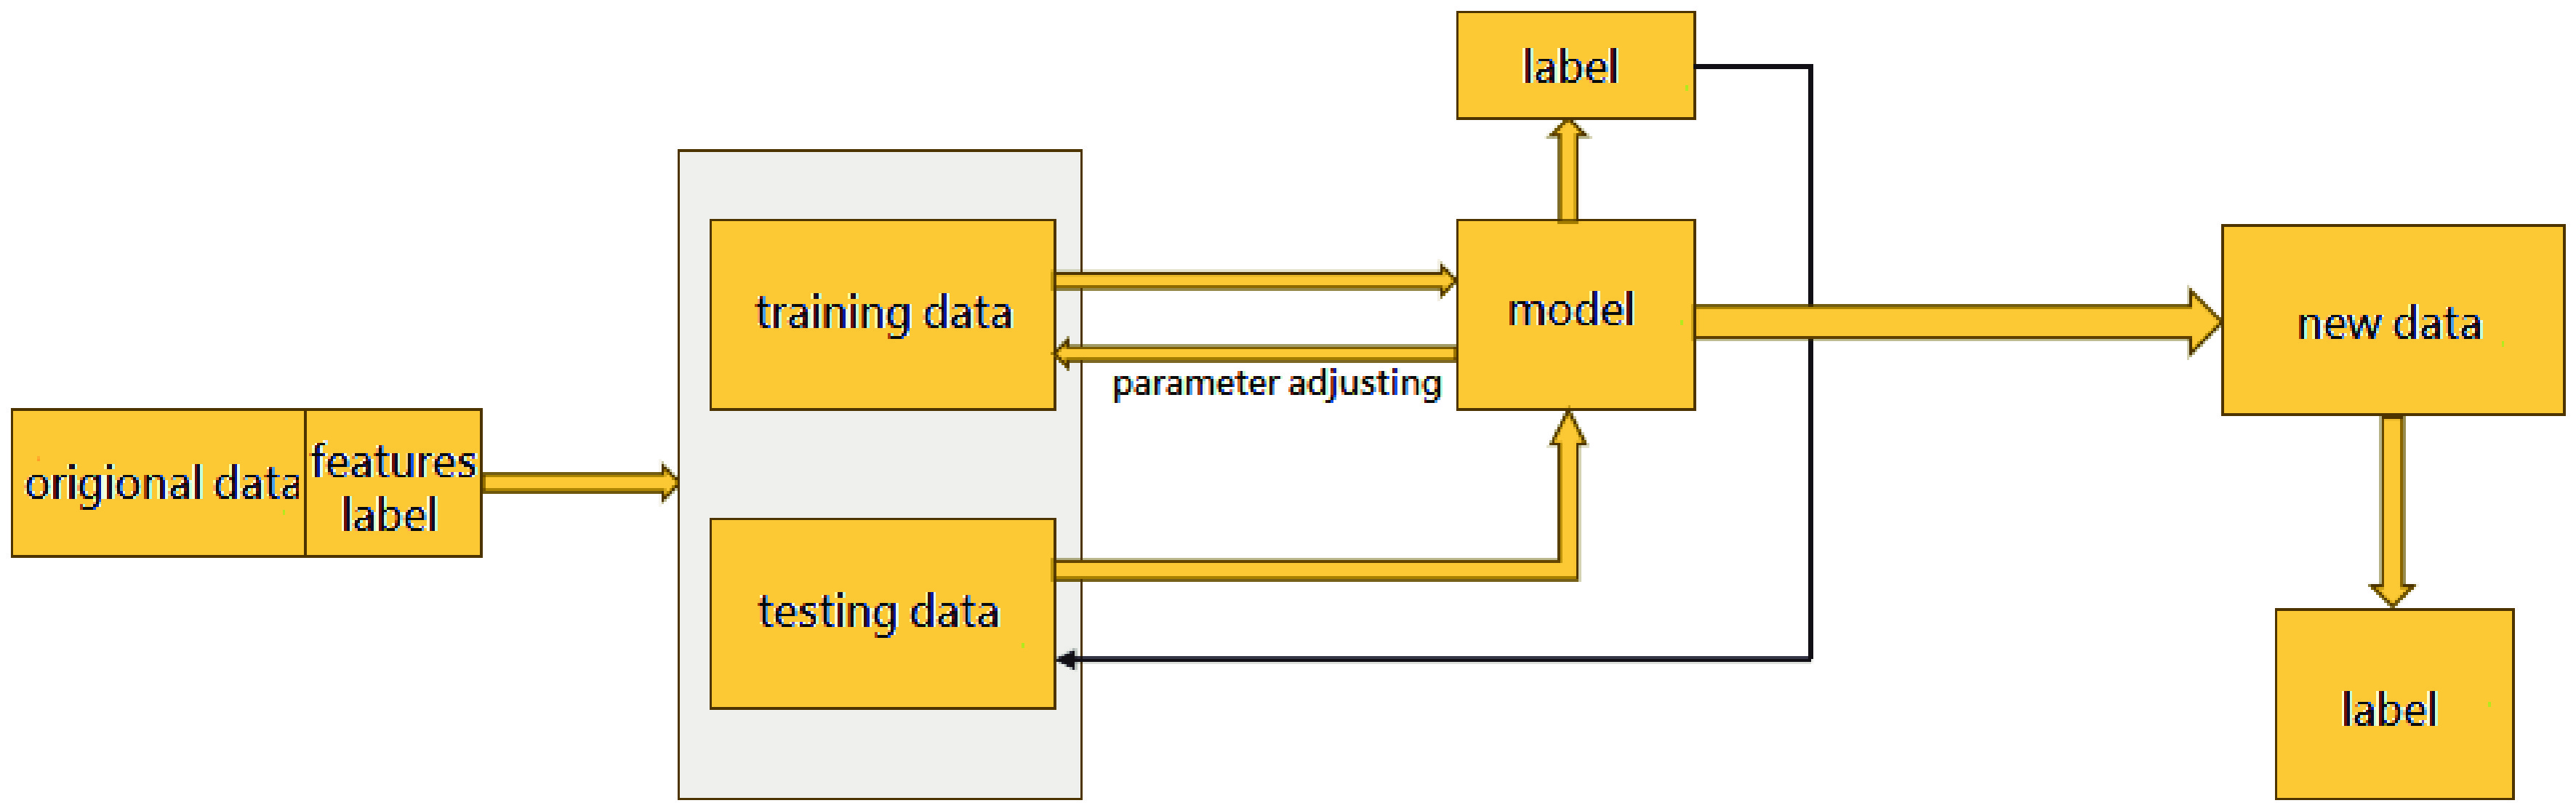
Figure 9.
Supervised learning process.
First, the data are preprocessed, the features and labels of the data are selected, and the original data are divided into training data and the testing set. The features in this study are the age, area, height, and number of floors of the building, and the label is the structural type. Then the model is trained using the training data and used to predict the test data. The predicted labels of the test data are compared with the true labels to obtain the model's performance. Depending on the characteristics of different models and the status of the data, parameters are adjusted to optimize the mode performance, and the model is trained again until the best performance is achieved to obtain the final model. Finally, the final model is used to predict the labels of the features of new data.
Random Forest
-
We utilized the highly representative Random Forest for machine learning as the bagging algorithm, and took 82,856 buildings in Shenyang and Dalian as the source data, with 70% as the training set and 30% as the test set. Initially, the number of estimators was set to 100, and all other parameters were set to their default values for model training. The accuracy of the model after the initial training is shown in Table 8.
Table 8. Initial training accuracy.
Evaluation metric Precision (%) Overall accuracy 98.56 Recall rate of single-story bungalows 100.00 Recall rate of masonry structures 99.14 Recall rate of frame structures 83.57 From the results in Table 8, it can be seen that the model has good recognition ability for masonry structures and single-story bungalows, but relatively poor recognition ability for frame structures. The overall accuracy rate reached 98.56%, indicating a strong correlation between the selected features and labels. Given these results, further adjustments to and selections of the model parameters were made. Because of the imbalance in the proportion of training data categories, masonry structures were about eight times the frame structures, causing the recognition accuracy of frame structures to be relatively low; such a case can be avoided effectively by adopting macro-recall because it does not consider the imbalance in the sample size but only takes arithmetic mean of the recall rate for each class. Therefore, using macro-recall as an evaluation metric, the parameters n_estimators, max_depth, min_samples_leaf, min_samples_split, and max_features were tuned sequentially by drawing learning curves. The adjusted model precision is shown in Table 9.
Table 9. Adjusted model precision.
Evaluation metric Precision (%) Overall accuracy 98.59 Recall rate of single-story bungalows 100.00 Recall rate of masonry structures 99.15 Recall rate of frame structures 84.12 By comparing Table 8 and Table 9, it can be seen that the overall accuracy has increased by 0.03% after adjustment, the recall rate for masonry structures has increased by 0.01%, and the recall rate for frame structures has increased by 0.55%. It is evident that when using macro-recall as the evaluation metric, the overall accuracy, the recall rate for masonry structures, and the recall rate for frame structures have all improved, with the recall rate for frame structures increasing significantly, which aligns with our adjustments' goals and expectations. Since this study aims to identify the structural types of buildings in UAV-surveyed areas, and the research areas are the campus of Dalian University of Technology and Wencuixuan community, which are relatively small-scale areas, a random sample of 150 buildings was selected 10 times for small-scale building group prediction and evaluation. The evaluation results are shown in Table 10.
Table 10. Prediction accuracy of structure types in small areas.
Evaluation metric Precision (%) Overall mean accuracy 99.13 Mean recall rate of single-story bungalows 100 Mean recall rate of masonry structures 99.18 Mean recall rate of frame structures 92.21 XGBoost
-
XGBoost is a major representative of the boosting algorithms in machine learning. After creating XGBoost[15], Tianqi Chen quickly gathered a group of enthusiasts who were passionate about machine learning to jointly develop an independent open-source algorithm library dedicated to calling XGBoost, i.e., the xgboost library. The XGBoost model is relatively complex and has numerous hyperparameters. The xgboost library provides us with a quick method for tuning parameters by calling the xgb.cv function. The mean area under the curve (AUC) of the training set and test set in xgb.cv is selected as the indicator to draw the learning curve, as shown in Fig. 10. The horizontal axis represents num_round, and the vertical axis represents the mean AUC. The yellow curve represents the test set, and the red curve represents the training set.
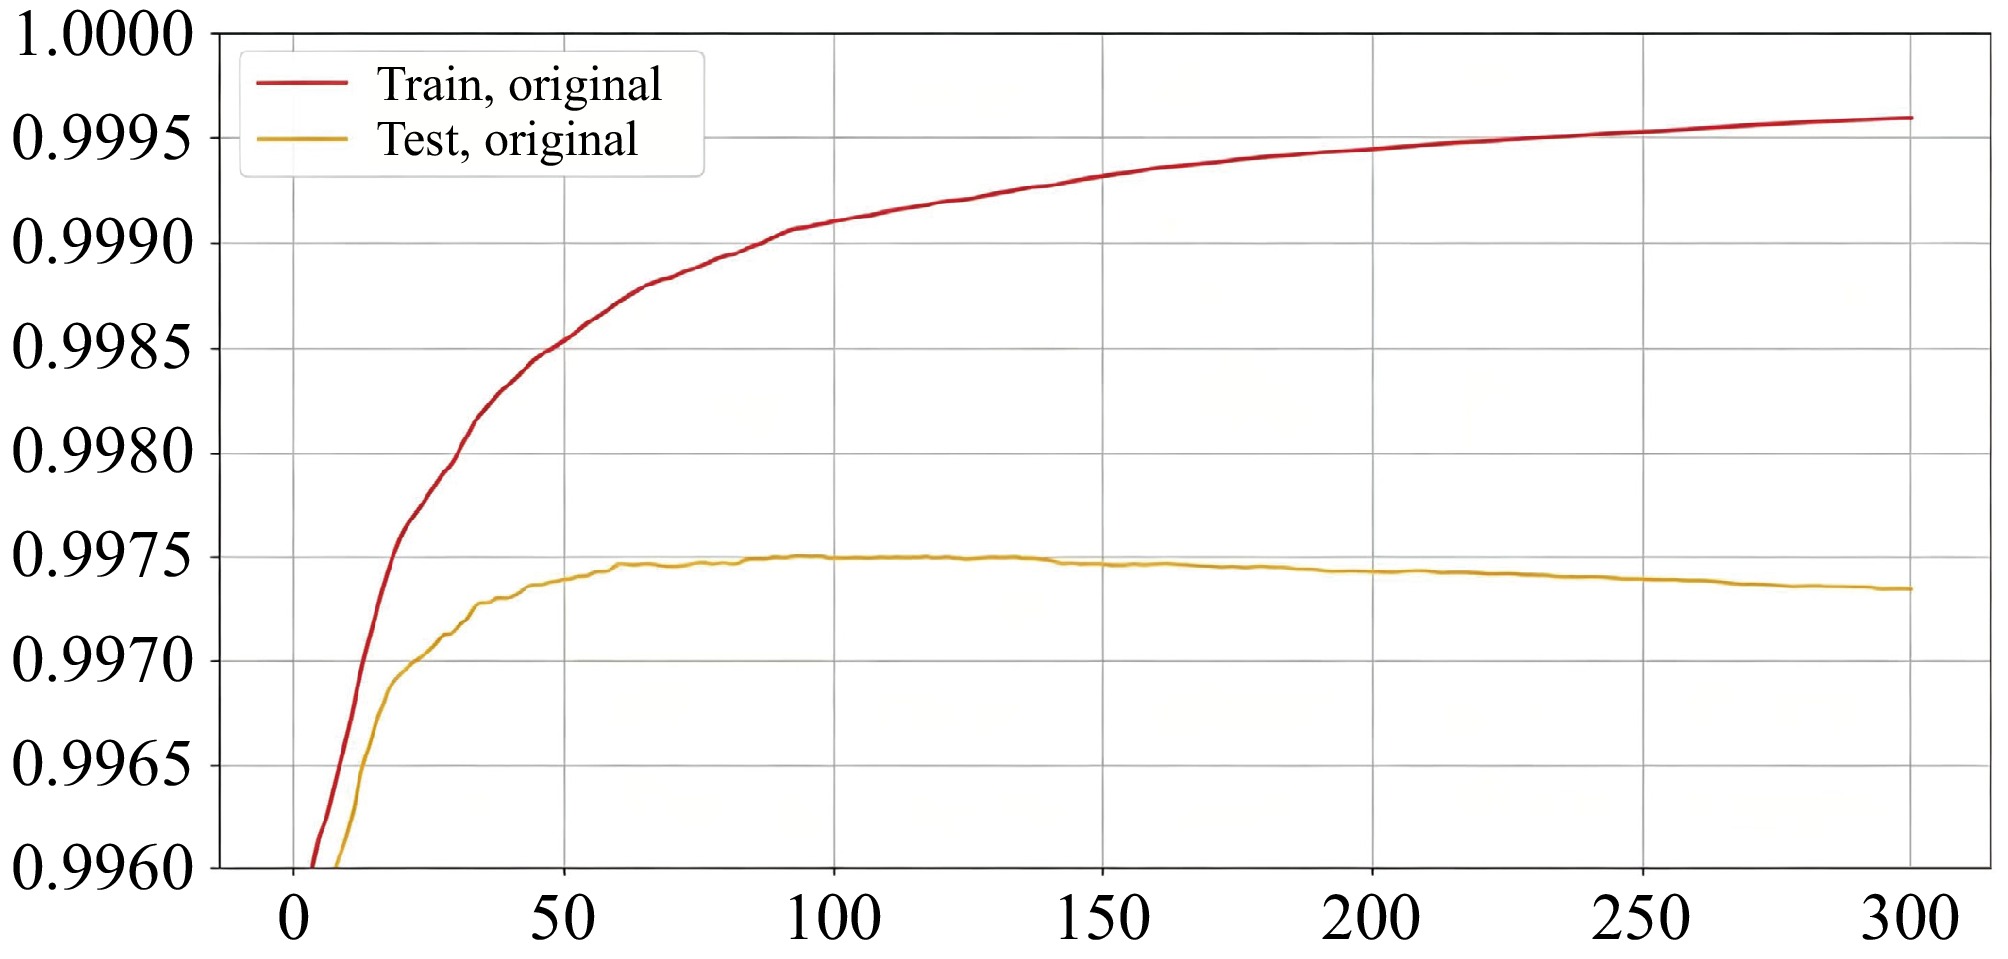
Figure 10.
Mean AUC for the learning curve of XGBoost with the training set and test set.
The specific principles followed during tuning were as follows. If the test set curve decreases, regardless of whether the training set curve increases or decreases, this parameter adjustment will not be adopted, because a decrease in the test set curve indicates a decrease in the model's accuracy. If the test set curve increases, and the training set curve also increases with a much larger magnitude than the test set's curve, parameter adjustment will also not be adopted because although the model's accuracy slightly increases, the generalization error of the adjusted model will also increase. According to these principles, the parameters were adjusted sequentially, and the adjustment results are shown in Fig. 11. Subsequently, based on the adjusted parameters, the learning curve was drawn for the iteration count using the macro-recall rate as the indicator.
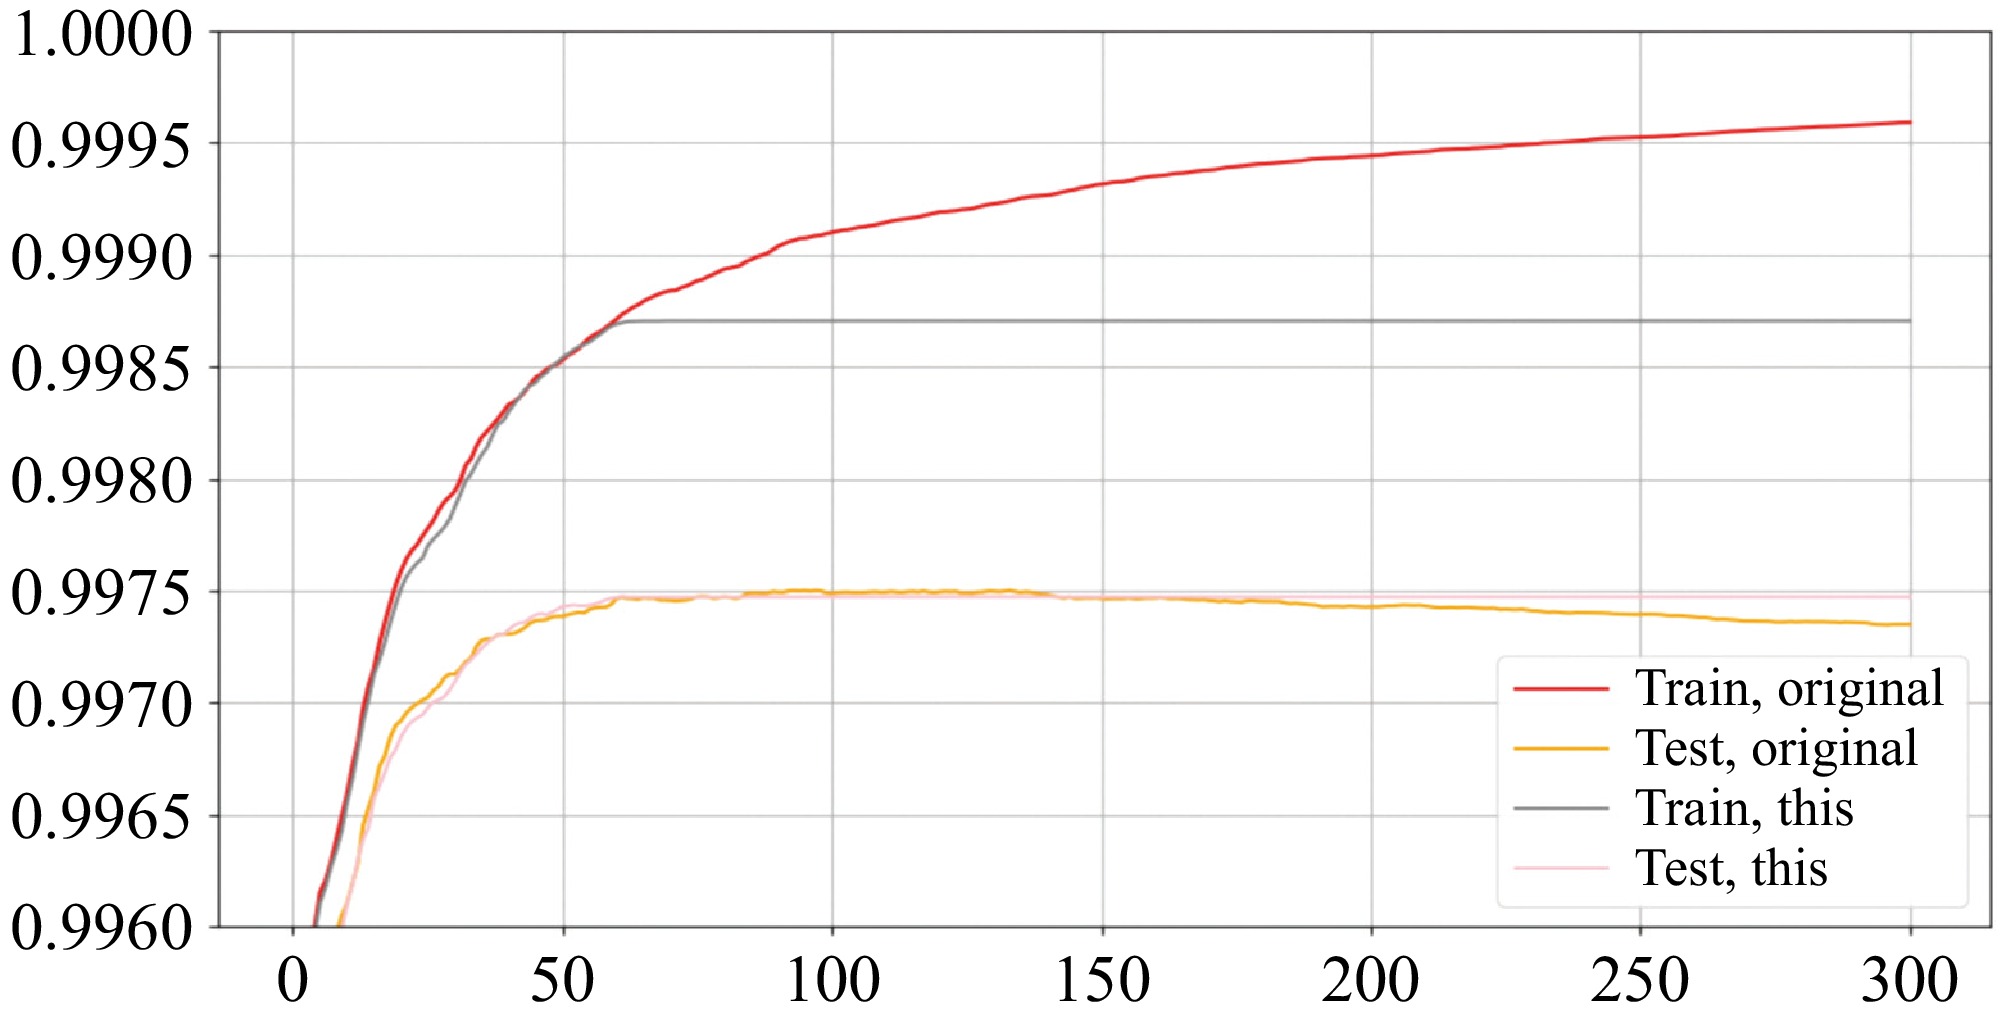
Figure 11.
Mean AUC for the learning curve of the training set and test set after parameter adjustment.
The model was trained on the adjusted parameters, and the evaluation results are presented in Table 11. Subsequently, 150 buildings were randomly selected from the test set and subjected to small-scale prediction of the building structure types 10 times. The average accuracy of these 10 predictions was calculated, and the evaluation's results are shown in Table 12.
Table 11. Model evaluation results.
Evaluation metric Precision (%) Overall accuracy 98.82 Recall rate of single-story bungalows 100.00 Recall rate of masonry structures 99.69 Recall rate of frame structures 82.47 Table 12. Prediction accuracy of structure types in a small area.
Evaluation metric Precision (%) Overall mean accuracy 99.20 Mean recall rate of single-story bungalows 100.00 Mean recall rate of masonry structures 99.71 Mean recall rate of frame structures 89.69 AdaBoost
-
AdaBoost is another classic boosting method, whose concept was jointly introduced by Freund and Schapire in 1997[16]. AdaBoost has fewer main parameters, which means that its parameter tuning is also simpler.
First, the parameters of the weak evaluator, using a classification tree for classification problems, are selected. The maximum depth of the classification tree is determined by plotting a learning curve. At the same time, the parameters of learning_rate and n_estimators have a significant mutual influence, often requiring simultaneous adjustment. Therefore, grid search is used to find the optimal combination of the parameters n_estimators and learning_rate.
The evaluation results of the model are presented in Table 13. A random sample of 150 buildings from the test set was used to predict small-scale structural types 10 times, and the average accuracy of these 10 predictions was calculated. The evaluation results are shown in Table 14.
Table 13. Model evaluation results.
Evaluation metric Precision (%) Overall accuracy 98.52 Recall rate of single-story bungalows 100.00 Recall rate of masonry structures 99.06 Recall rate of frame structures 83.86 Table 14. Prediction accuracy of structure types in a small area.
Evaluation metric Precision (%) Overall mean accuracy 99.13 Mean recall rate of single-story bungalows 100.00 Mean recall rate of masonry structures 99.43 Mean recall rate of frame structures 89.36 MLP neural network
-
Artificial neural networks (ANNs) are unique and extremely powerful learning models within the field of machine learning. The MLP is a deep learning architecture that builds upon the foundation of feed-forward neural networks, consisting of multiple layers of neurons stacked on top of each other. The core architecture of MLP comprises three parts: The input layer, the hidden layer, and the output layer.
First, the structure of the hidden layer includes the number of neurons and the number of hidden layers, which were established by plotting the learning curves. The selected hidden layer structure was (168, 168, 168), then the other two hyperparameters (regularization parameter alpha and maximum iteration count max_iter) were determined by plotting the learning curves.
The evaluation results of the model are presented in Table 15. A random sample of 150 buildings from the test set was used to predict small-scale structural types 10 times, and the average accuracy of these 10 predictions was calculated. The evaluation results are also presented in Table 16.
Table 15. Model evaluation results.
Evaluation metric Precision (%) Overall accuracy 98.15 Recall rate of single-story bungalows 100.00 Recall rate of masonry structures 98.52 Recall rate of frame structures 81.03 Table 16. Prediction accuracy of structure types in a small area.
Evaluation metric Precision (%) Overall mean accuracy 98.67 Mean recall rate of single-story bungalows 100.00 Mean recall rate of masonry structures 98.50 Mean recall rate of frame structures 91.08 Selection of machine learning models
-
We calculated the other three evaluation metrics (f1 score, accuracy, AUC) normally used in machine learning for the aforementioned four algorithms separately, which facilitated comprehensive comparison and model selection. Table 17 displays the various indicators for the four algorithms. The first section represents the evaluation metrics for the overall test set; the second section represents the evaluation metrics for 150 randomly selected small-scale buildings from the test set. It is evident that the evaluation metrics of the MLP neural network and AdaBoost are lower than those of Random Forest. Although the precision, f1 score, accuracy, AUC, and masonry structure recall rate of XGBoost are slightly higher than those of Random Forest by less than 1%, the frame structure recall rate for both the overall test set and the 150 small-scale buildings is lower by approximately 2%. The reason for this phenomenon is that the masonry structure recall rate of XGBoost is slightly higher than that of Random Forest by only 0.54%, whereas the frame structure recall rate is lower by 1.65%. Since the number of masonry structures in the overall data is much higher than that of frame structures, the recognition effect of masonry structures has a greater impact on the accuracy of other evaluation metrics. Since all four algorithms perform poorly in recognizing frame structures, significantly worse than their performance in recognizing masonry structures and single-story bungalows, and all perform well in recognizing masonry structures and single-story bungalows, the experimental effect of this study is more focused on improving the recognition accuracy of frame structures rather than slightly improving the recognition accuracy of masonry structures and other evaluation metrics by significantly reducing the recognition accuracy of frame structures. In summary, the Random Forest model is more suitable for identifying building structure types.
Table 17. Various indicators of the four algorithms.
Data Evaluation parameters Random forest XGBoost Adaboost MLP neural network Test set Precision 98.59% 98.82% 98.52% 98.15% f1 0.9558 0.9599 0.9540 0.9396 Recall ratio 0.9442 0.9406 0.9431 0.9318 Accuracy 0.9687 0.9732 0.9662 0.9480 AUC area 0.9963 0.9981 0.9949 0.9956 Recall rate of masonry structures 99.15% 99.69% 99.06% 98.52% Recall rate of frame structures 84.12% 82.47% 83.86% 81.03% Recall rate of single-story bungalows 100% 100% 100% 100% 150 buildings Overall mean accuracy 99.13% 99.20% 99.13% 98.67% Mean recall rate of masonry structures 99.18% 99.71% 99.43% 98.50% Mean recall rate of frame structures 92.21% 89.69% 89.36% 91.08% Mean recall rate of single-story bungalows 100% 100% 100% 100% -
With UAV-based oblique photography images, utilizing the MaskRCNN deep learning model to extract the contours and areas of building footprints holds great potential. The best parameter combination of four kinds of machine learning was investigated and the best was suggested after typical model training and adjustment.
Three evaluation metrics (f1 score, accuracy, AUC) were adopted for facilitating comprehensive comparison and selection of the models, and evaluating the most suitable model for the research region.
The selected building attributes have a strong correlation with structural types, and the model exhibits good accuracy in identifying structural types, with the Random Forest algorithm demonstrating the best recognition performance.
The result validates the powerful capabilities of machine learning in handling such classification problems, which is a great improvement over traditional ways of structural recognition, and lays a foundation for subsequent research and application in earthquake damage simulation and casualty risk assessments.
-
The authors confirm their contributions to the paper as follows: study concept and design: Wang G; data collection and analysis: Yun Y; draft manuscript preparation: Mihaela KG; manuscript revising: Peter P. All authors reviewed the results and approved the final version of the manuscript.
-
The datasets generated during and/or analyzed during the current study are available from the corresponding author on reasonable request.
-
The authors declare that they have no known competing financial interests or personal relationships that could have appeared to influence the work reported in this paper.
- Copyright: © 2026 by the author(s). Published by Maximum Academic Press on behalf of Nanjing Tech University. This article is an open access article distributed under Creative Commons Attribution License (CC BY 4.0), visit https://creativecommons.org/licenses/by/4.0/.
-
About this article
Cite this article
Wang G, Yun Y, Mihaela KG, Peter P. 2026. Application of machine learning for recognizing building attributes via UAV-based oblique photography: a case study from China. Emergency Management Science and Technology 6: e011 doi: 10.48130/emst-0026-0011 

Application of machine learning for recognizing building attributes via UAV-based oblique photography: a case study from China
- Received: 10 July 2026
- Revised: 23 September 2026
- Accepted: 24 September 2026
- Published online: 28 October 2026
Abstract: The collection of building attributes can be a challenging task when conducting regional seismic risk assessments for buildings, but unmanned aerial vehicle (UAV)-based oblique photography technology is a quick and powerful tool to solve this problem. Utilizing ArcGIS Pro, a deep learning model for extracting building contours was trained first by transfer learning based on the MaskRCNN algorithm, thereby achieving automatic extraction of buildings' geometric dimensions. Meanwhile, a potential association model between structural types and other building attributes (area, height, number of floors, age) was trained by machine learning from a large amount of building data, which was adopted to identify the structural types in UAV-photographed areas. The results exhibit good accuracy in both identifying buildings' structural types and geometric dimension extraction, and indicates that UAV-based oblique photography technology can be applied to the automatic extraction of building attributes proved by model and parameter comparison.
-
Key words:
- UAV-based oblique photography /
- Machine learning /
- Structural type /
- Geometric dimensions