-
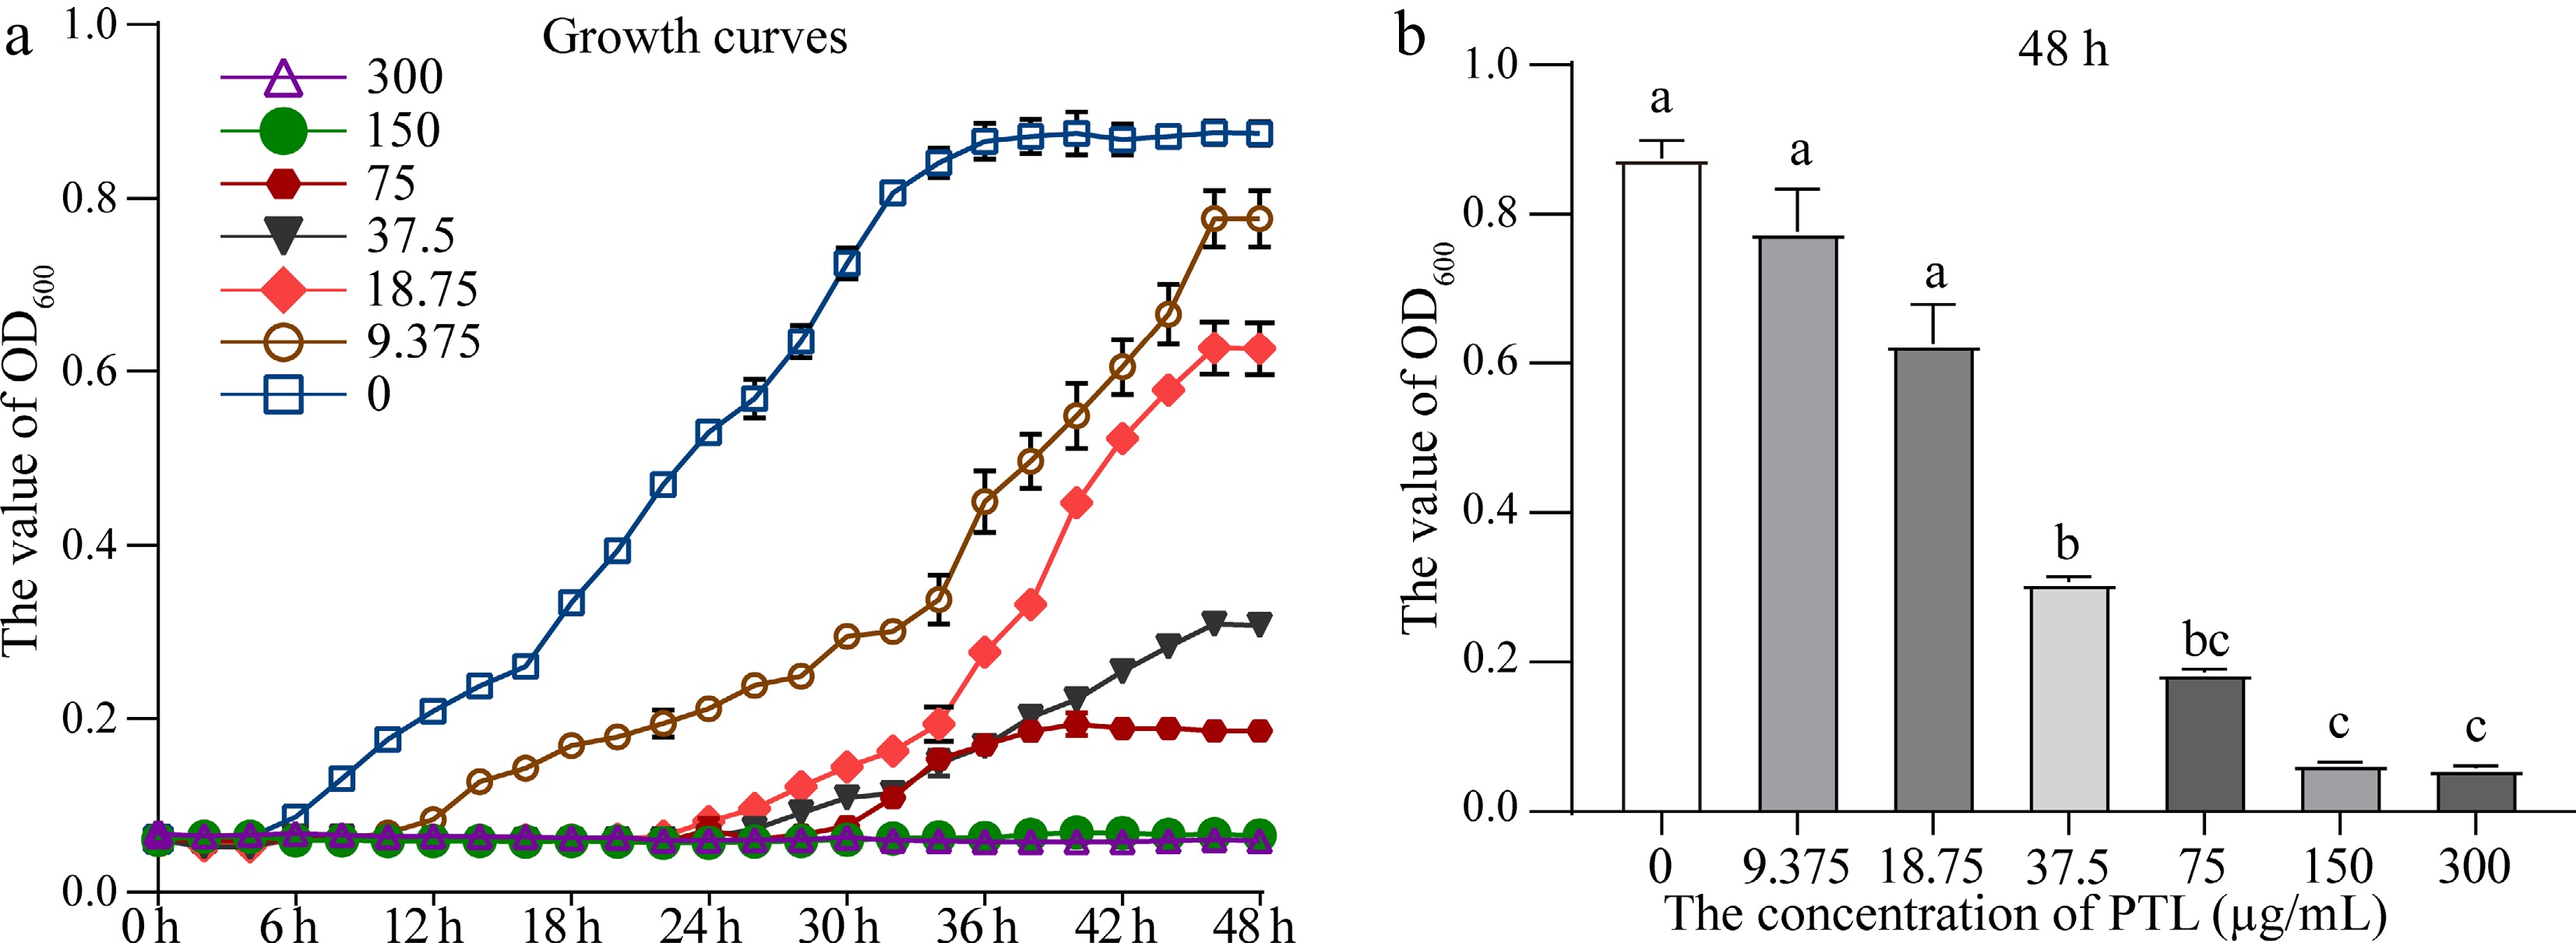
Figure 1.
Growth response of Aeromonas veronii to PTL. (a) 48-h growth profiles at the tested PTL concentrations. (b) OD600 at 48 h. Values are means of three replicates with standard deviations; different letters denote significant differences (p < 0.05).
-
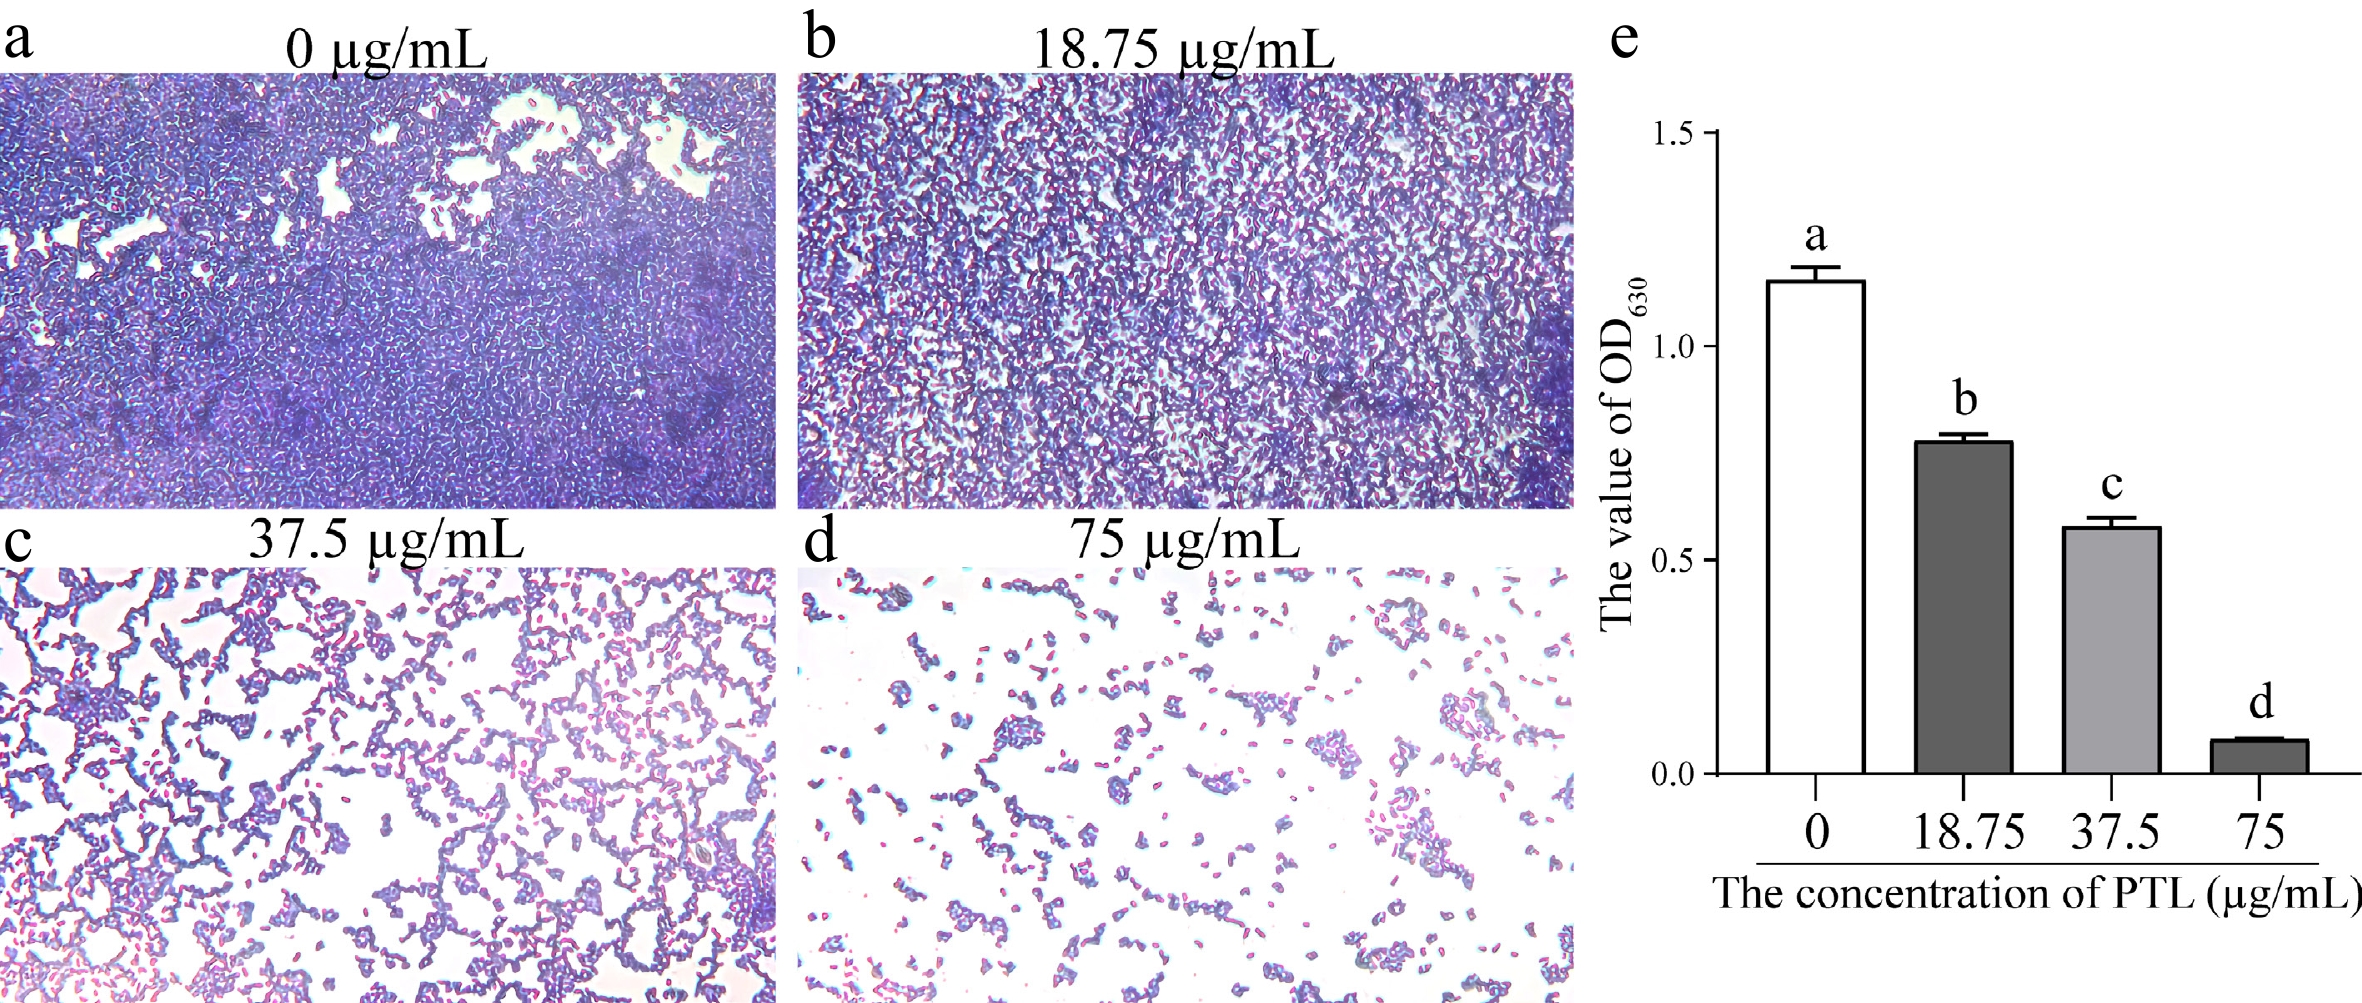
Figure 2.
PTL-mediated changes in Aeromonas veronii biofilm development. (a)–(d) Biofilms visualized after crystal violet staining following treatment with 0, 18.75, 37.5, or 75 μg/mL PTL. (e) Quantitative assessment of biofilm biomass. Data represent mean values with standard deviations from three replicates; groups marked with different letters differ significantly (p < 0.05).
-
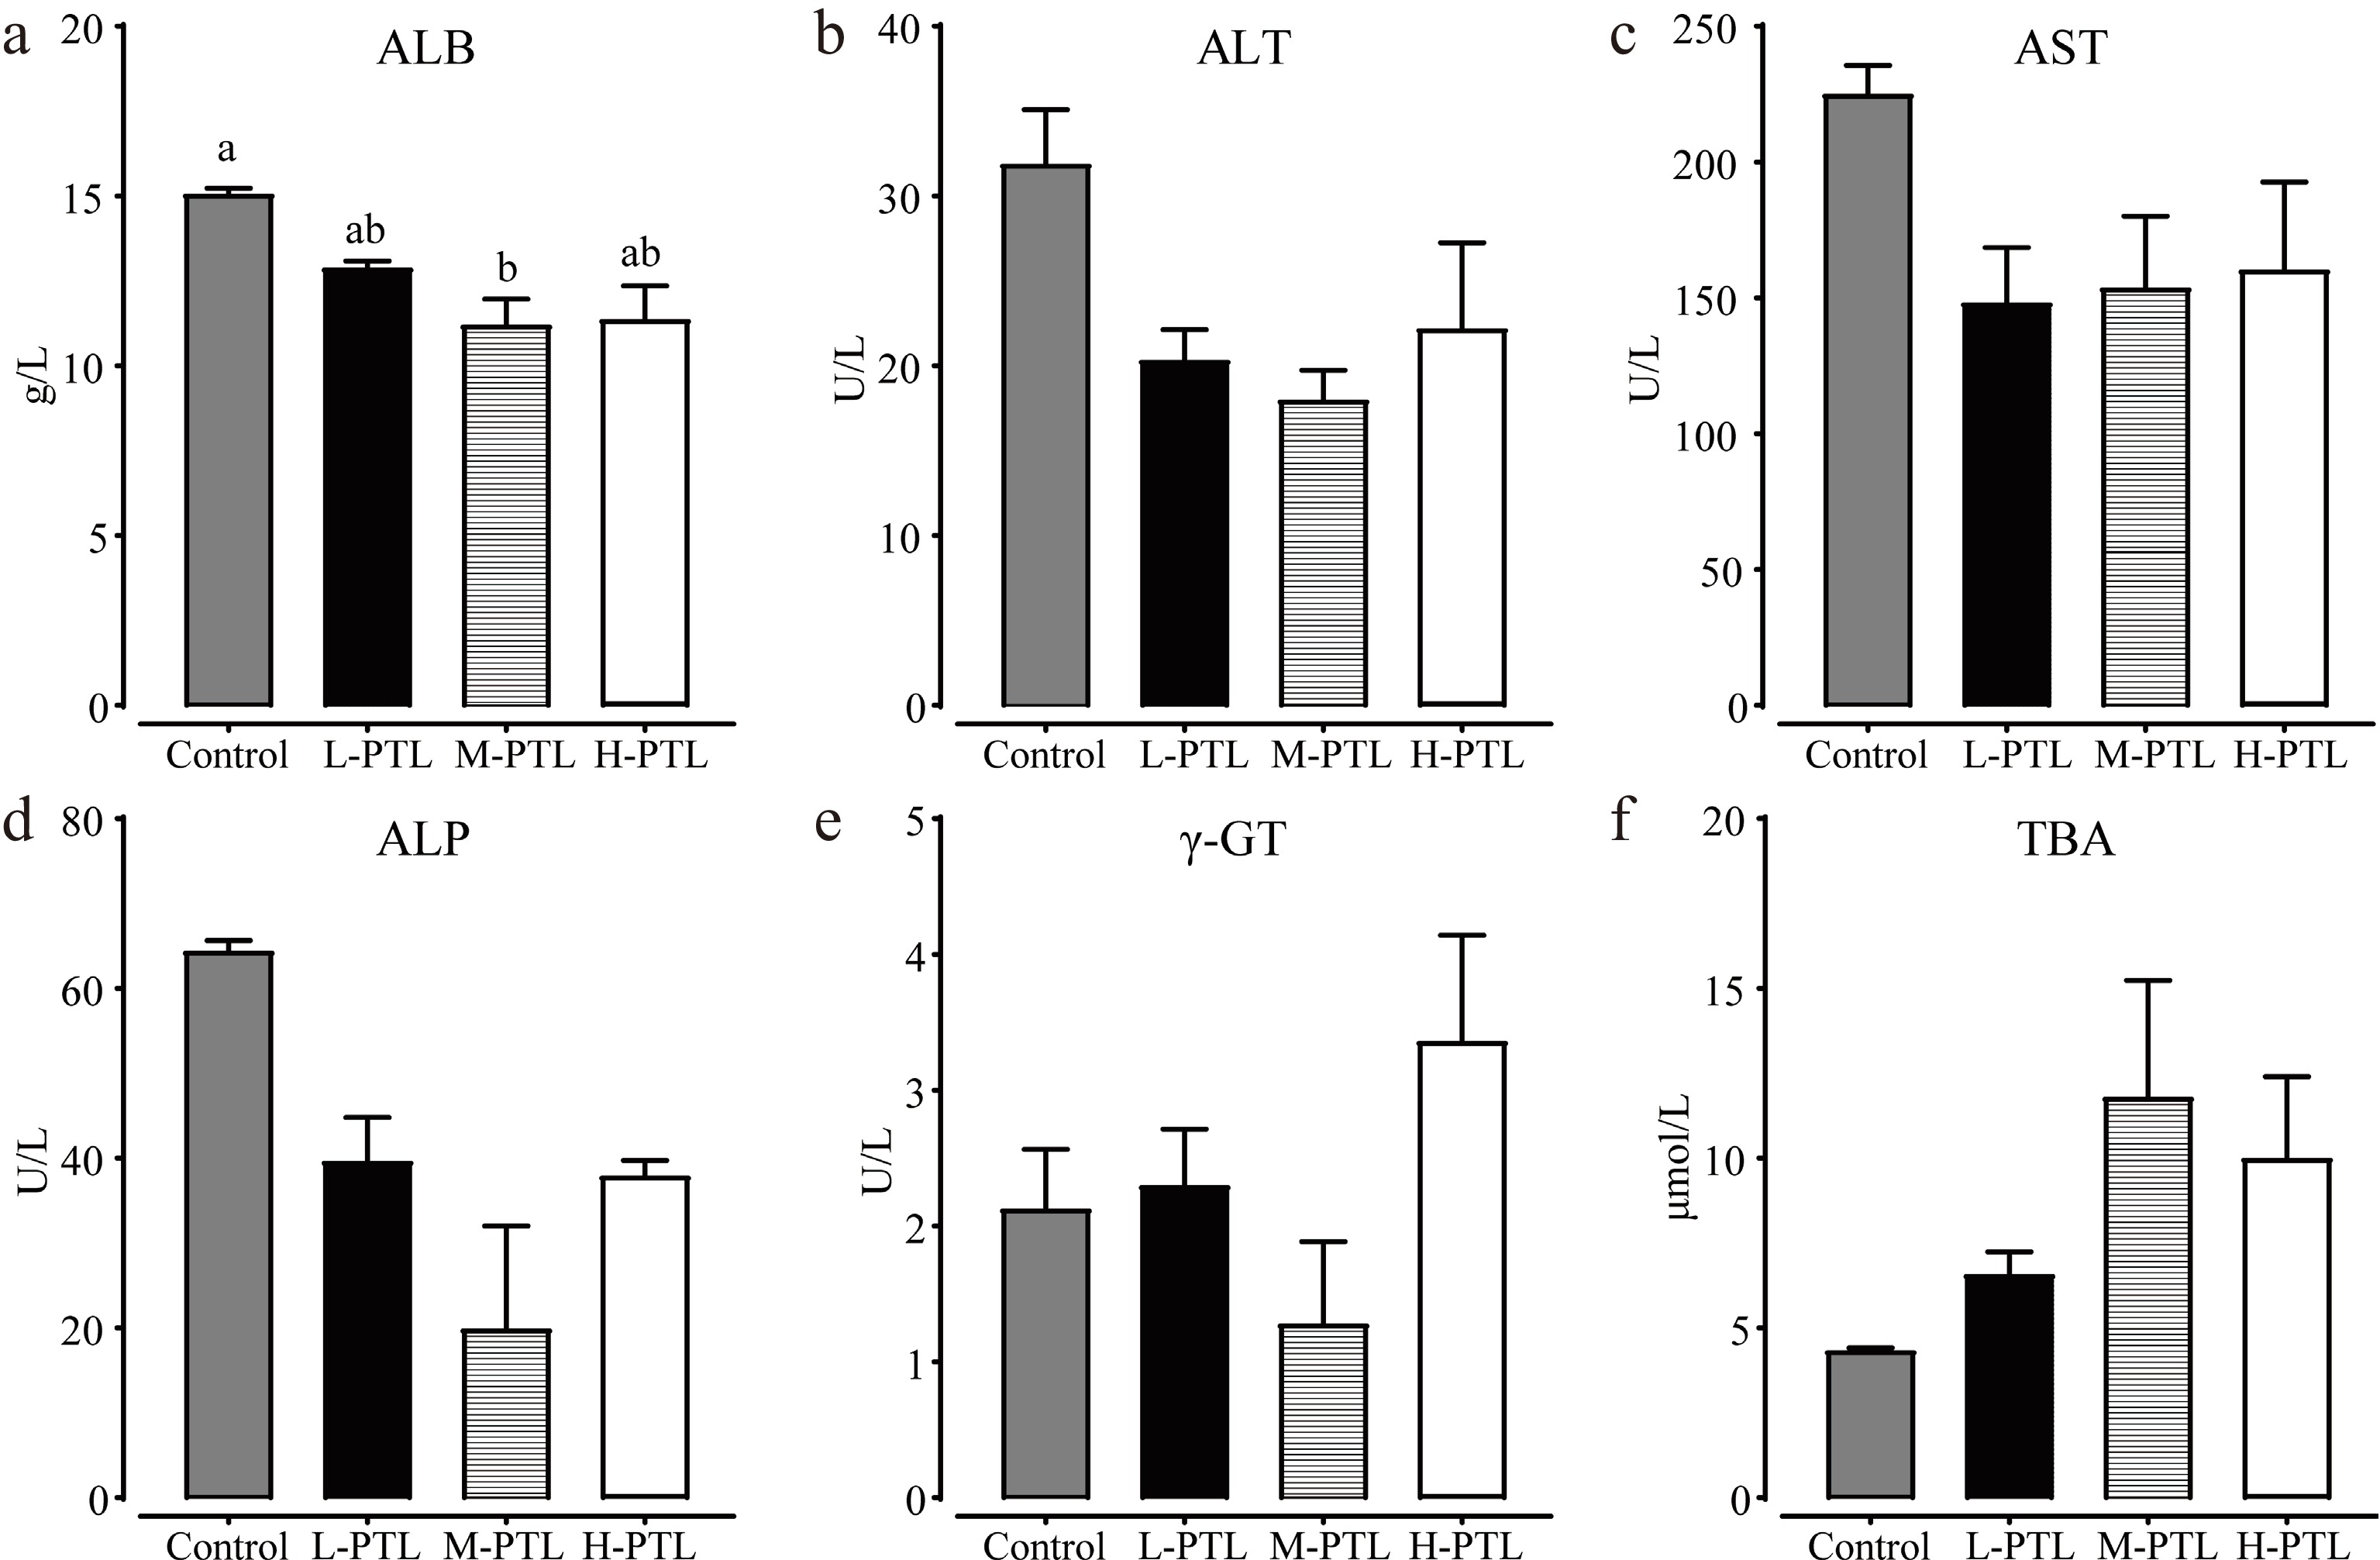
Figure 3.
Serum biochemical indicators in koi carp following 7-d dietary PTL exposure: (a) albumin (ALB), (b) alanine aminotransferase (ALT), (c) aspartate aminotransferase (AST), (d) alkaline phosphatase (ALP), (e) gamma-glutamyltransferase (γ-GT), and (f) total bile acid (TBA). Data are presented as mean values with standard deviations (n = 3); groups assigned different letters differ significantly (p < 0.05).
-
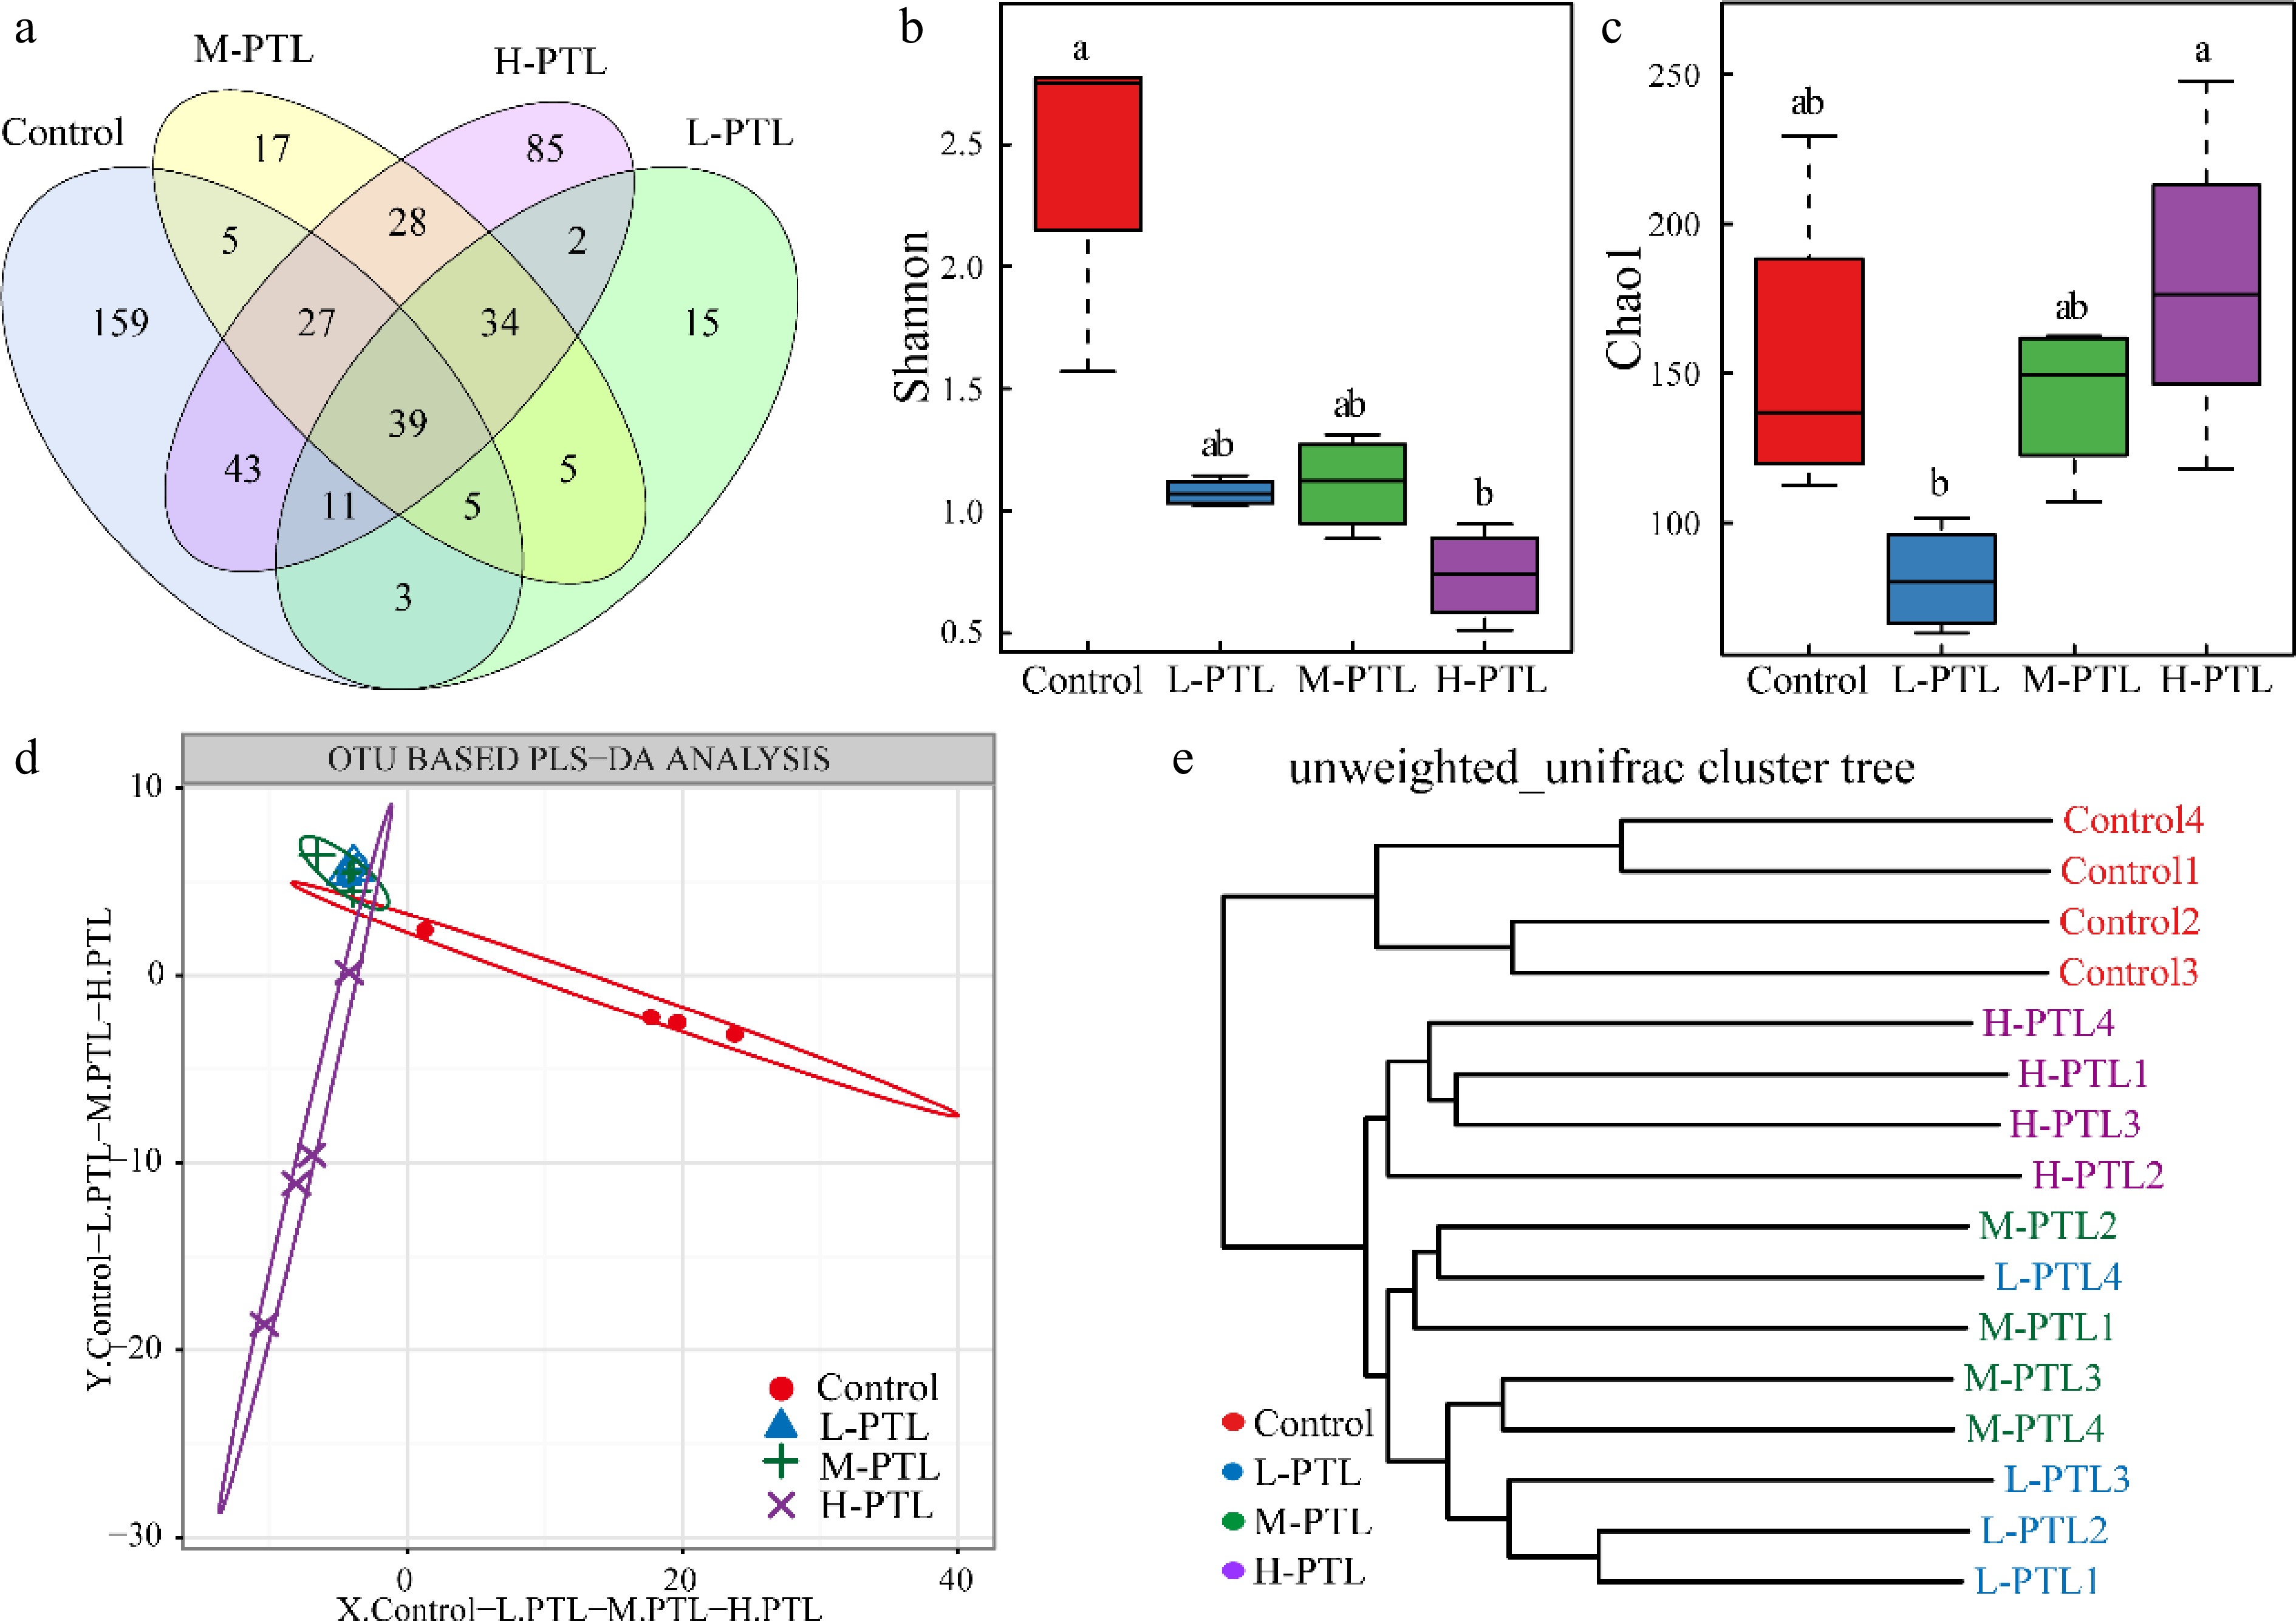
Figure 4.
Intestinal microbial diversity in koi carp after dietary PTL supplementation. (a) Distribution of OTUs among the four groups. (b) Shannon diversity. (c) Chao1 richness. (d) PLS-DA. (e) Unweighted UniFrac-based UPGMA clustering. Results are expressed as mean values with standard deviations (n = 4); groups labeled with different letters differ significantly (p < 0.05).
-
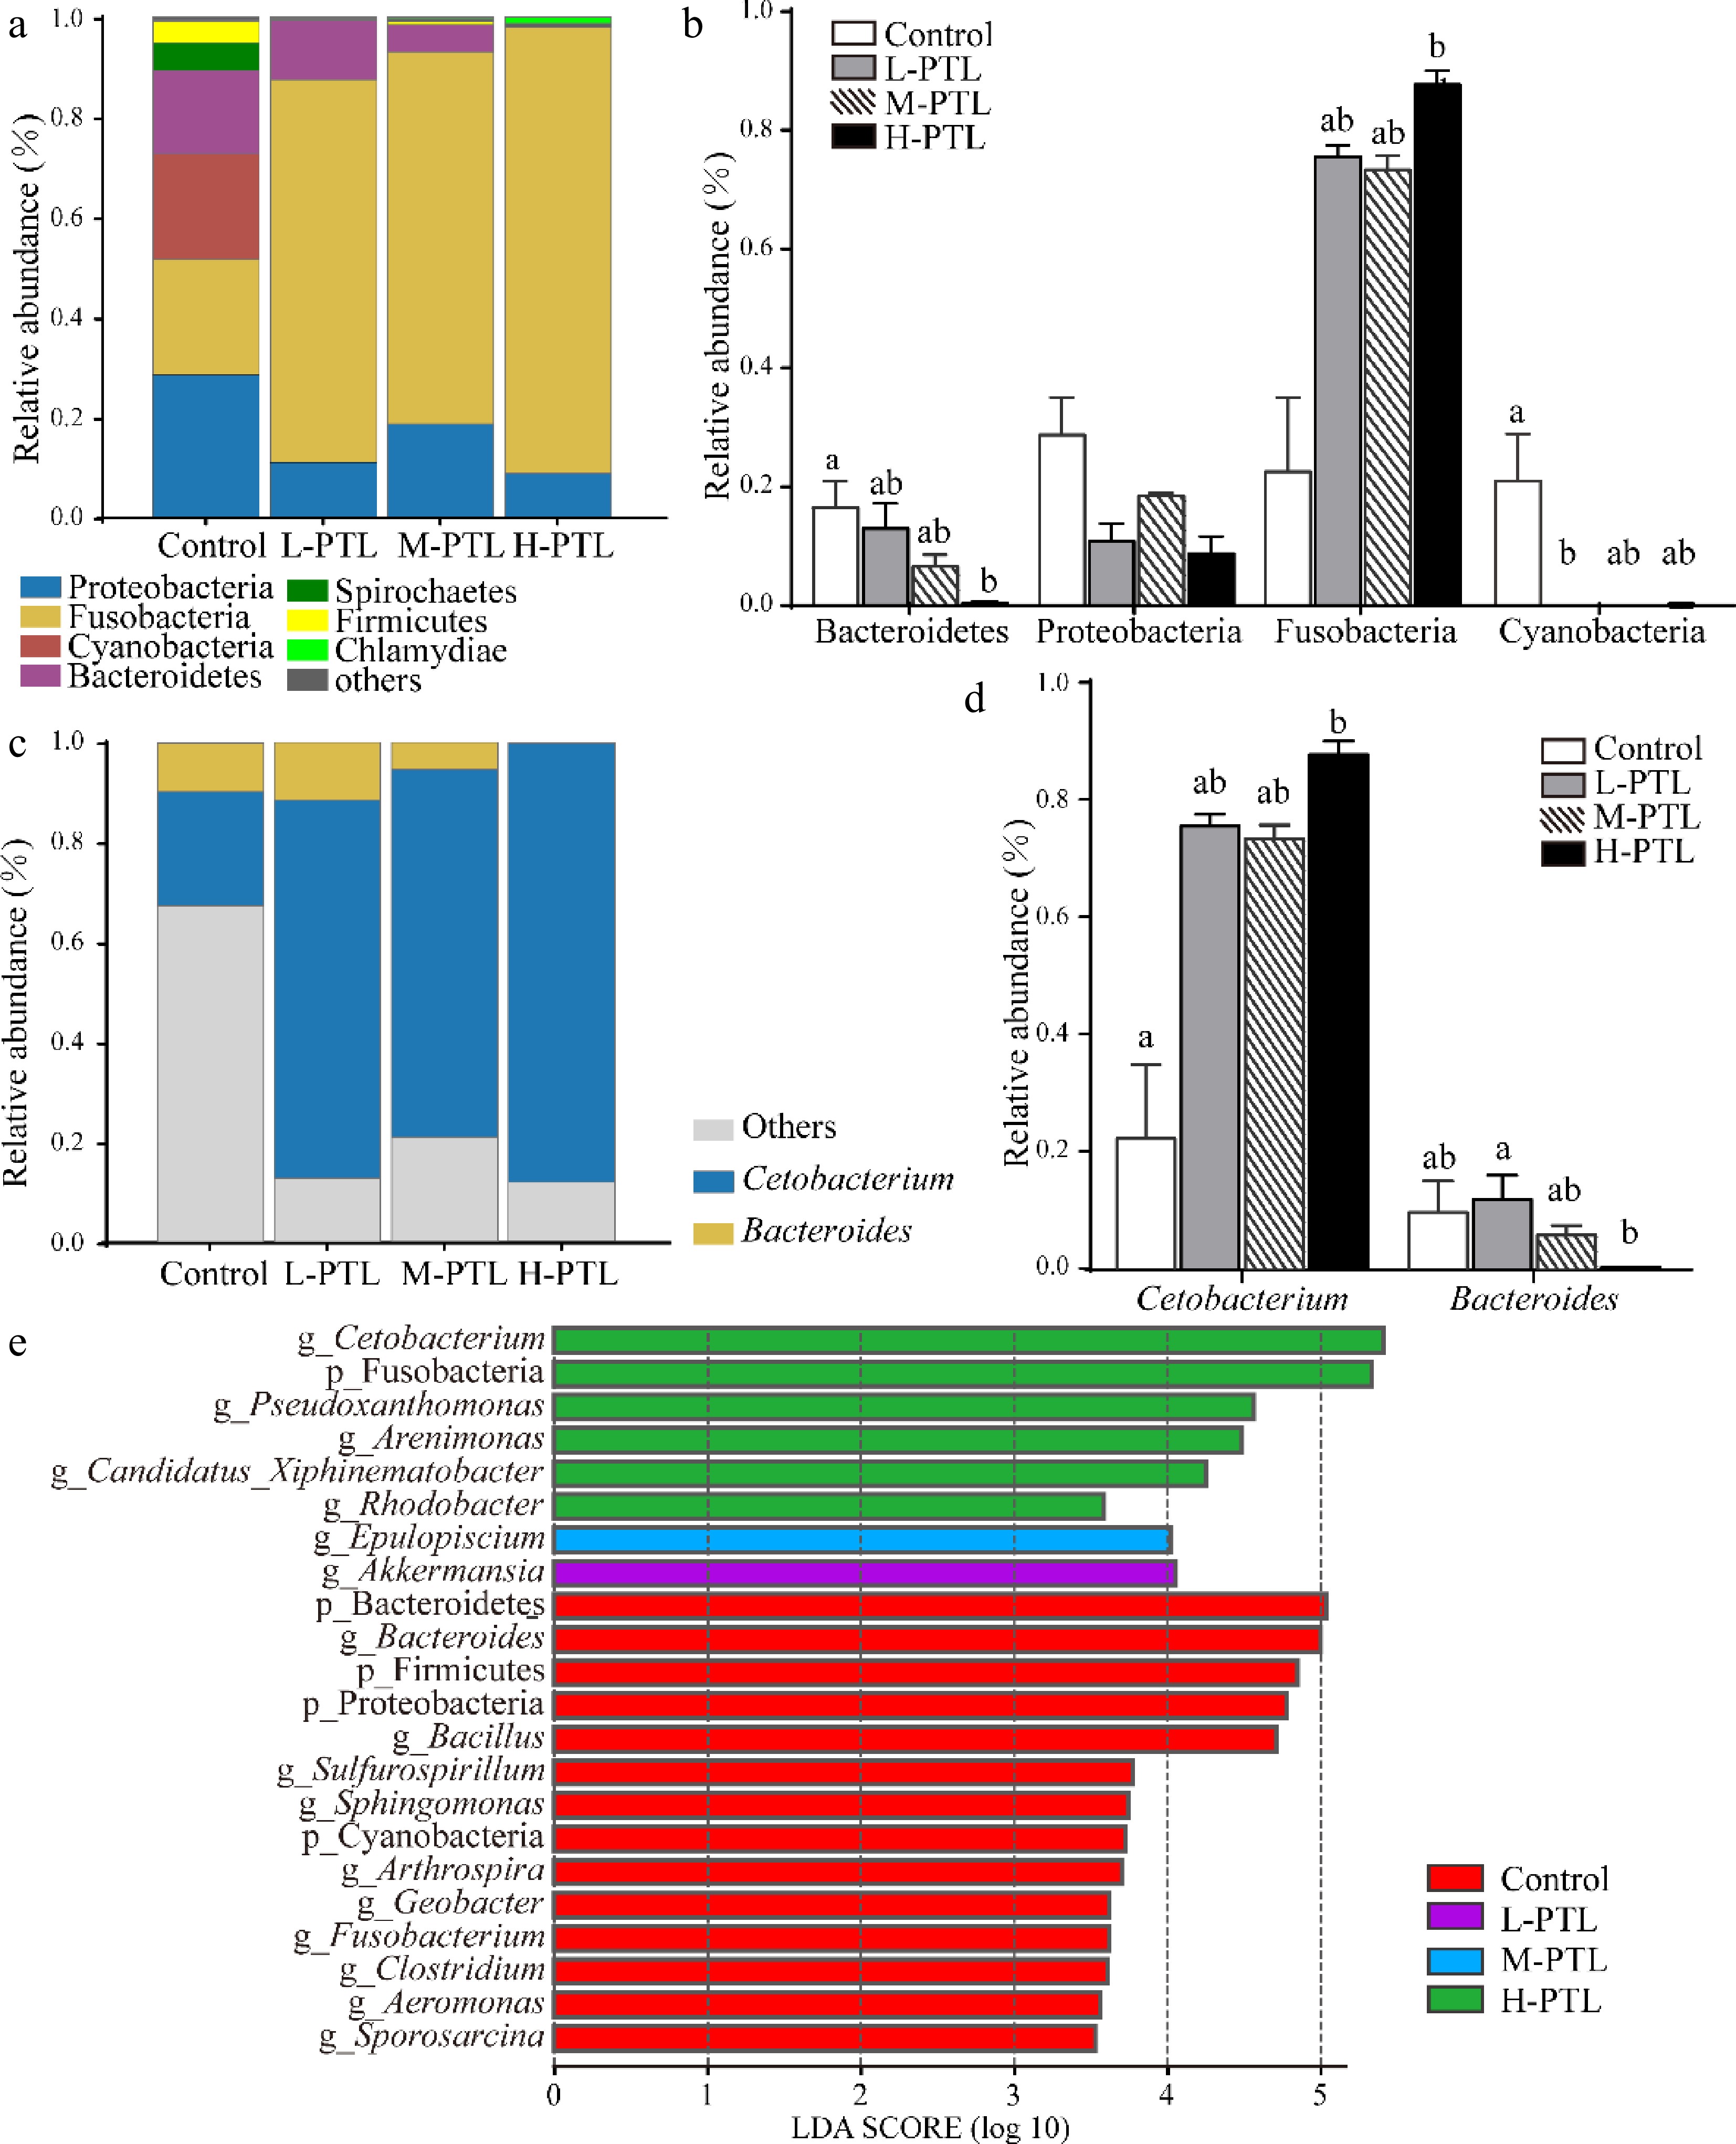
Figure 5.
Bacterial community profiles and treatment-associated taxa in the intestinal microbiota. (a) Distribution of bacterial phyla. (b) Abundance of the major phyla. (c) Distribution of bacterial genera. (d) Abundance of the major genera. (e) Taxa discriminating among groups identified by LEfSe (LDA score > 3.5). Bars represent the mean ± SD (n = 4); groups not sharing the same letter differ significantly (p < 0.05).
-
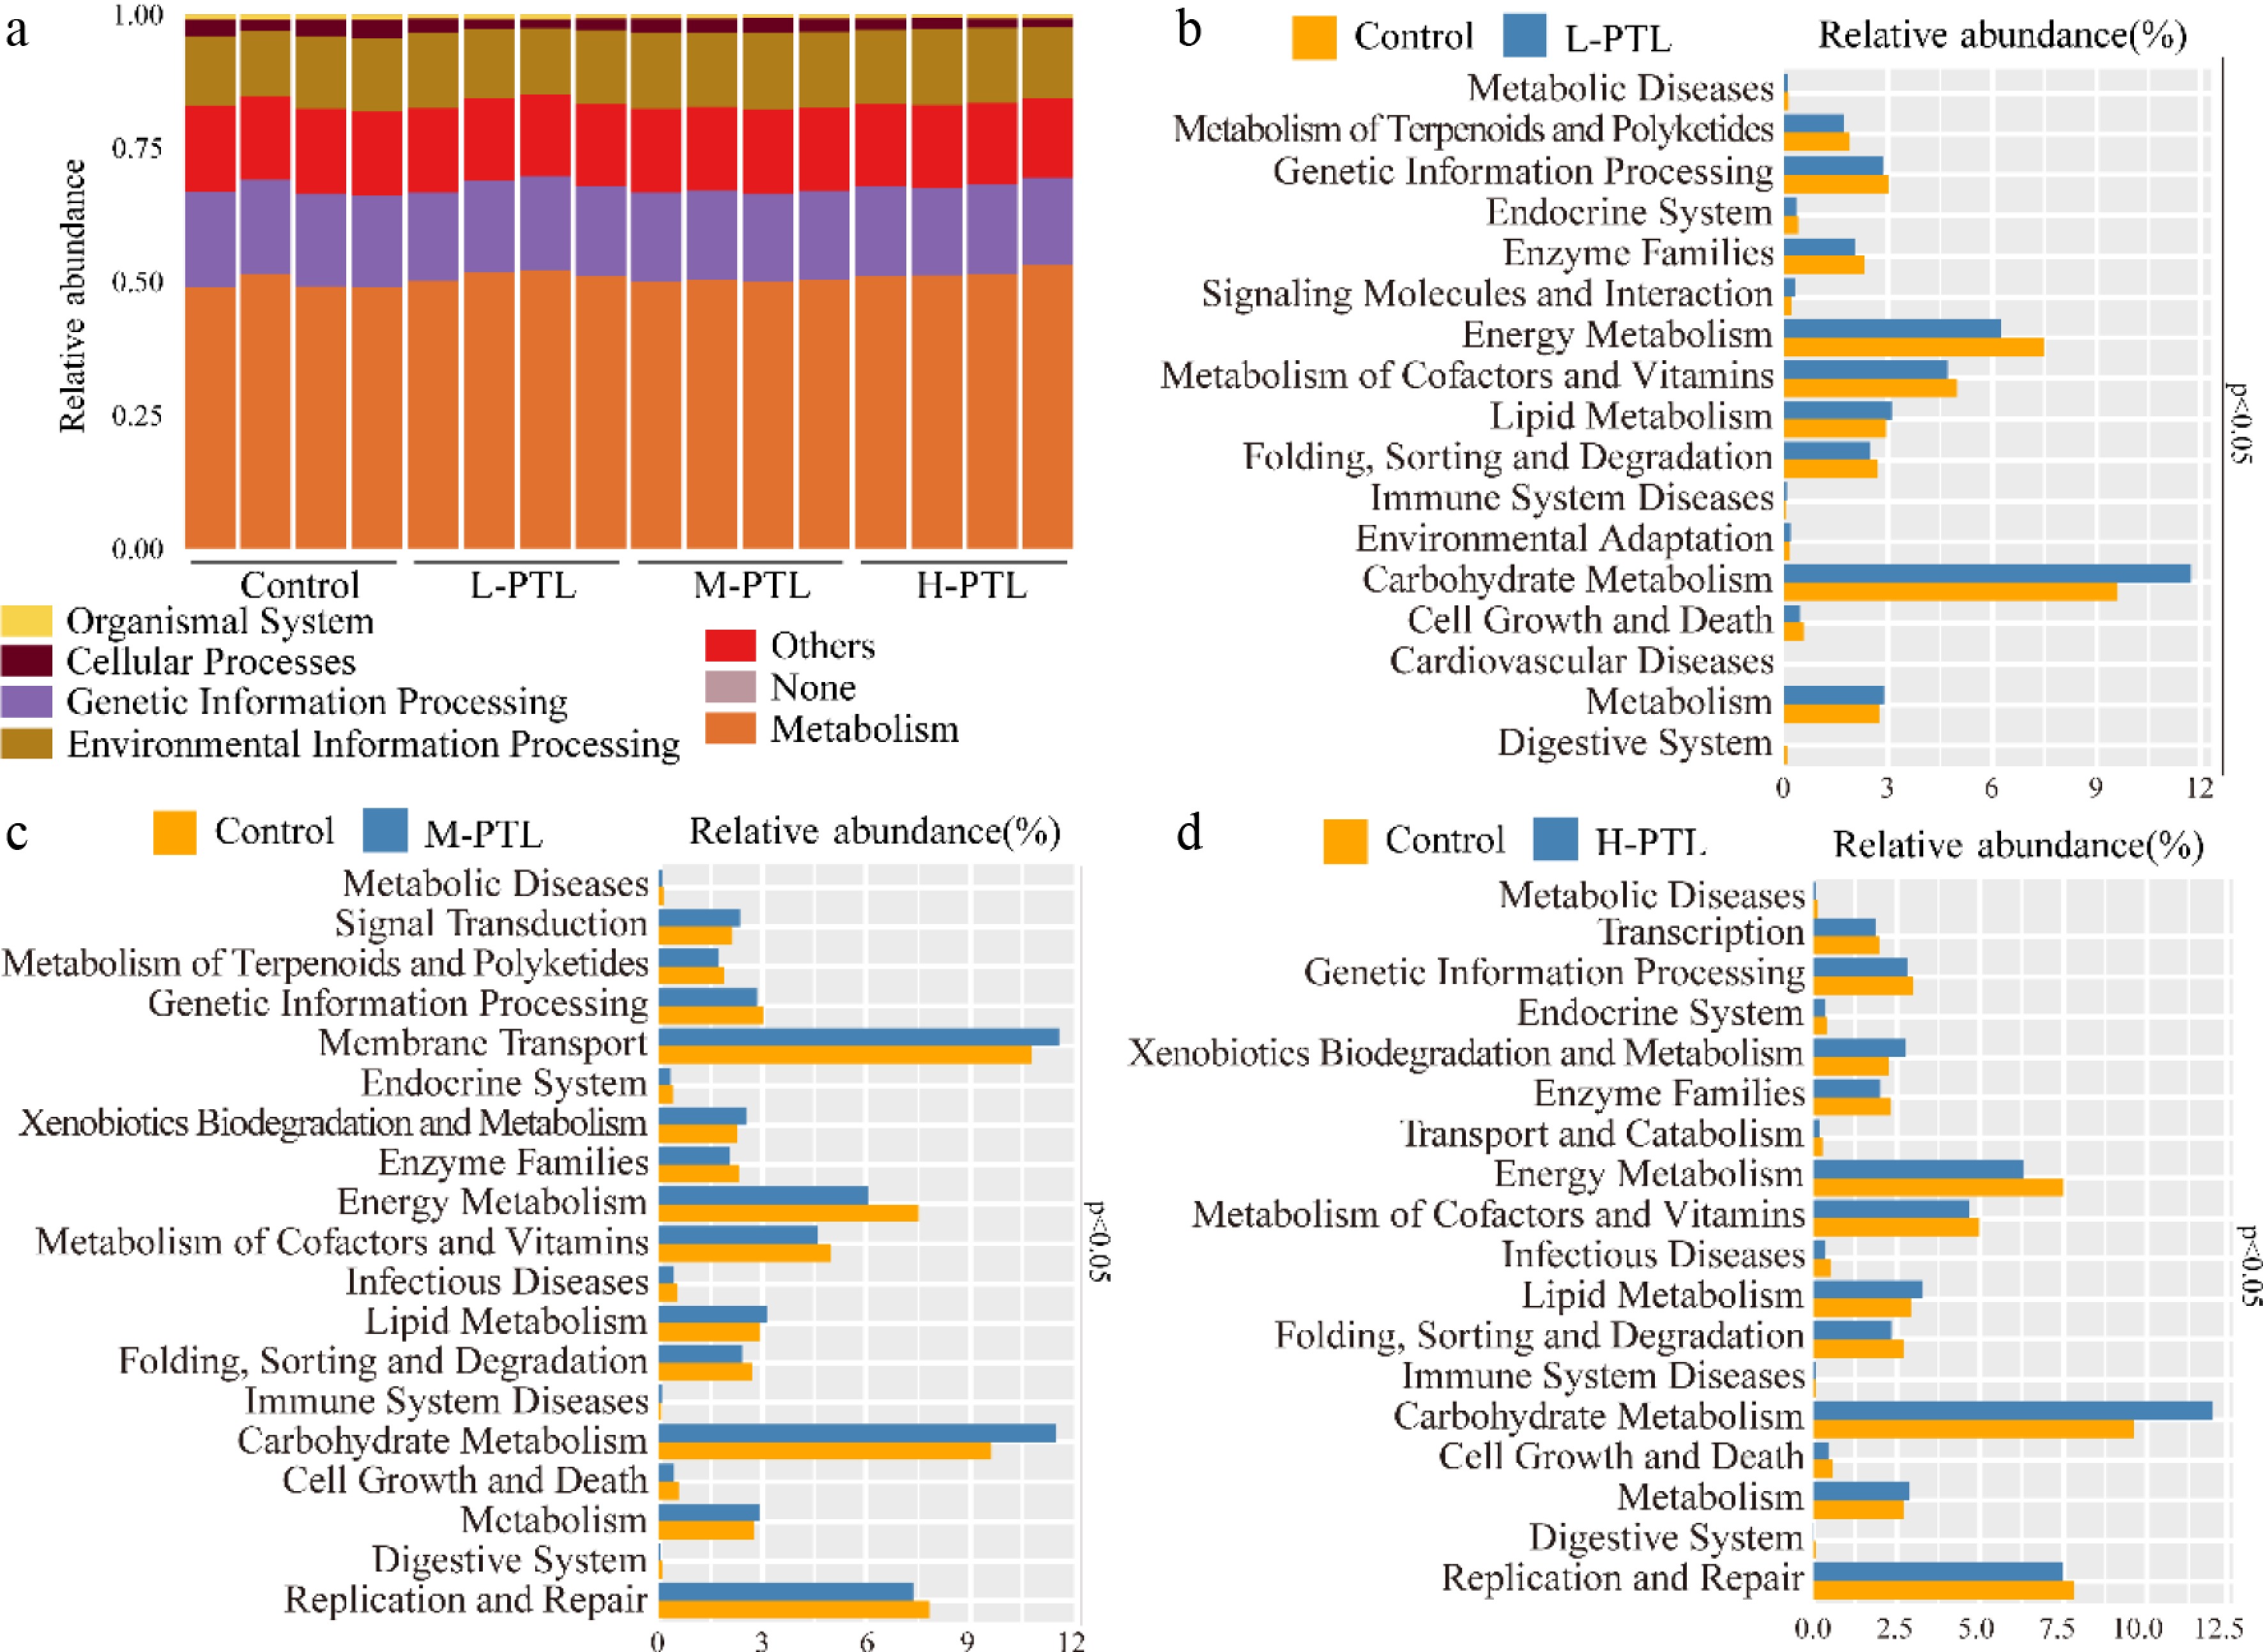
Figure 6.
Predicted microbial functions inferred with PICRUSt. (a) Relative abundance of predicted genes assigned to KEGG level 1 categories. (b)–(d) KEGG level 2 functional categories differing significantly in predicted relative abundance between (b) Control and L-PTL, (c) Control and M-PTL, and (d) Control and H-PTL (p < 0.05).
-
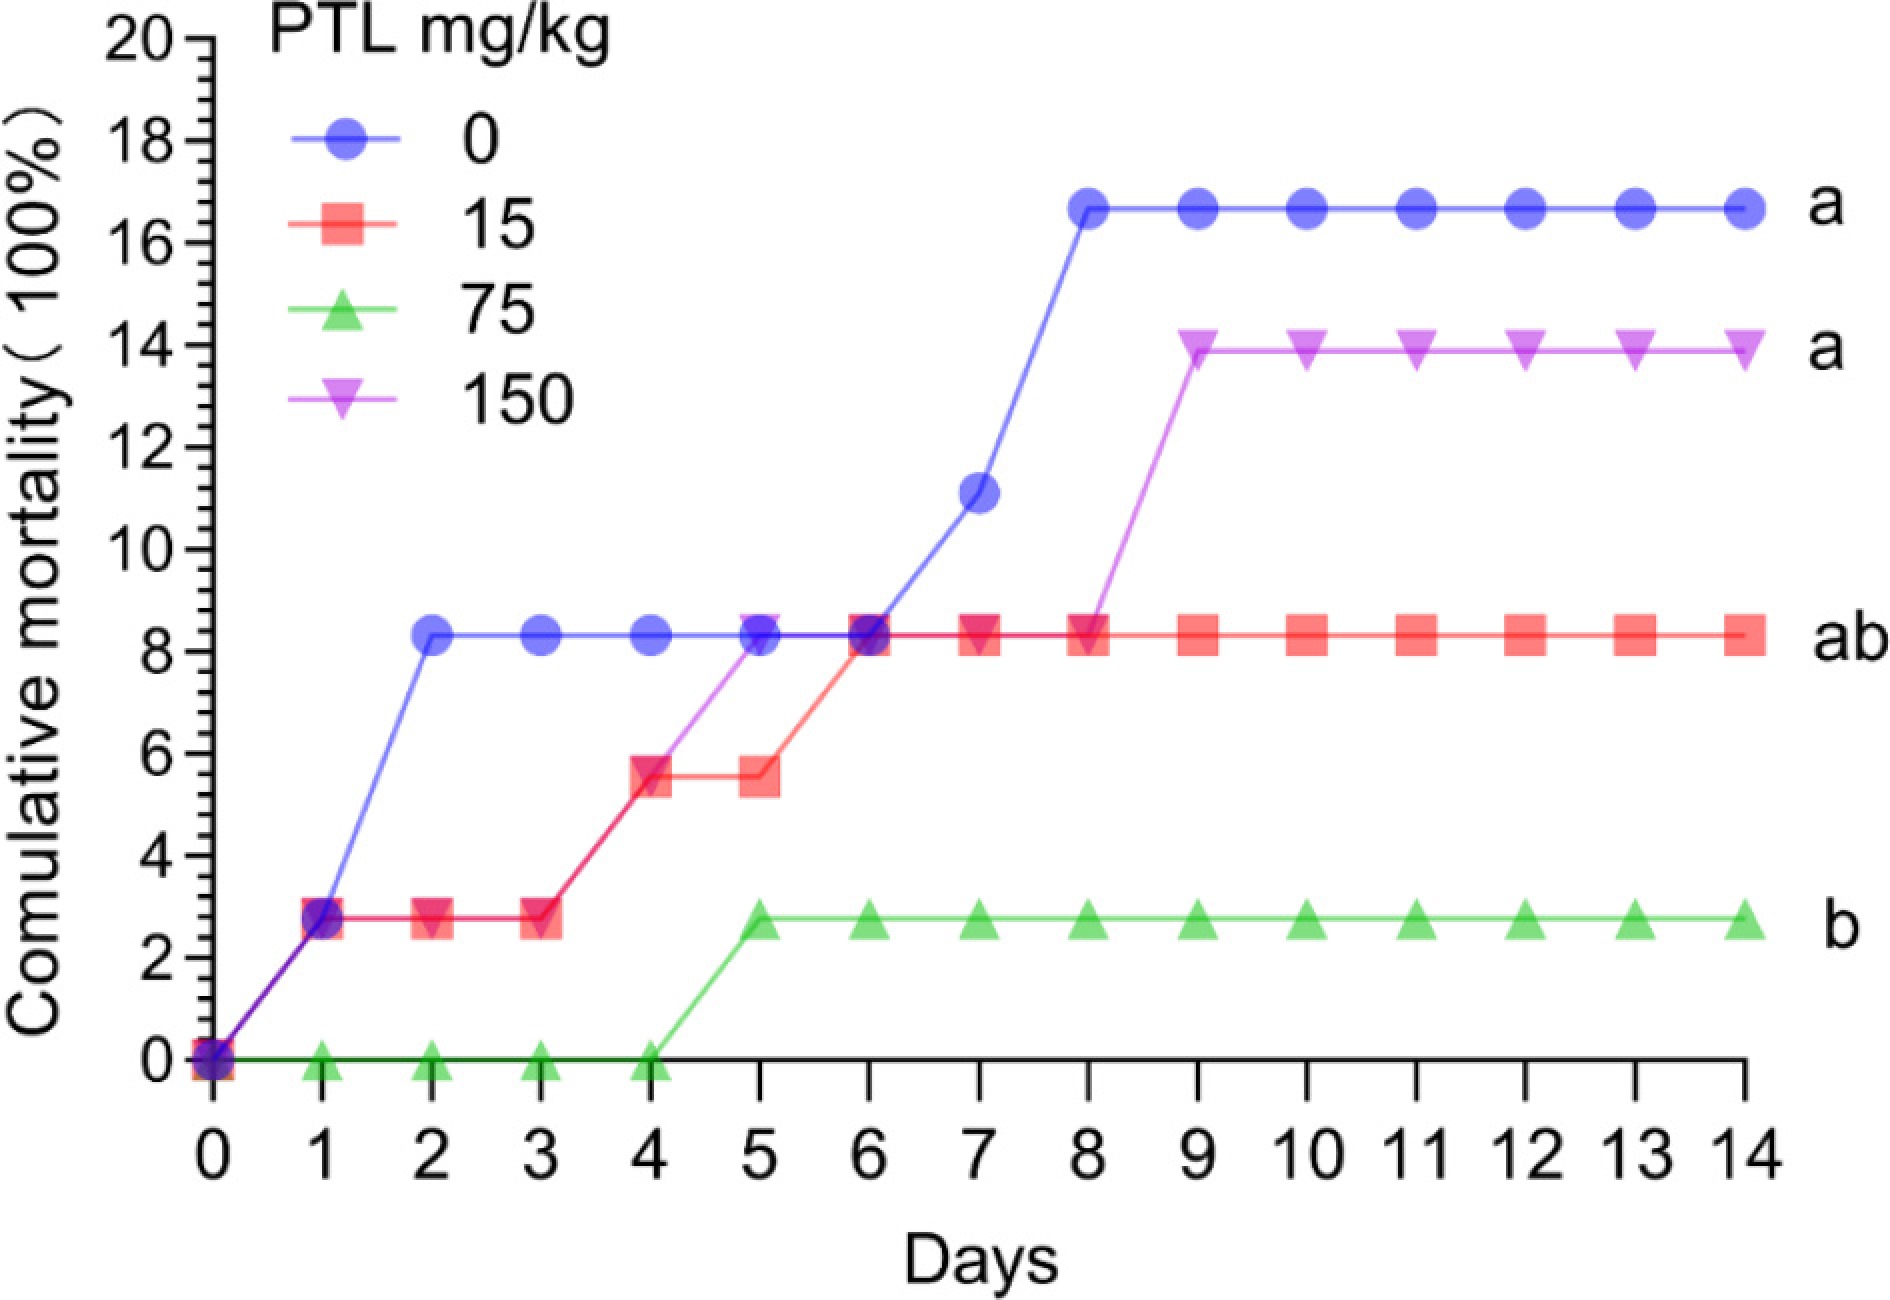
Figure 7.
Post-challenge mortality of koi carp after 7 d of dietary PTL treatment. Fish received PTL at 0, 15, 75, or 150 mg/kg before exposure to Aeromonas veronii. Data are shown as the mean ± SD (n = 3); different letters denote significant differences in the final cumulative mortality (p < 0.05).
-
PTL concentration (μg/mL) 0 (Control) 18.75 37.5 75 Swarming Diameter (cm) 0.66 ± 0.021a 0.55 ± 0.071ab 0.53 ± 0.035b 0.38 ± 0.035c Inhibition rate (%) 0 15.81 19.89 42.80 Swimming Diameter (cm) 1.28 ± 0.035a 0.70 ± 0.071b 0.63 ± 0.021b 0.33 ± 0.035c Inhibition rate (%) 0 45.15 50.98 74.46 Note: Values are presented as mean ± SD (n = 3). Within each row, entries bearing different superscript letters differ significantly (p < 0.05). Table 1.
Influence of PTL on the swarming and swimming behavior of Aeromonas veronii.
Figures
(7)
Tables
(1)