-
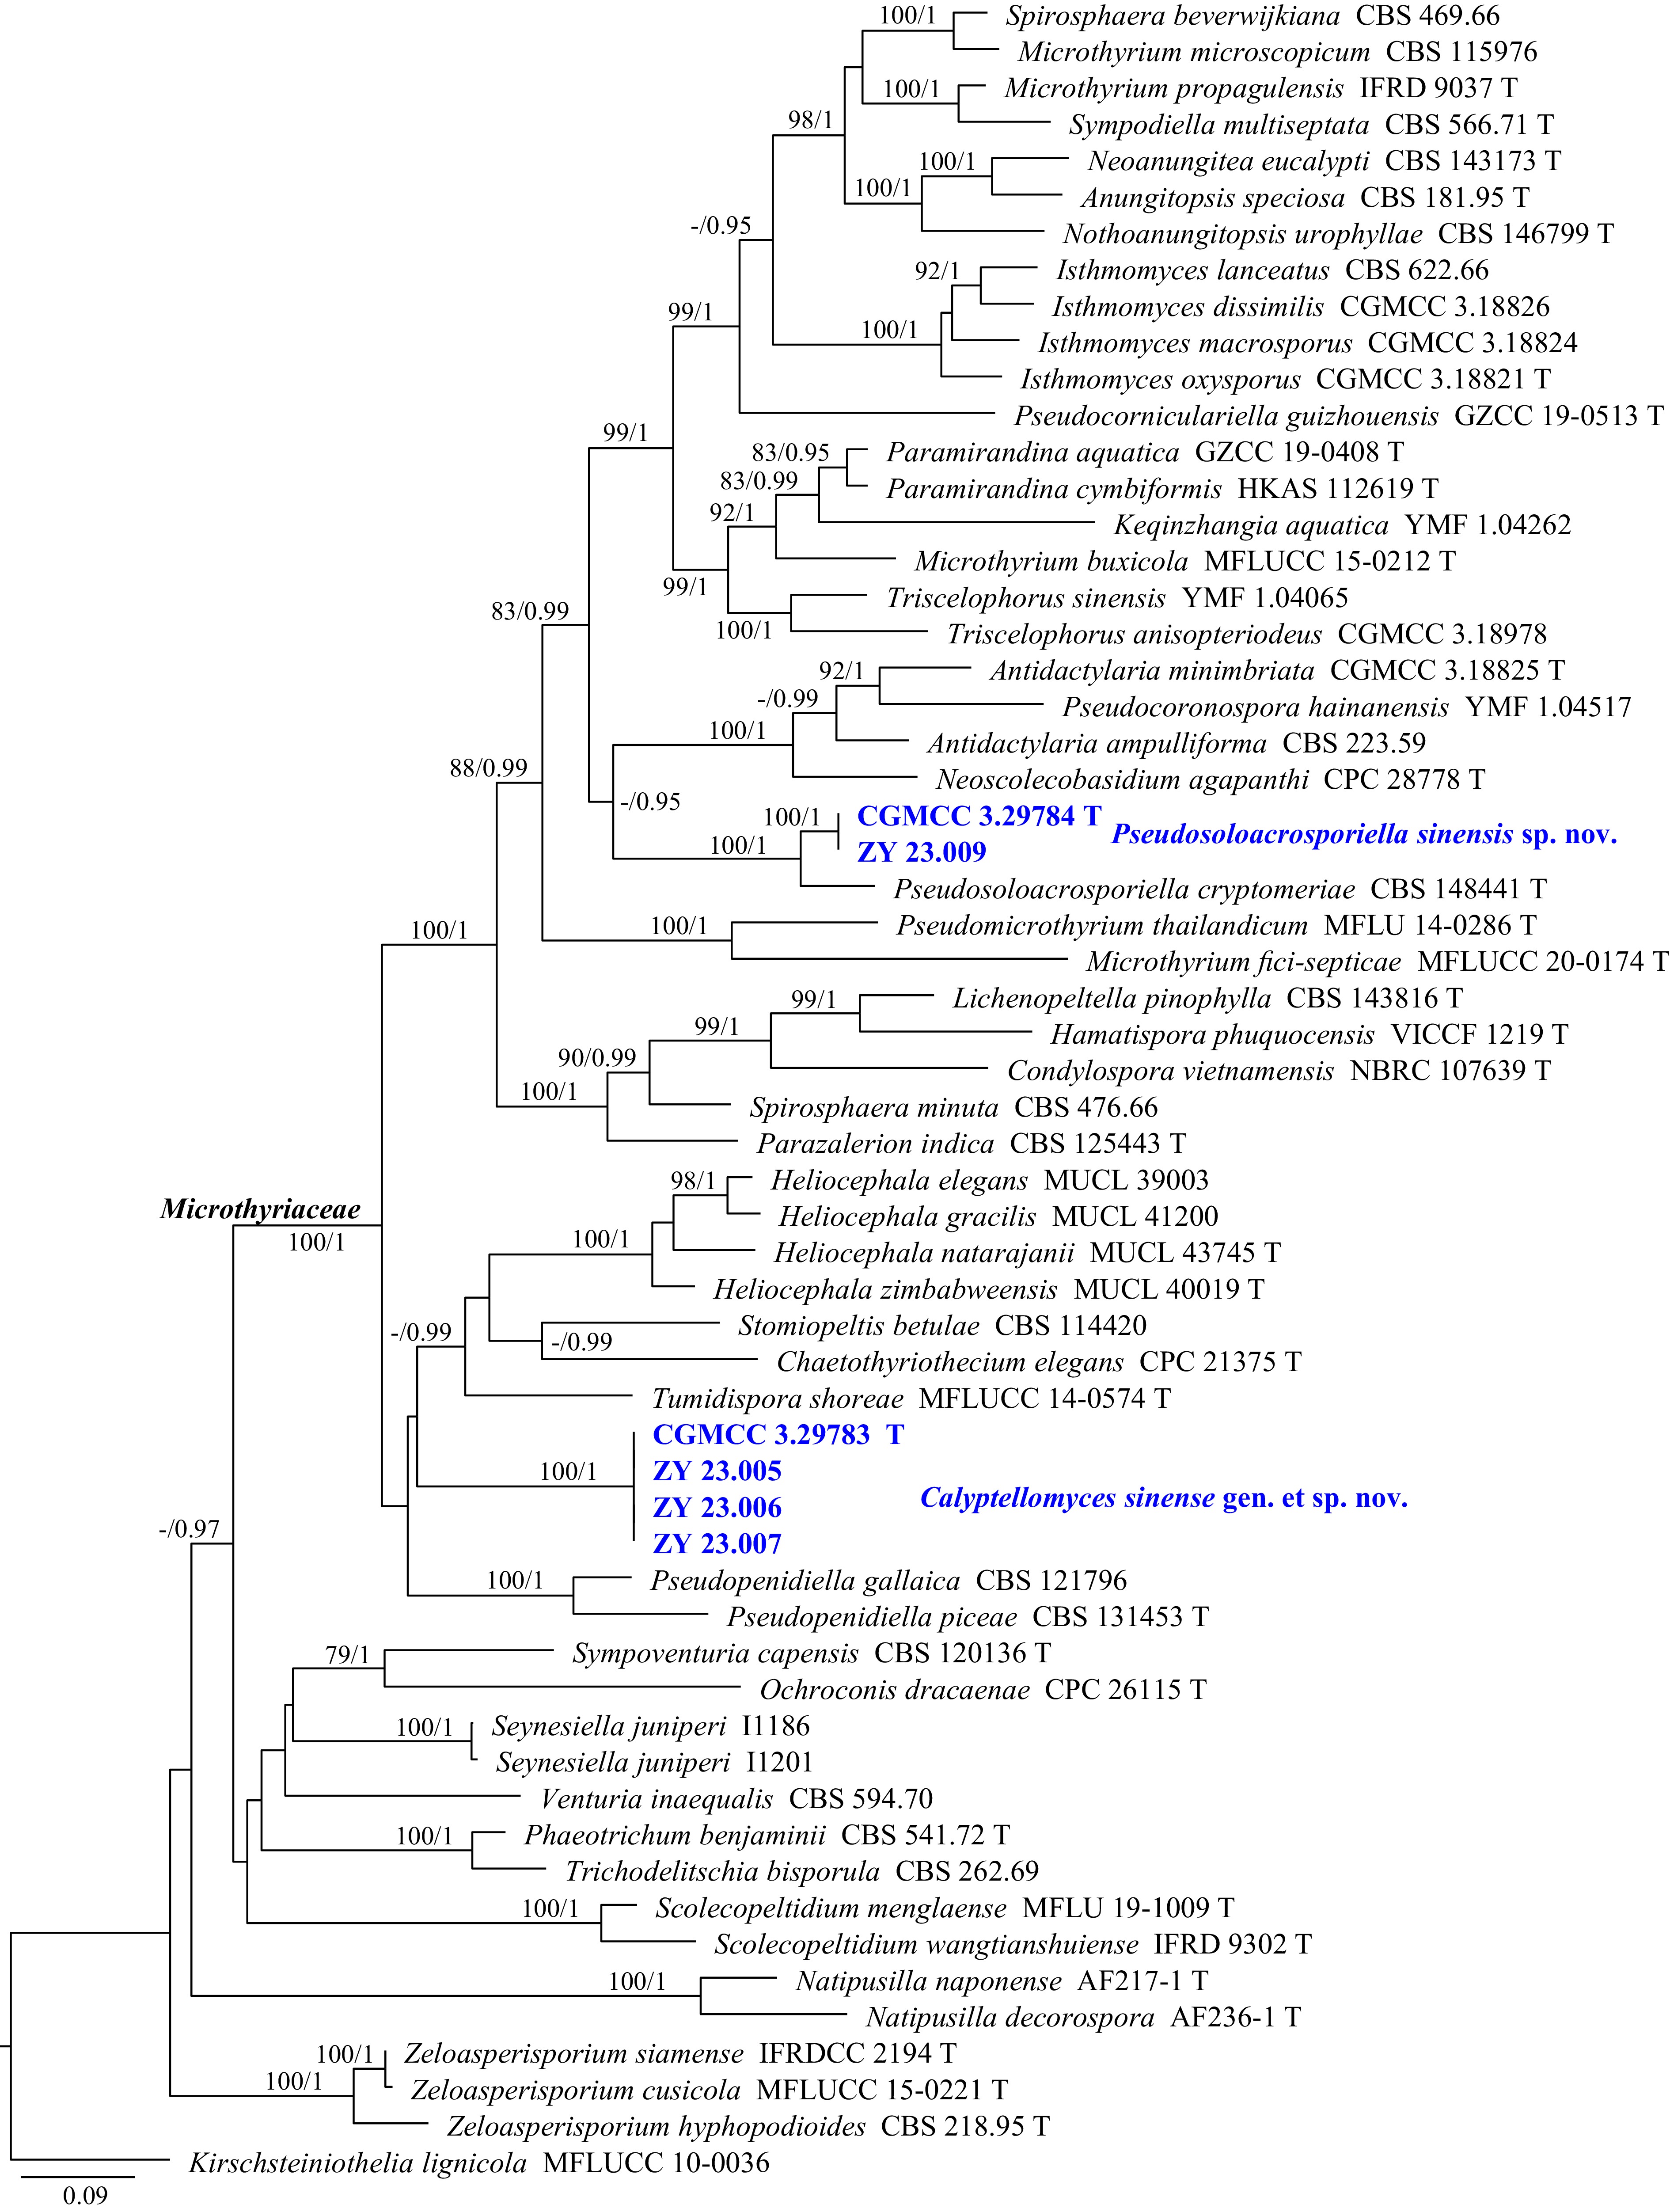
Figure 1.
Phylogram generated from ML analysis based on the combined dataset of ITS and LSU sequence data. Numbers at branches indicate support values (IQ-TREE-BS/BI-PP) above 70%/0.90. The tree is rooted to Kirschsteiniothelia lignicola (MFLUCC 10-0036). Newly generated sequences are in bold and blue, and 'T' indicates type-derived sequences. The scale bar represents the expected number of changes per site.
-
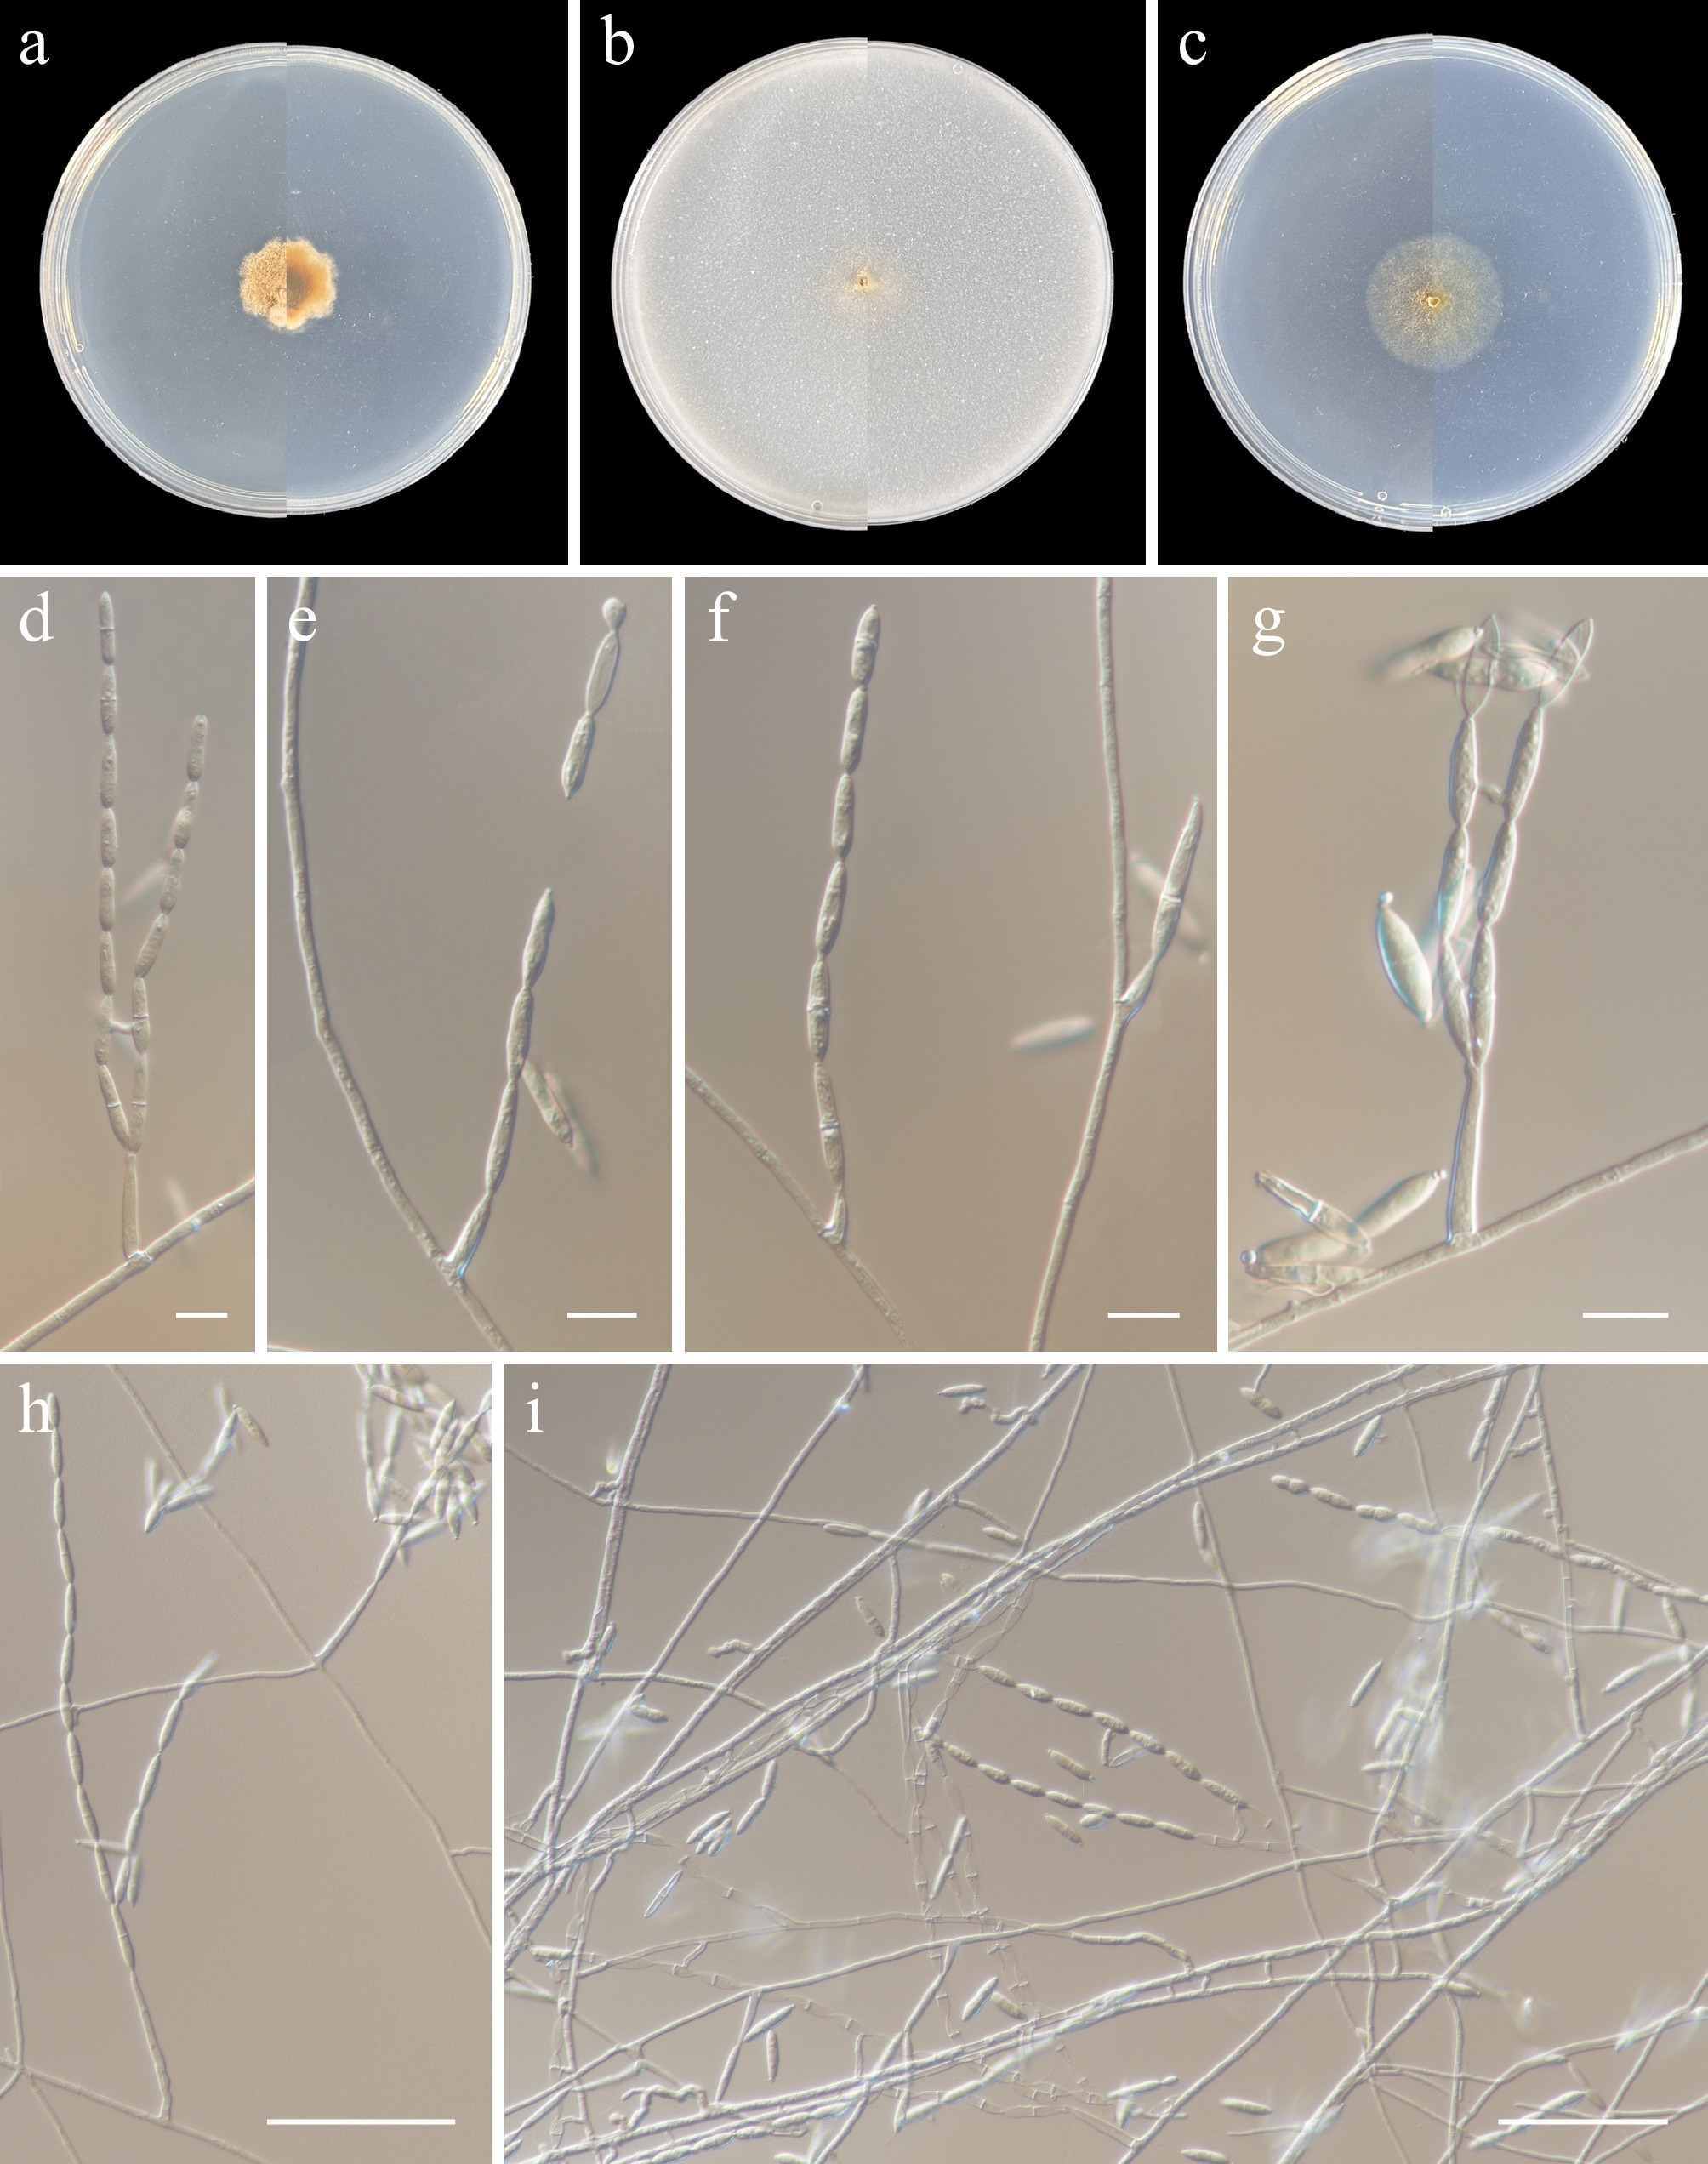
Figure 2.
Pseudosoloacrosporiella sinensis (from holotype ZY H-23.008). (a)–(c) Upper and reverse views of cultures on PDA, OA, and SNA after 14 d at 25 °C. (d)–(i) Conidiogenous cells and conidia. Scale bars: (d), (g) 10 μm, (h), (i), 50 μm.
-
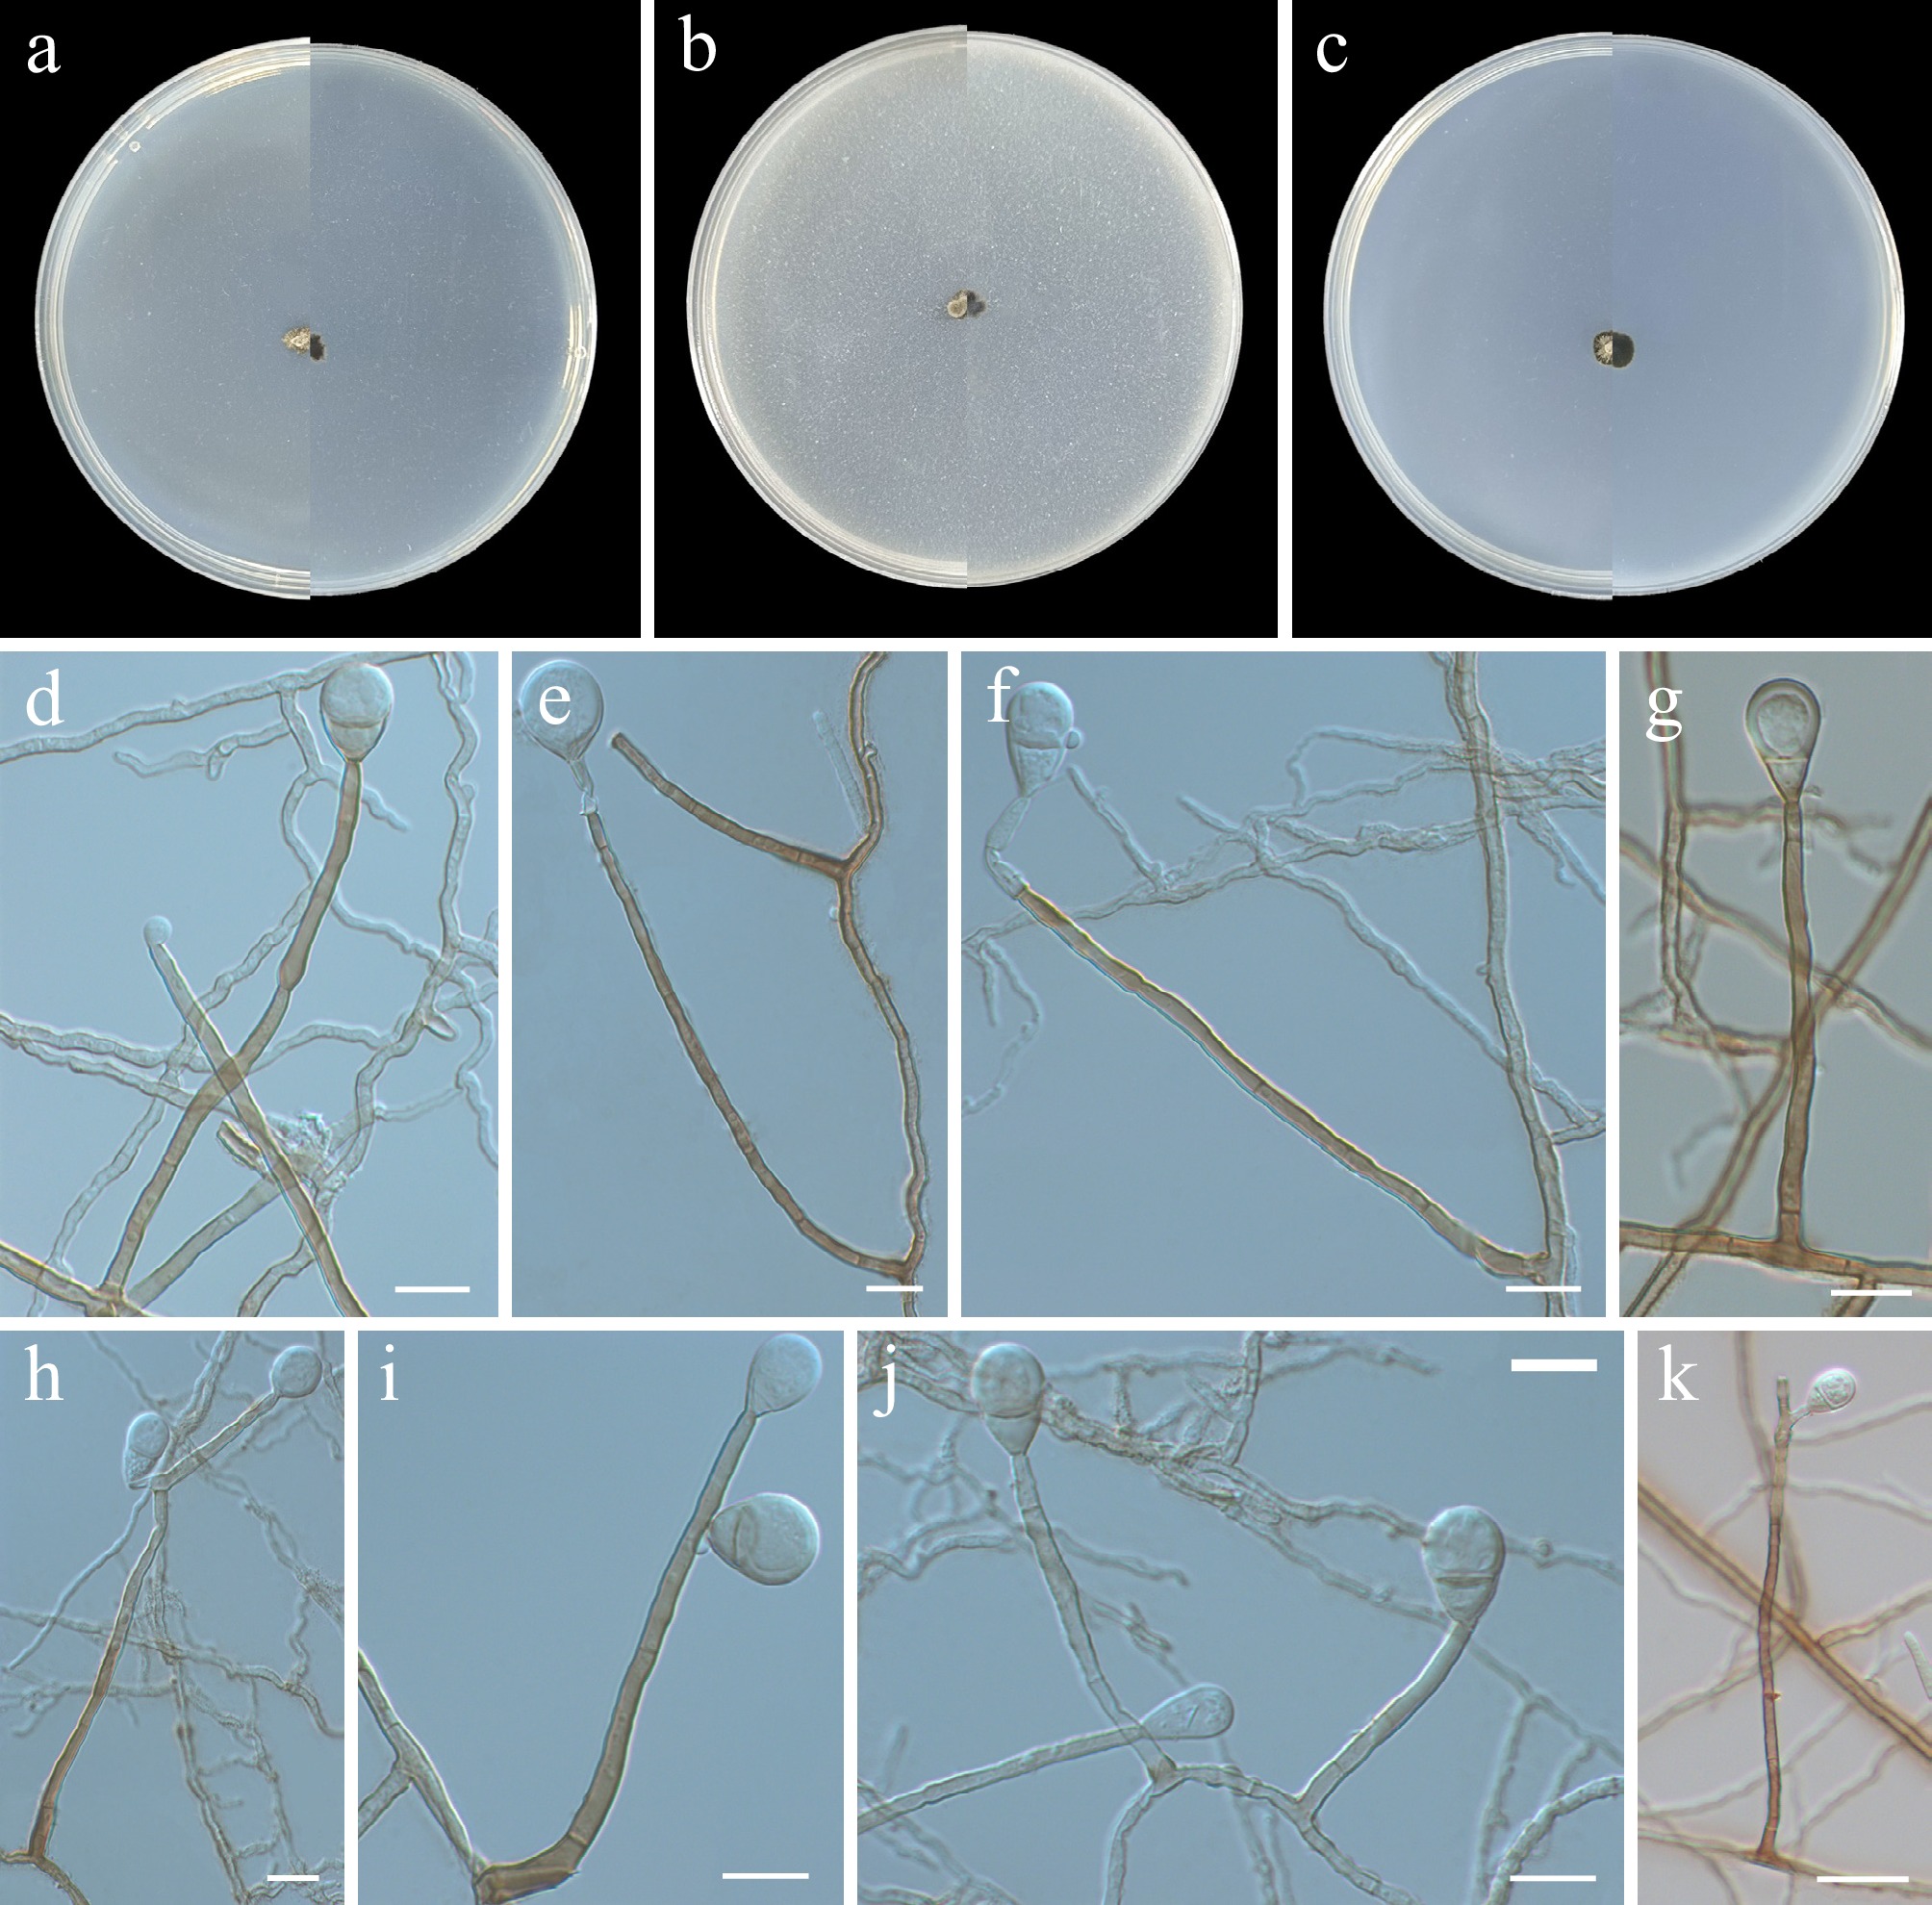
Figure 3.
Calyptellomyces sinensis (from holotype ZY H-23.004). (a)–(c) Upper and reverse views of cultures on PDA, OA, and SNA after 14 d at 25 °C. (d)–(k) Conidiophores, conidiogenous cells, and conidia. Scale bars: (d)–(j) 10 μm, (k) 20 μm.
-
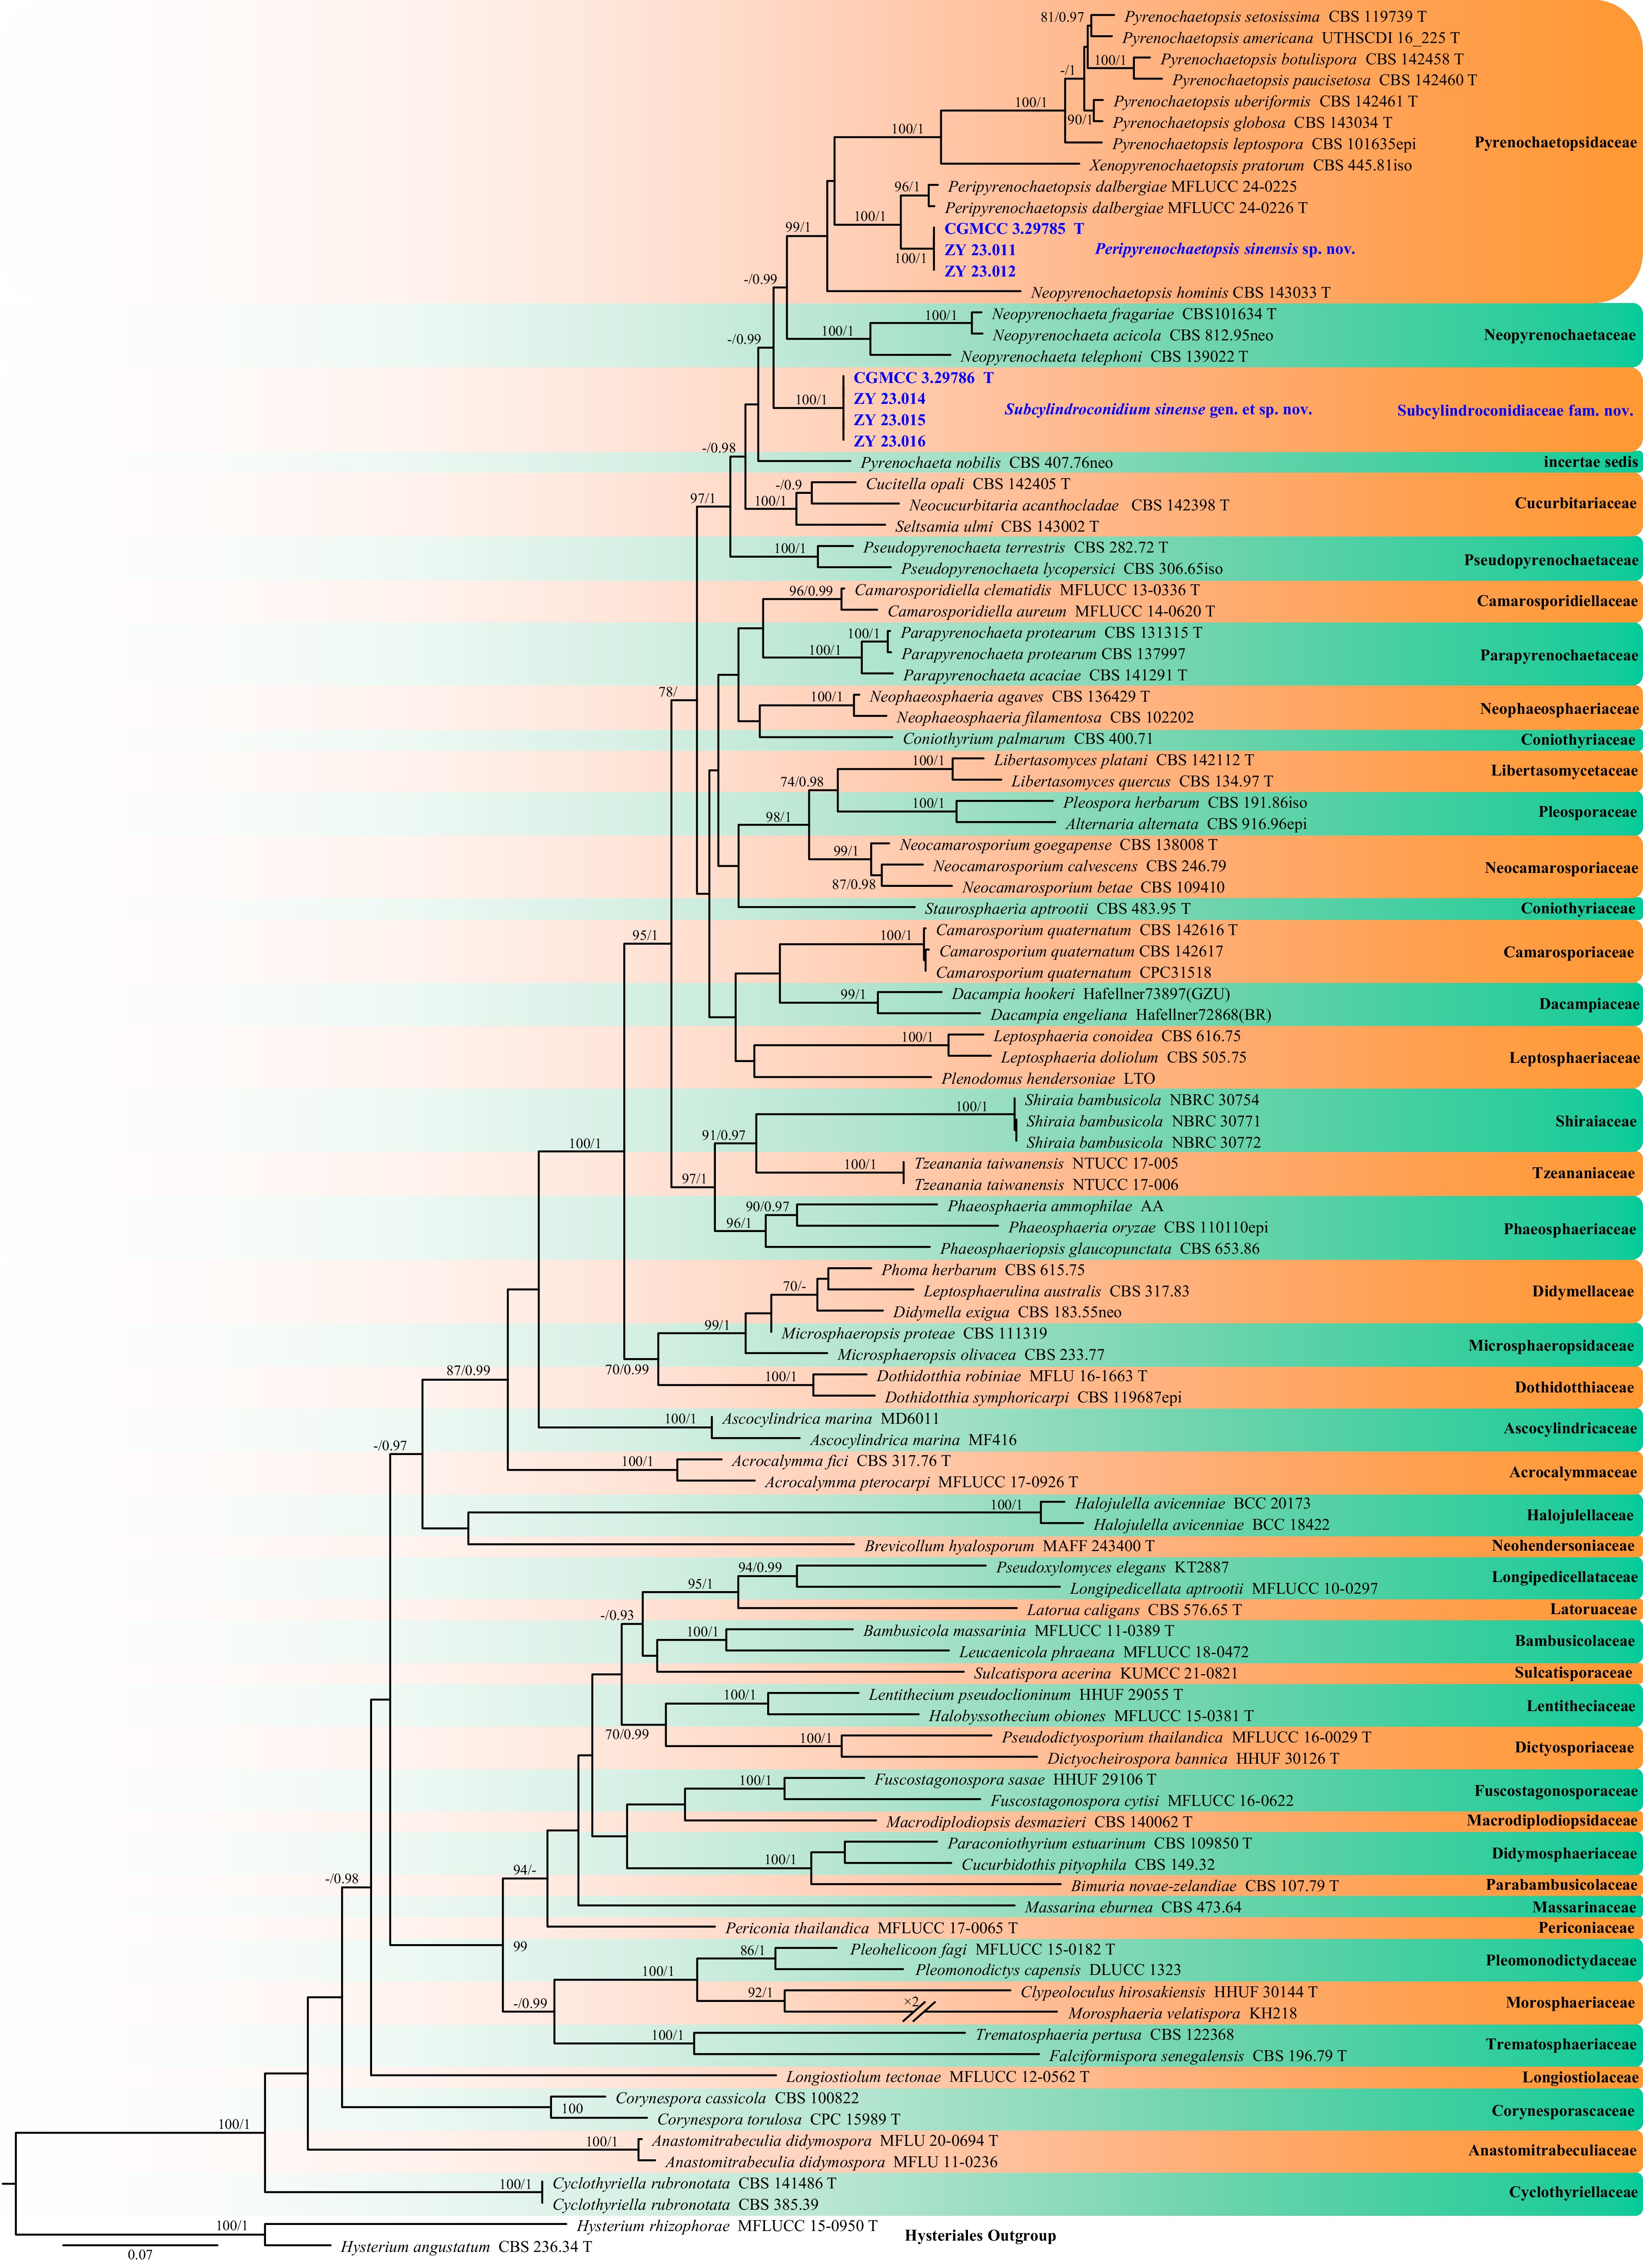
Figure 4.
Phylogram generated from ML analysis based on the combined dataset of SSU, ITS, LSU, TEF1, RPB2, and TUB sequence data. Numbers at branches indicate support values (IQ-TREE-BS/BI-PP) above 70%/0.90. The tree is rooted to Hysterium angustatum (CBS 236.34) and H. rhizophorae (MFLUCC 15-0950). Newly generated sequences are in bold and blue, and 'T' indicates type-derived sequences. The scale bar represents the expected number of changes per site.
-
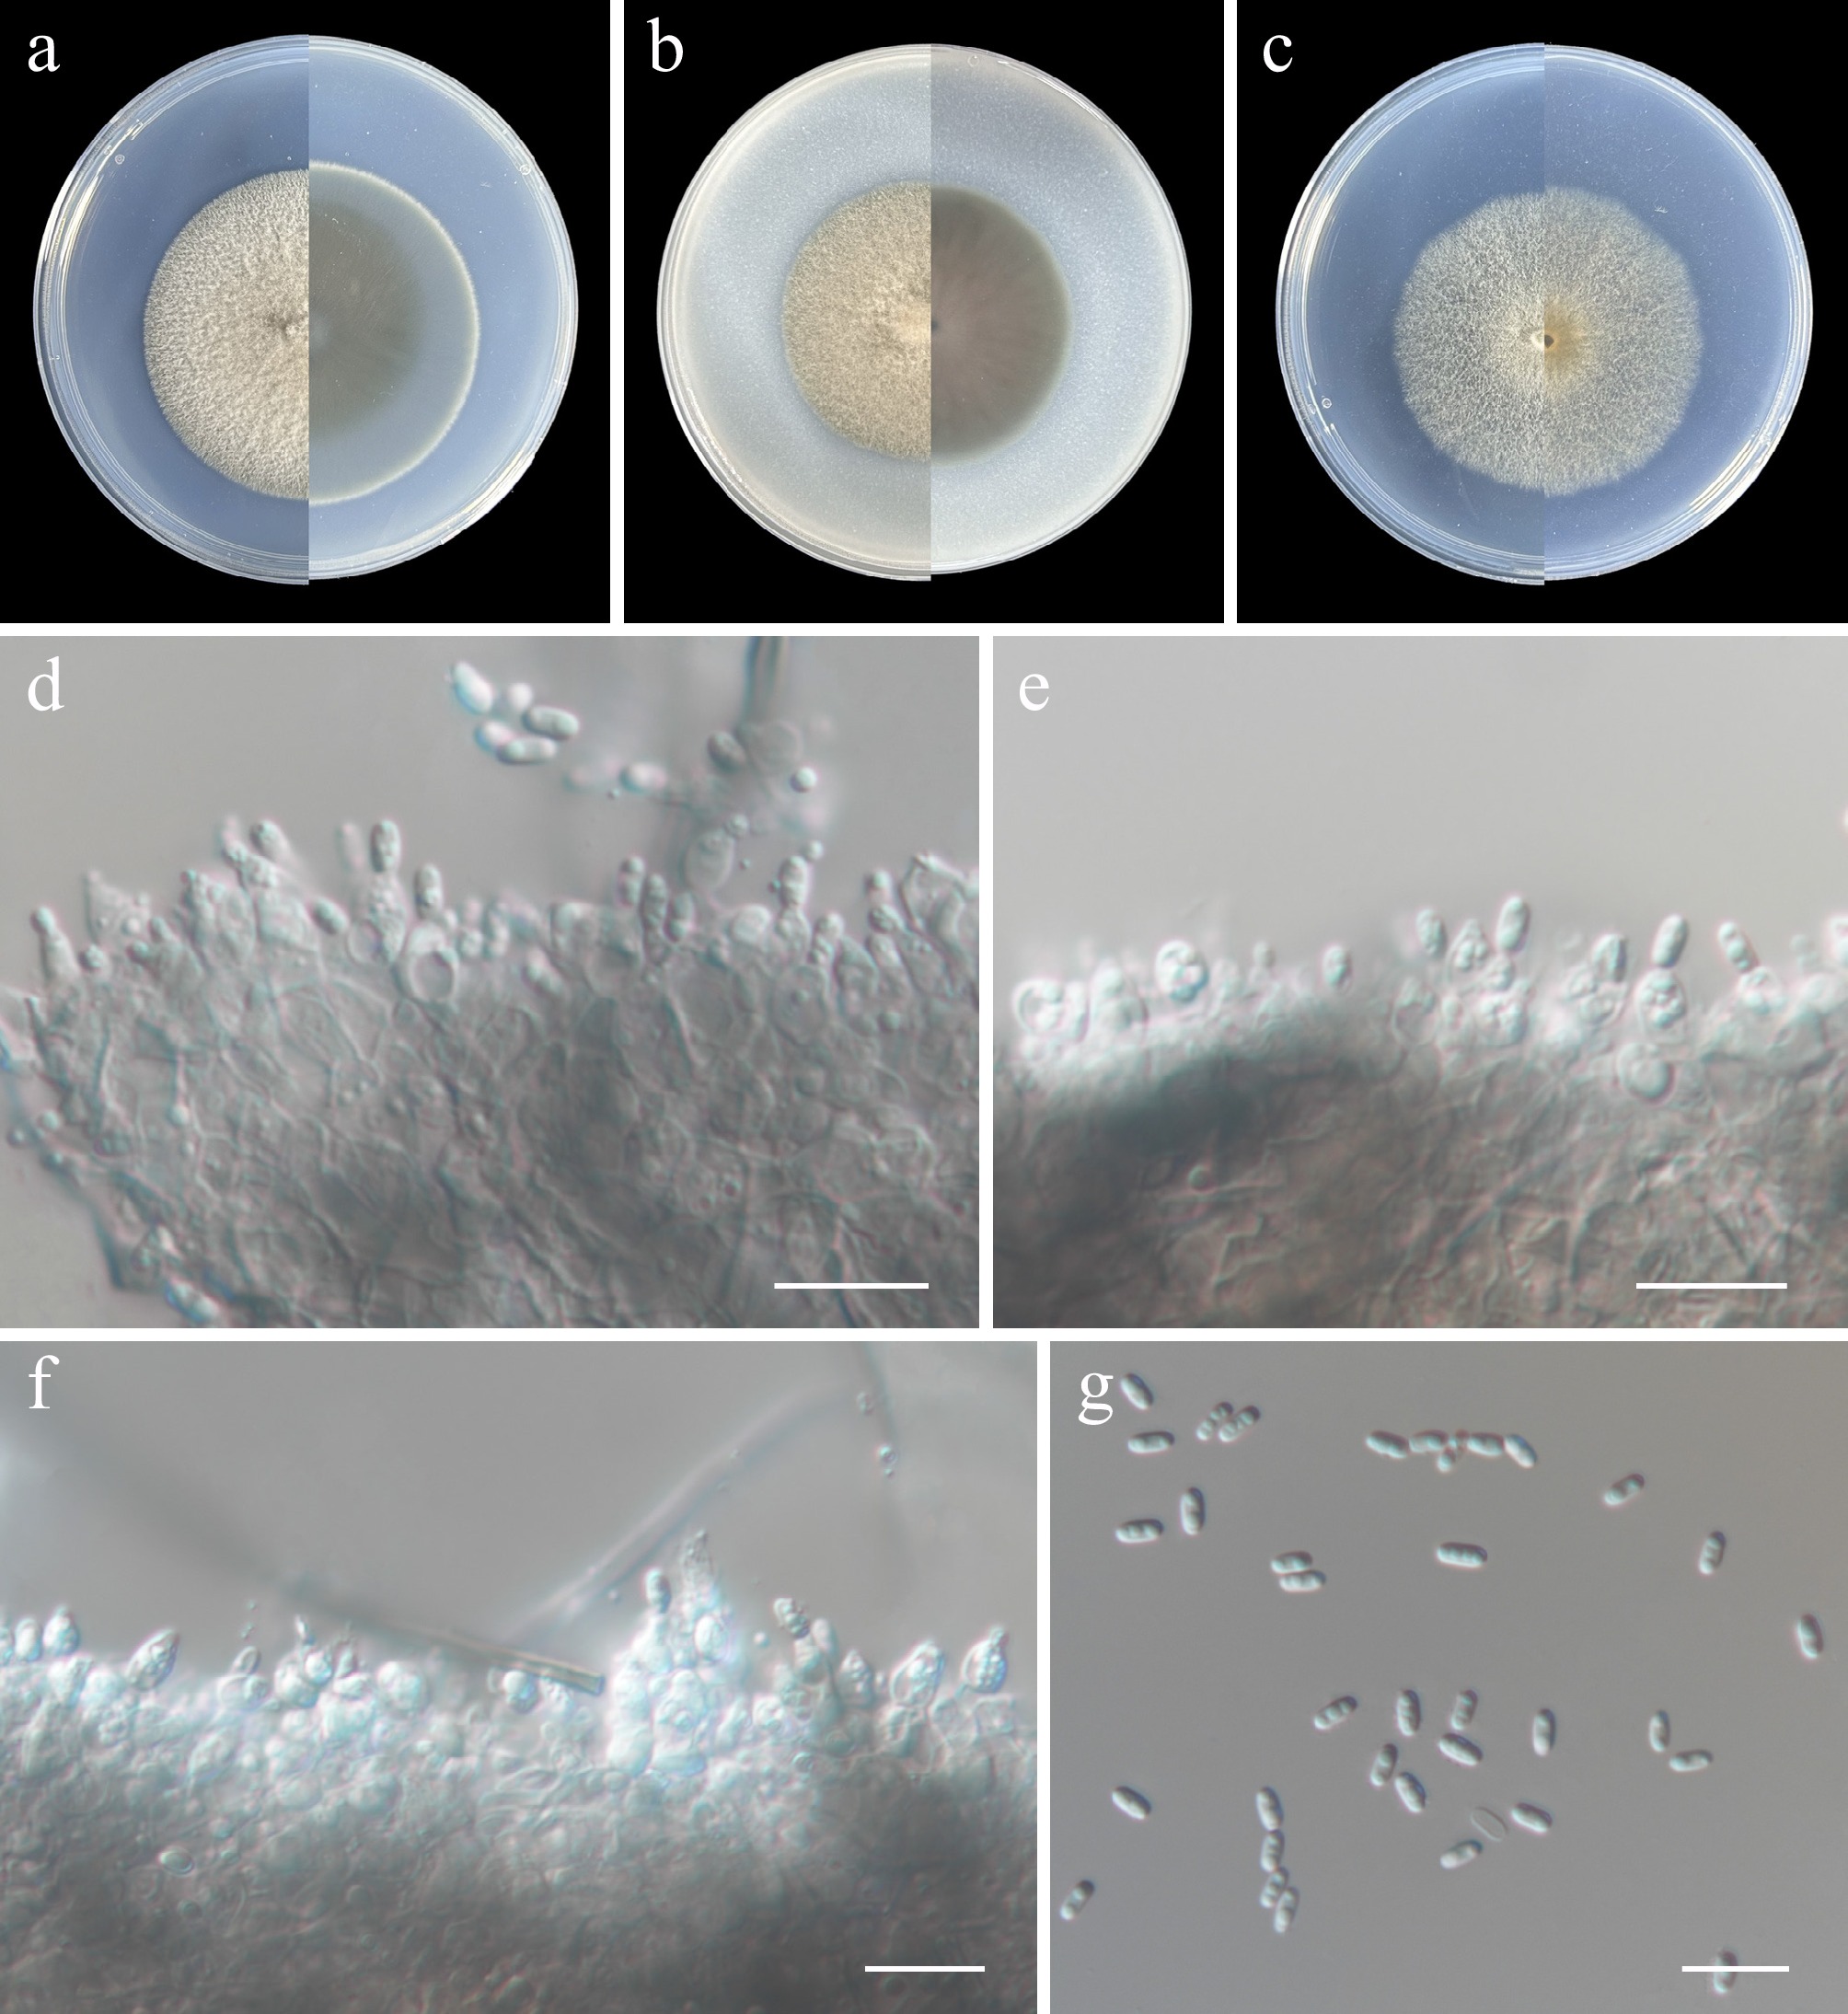
Figure 5.
Peripyrenochaetopsis sinensis (from holotype ZY H-23.010). (a)–(c) Upper and reverse views of cultures on PDA, OA, and SNA after 14 d at 25 °C. (d)–(f) Conidiogenous cells, conidia, and conidiomatal wall. (g) Conidia. Scale bars: (d)–(g) 10 μm.
-
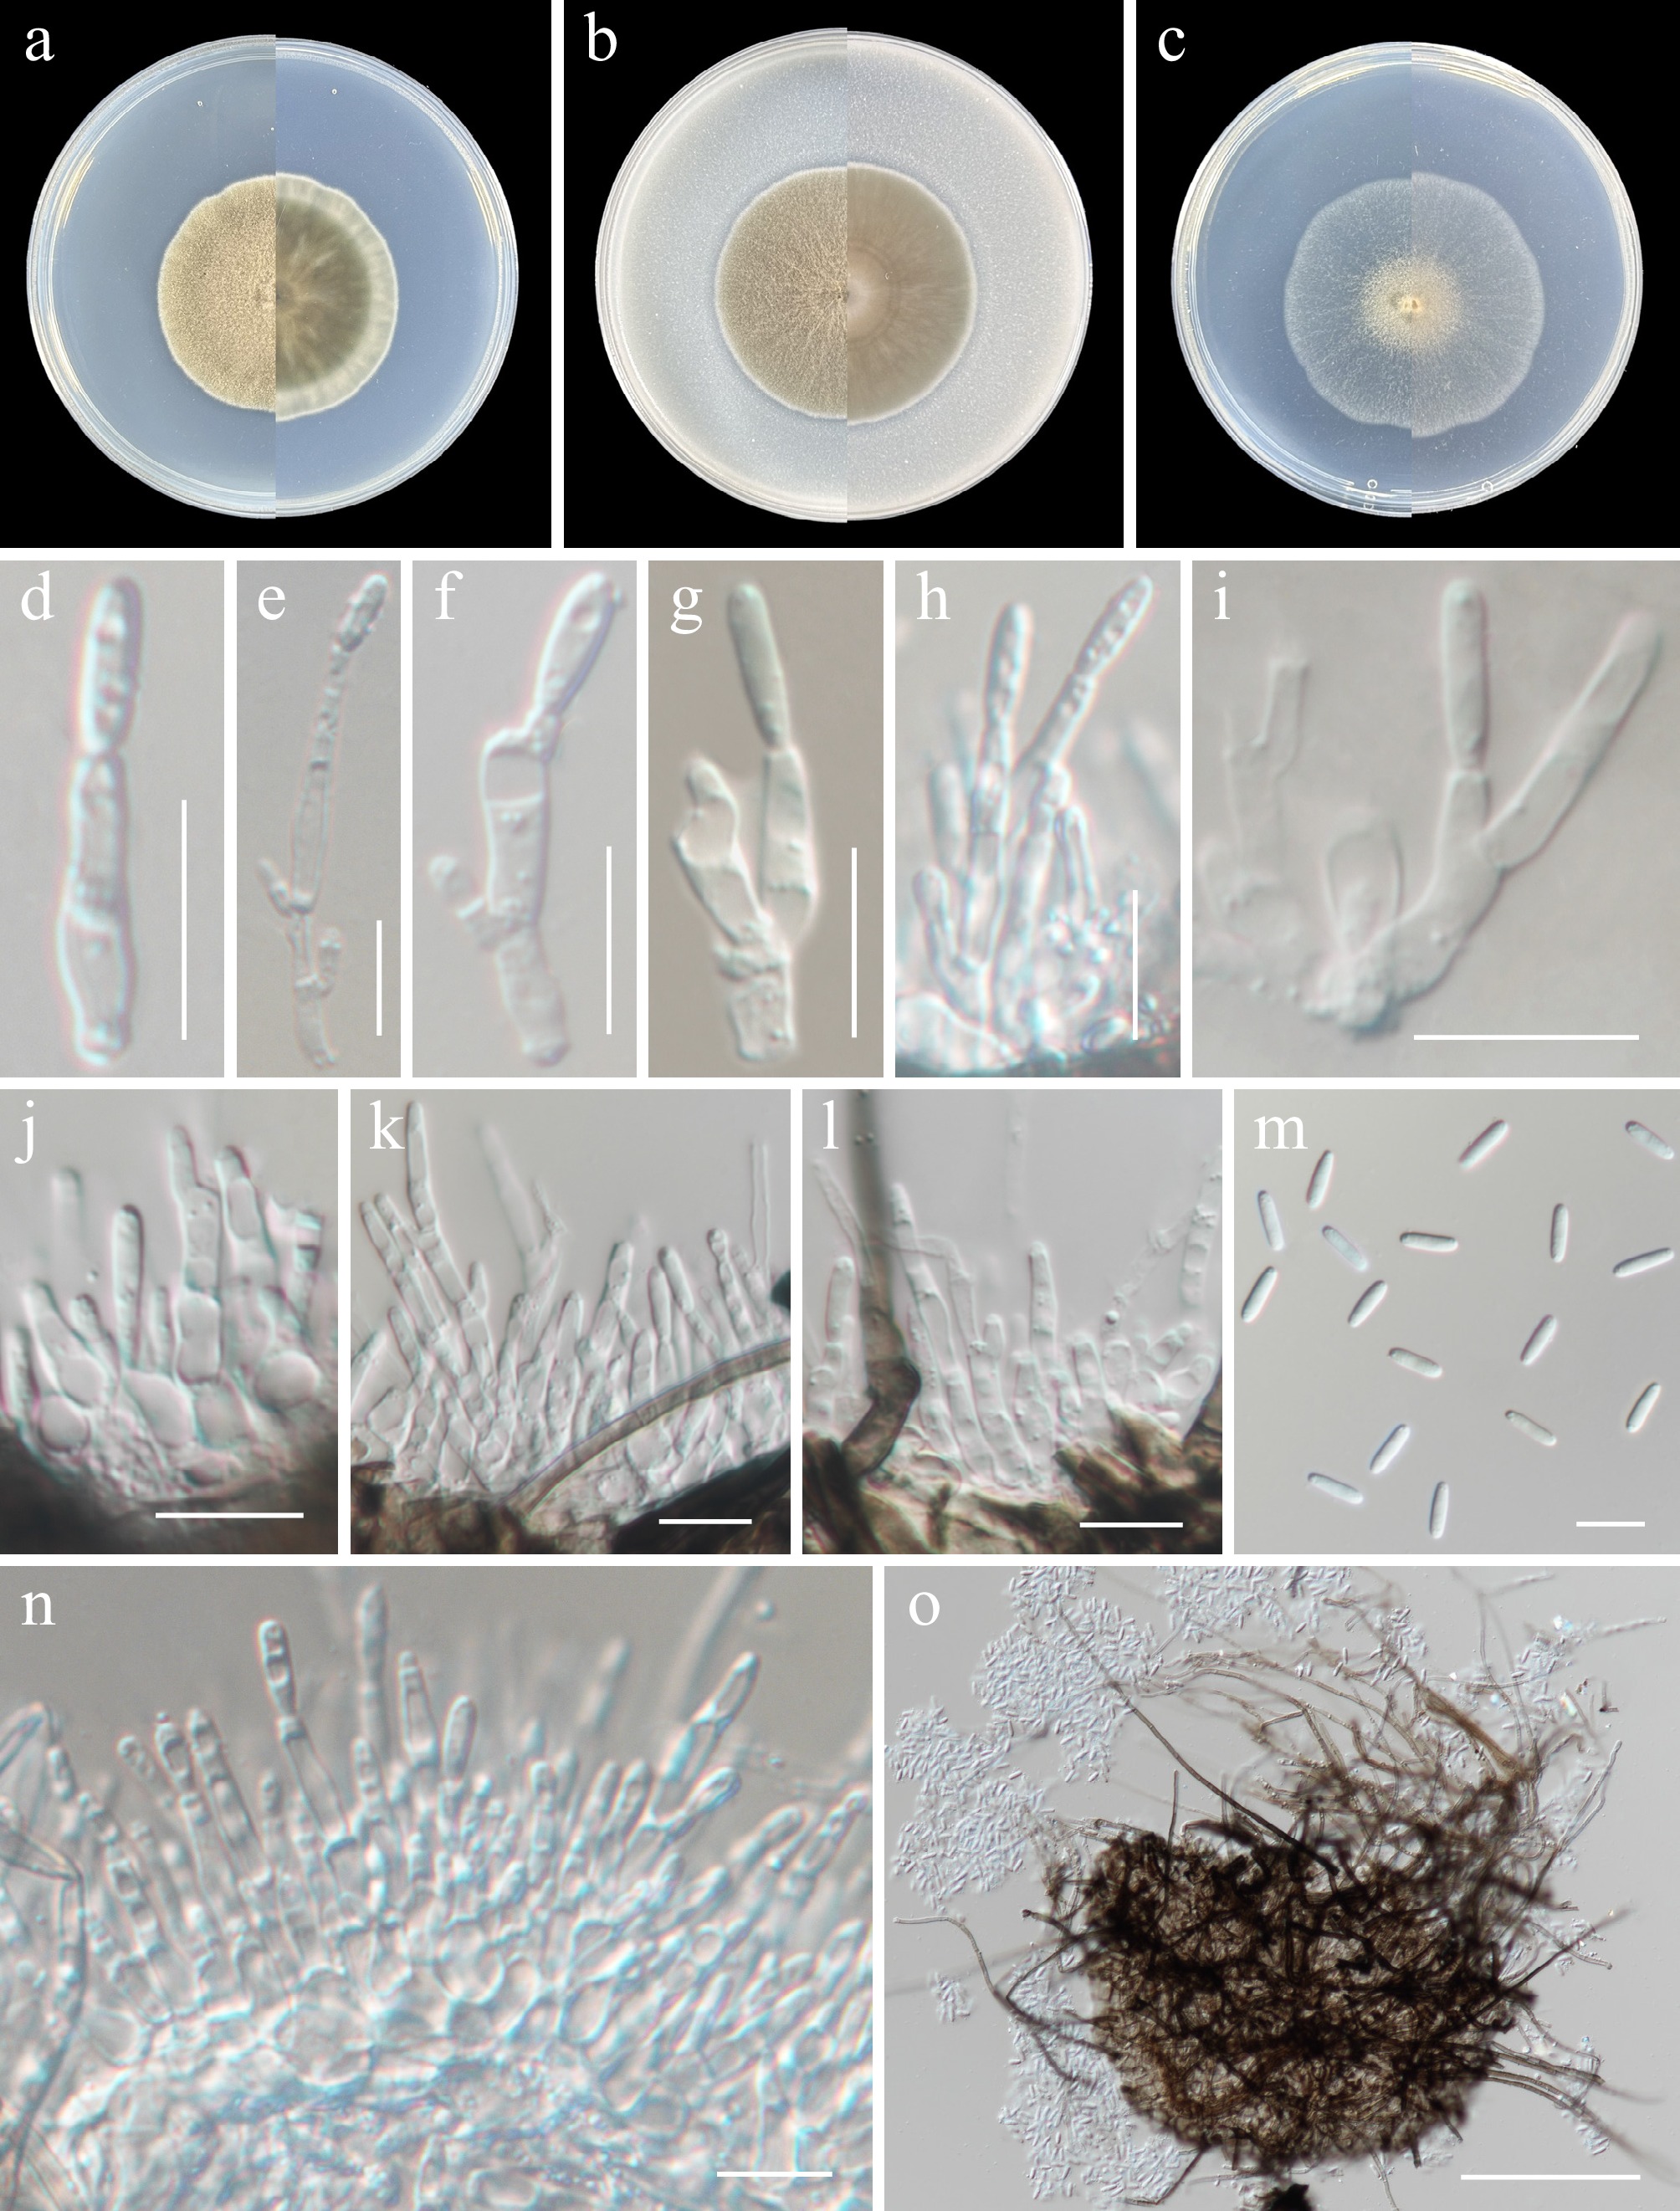
Figure 6.
Subcylindroconidium sinense (from holotype ZY H-23.013). (a)–(c) Upper and reverse views of cultures on PDA, OA, and SNA after 14 d at 25 °C. (d)–(l), (n) Conidiogenous cells. (m) Conidia. (o) Pycnidia. Scale bars: (d)–(g) 10 μm.
-
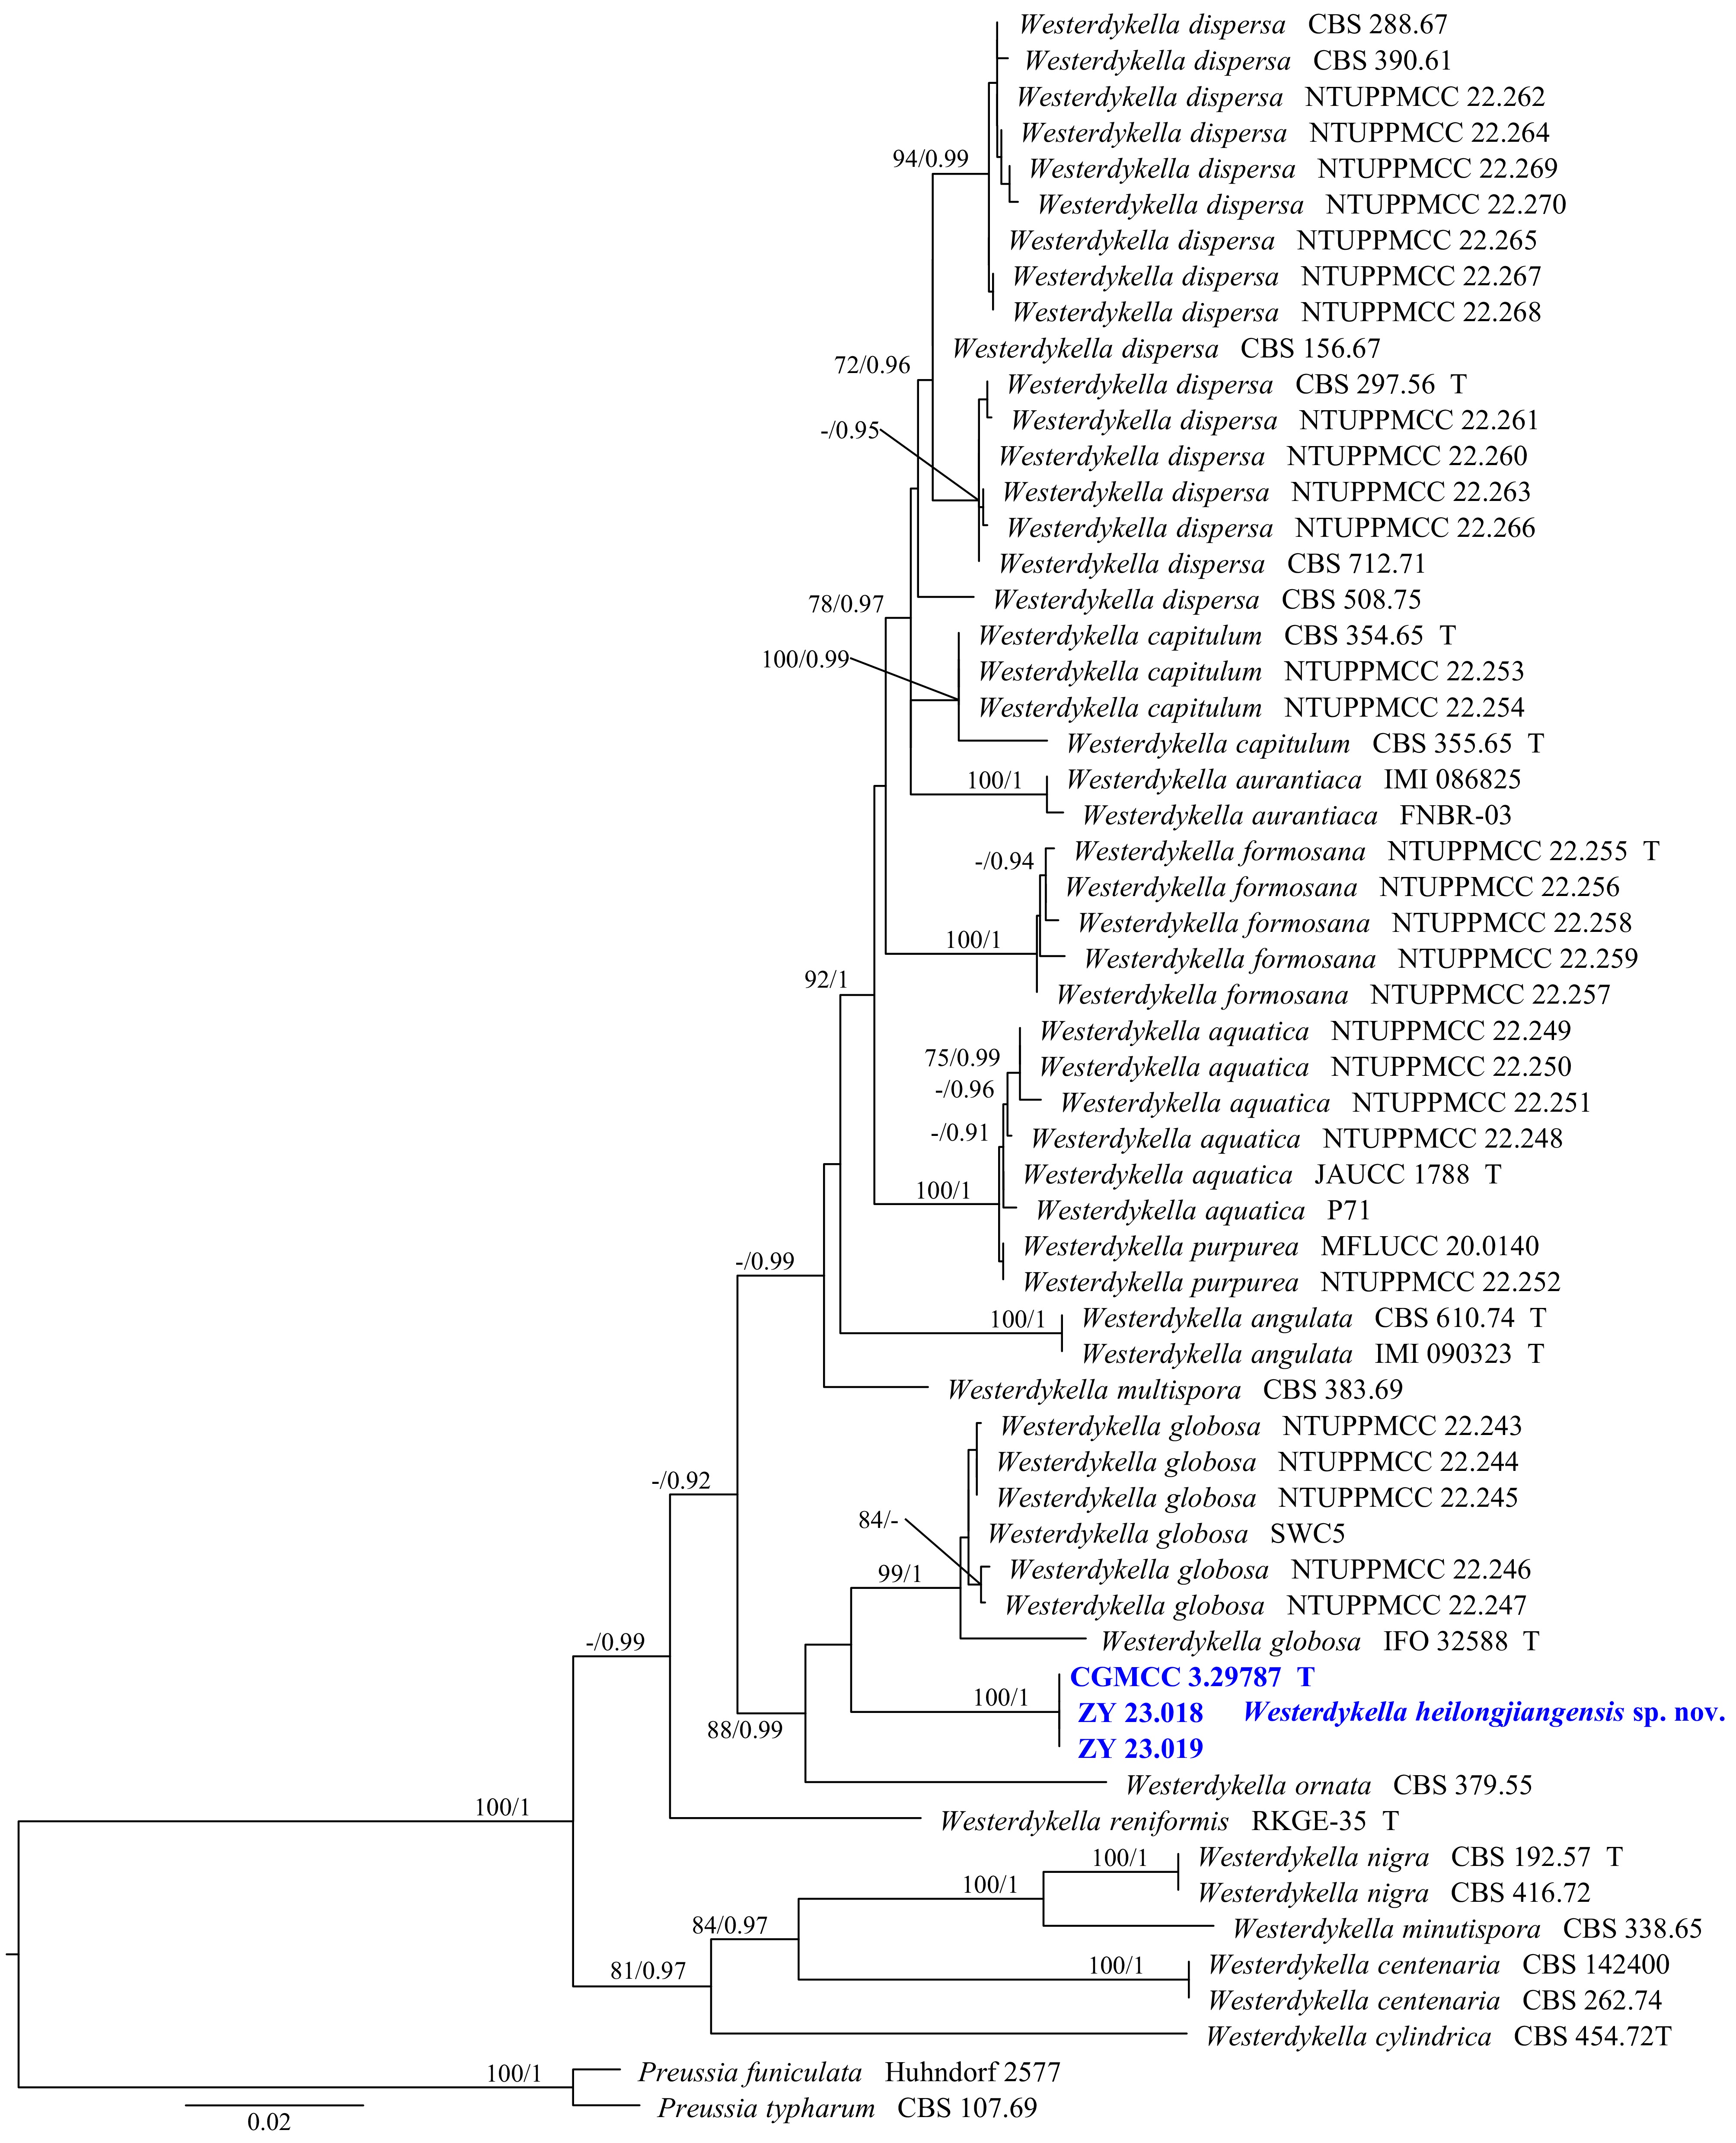
Figure 7.
Phylogram generated from ML analysis based on the combined dataset of ITS, LSU, and TUB sequence data. Numbers at branches indicate support values (IQ-TREE-BS/BI-PP) above 70%/0.90. The tree is rooted to Preussia funiculata (Huhndorf 2577) and P. typharum (CBS 107.69). Newly generated sequences are in bold and blue, and 'T' indicates type-derived sequences. The scale bar represents the expected number of changes per site.
-
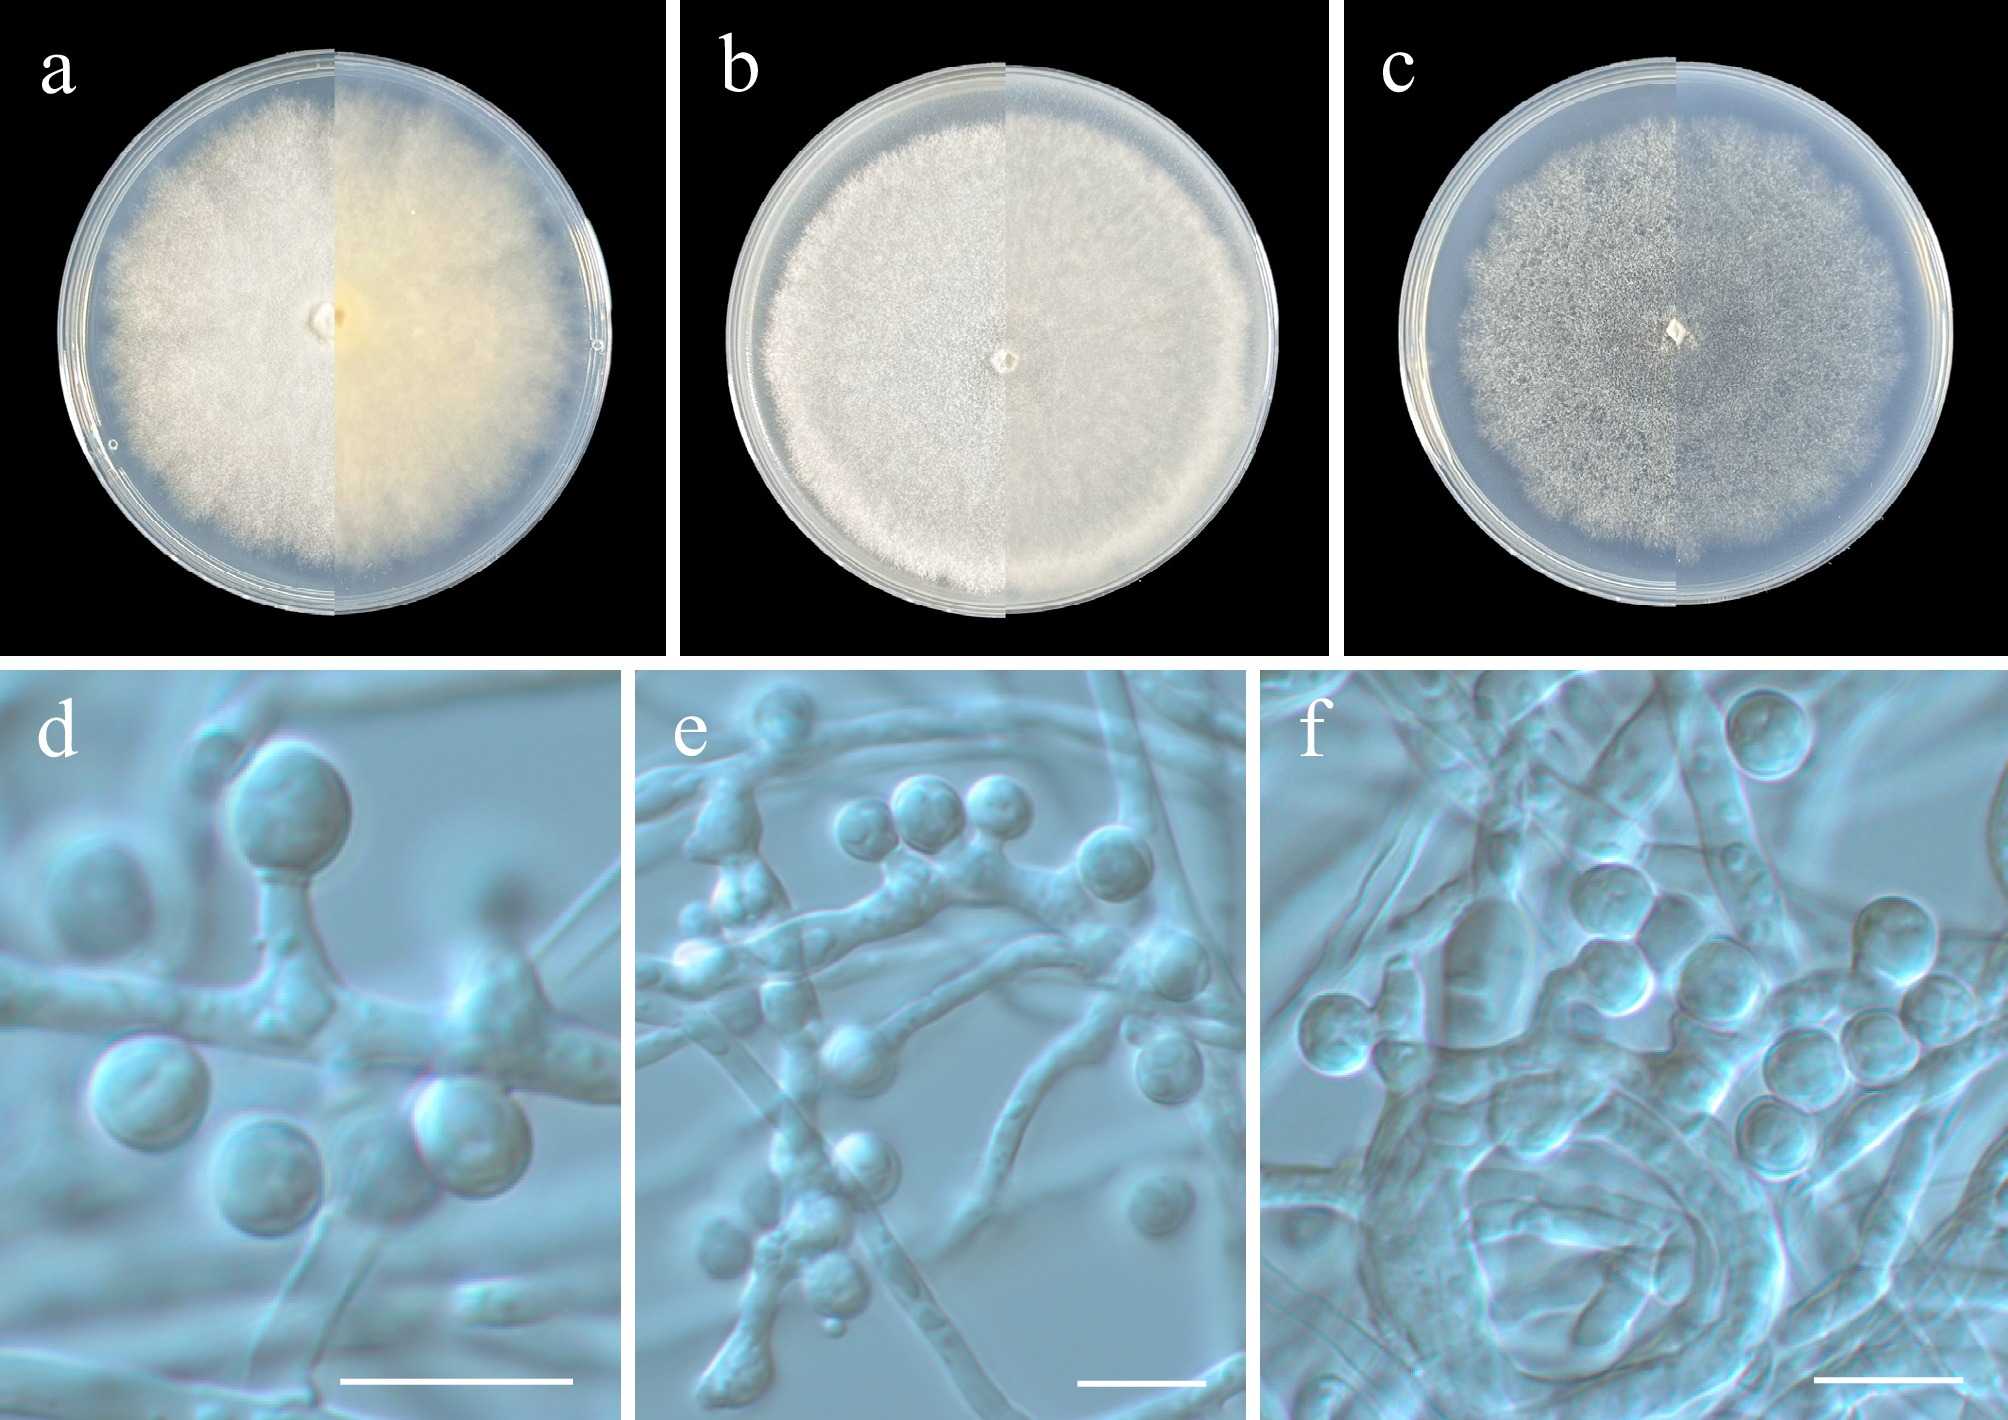
Figure 8.
Westerdykella heilongjiangensis (from holotype ZY H-23.017). (a)–(c) Upper and reverse views of cultures on PDA, OA, and SNA after 14 d at 25 °C. (d)–(f) Conidiogenous cells and conidia. Scale bars: (d)-(f) 10 μm.
-
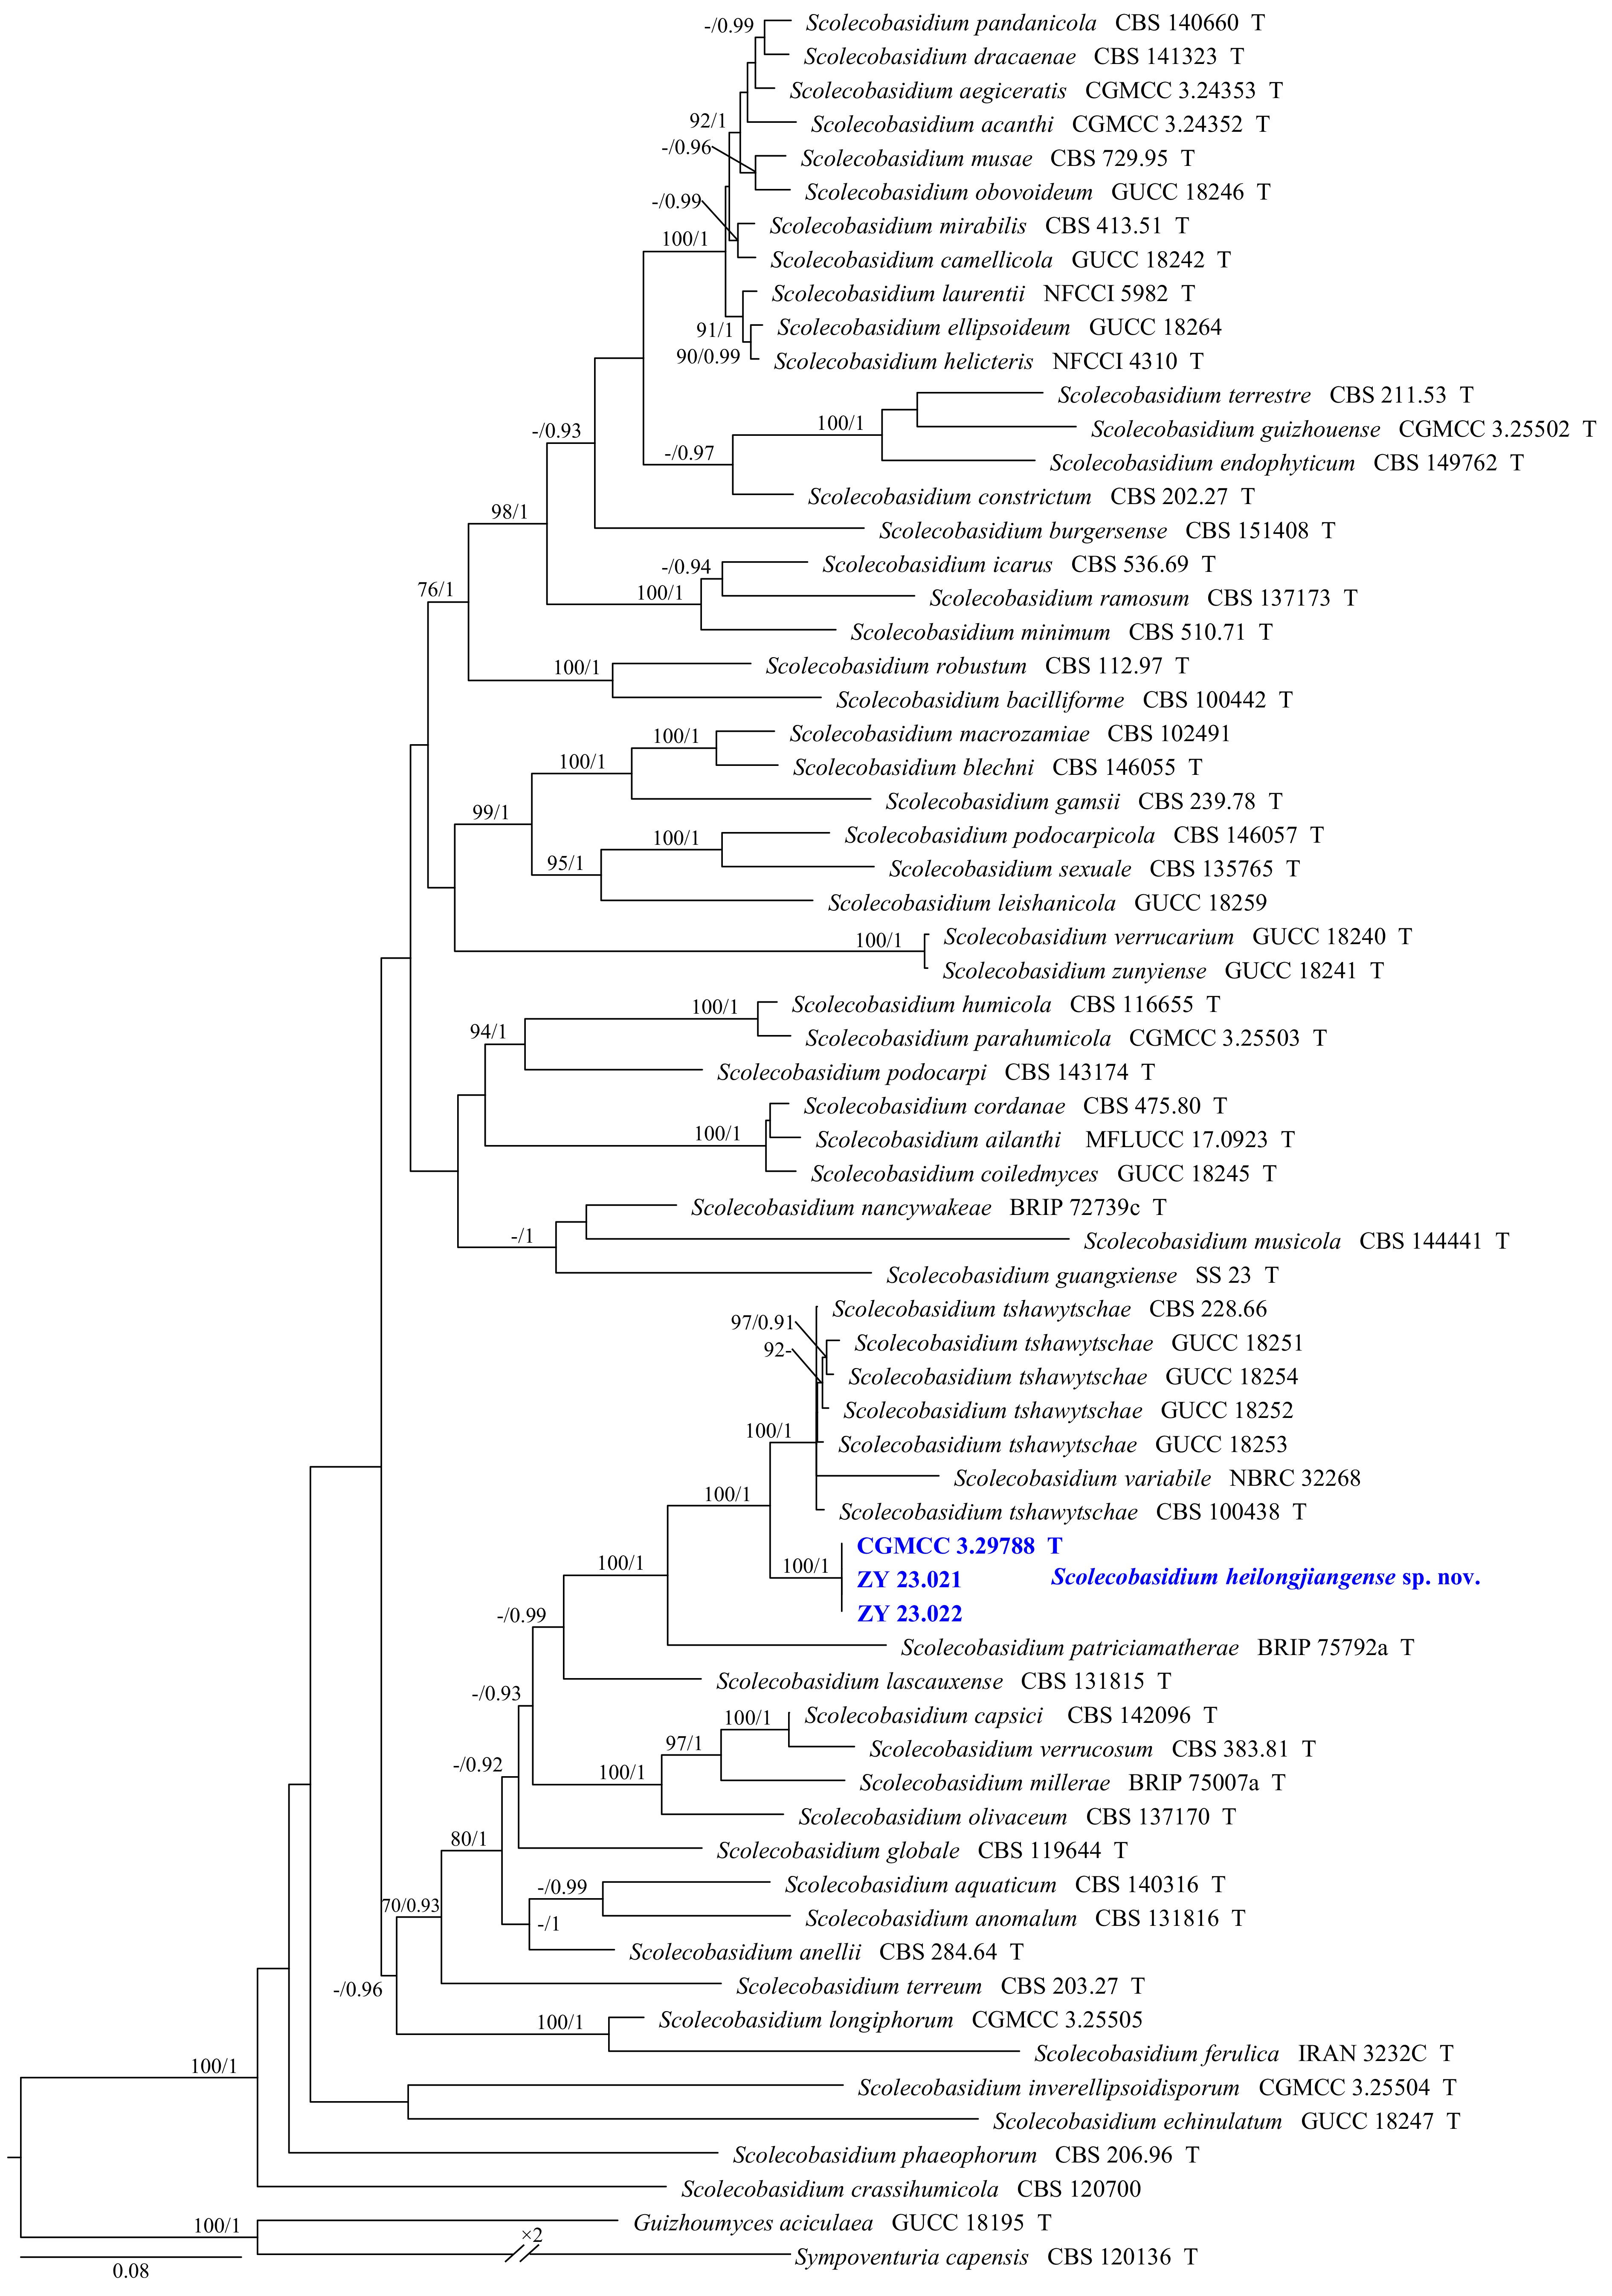
Figure 9.
Phylogram generated from ML analysis based on the combined dataset of SSU, ITS, LSU, TUB, and TEF1 sequence data. Numbers at branches indicate support values (IQ-TREE-BS/BI-PP) above 70%/0.90. The tree is rooted to Guizhoumyces aciculaea (GUCC 18195) and Sympoventuria capensis (CBS 120136). Newly generated sequences are in bold and blue, and 'T' indicates type-derived sequences. The scale bar represents the expected number of changes per site.
-
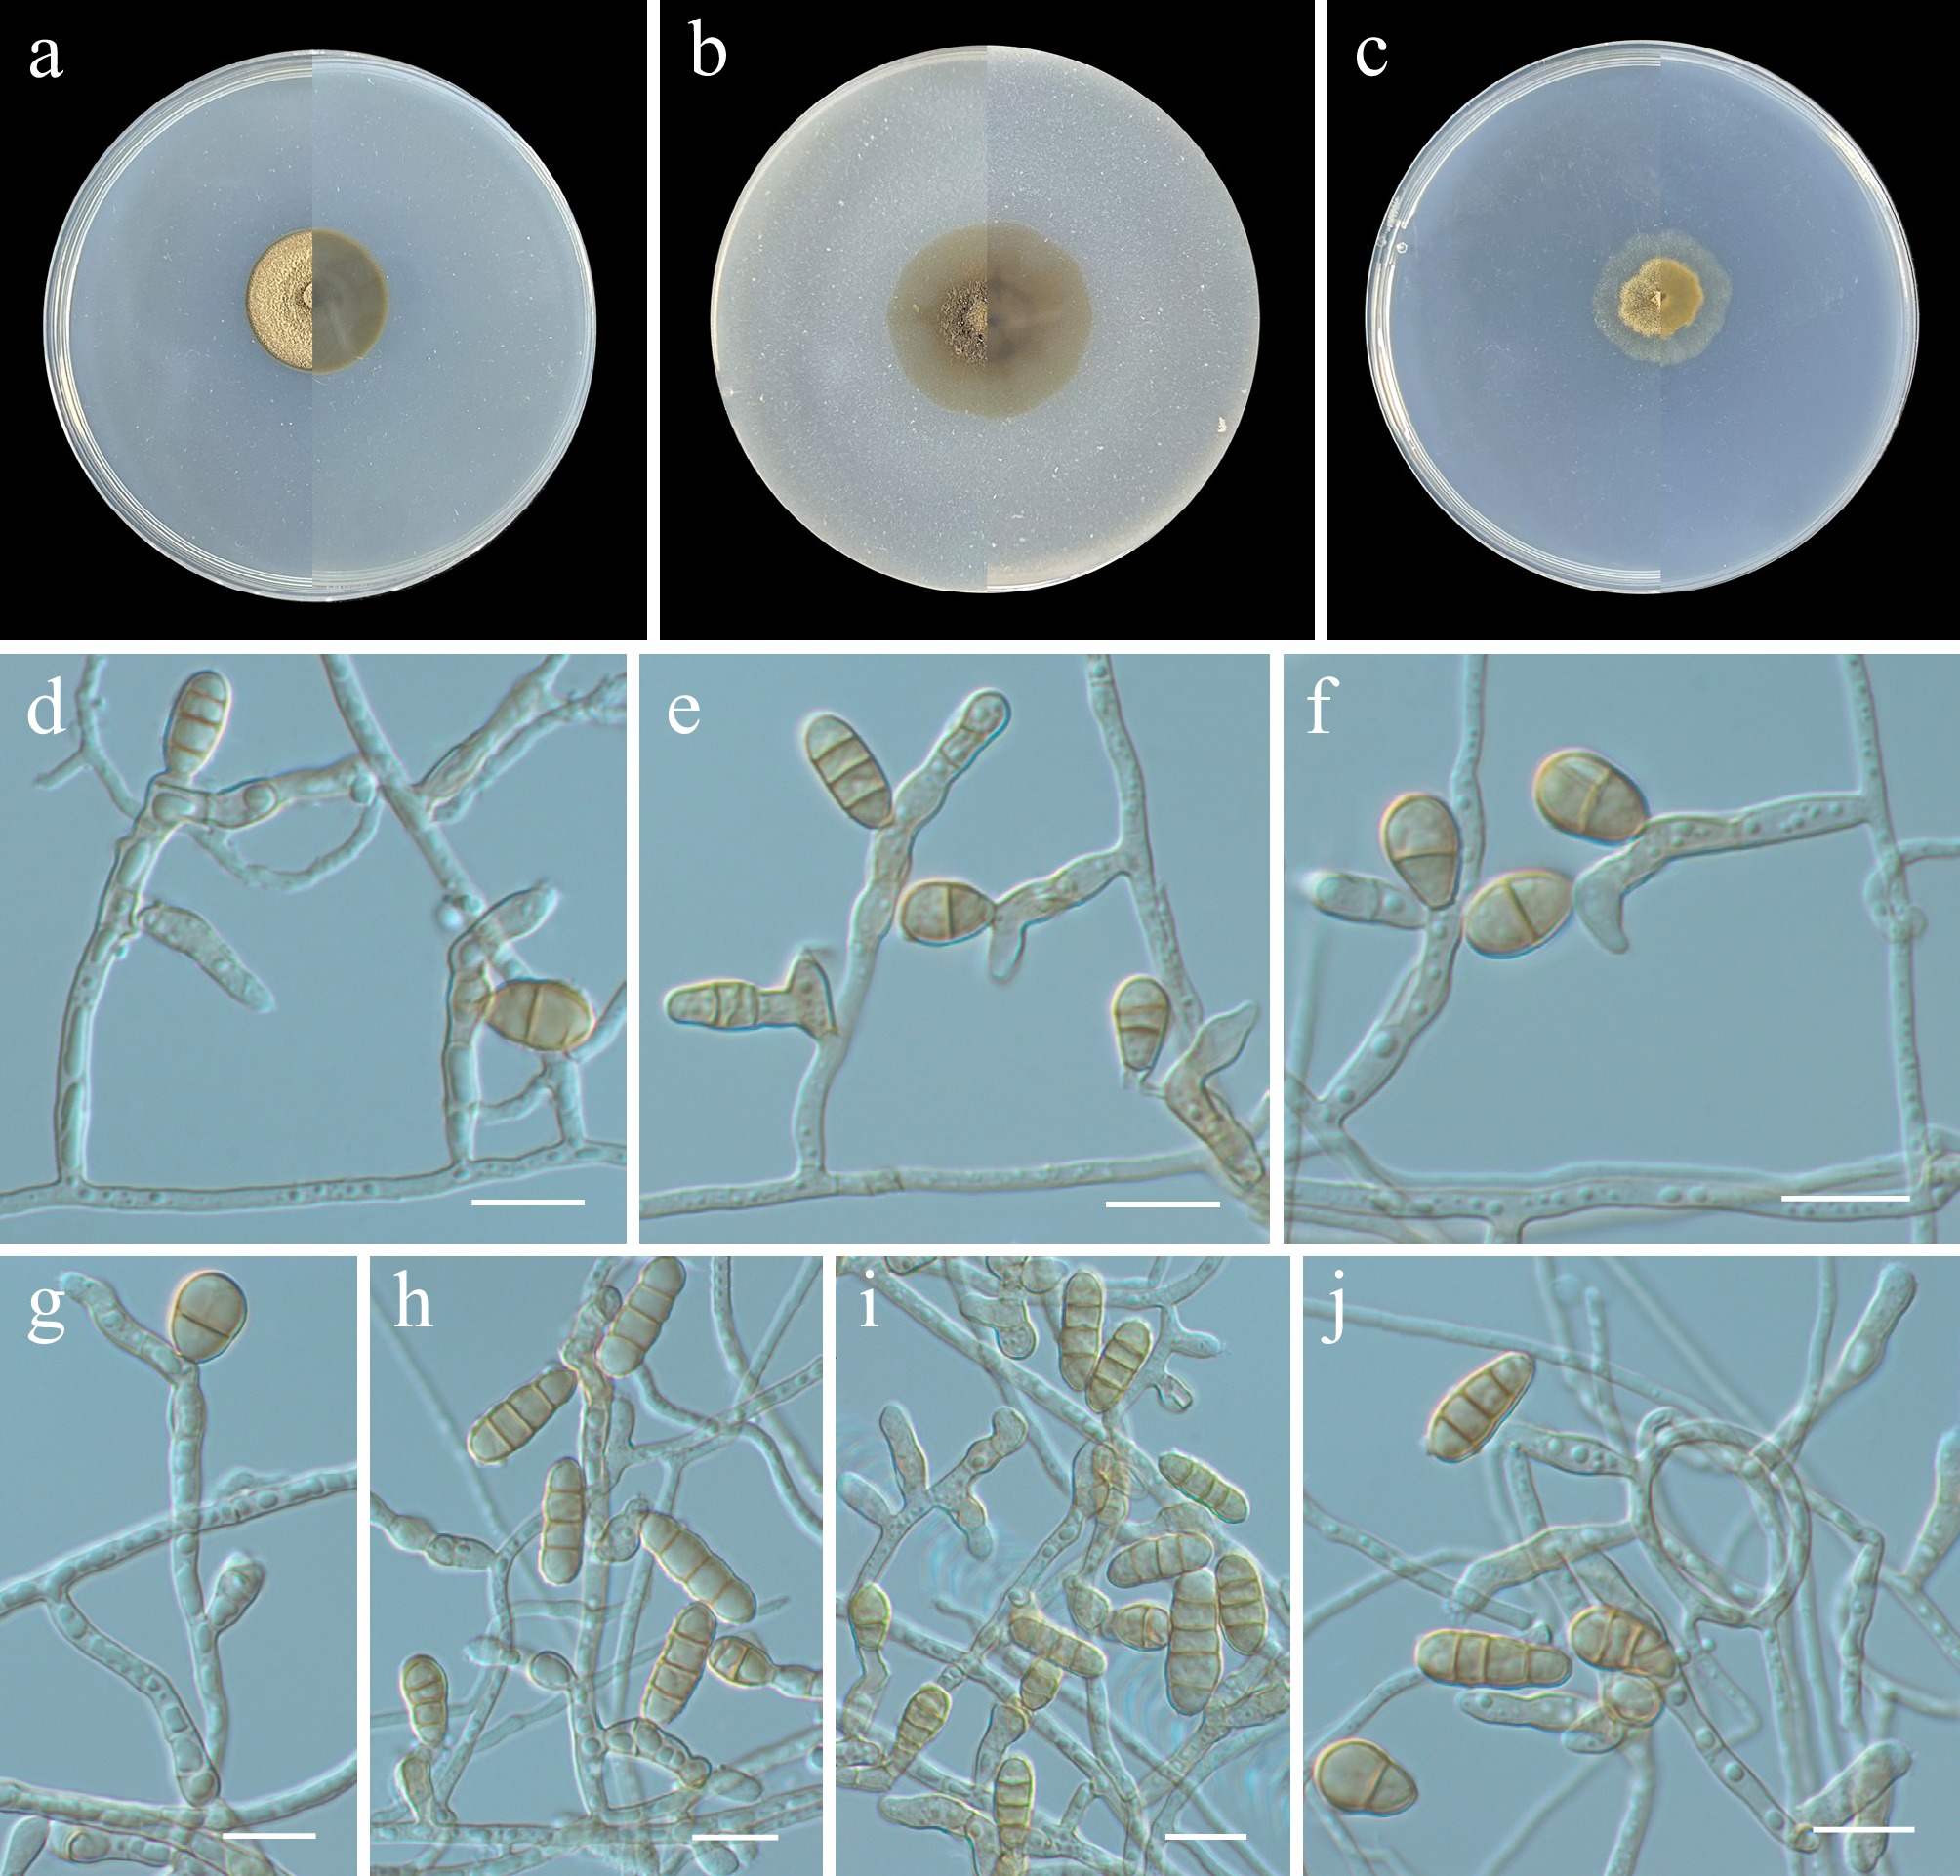
Figure 10.
Scolecobasidium heilongjiangense (from holotype ZY H-23.020). (a)–(c) Upper and reverse views of cultures on PDA, OA, and SNA after 14 d at 25 °C. (d)–(j) Conidiogenous cells and conidia. Scale bars: (d)–(j) 10 μm.
-
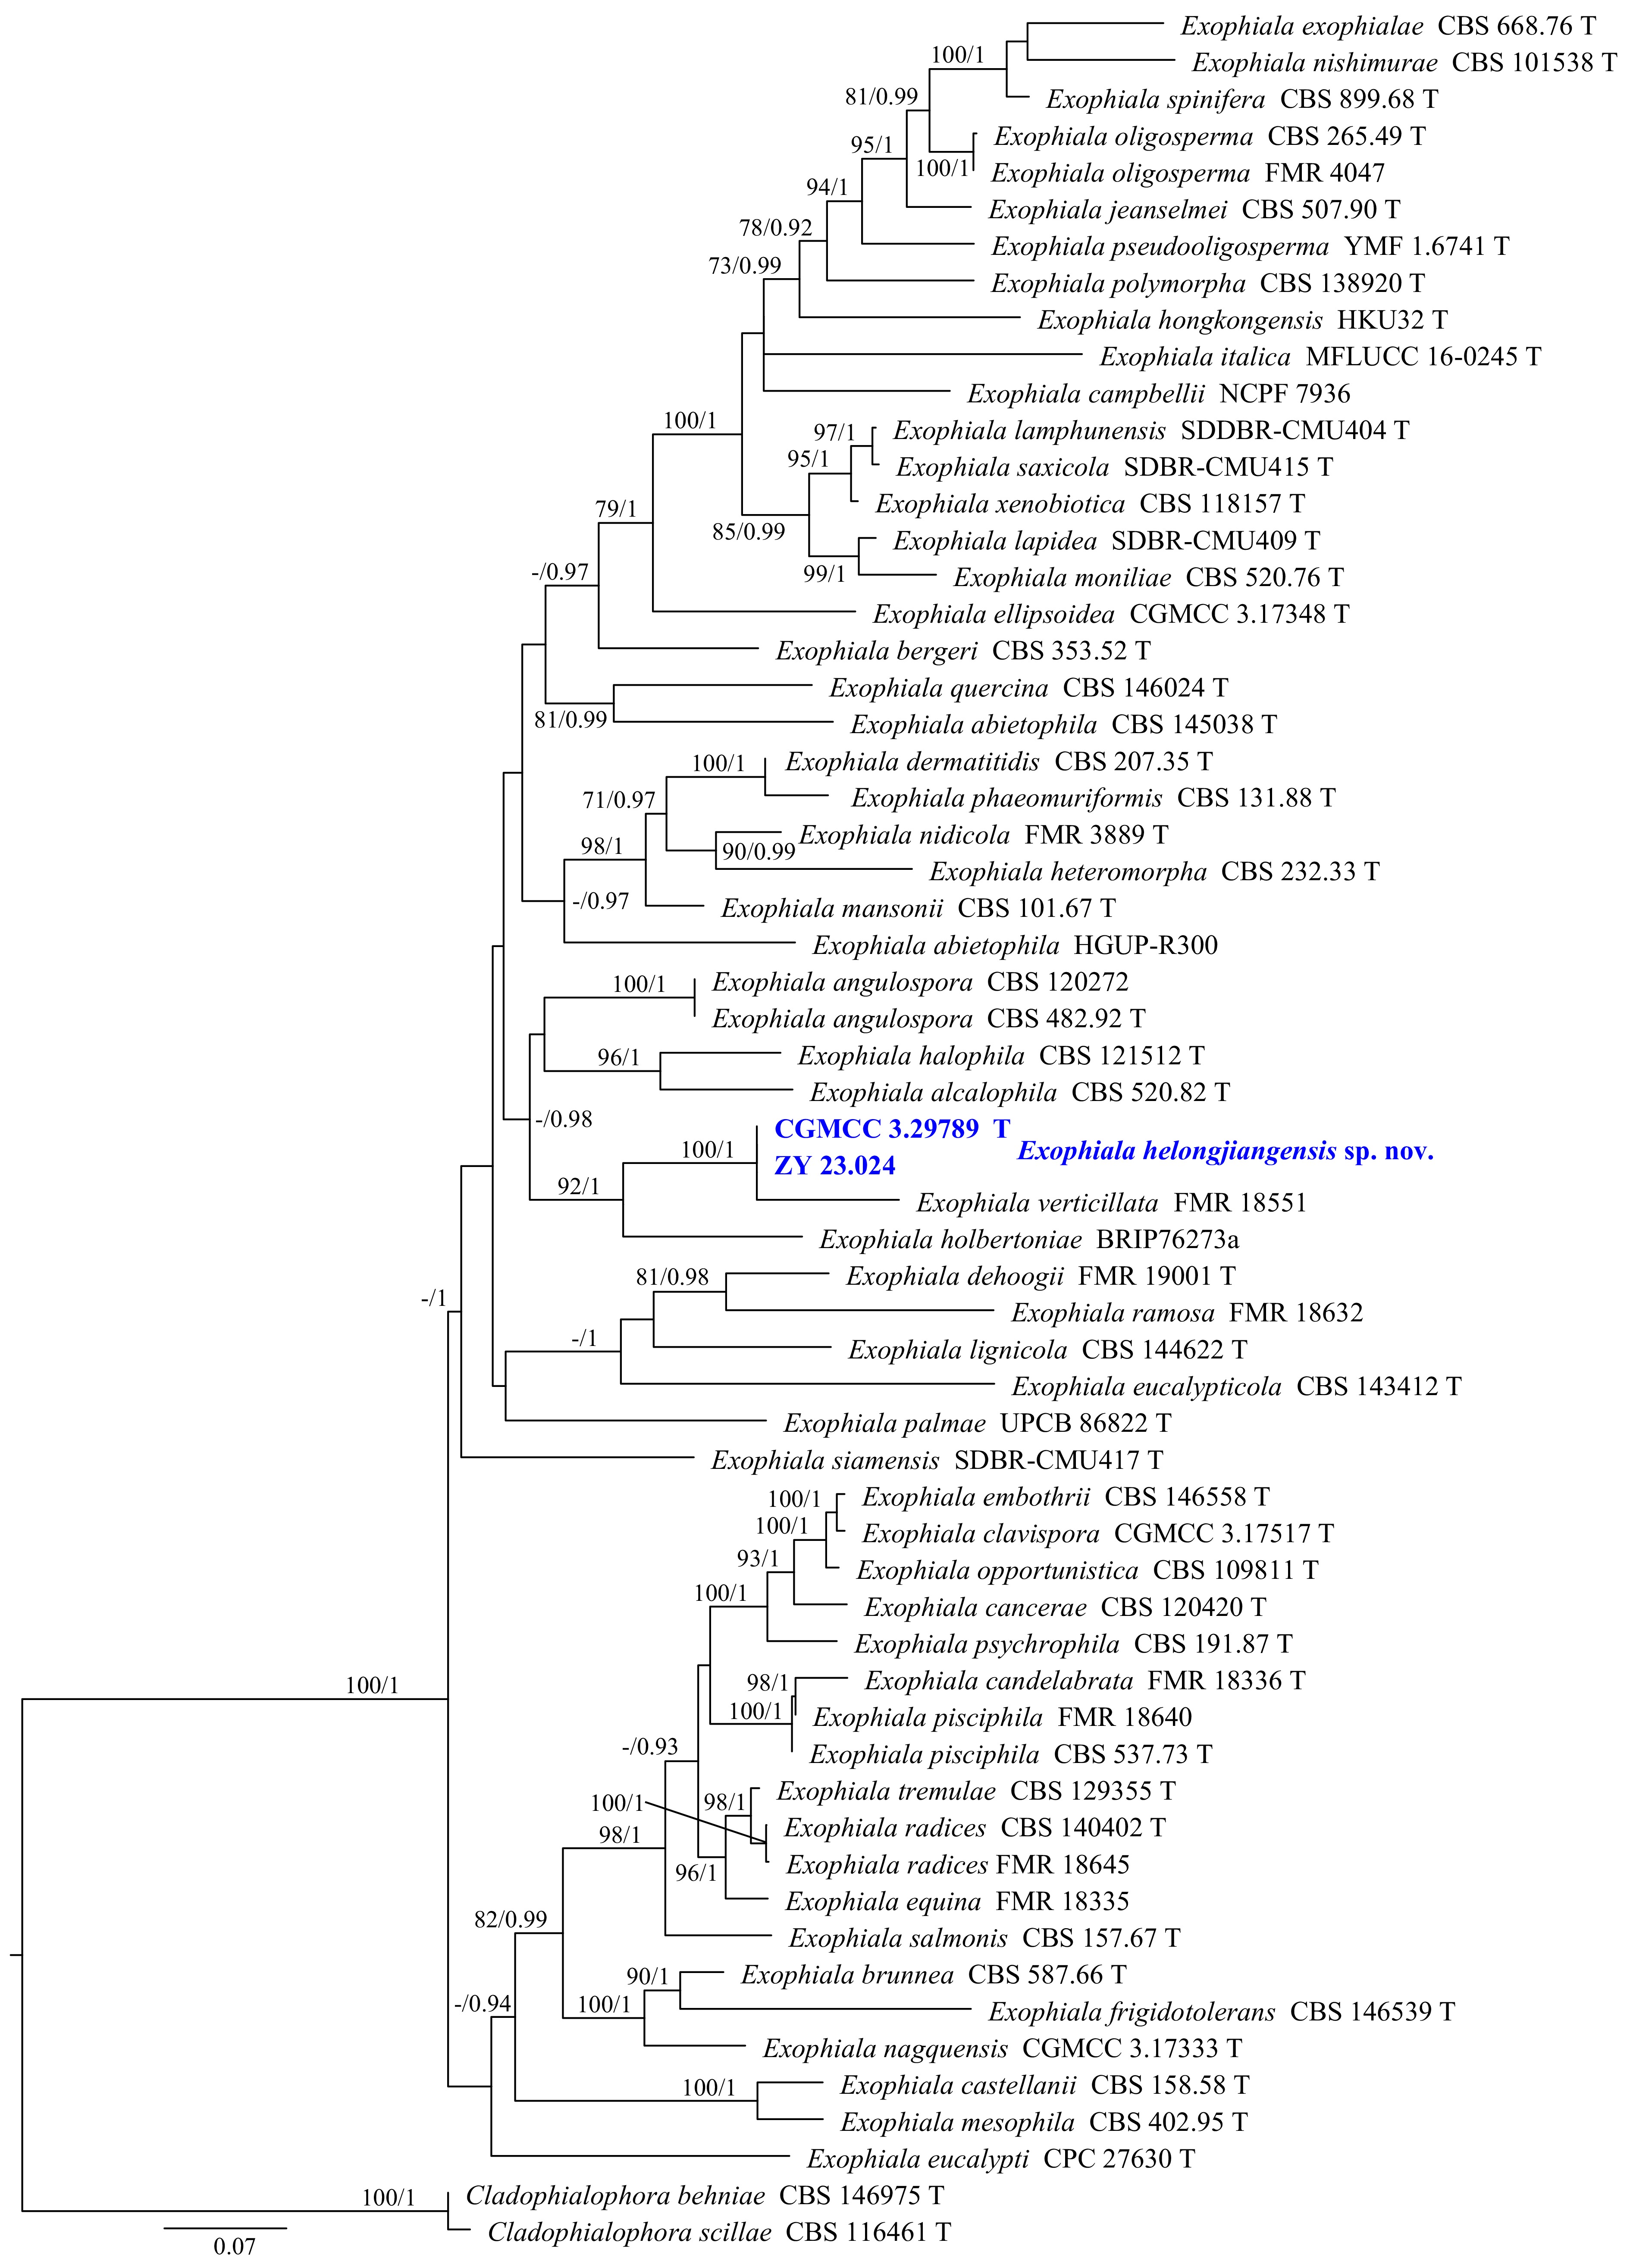
Figure 11.
Phylogram generated from ML analysis based on the combined dataset of ITS, LSU, TUB, and TEF1 sequence data. Numbers at branches indicate support values (IQ-TREE-BS/BI-PP) above 70%/0.90. The tree is rooted to Cladophialophora behniae (CBS 146975) and C. scillae (CBS 116461). Newly generated sequences are in bold and blue, and 'T' indicates type-derived sequences. The scale bar represents the expected number of changes per site.
-
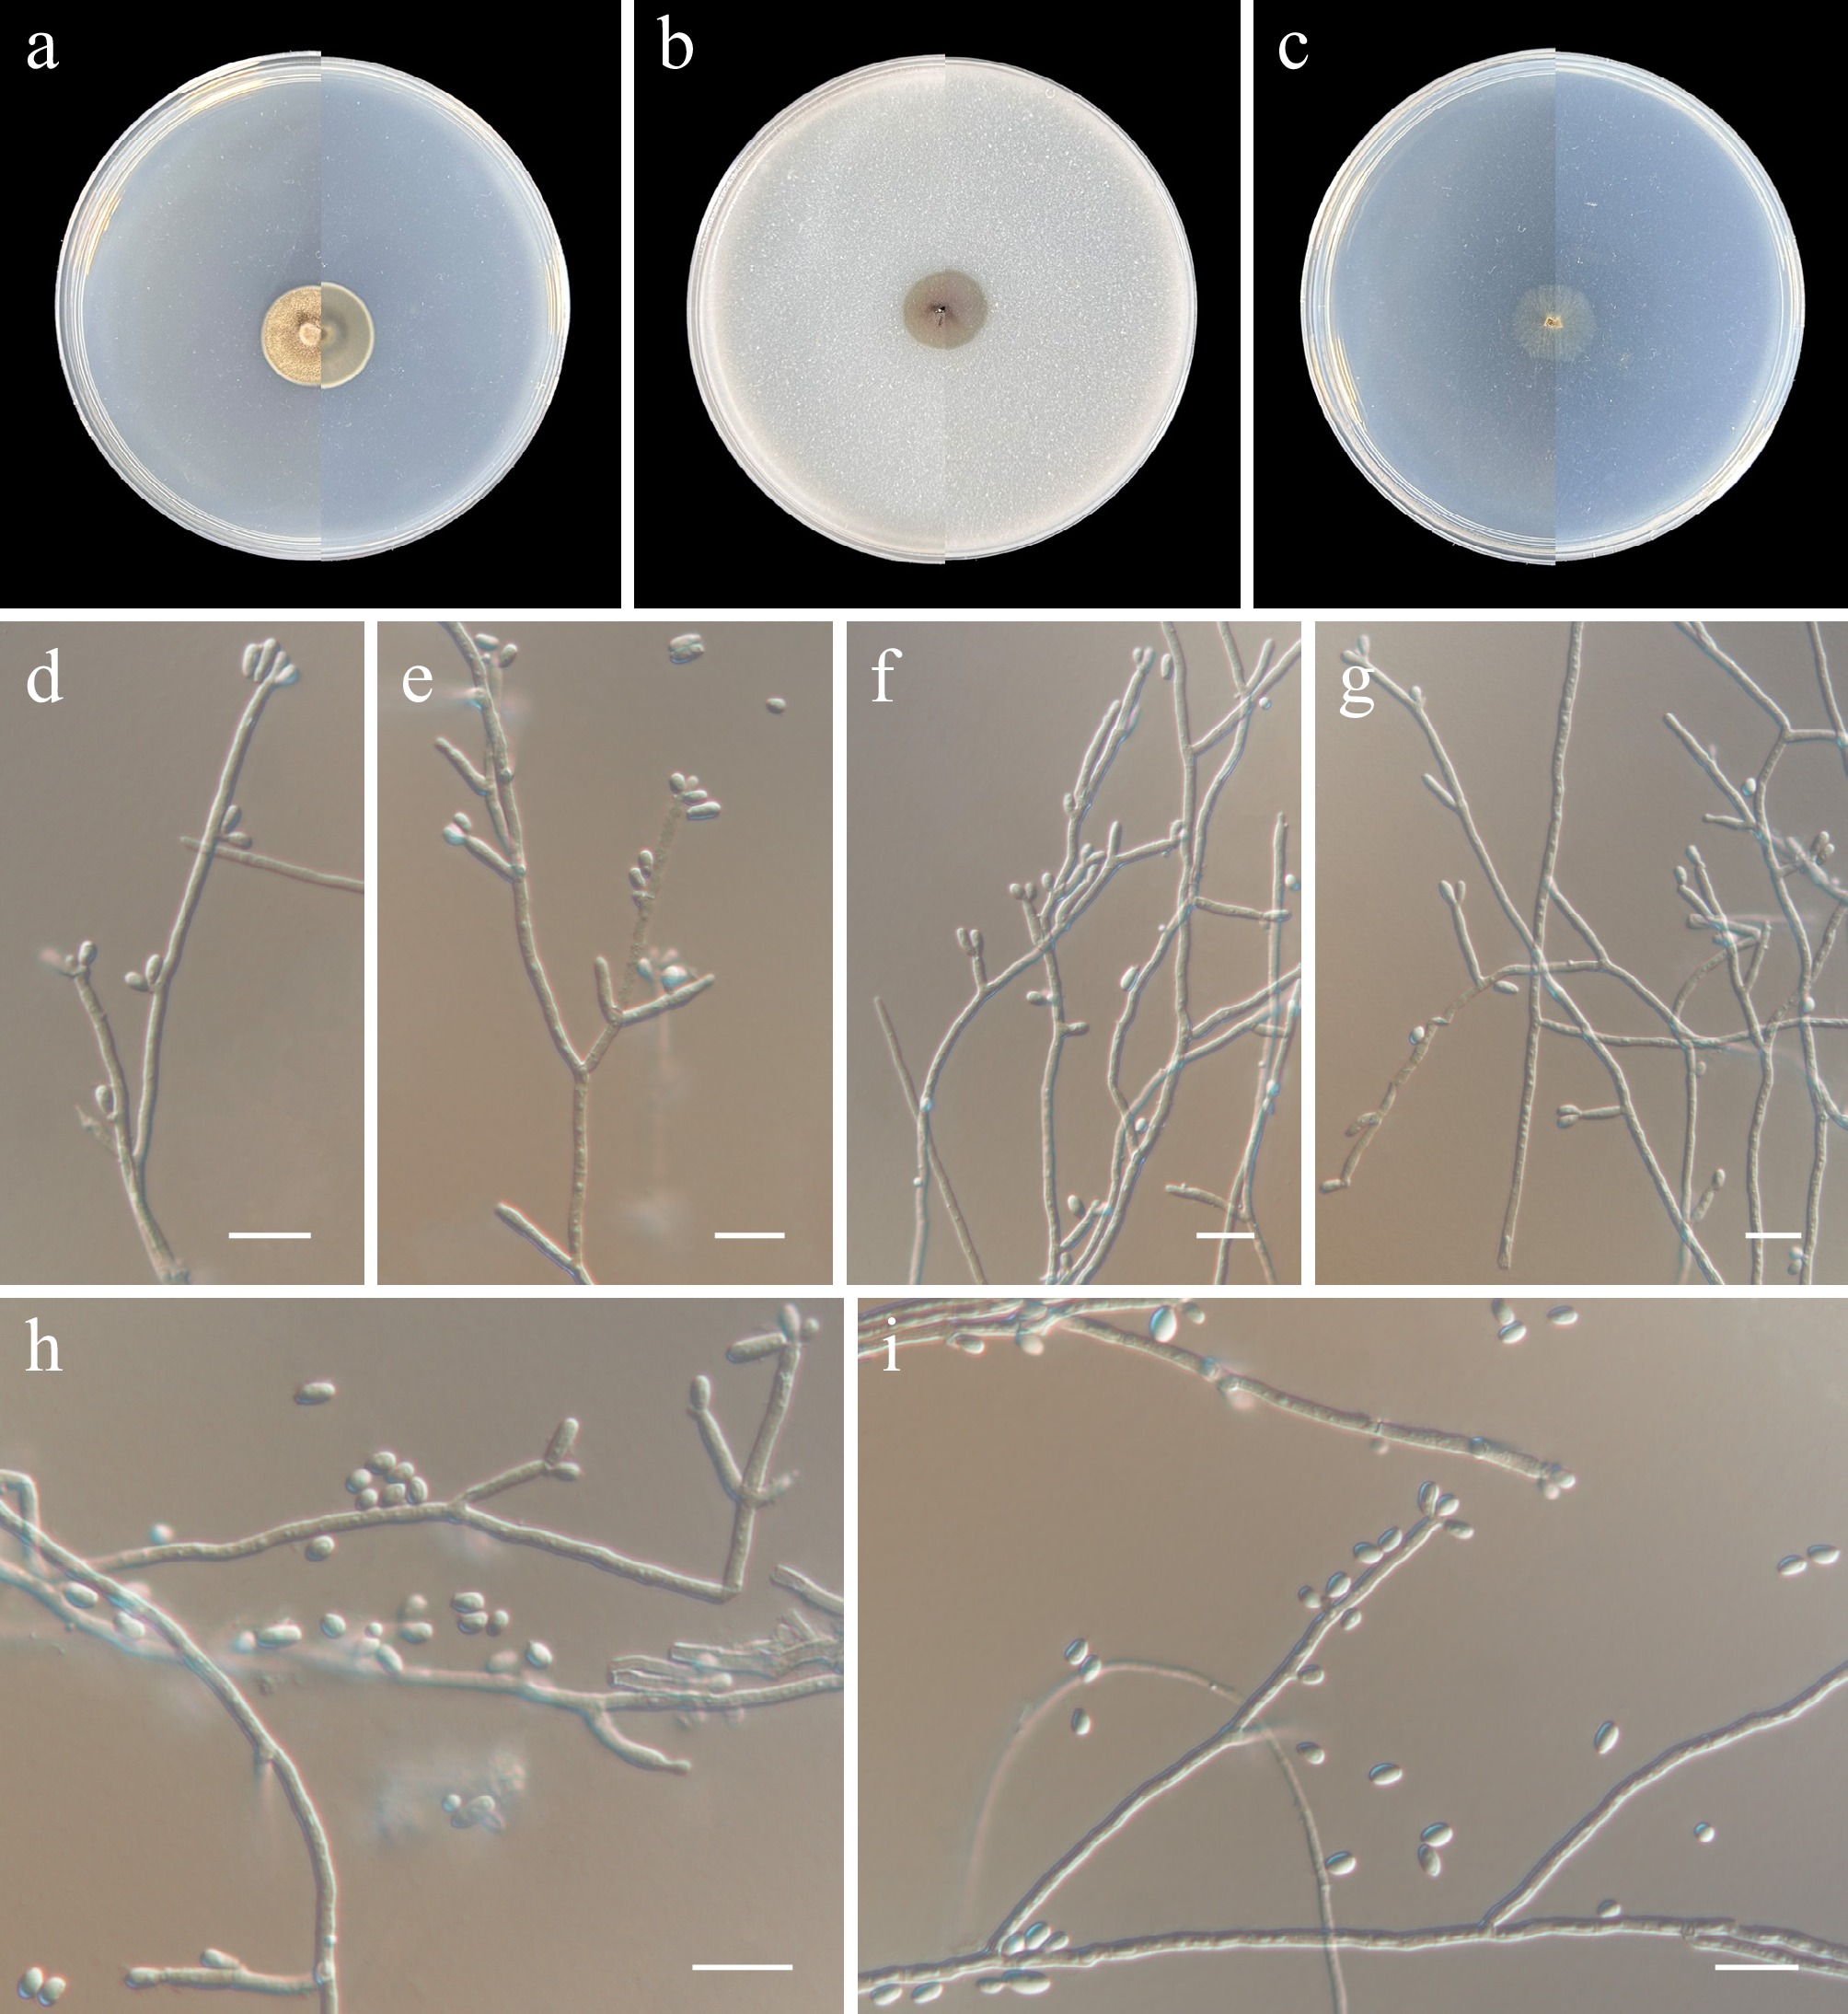
Figure 12.
Exophiala heilongjiangensis (from holotype ZY H-23.023). (a)–(c) Upper and reverse views of cultures on PDA, OA, and SNA after 14 d at 25 °C. (d)–(i) Conidiogenous cells and conidia. Scale bars: (d)–(i) 10 μm.
-
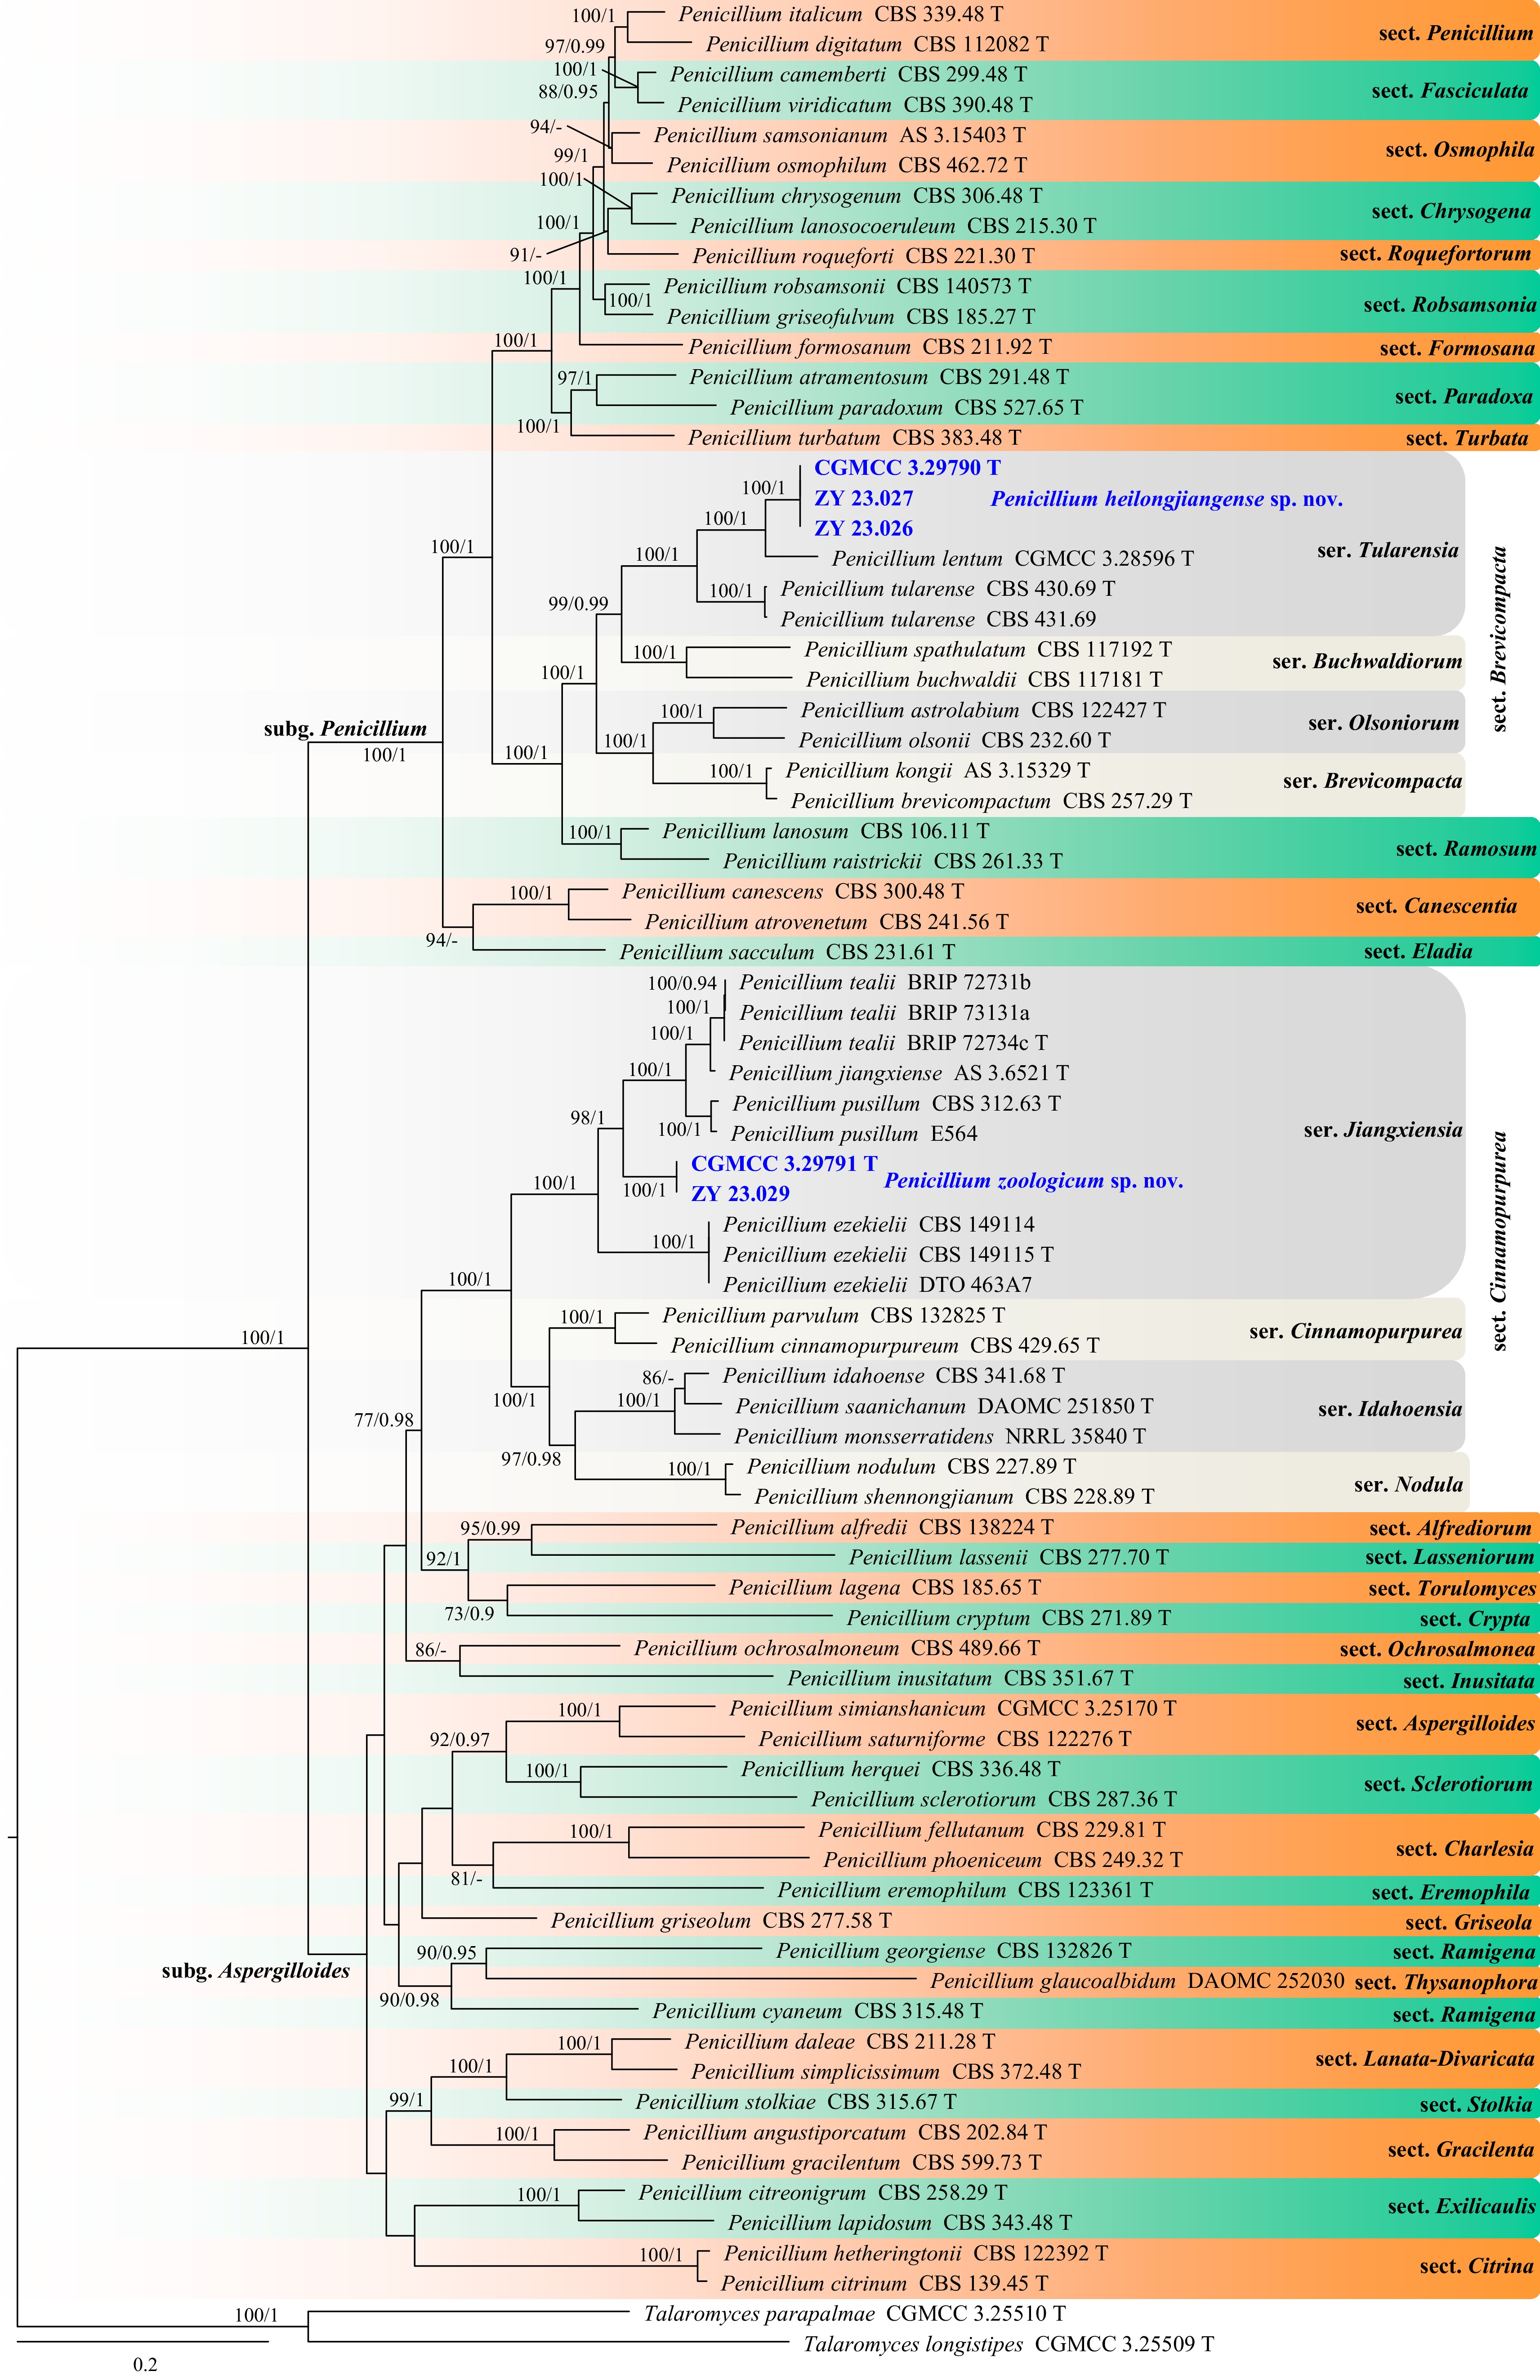
Figure 13.
Phylogram generated from ML analysis based on the combined dataset of TUB, CaM, ITS, and RPB2 sequence data. Numbers at branches indicate support values (IQ-TREE-BS/BI-PP) above 70%/0.90. The tree is rooted to Talaromyces longistipes (CGMCC 3.25509) and T. parapalmae (CGMCC 3.25510). Newly generated sequences are in bold and blue, and 'T' indicates type-derived sequences. The scale bar represents the expected number of changes per site.
-
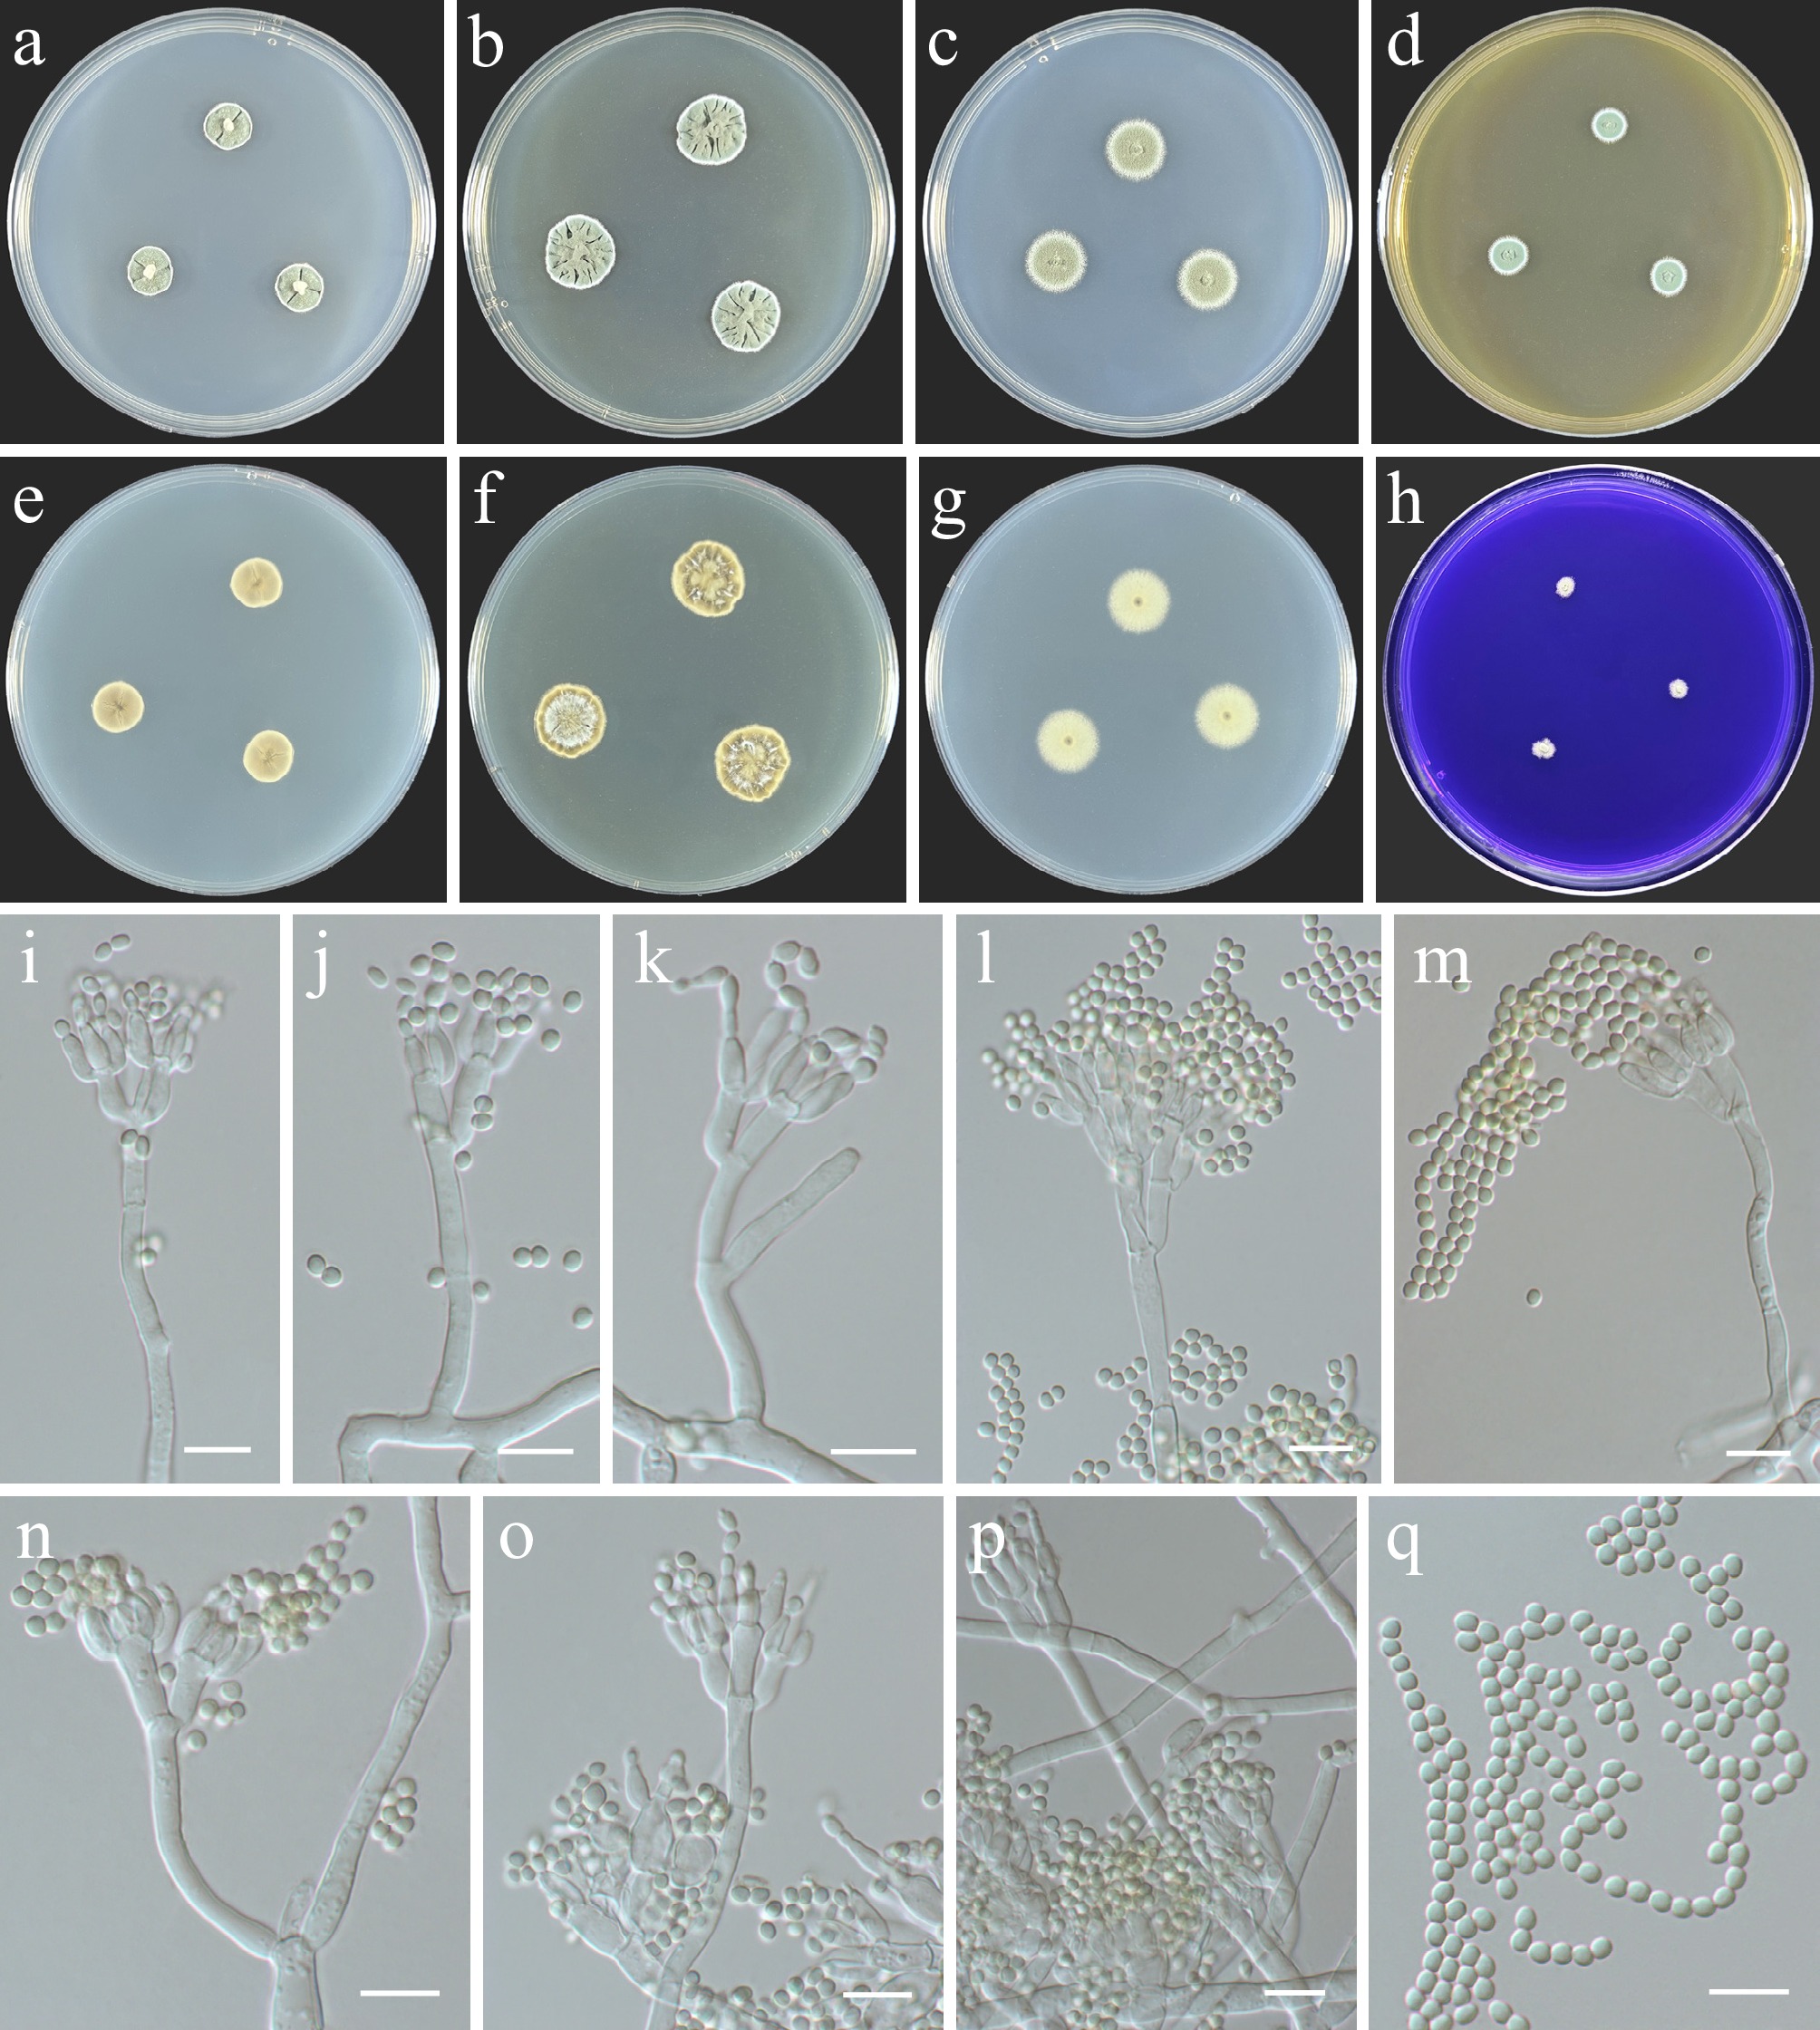
Figure 14.
Penicillium heilongjiangense (from holotype ZY H-23.025). (a)–(h) Colonies on medium at 25 °C for 7 d (left to right, top row: CYA, YES, DG18, and MEA obverse; second row: CYA reverse, YES reverse, DG18 reverse, and CREA obverse). (i)–(p) Conidiophores and conidia. (q) Conidia. Scale bars: (i)–(q) 10 μm.
-
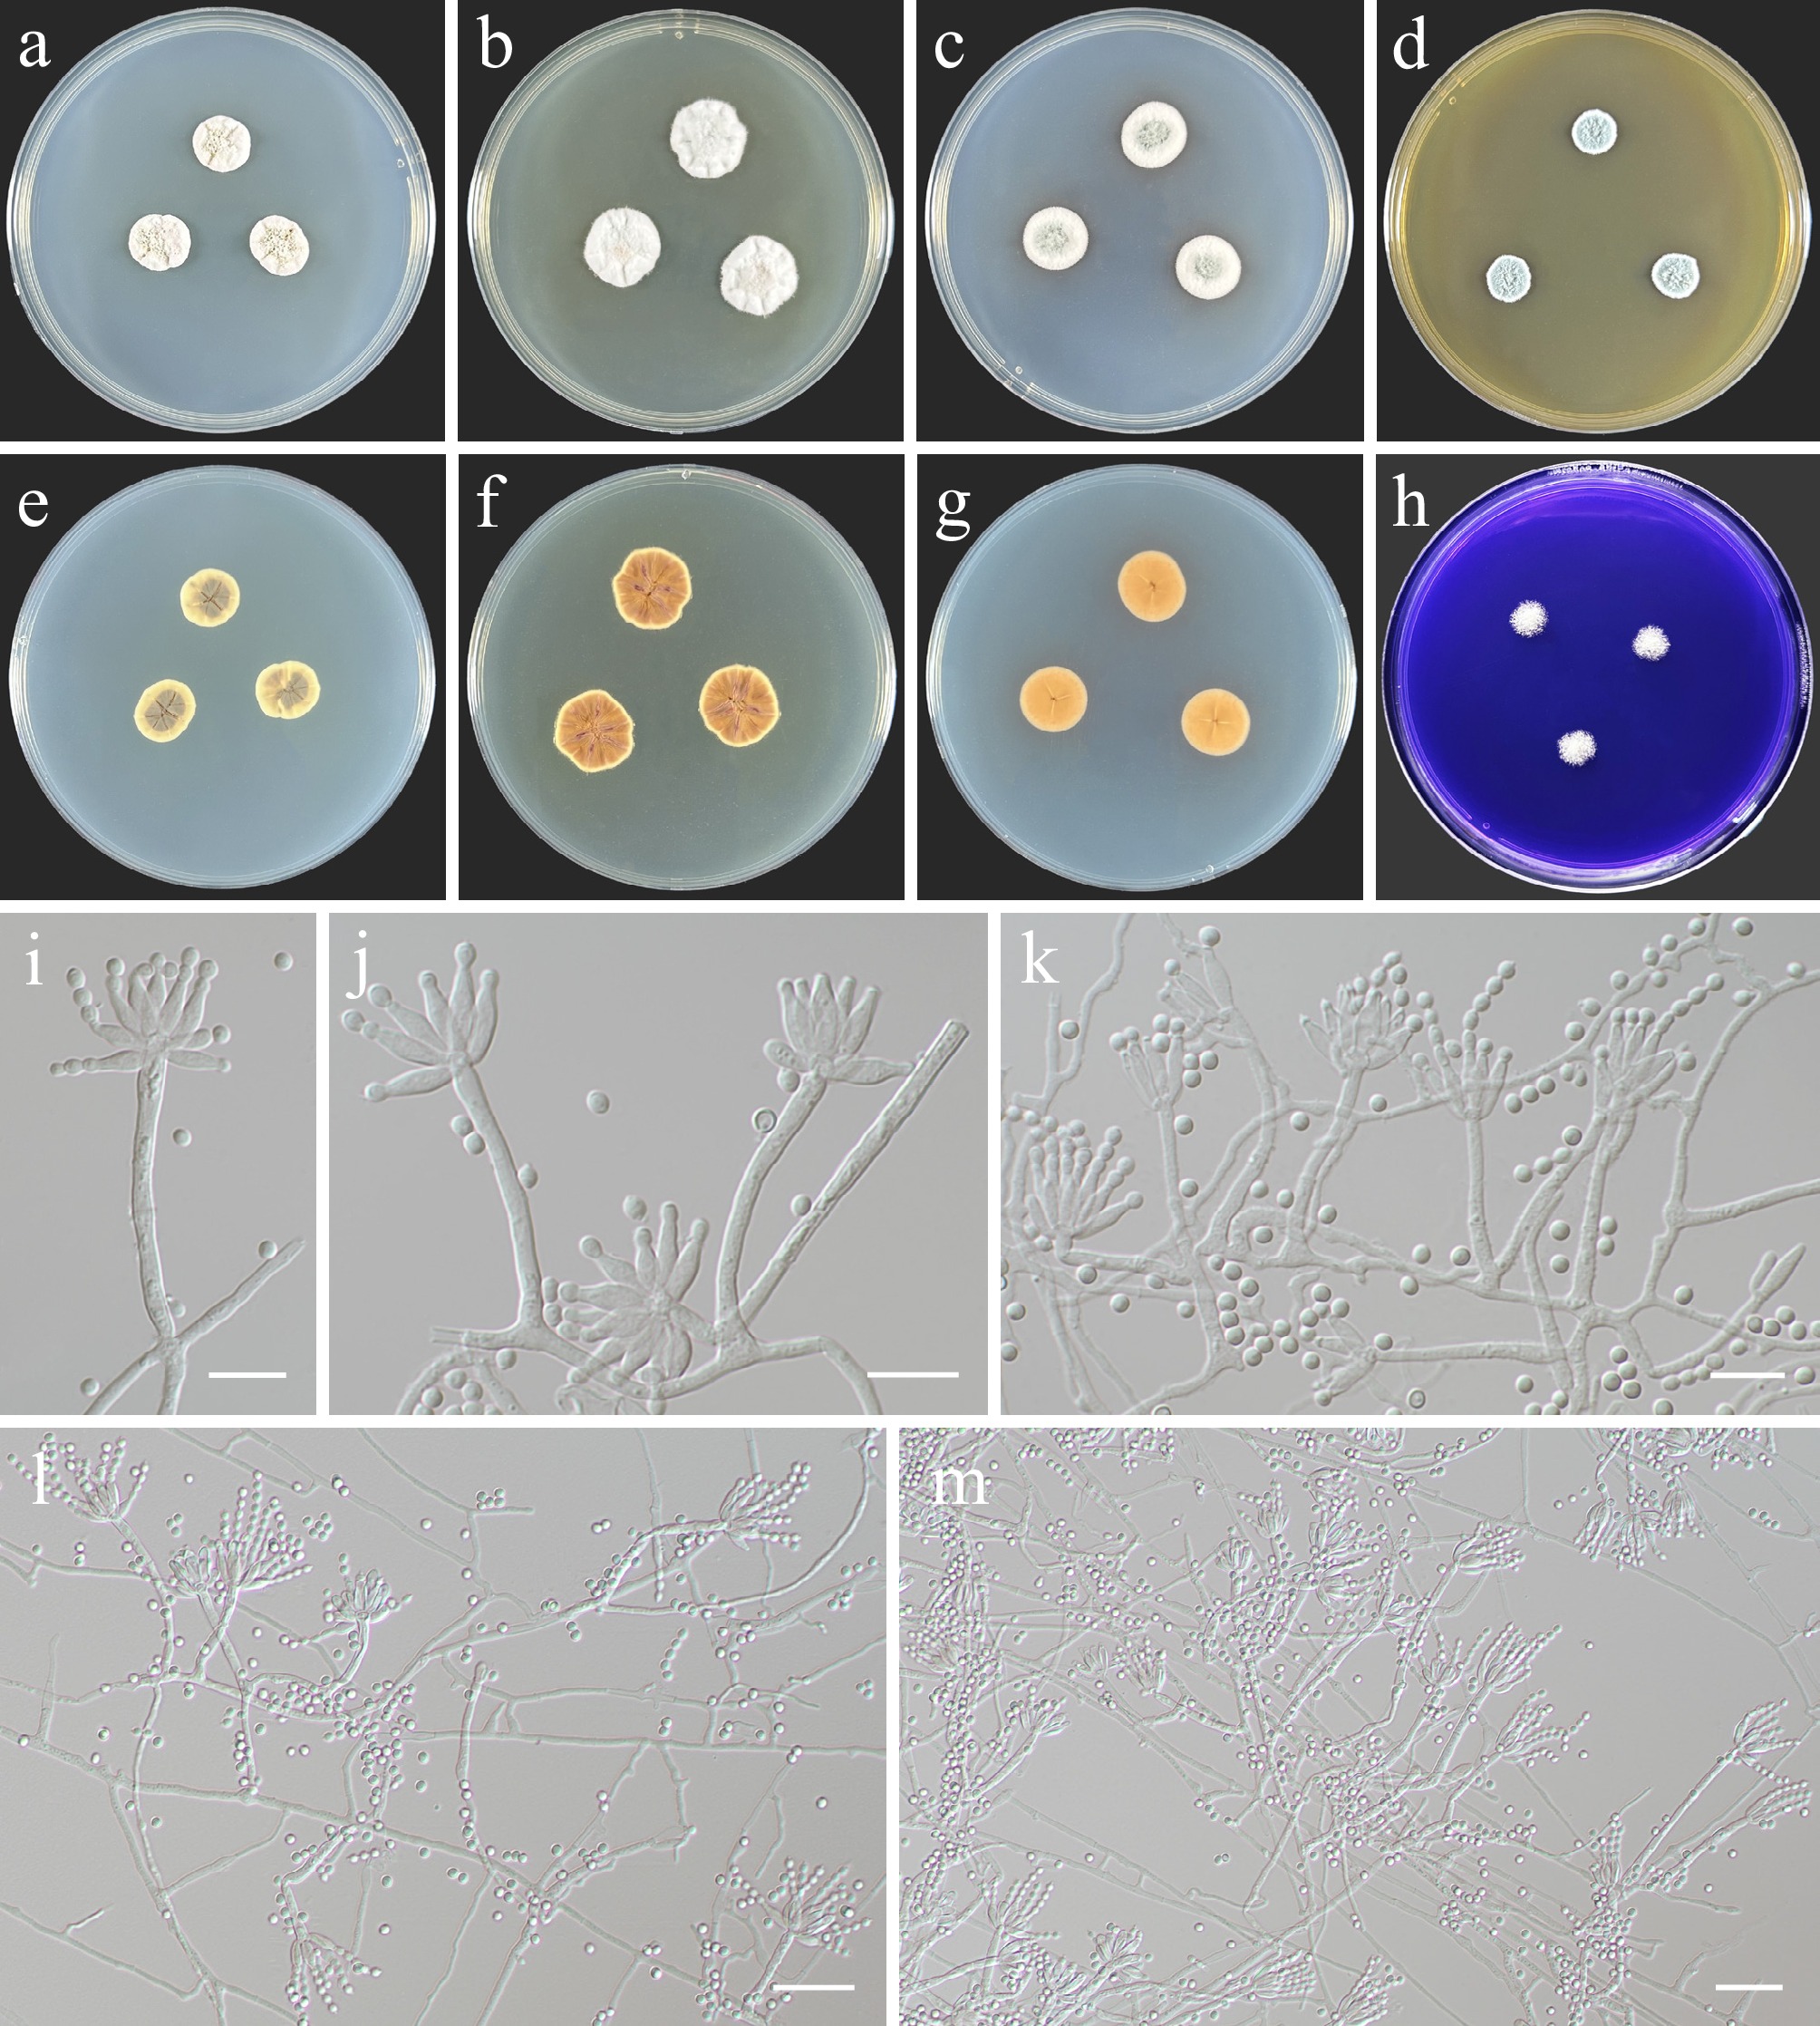
Figure 15.
Penicillium zoologicum (from holotype ZY H-23.028). (a)–(h) Colonies on medium at 25 °C for 7 d (left to right, top row: CYA, YES, DG18, and MEA obverse; second row: CYA reverse, YES reverse, DG18 reverse, and CREA obverse). (i)–(m) Conidiogenous cells and conidia. Scale bars: (i)–(k) 10 μm, (l), (m) 20 μm.
-
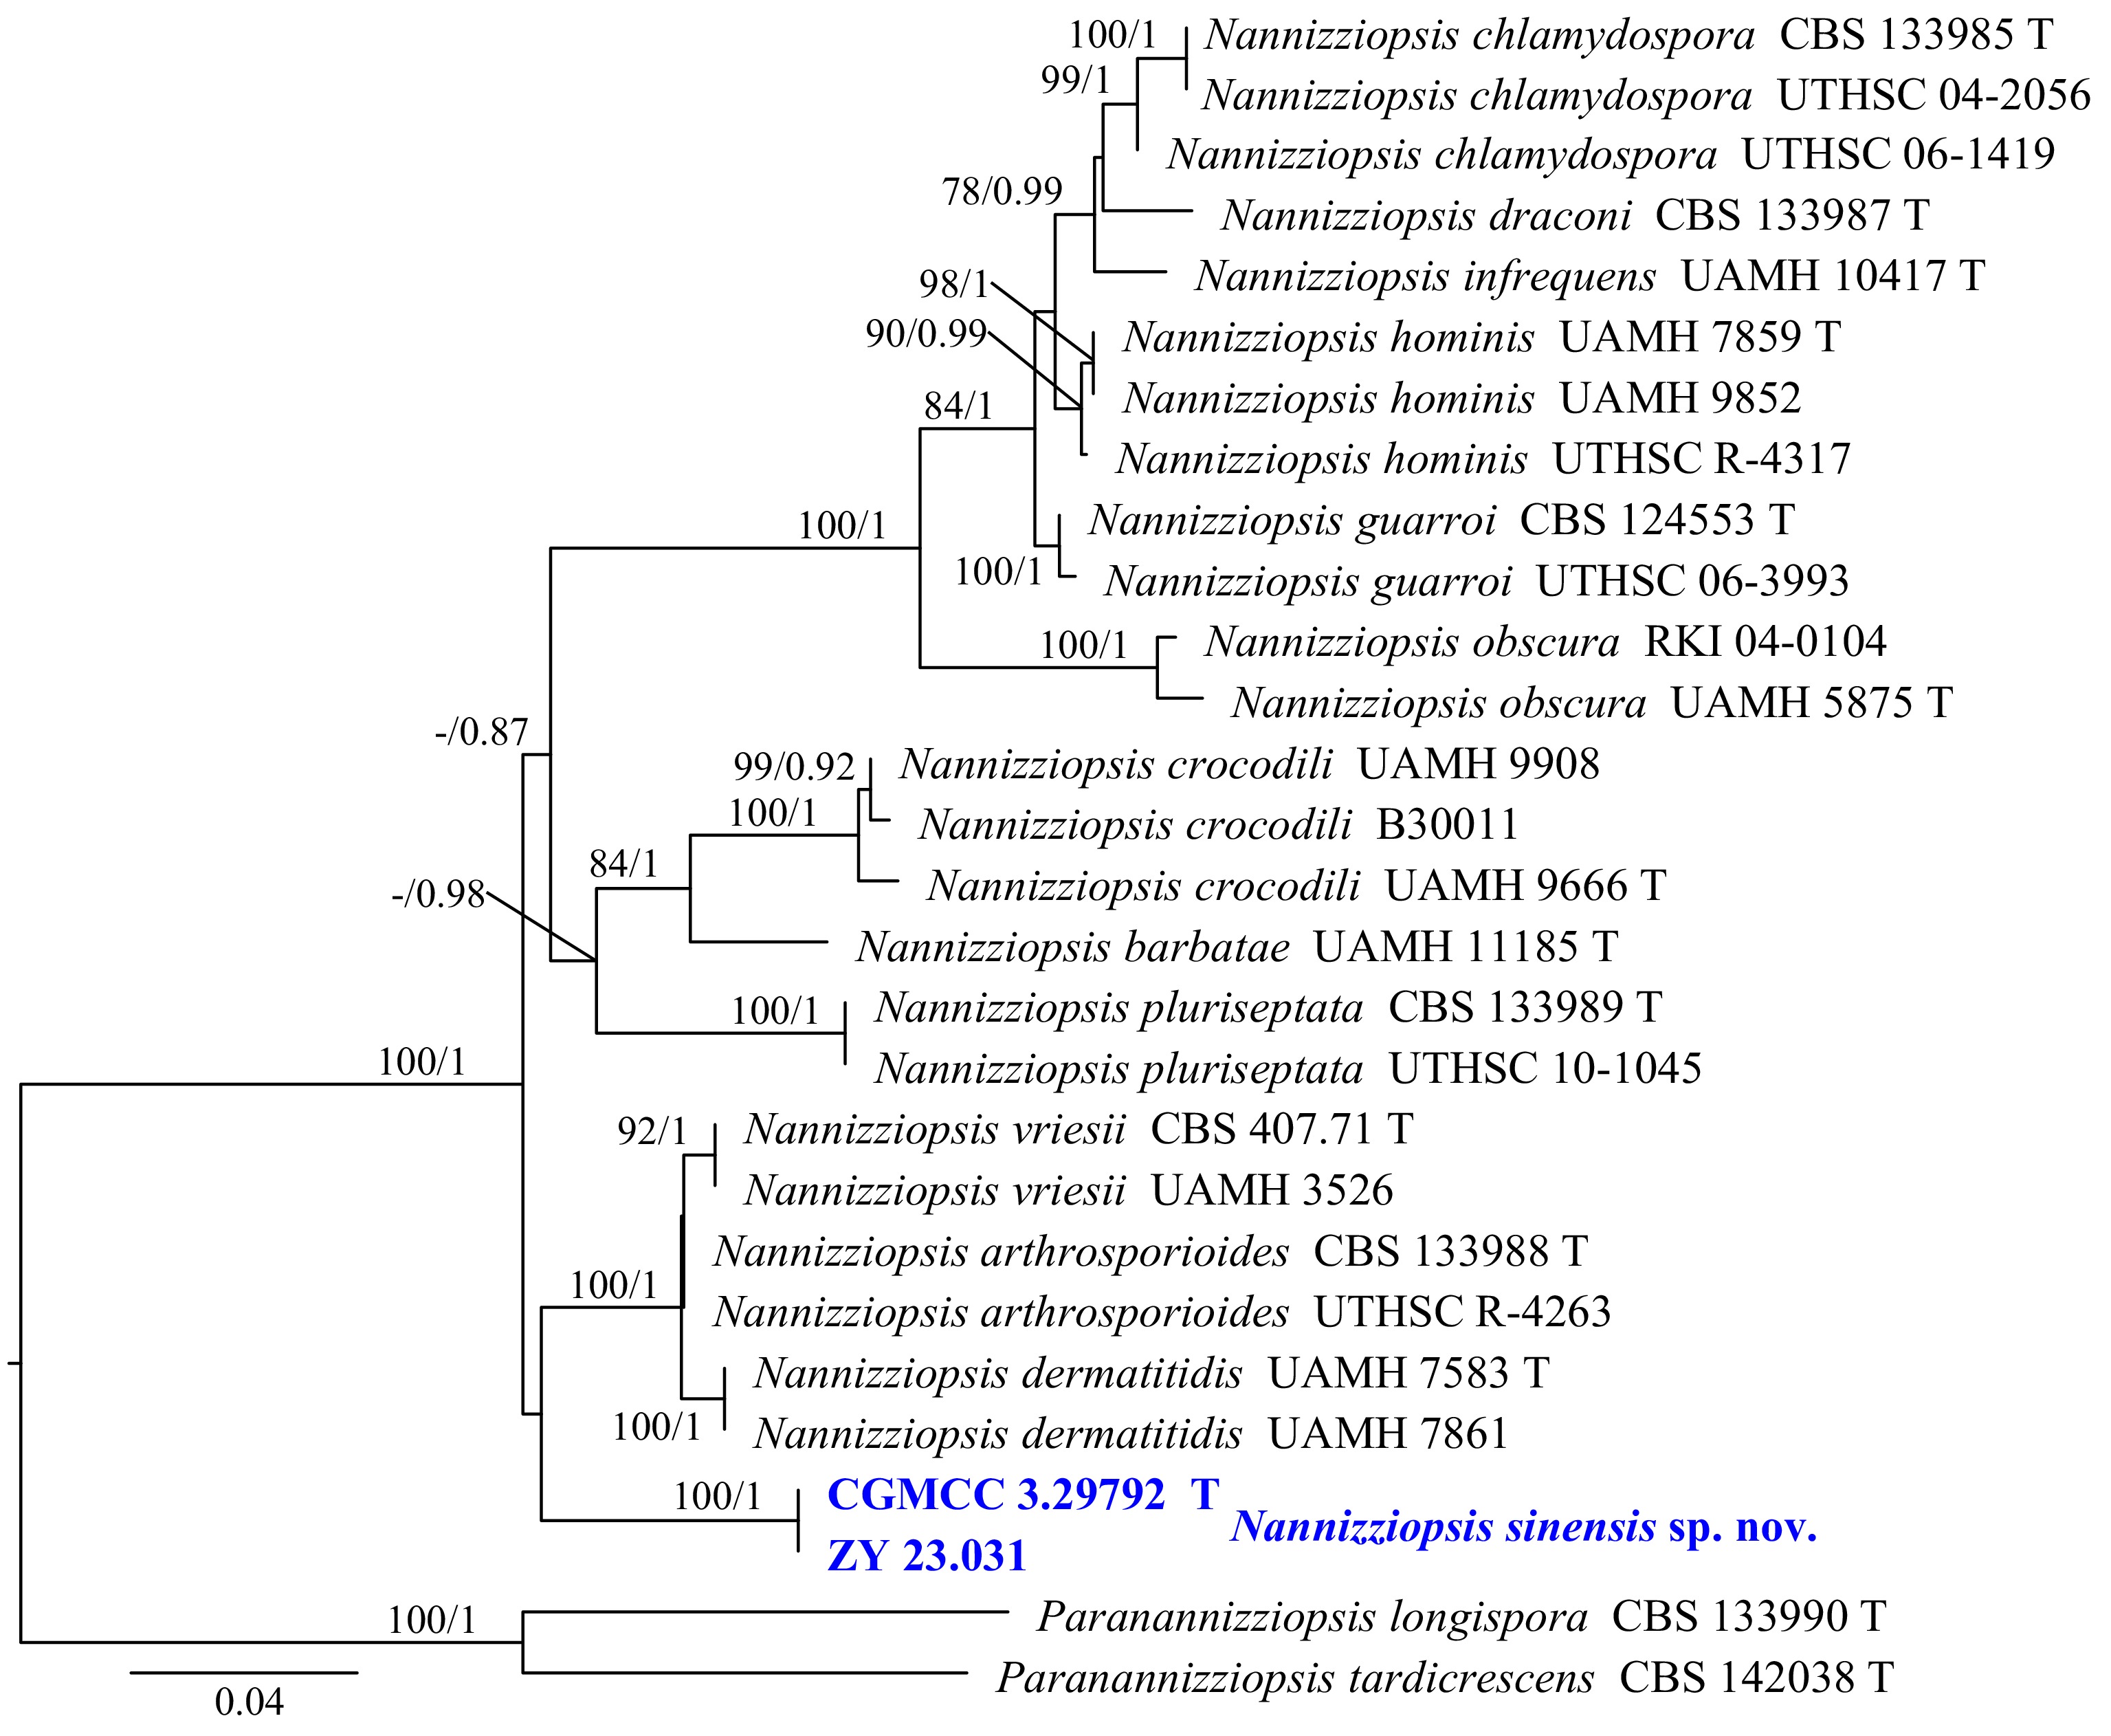
Figure 16.
Phylogram generated from ML analysis based on the combined dataset of ITS and LSU sequence data. Numbers at branches indicate support values (IQ-TREE-BS/BI-PP) above 70%/0.90. The tree is rooted to Paranannizziopsis longispora (CBS 133990) and P. tardicrescens (CBS 142038). Newly generated sequences are in bold and blue, and 'T' indicates type-derived sequences. The scale bar represents the expected number of changes per site.
-
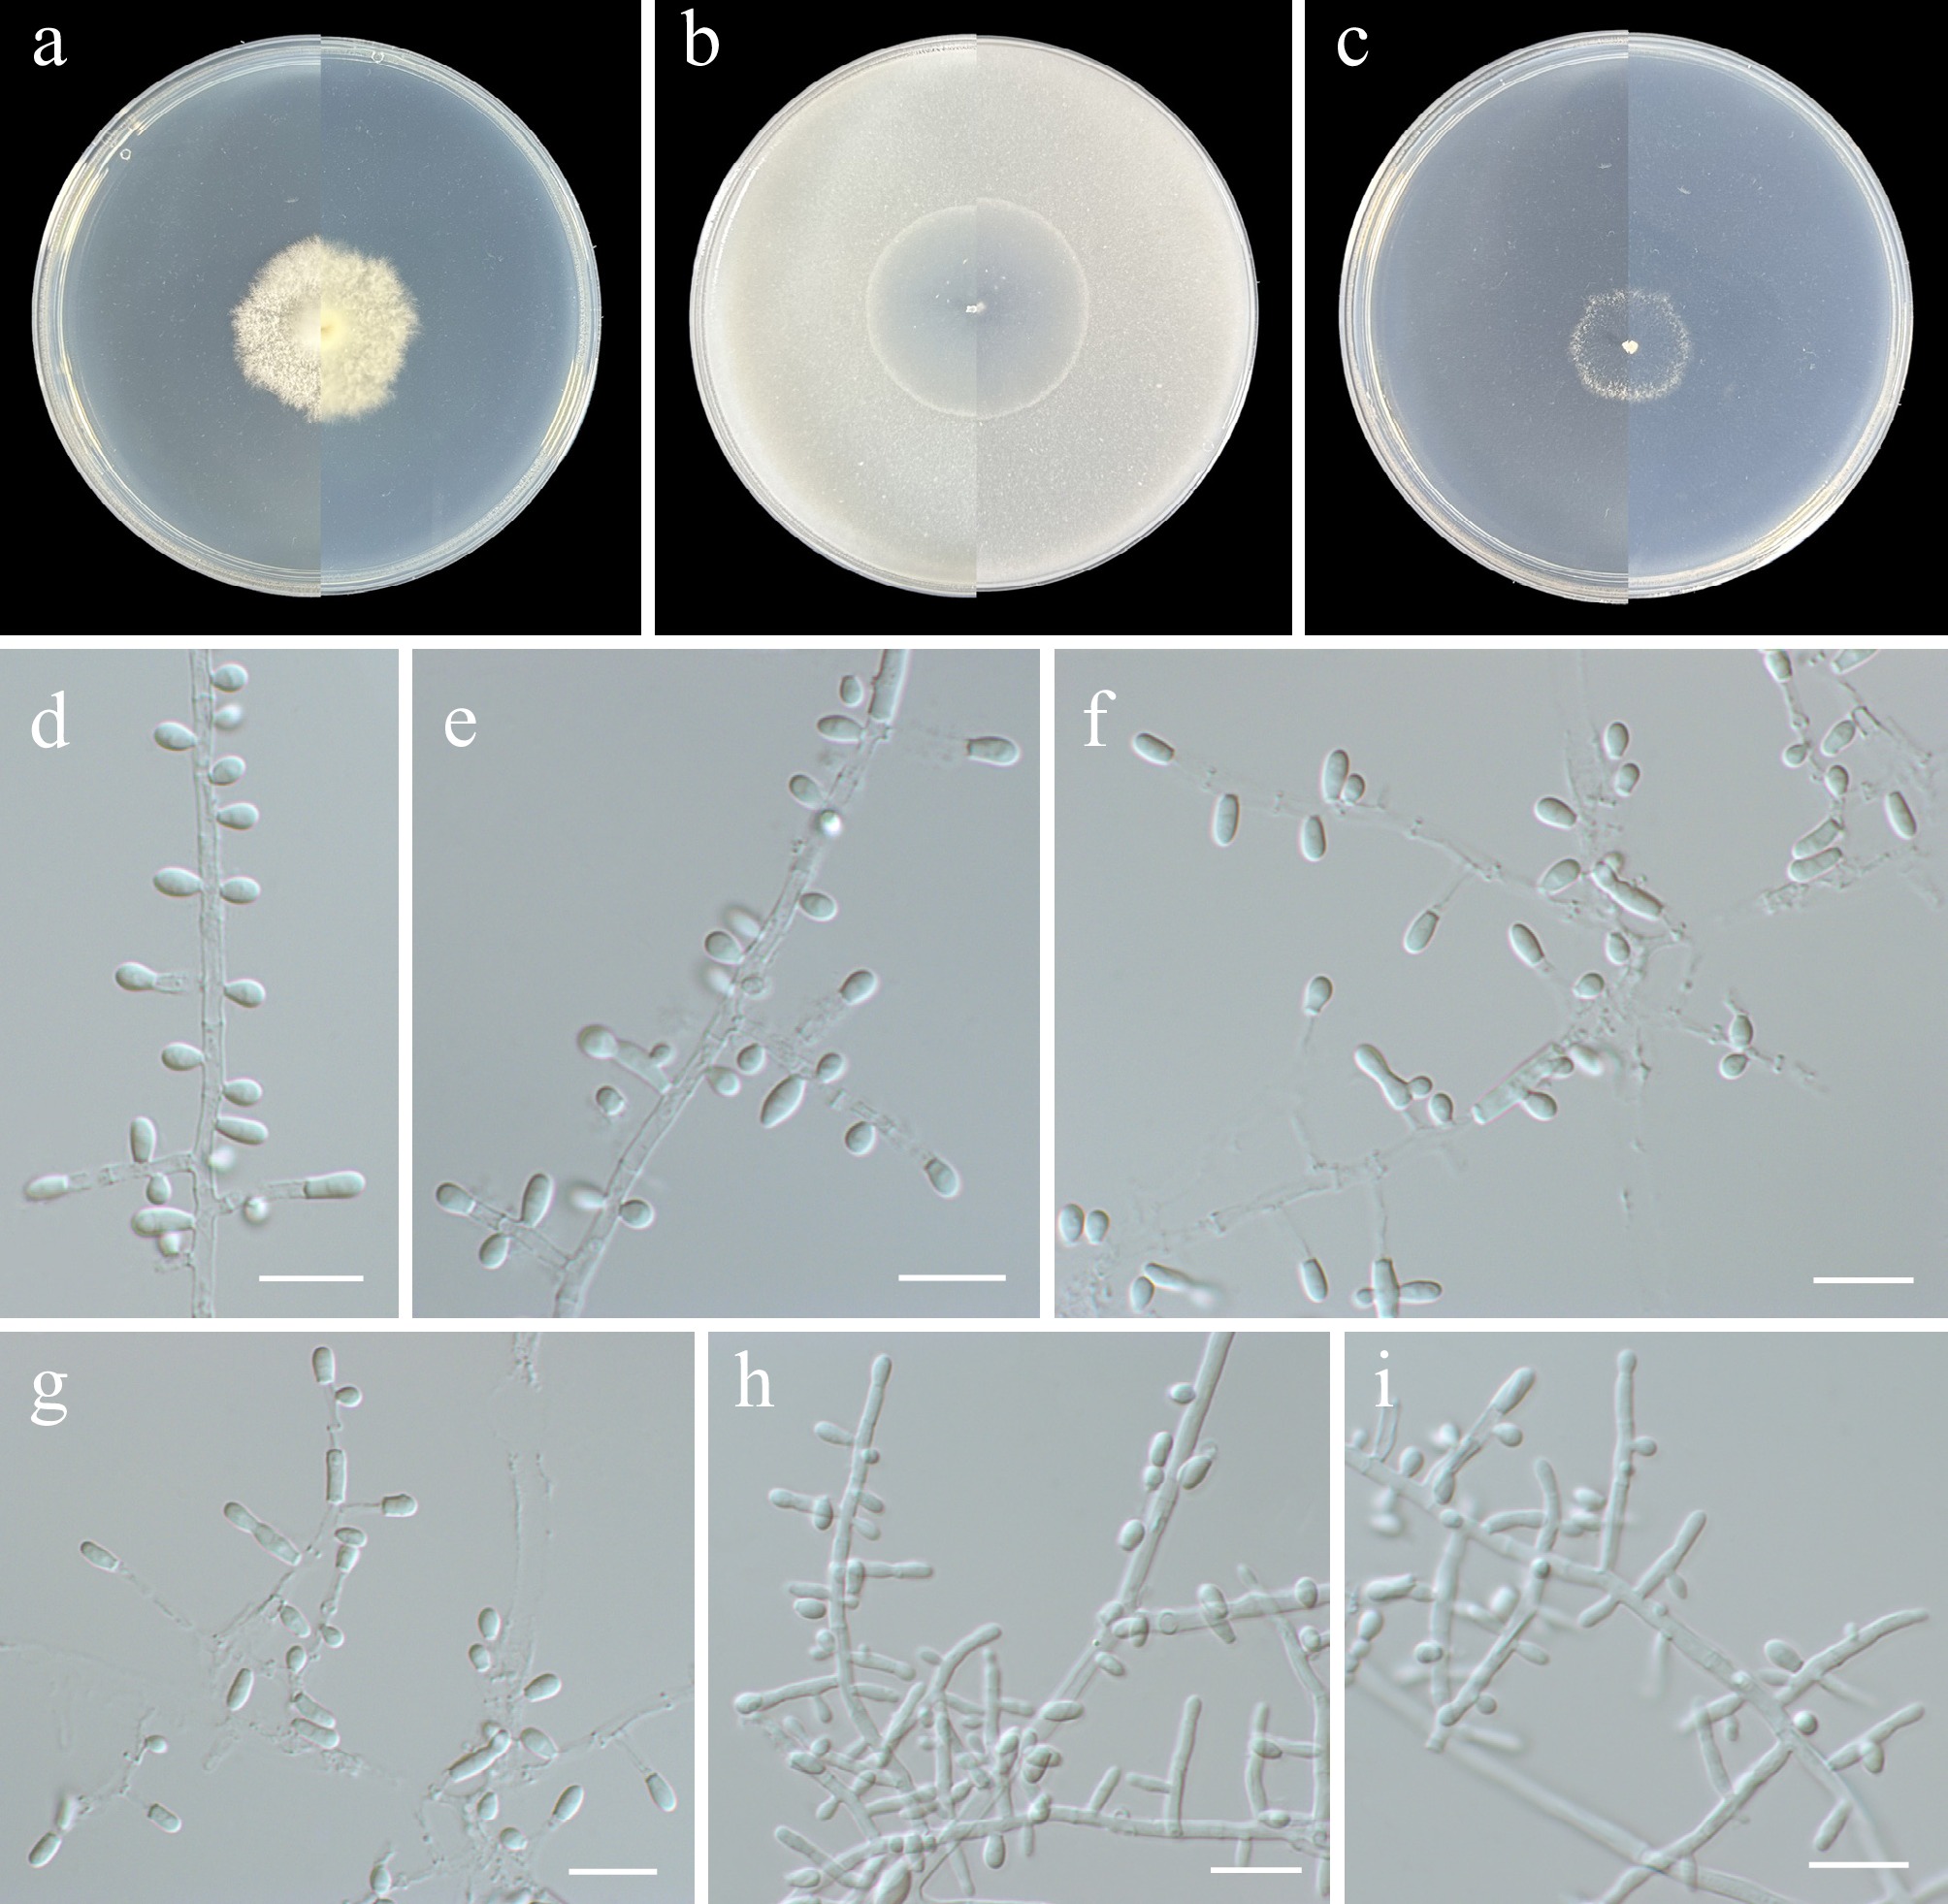
Figure 17.
Nannizziopsis sinensis (from holotype ZY H-23.030). (a)–(c) Upper and reverse views of cultures on PDA, OA, and SNA after 14 d at 25 °C. (d)–(f), (h), (i) Fertile hyphae bearing mostly sessile conidia. (g) Intercalary conidia. Scale bars: (d)–(i) 10 μm.
-
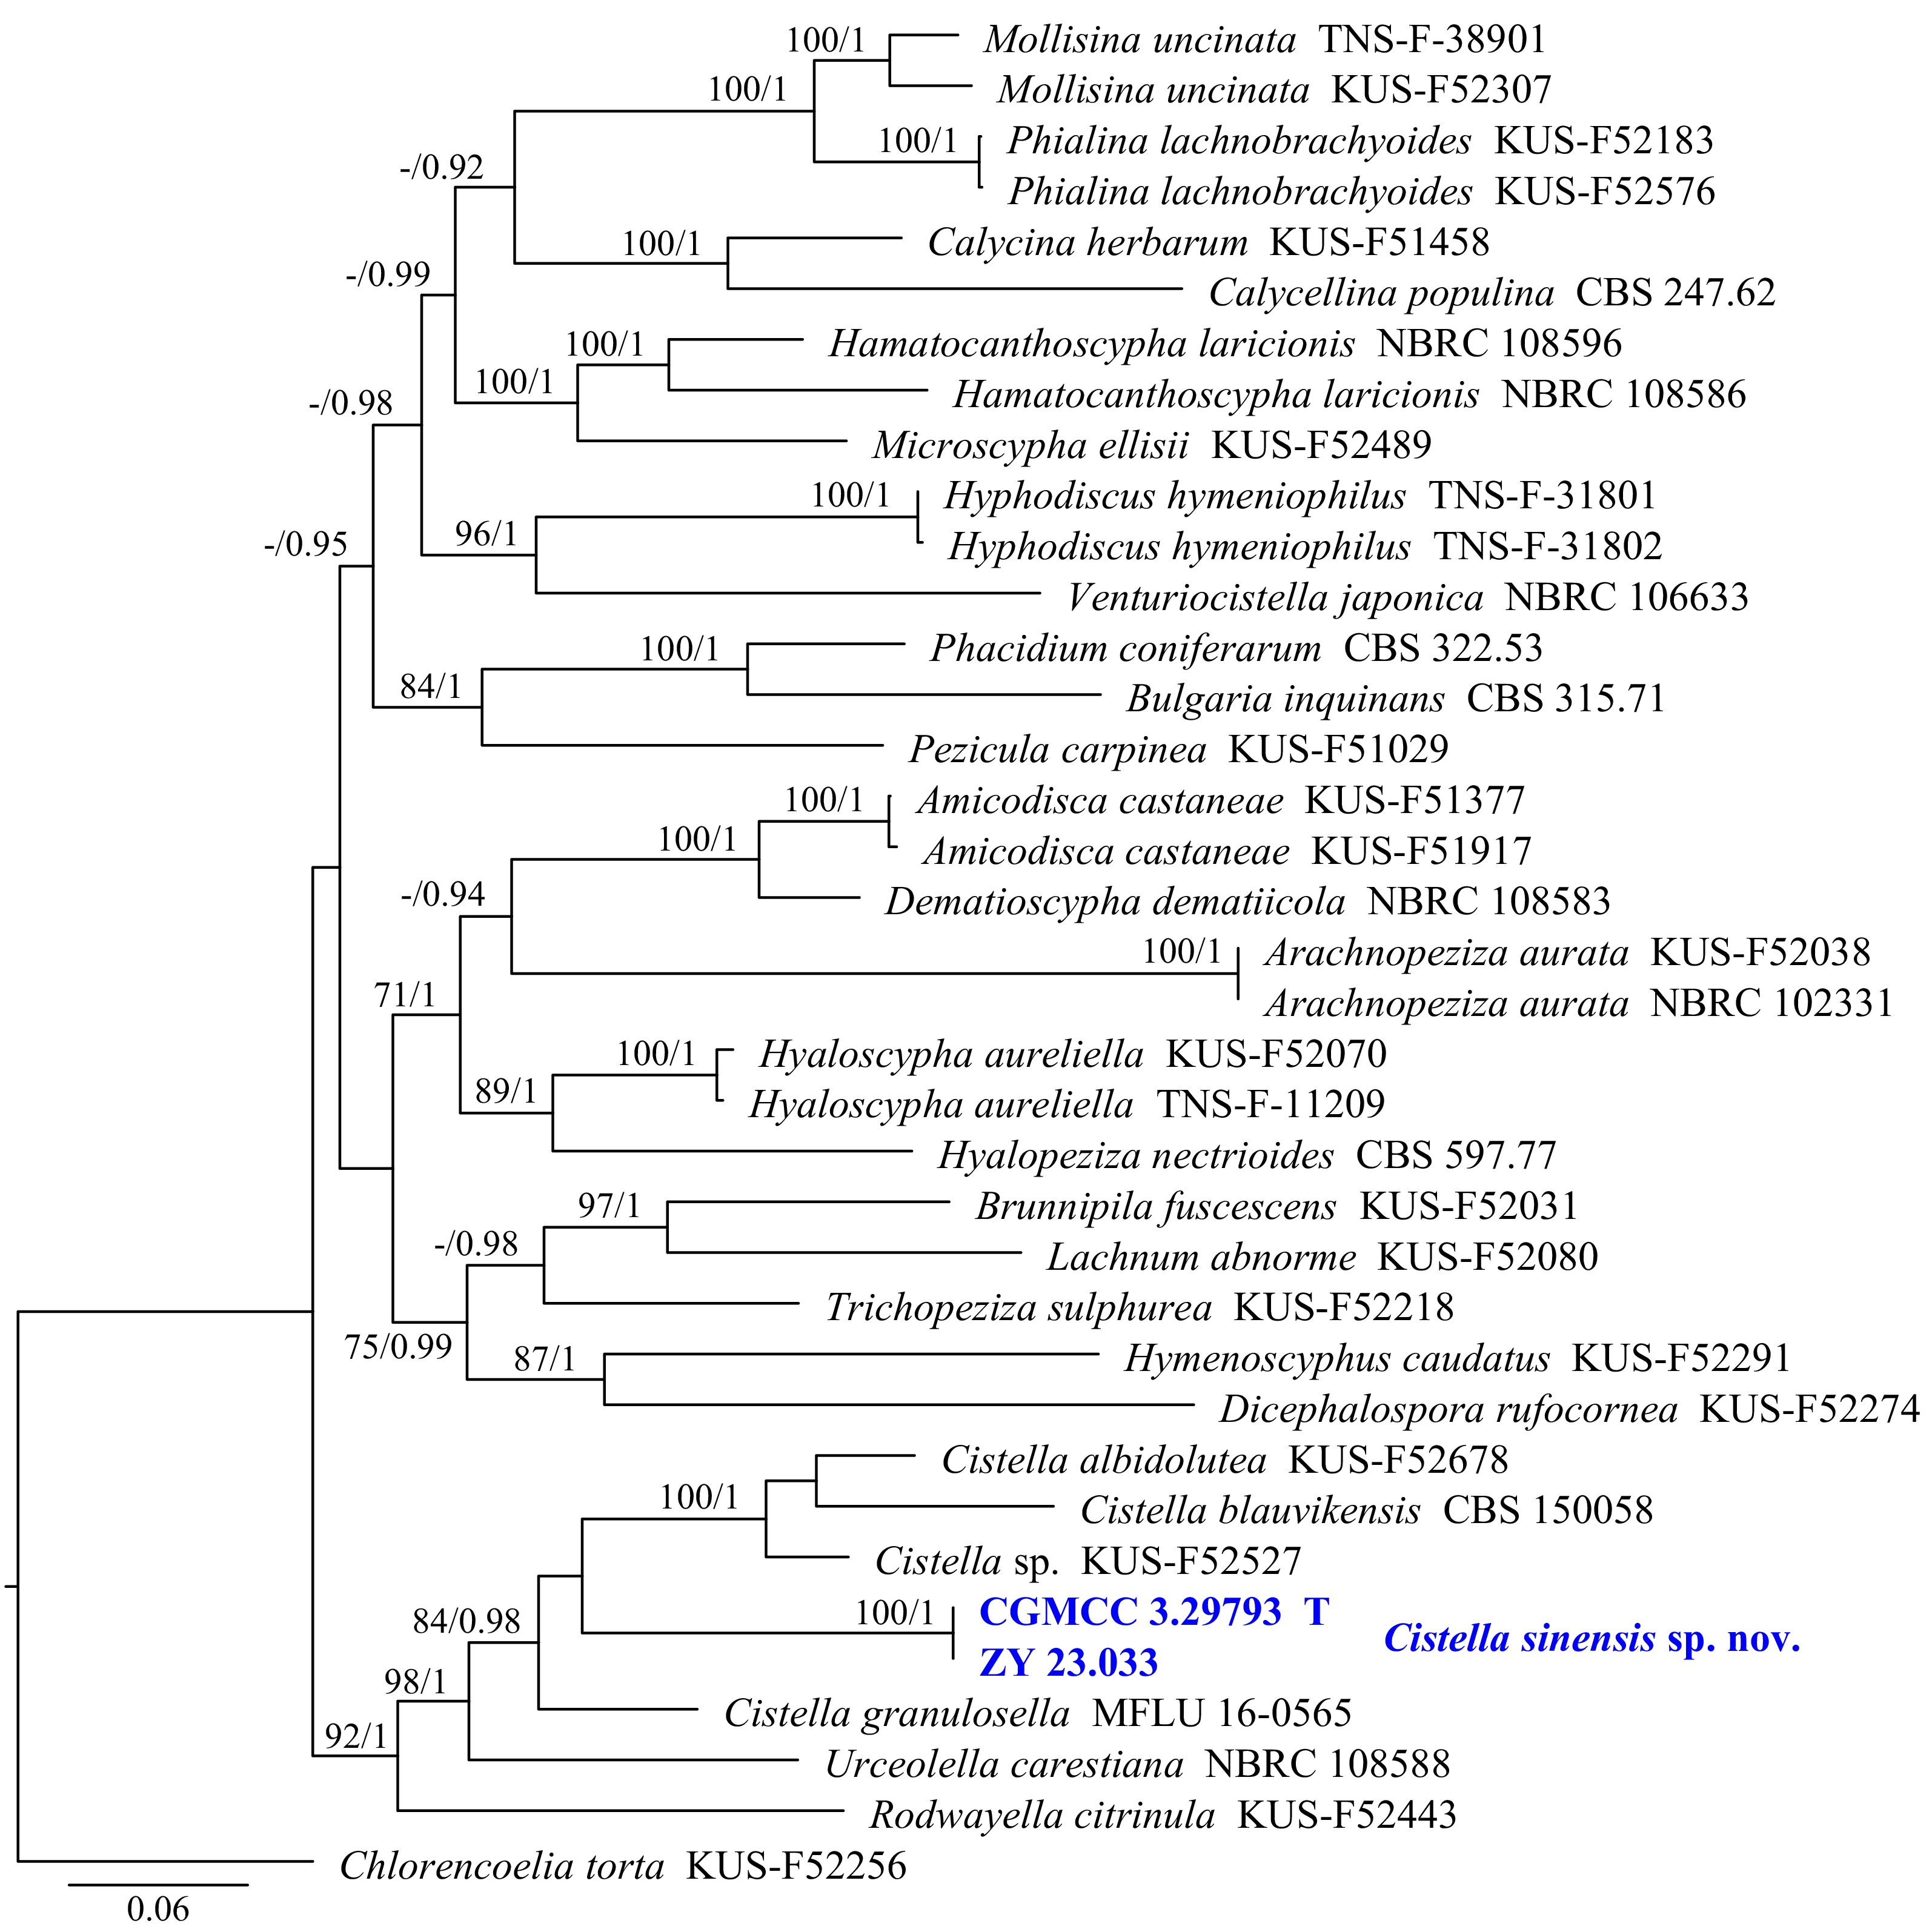
Figure 18.
Phylogram generated from ML analysis based on the combined dataset of ITS, LSU, and RPB2 sequence data. Numbers at branches indicate support values (IQ-TREE-BS/BI-PP) above 70%/0.90. Newly generated sequences are in bold and blue, and 'T' indicates type-derived sequences. The tree is rooted to Chlorencoelia torta (KUS-F 52256). The scale bar represents the expected number of changes per site.
-
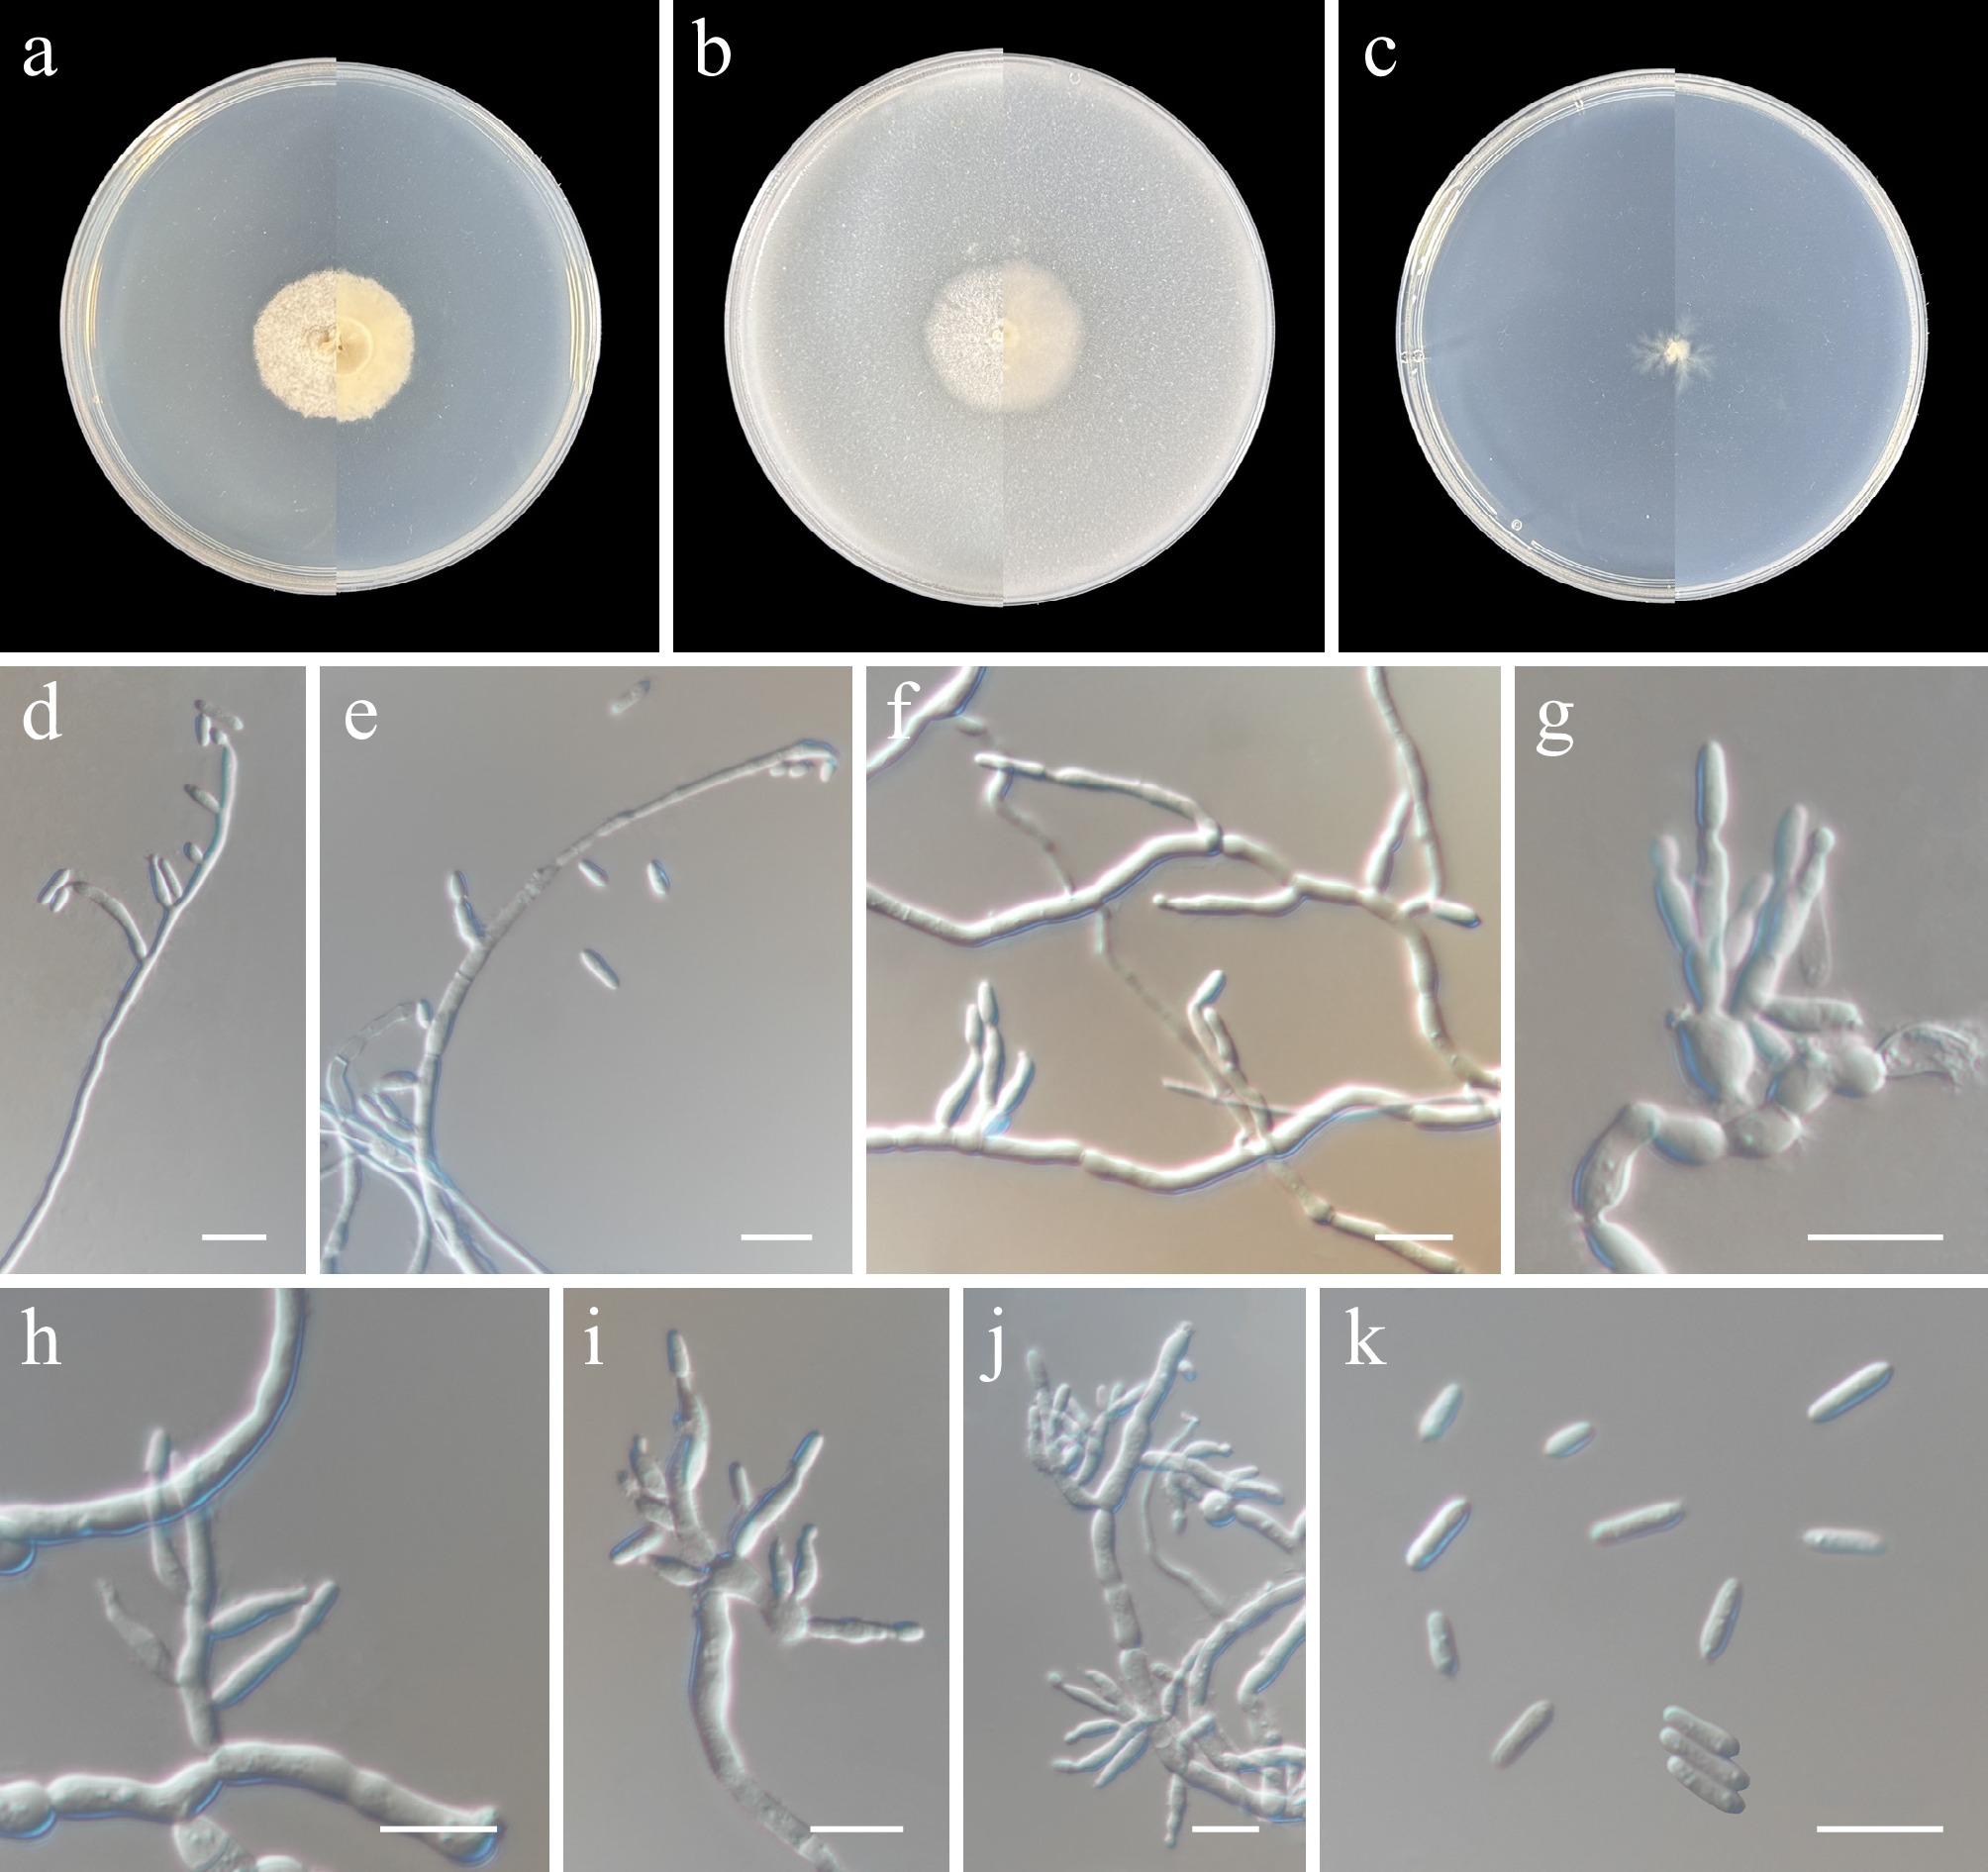
Figure 19.
Cistella sinensis (from holotype ZY H-23.032). (a)–(c) Upper and reverse views of cultures on PDA, OA, and SNA after 14 d at 25 °C. (d)–(f) Phialides and conidia. (g)–(j) Conidiophores and phialides. (k) Conidia. Scale bars: (d)–(k) 10 μm.
-
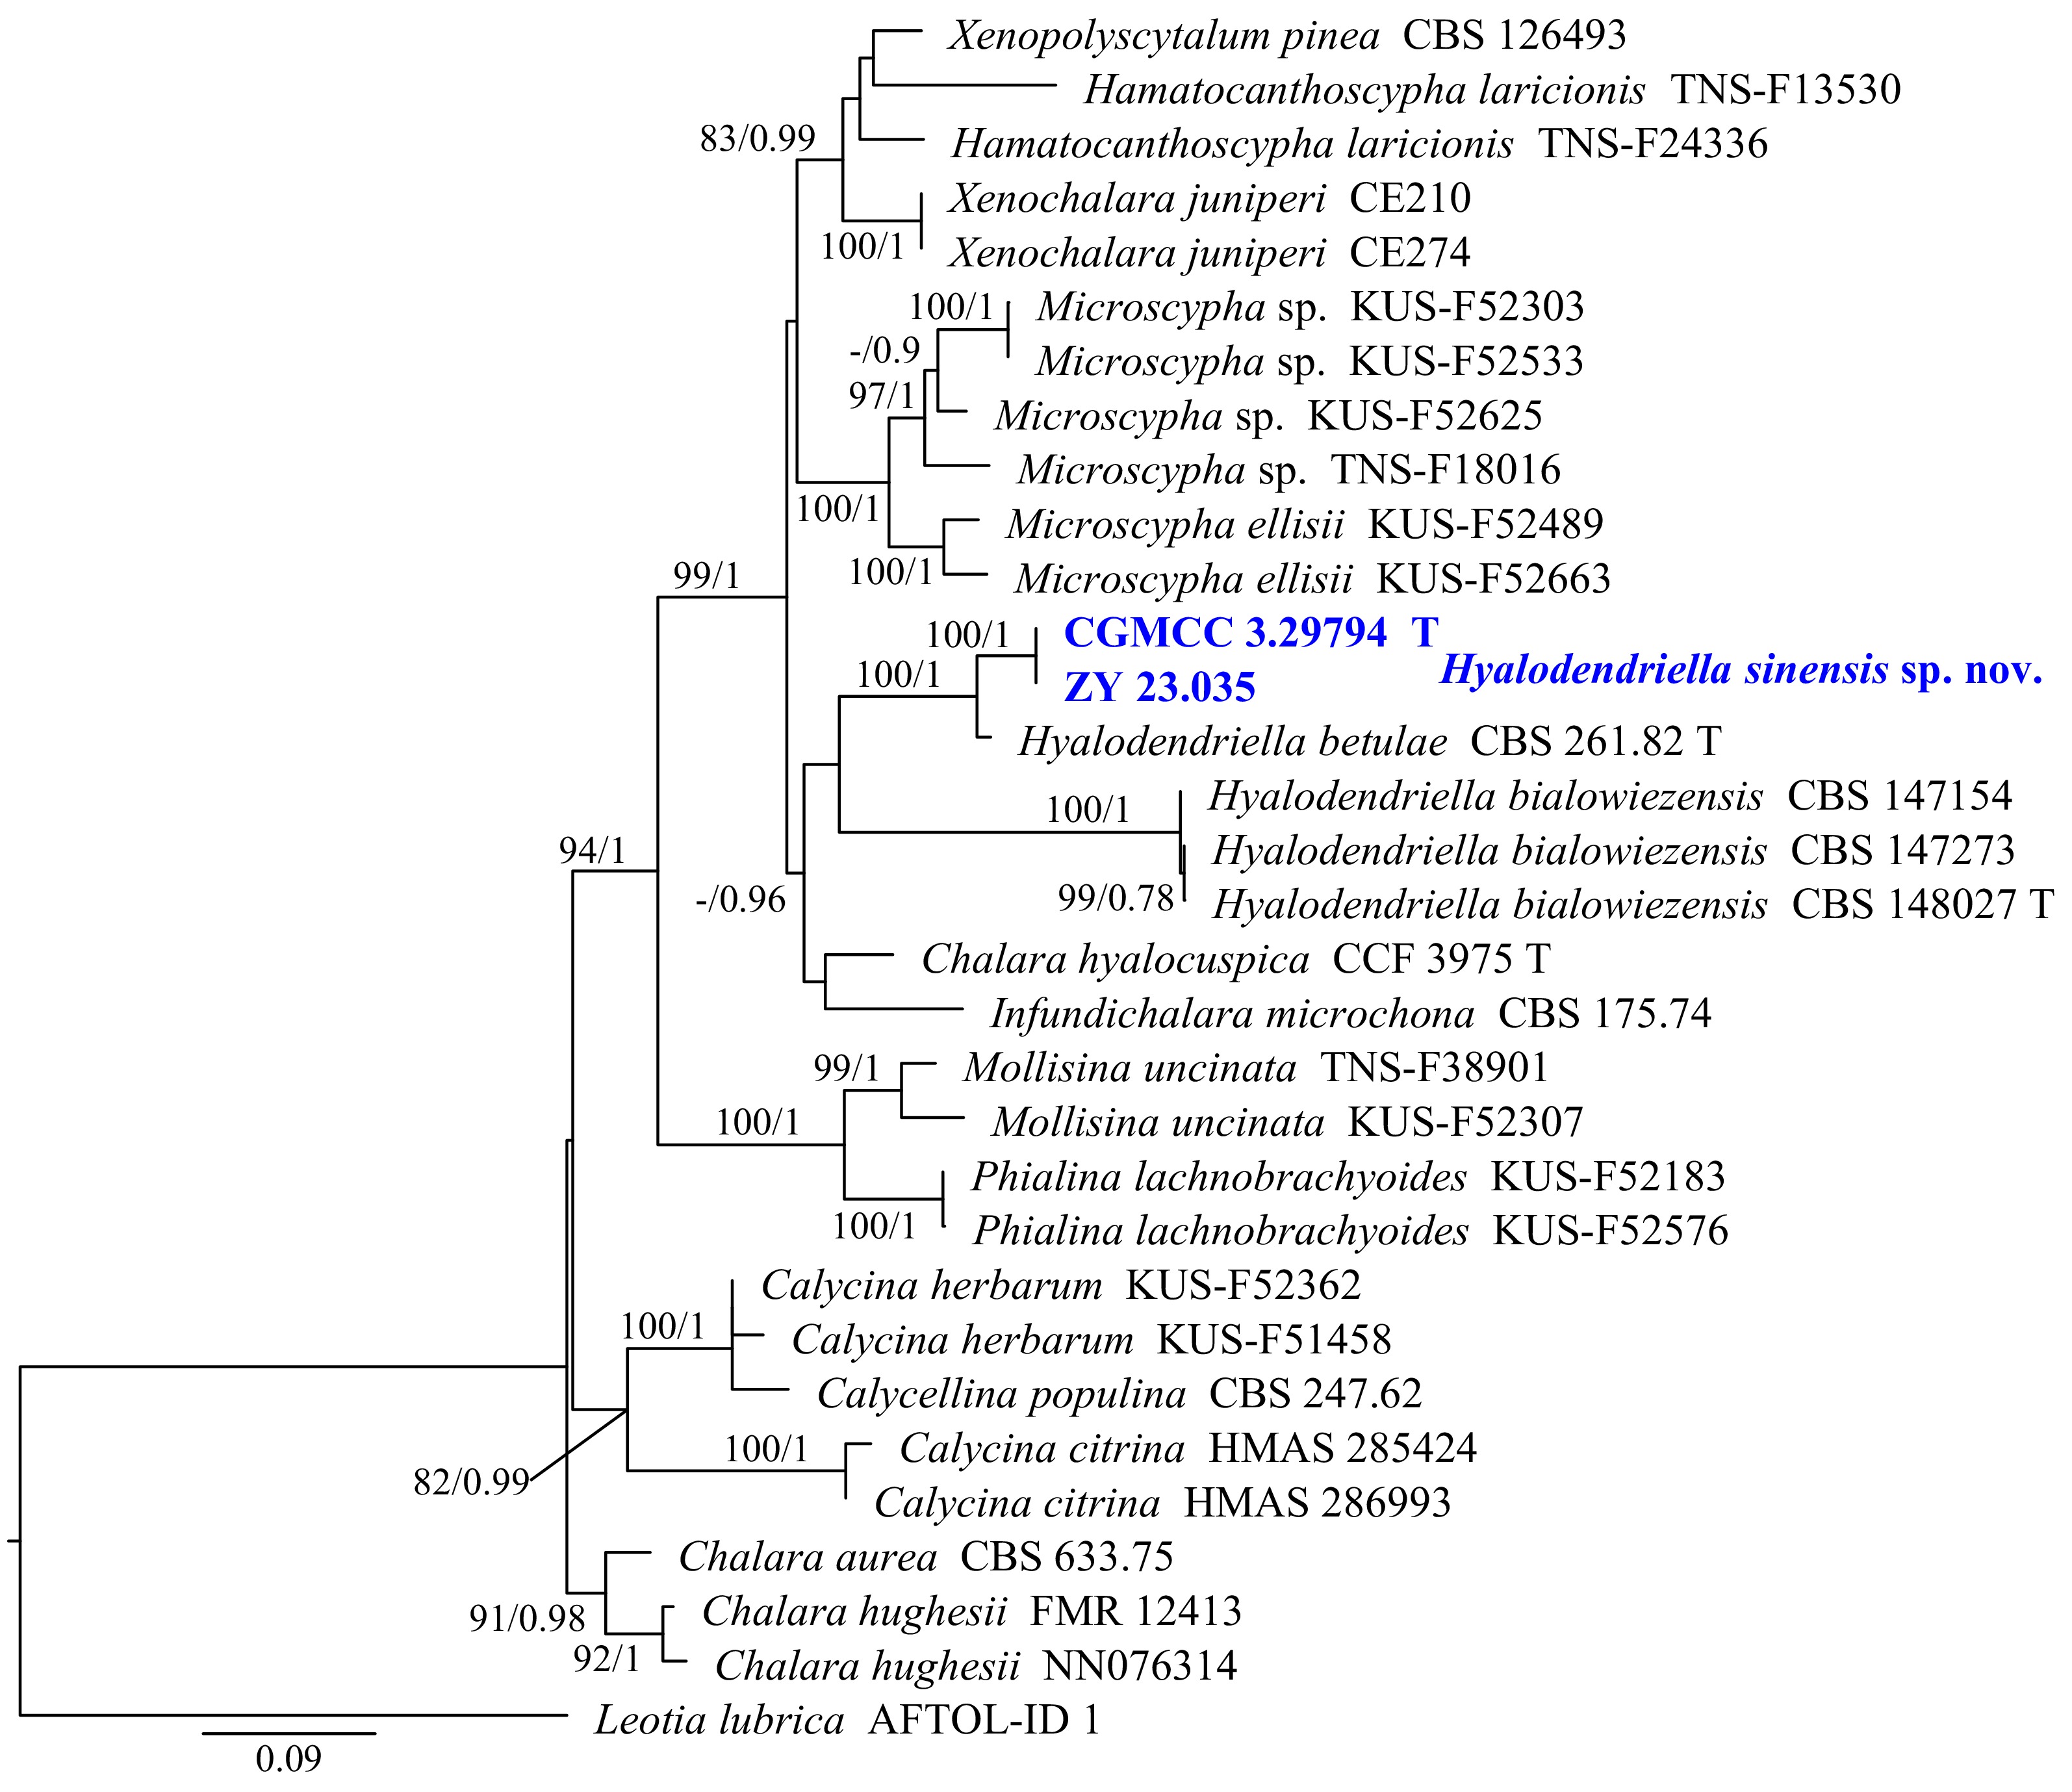
Figure 20.
Phylogram generated from ML analysis based on the combined dataset of ITS, LSU, and RPB2 sequence data. Numbers at branches indicate support values (IQ-TREE-BS/BI-PP) above 70%/0.90. Newly generated sequences are in bold and blue, and 'T' indicates type-derived sequences. The tree is rooted to Leotia lubrica (AFTOL-ID 1). The scale bar represents the expected number of changes per site.
-
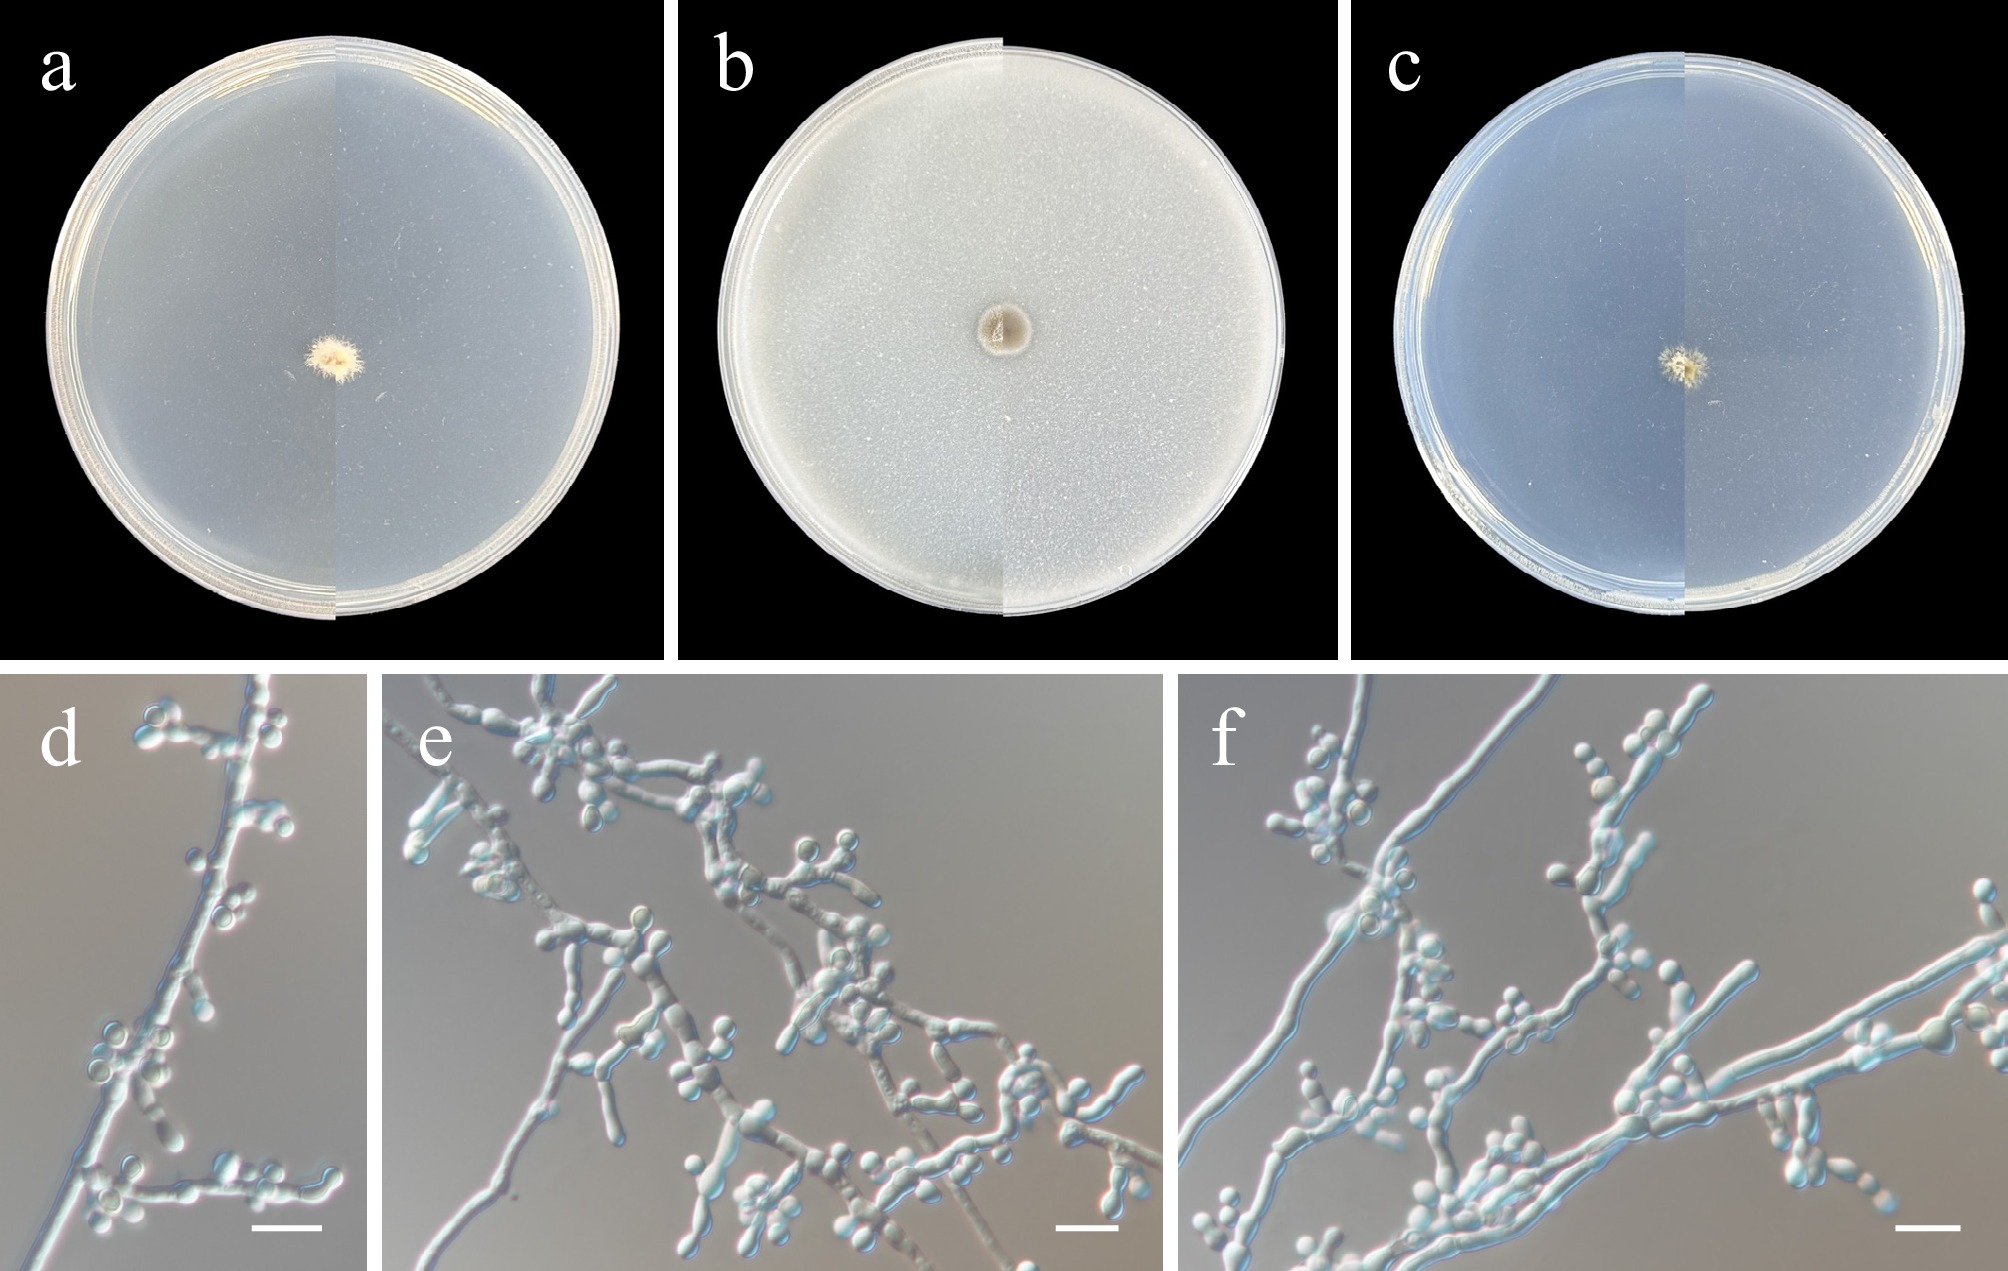
Figure 21.
Hyalodendriella sinensis (from holotype ZY H-23.034). (a)–(c) Upper and reverse views of cultures on PDA, OA, and SNA after 14 d at 25 °C. (d)–(f) Conidiogenous cells and conidia. Scale bars: (d)–(f) 10 μm.
-
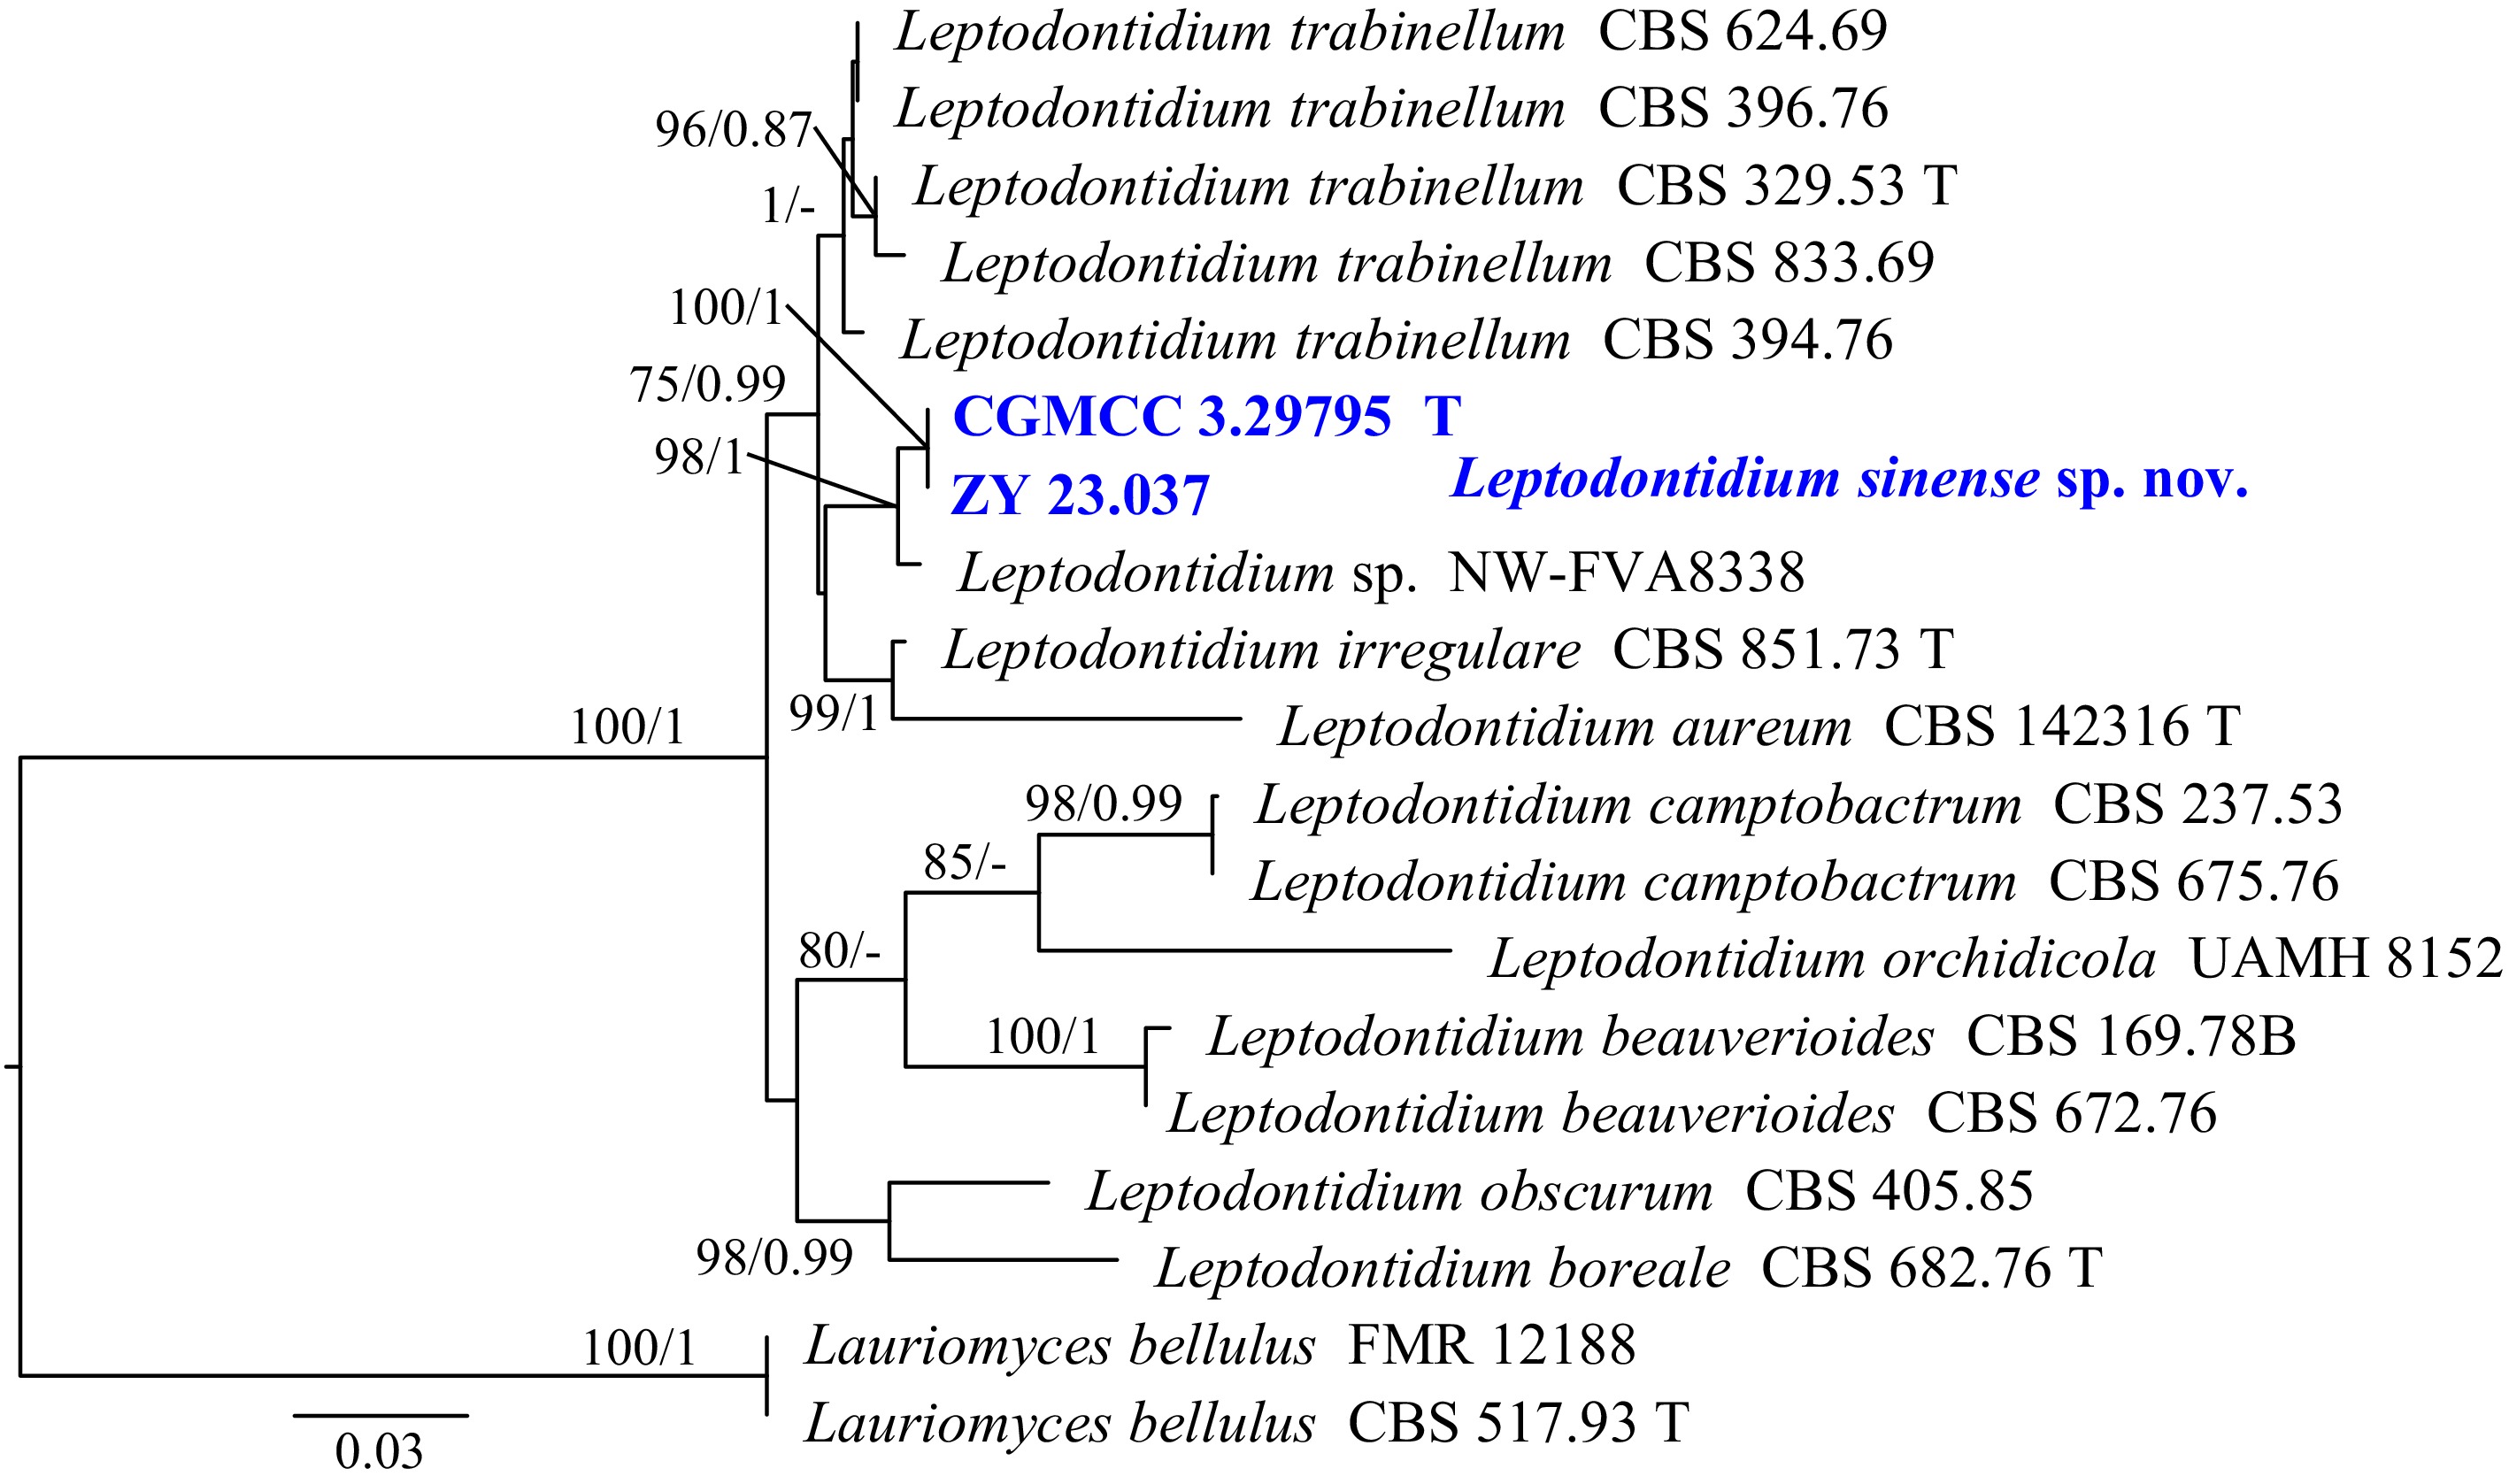
Figure 22.
Phylogram generated from ML analysis based on the combined dataset of ITS and LSU sequence data. Numbers at branches indicate support values (IQ-TREE-BS/BI-PP) above 70%/0.90. The tree is rooted to Lauriomyces bellulus (FMR 12188 and CBS 517.93). Newly generated sequences are in bold and blue, and 'T' indicates type-derived sequences. The scale bar represents the expected number of changes per site.
-
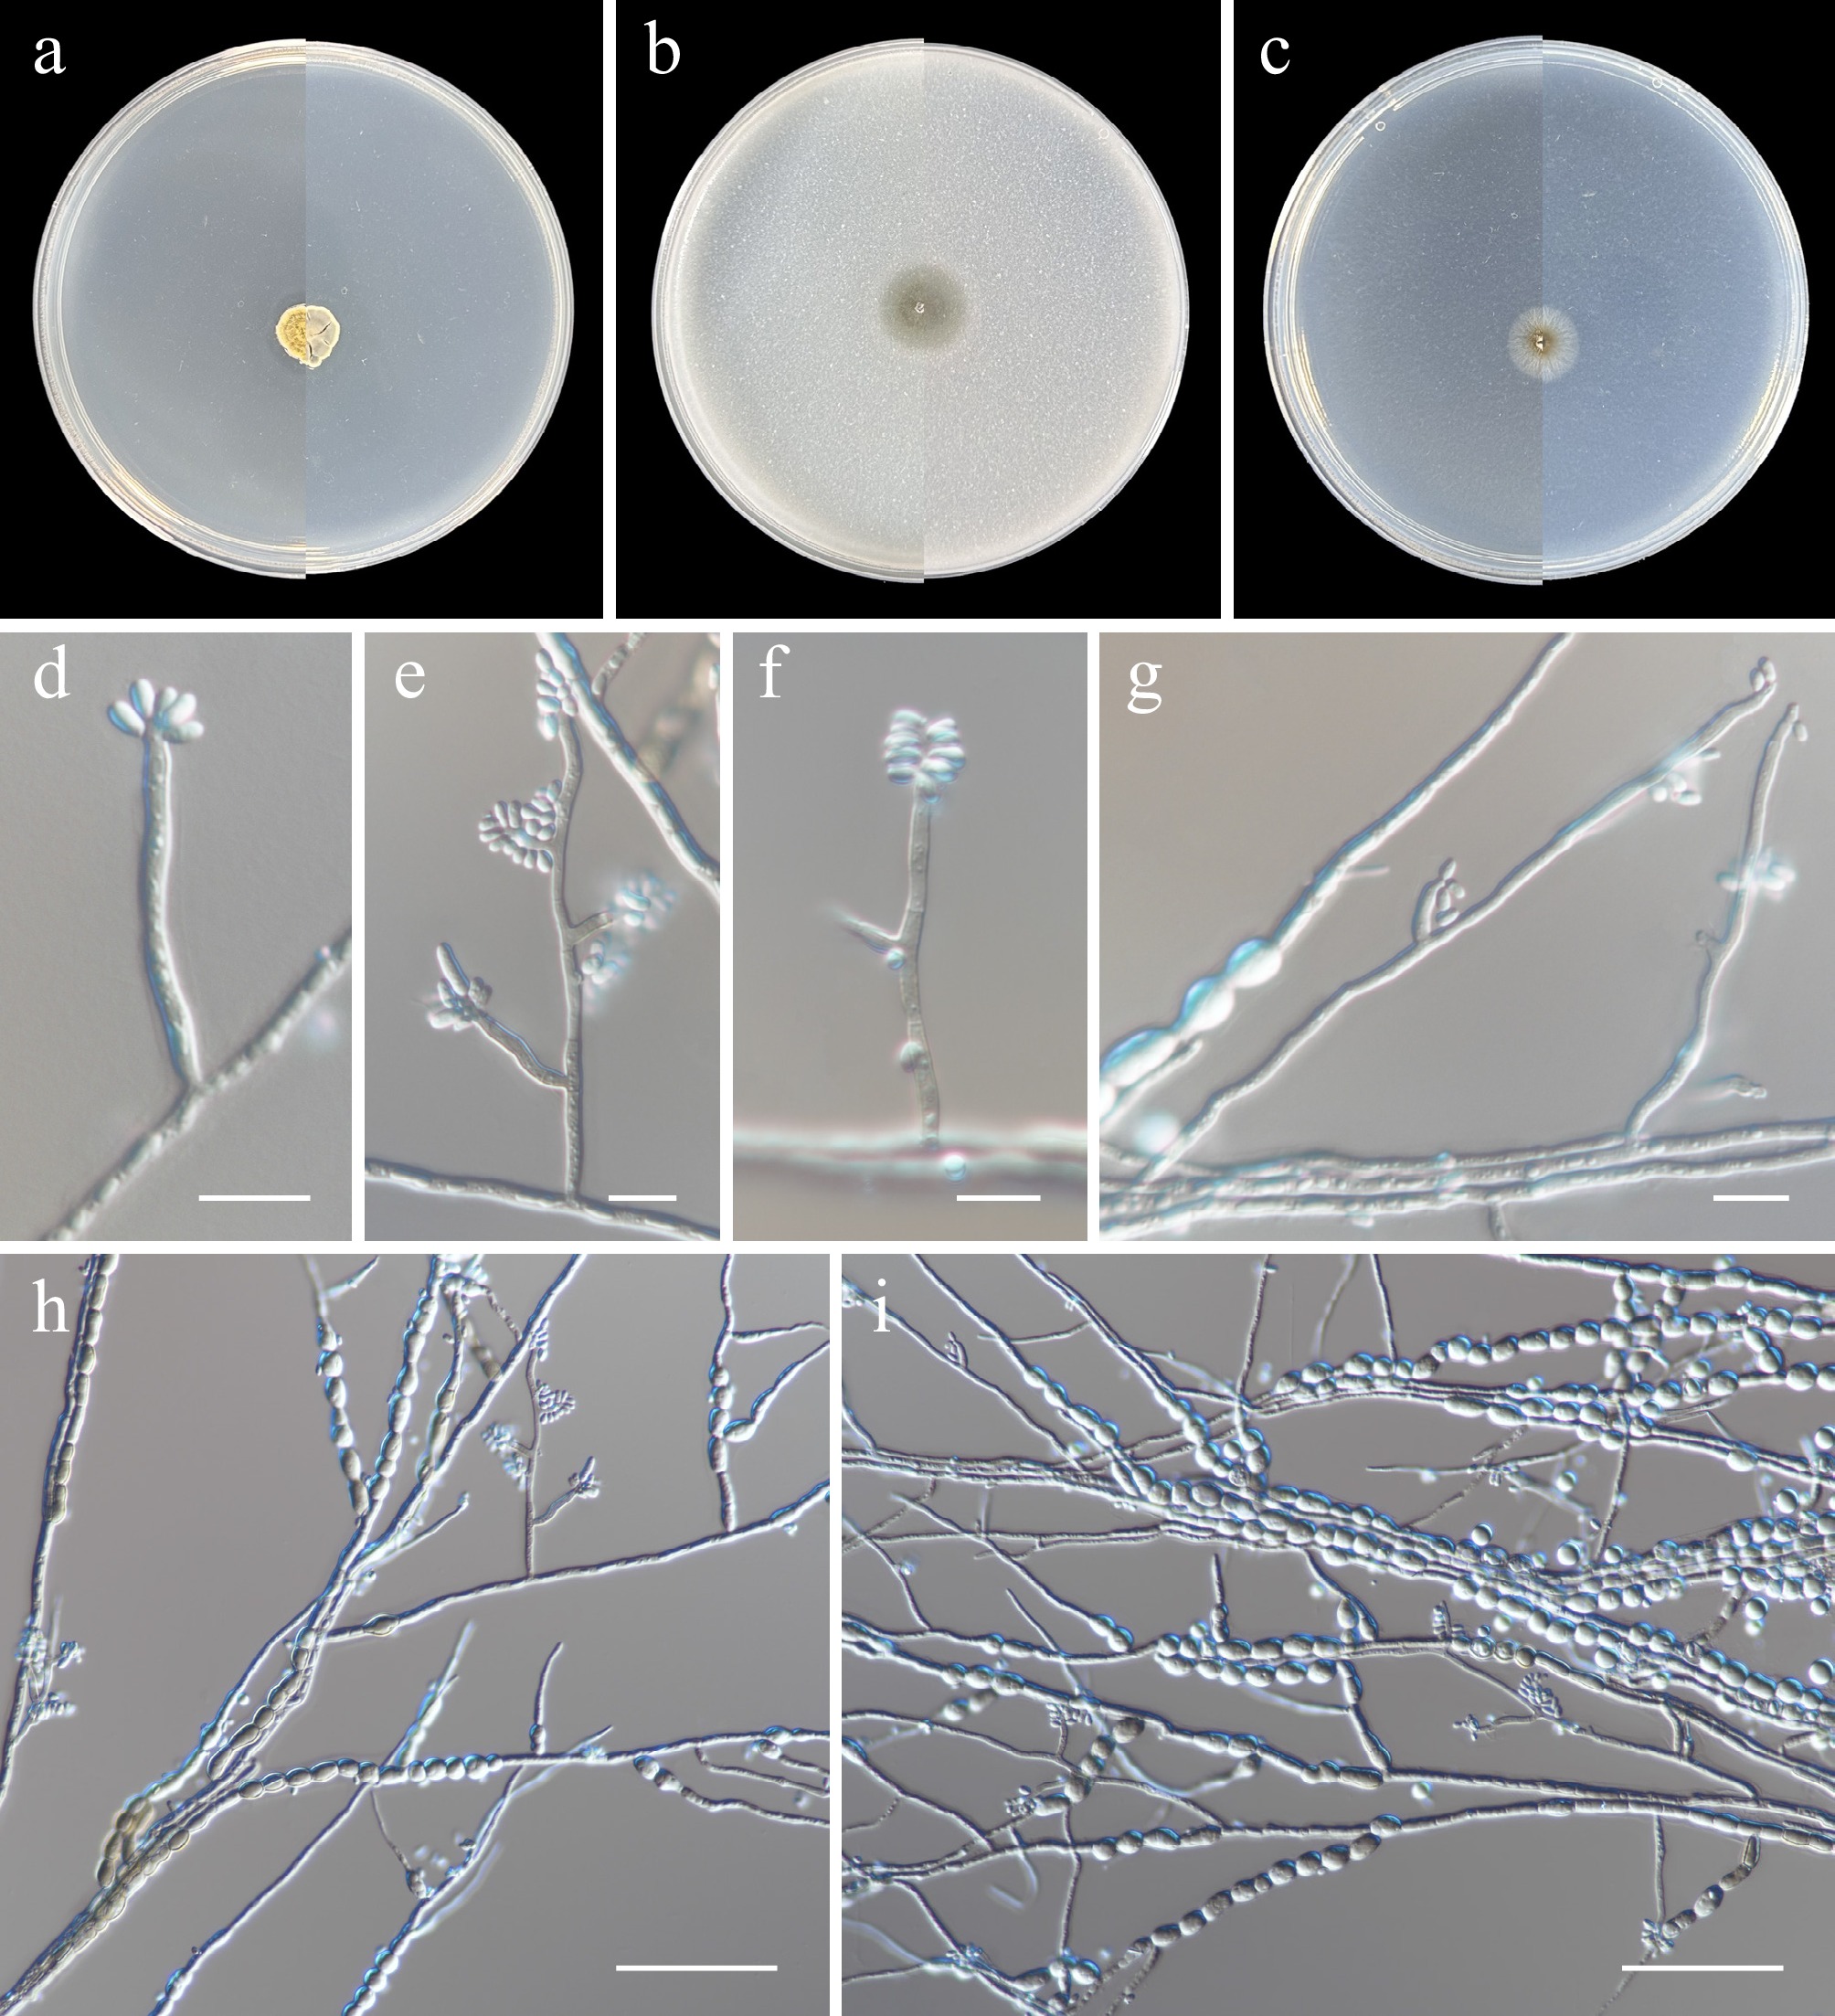
Figure 23.
Leptodontidium sinense (from holotype ZY H-23.036). (a)–(c) Upper and reverse views of cultures on PDA, OA, and SNA after 14 d at 25 °C. (d)–(g) Conidiophores, conidiogenous cells, and conidia. (h), (i) Conidia and chlamydospores. Scale bars: (d)–(g) 10 μm; (h), (i) 50 μm.
-
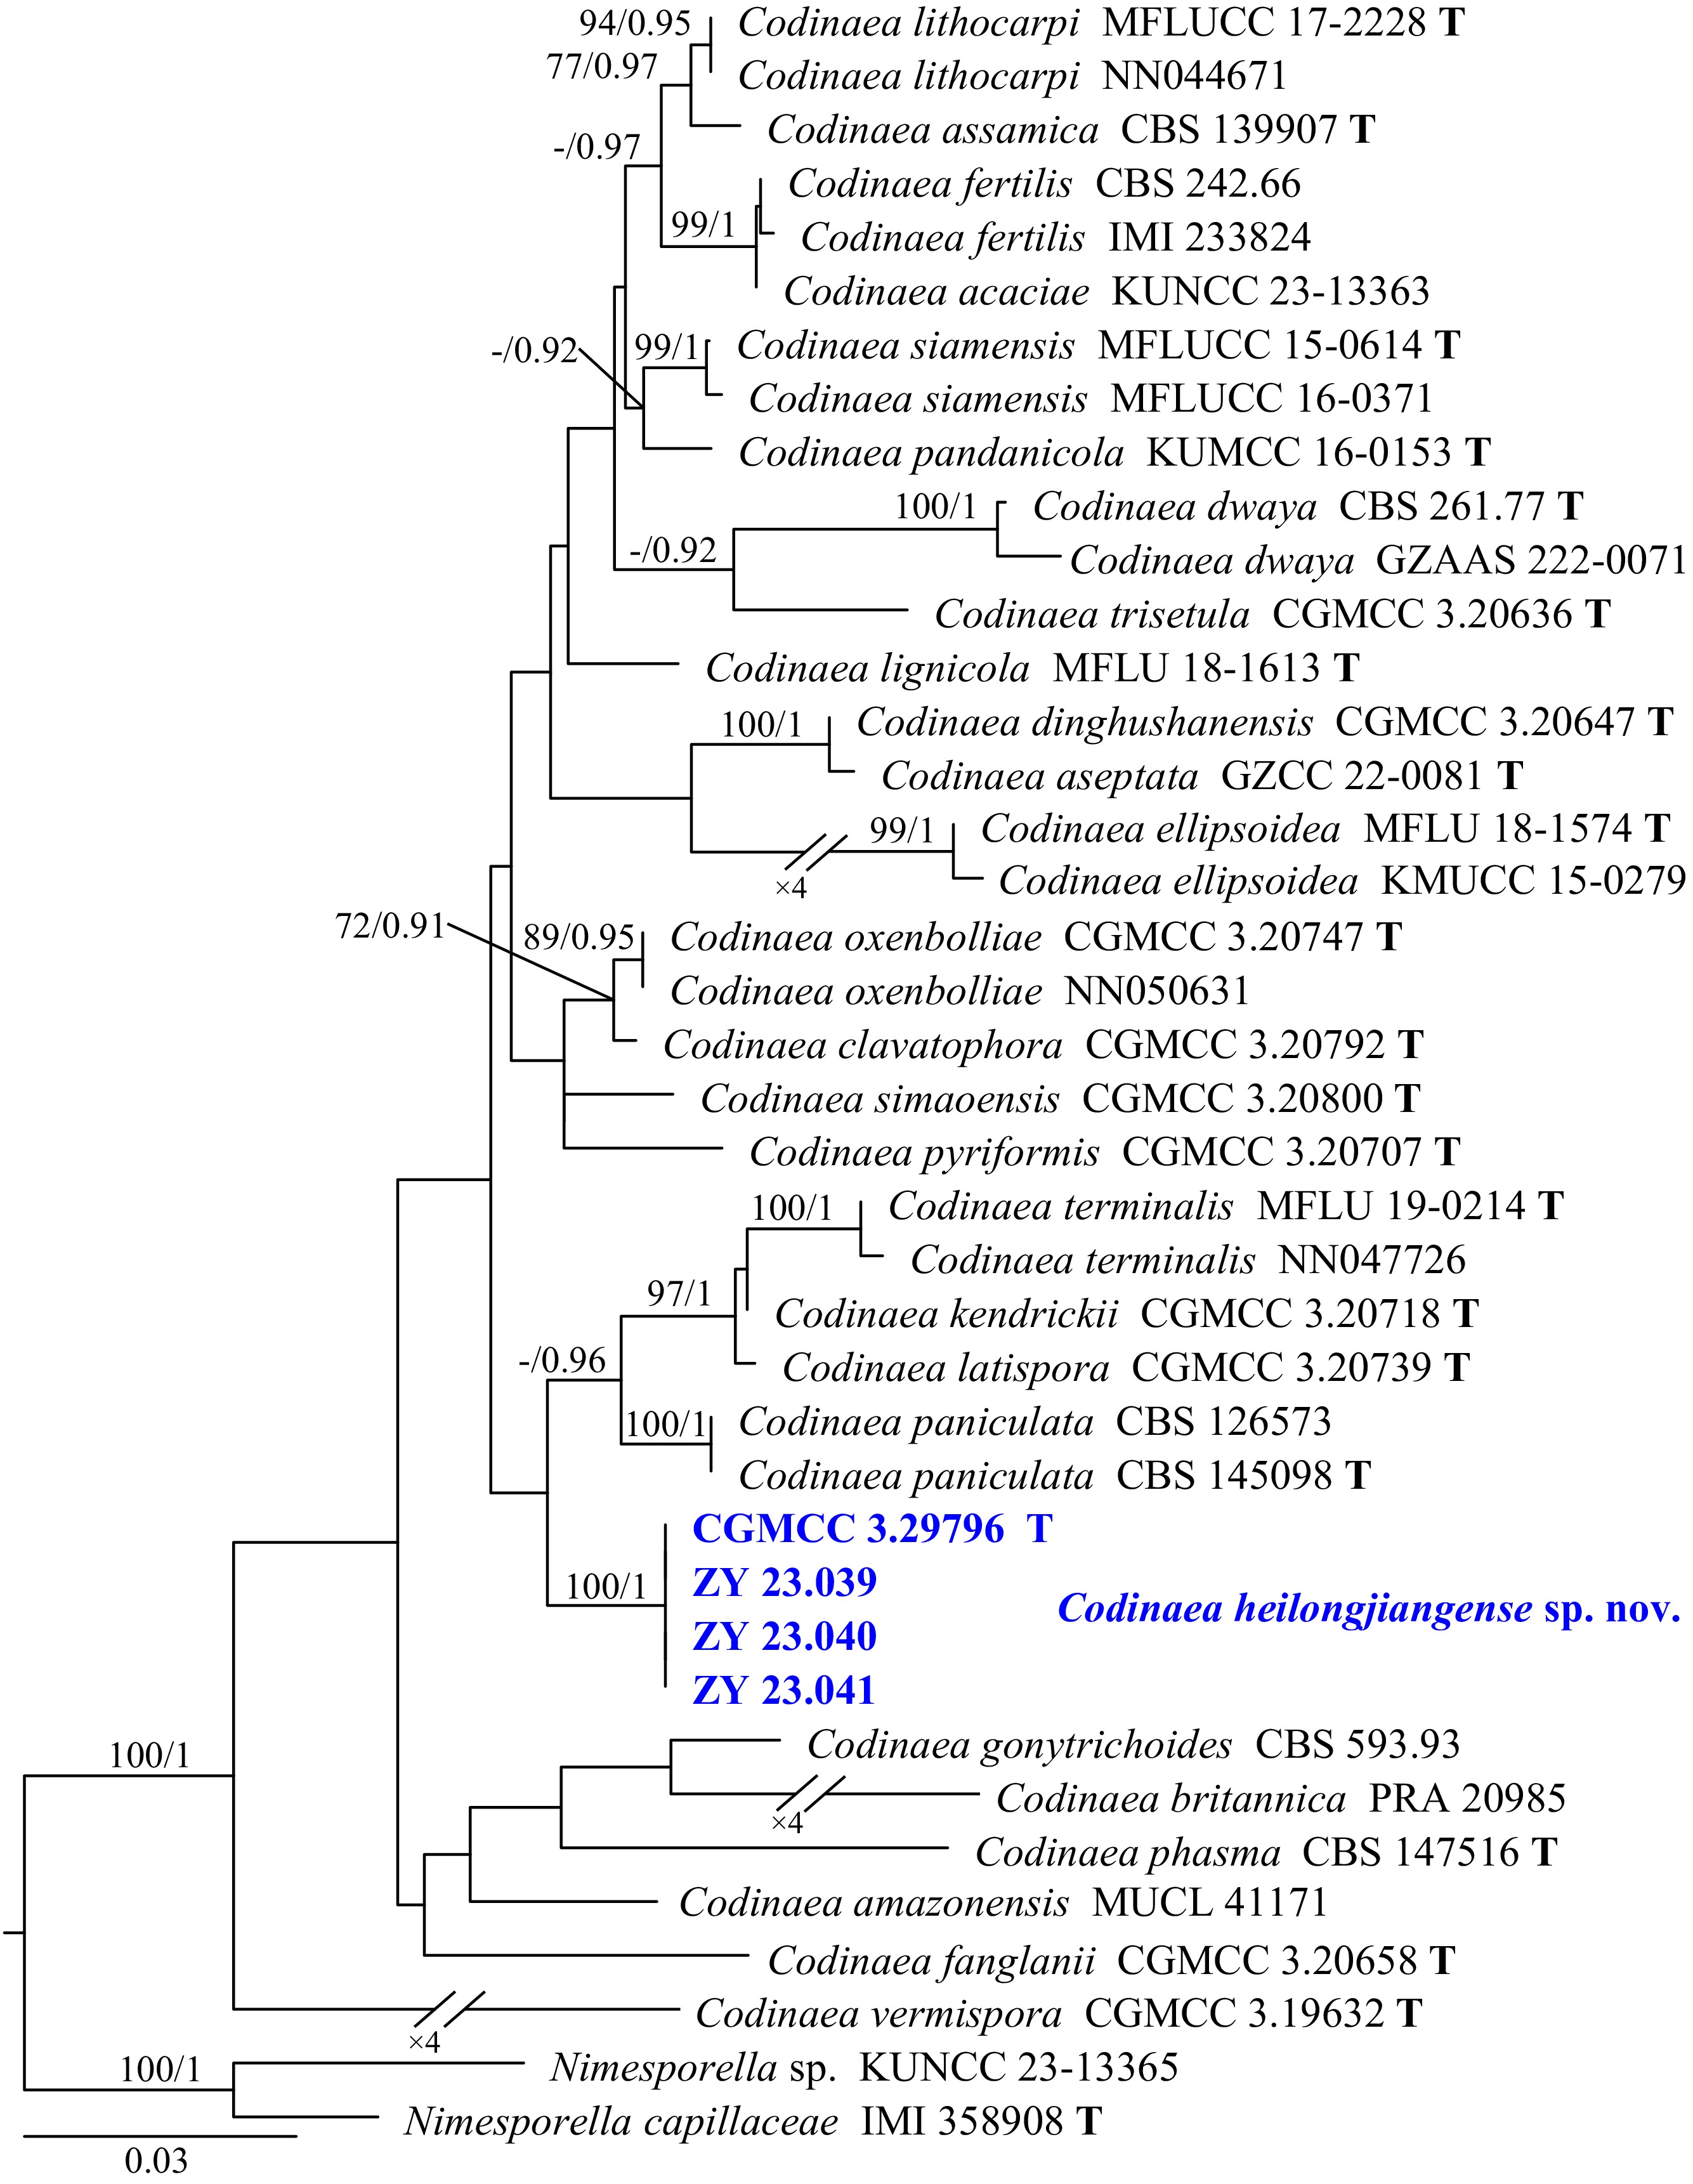
Figure 24.
Phylogram generated from ML analysis based on the combined dataset of ITS, LSU, and TEF1 sequence data. Numbers at branches indicate support values (IQ-TREE-BS/BI-PP) above 70%/0.90. The tree is rooted to Nimesporella sp. (KUNCC 23-13365) and N. capillaceae (IMI 358908). Newly generated sequences are in bold and blue, and 'T' indicates type-derived sequences. The scale bar represents the expected number of changes per site.
-
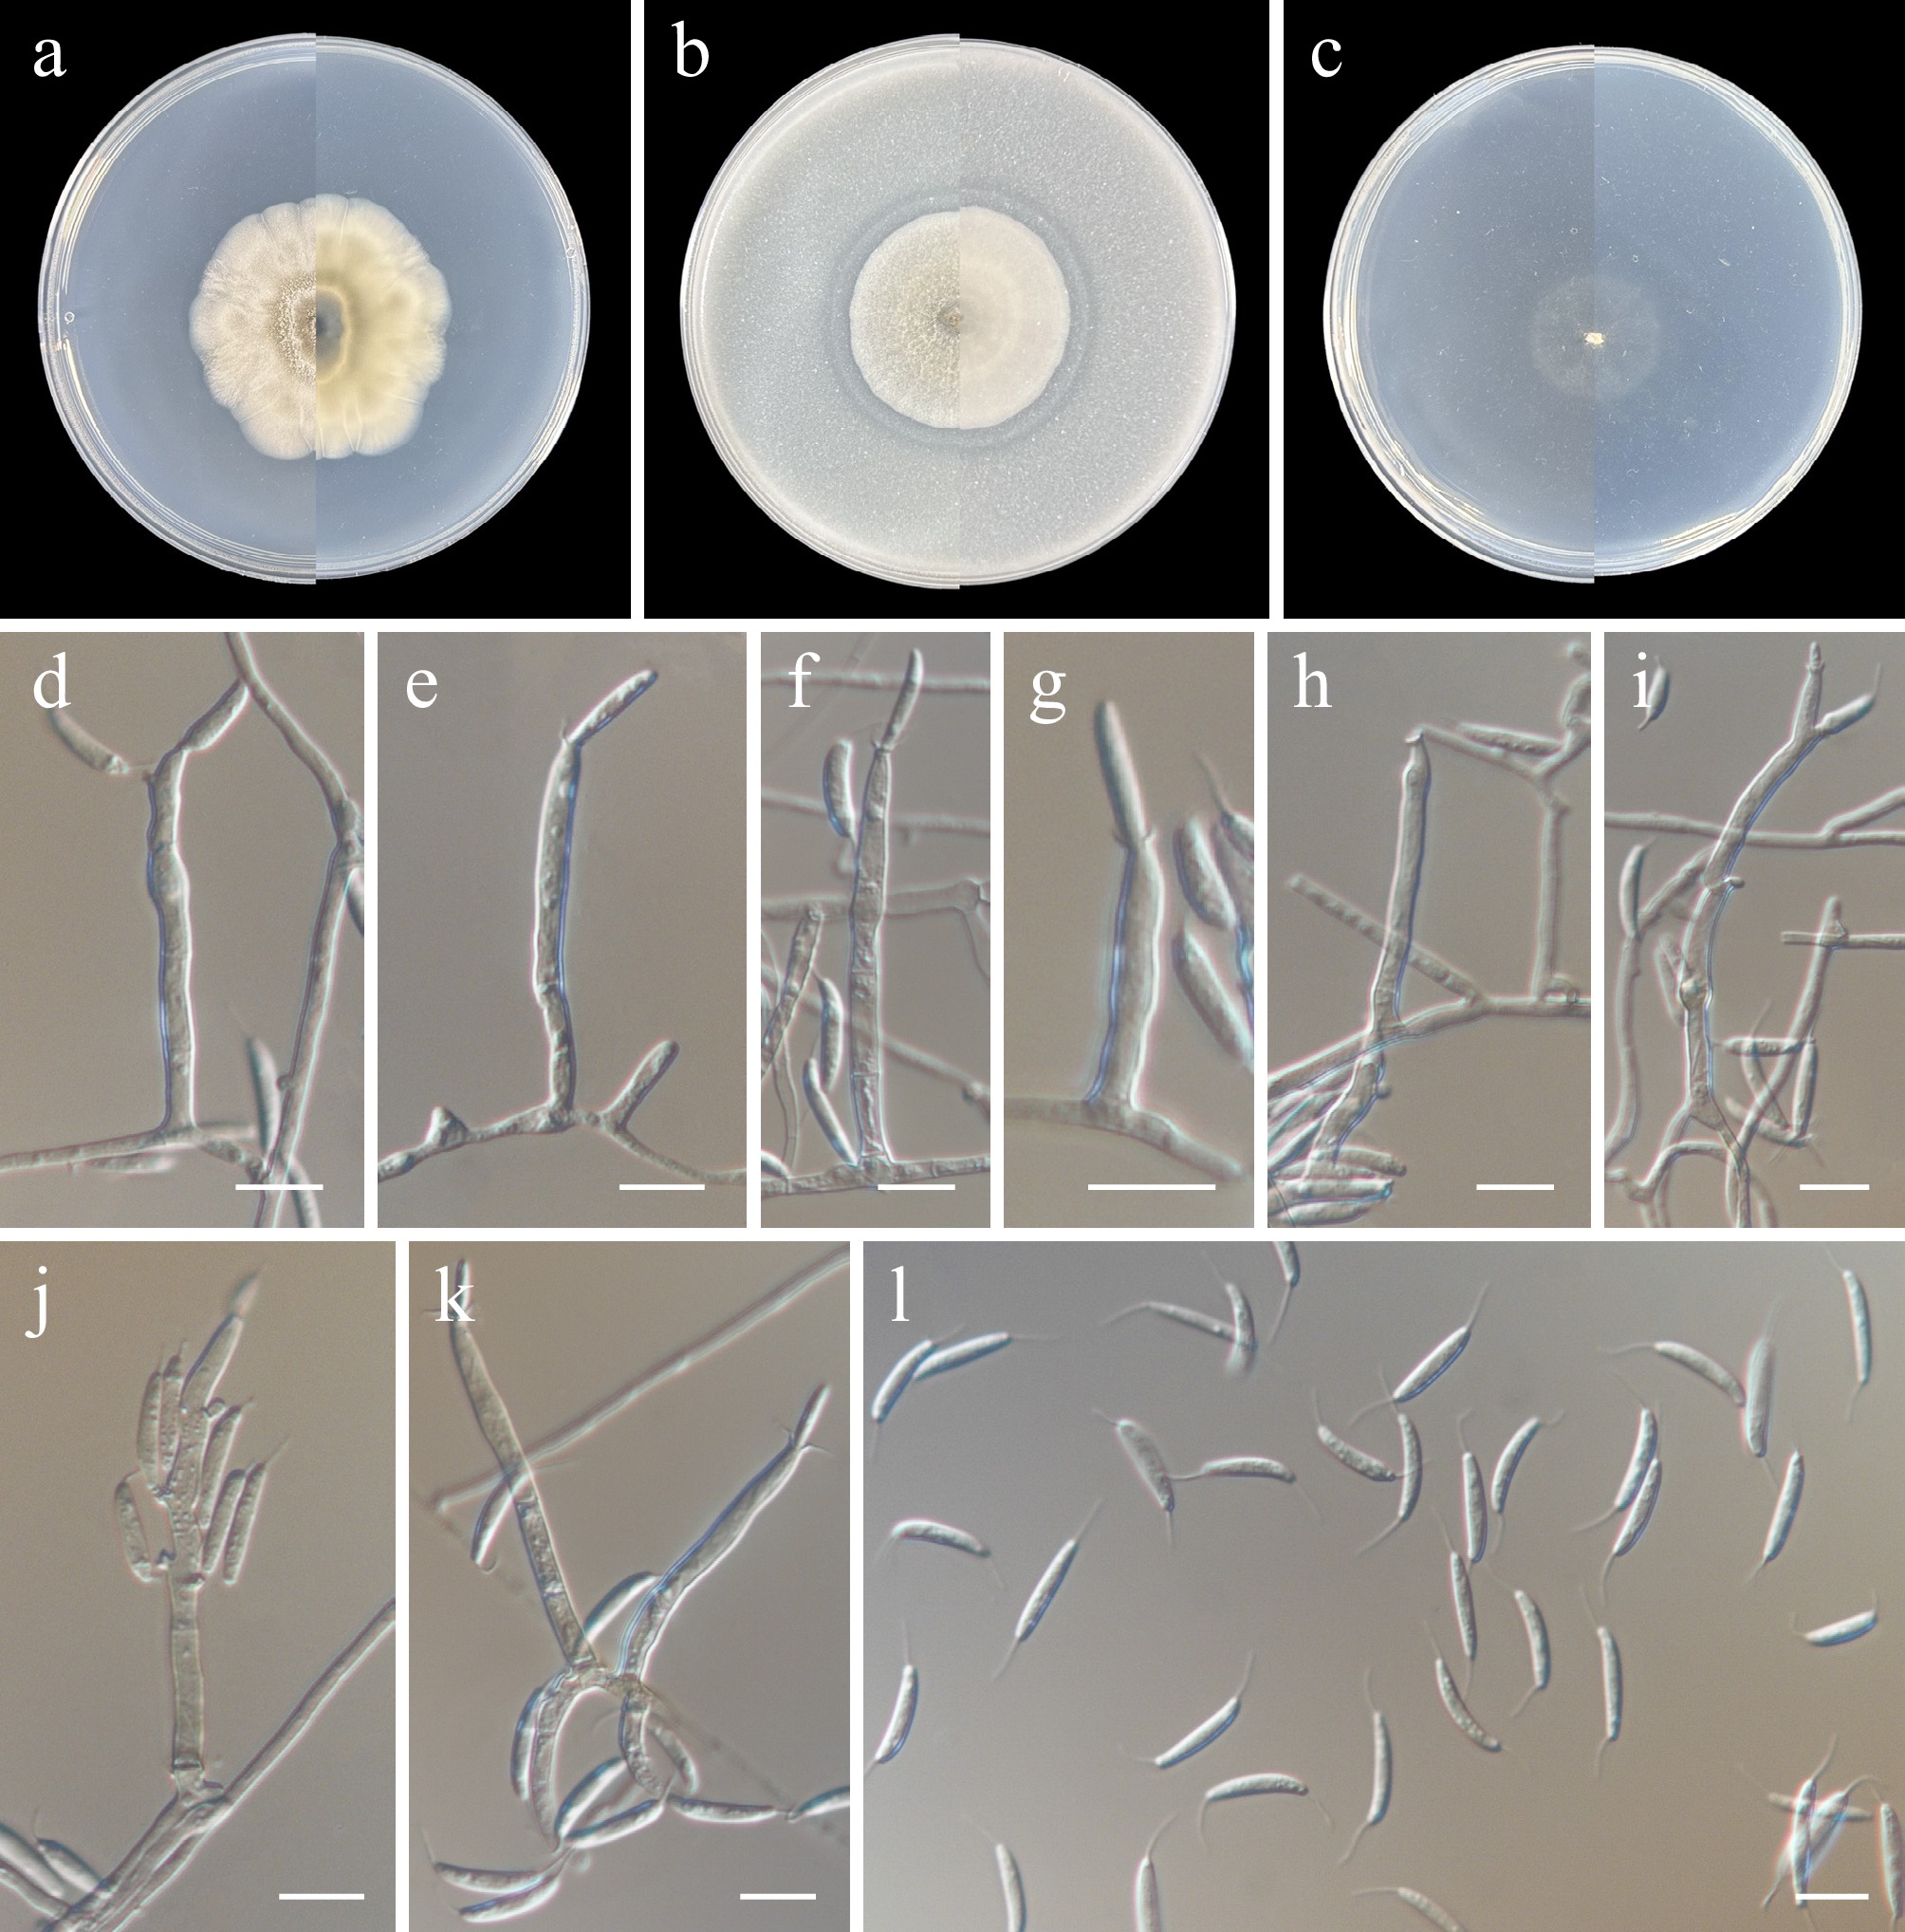
Figure 25.
Codinaea heilongjiangensis (from holotype ZY H-23.038). (a)–(c) Upper and reverse views of cultures on PDA, OA, and SNA after 14 d at 25 °C. (d)–(h), (k) Conidiophores and conidiogenous cells with funnel-shaped collarettes. (i), (j) Percurrently and sympodially proliferated conidiophores and conidiogenous cells bearing funnel-shaped collarettes. (l) Conidia. Scale bars: (d)–(l) 10 μm.
-
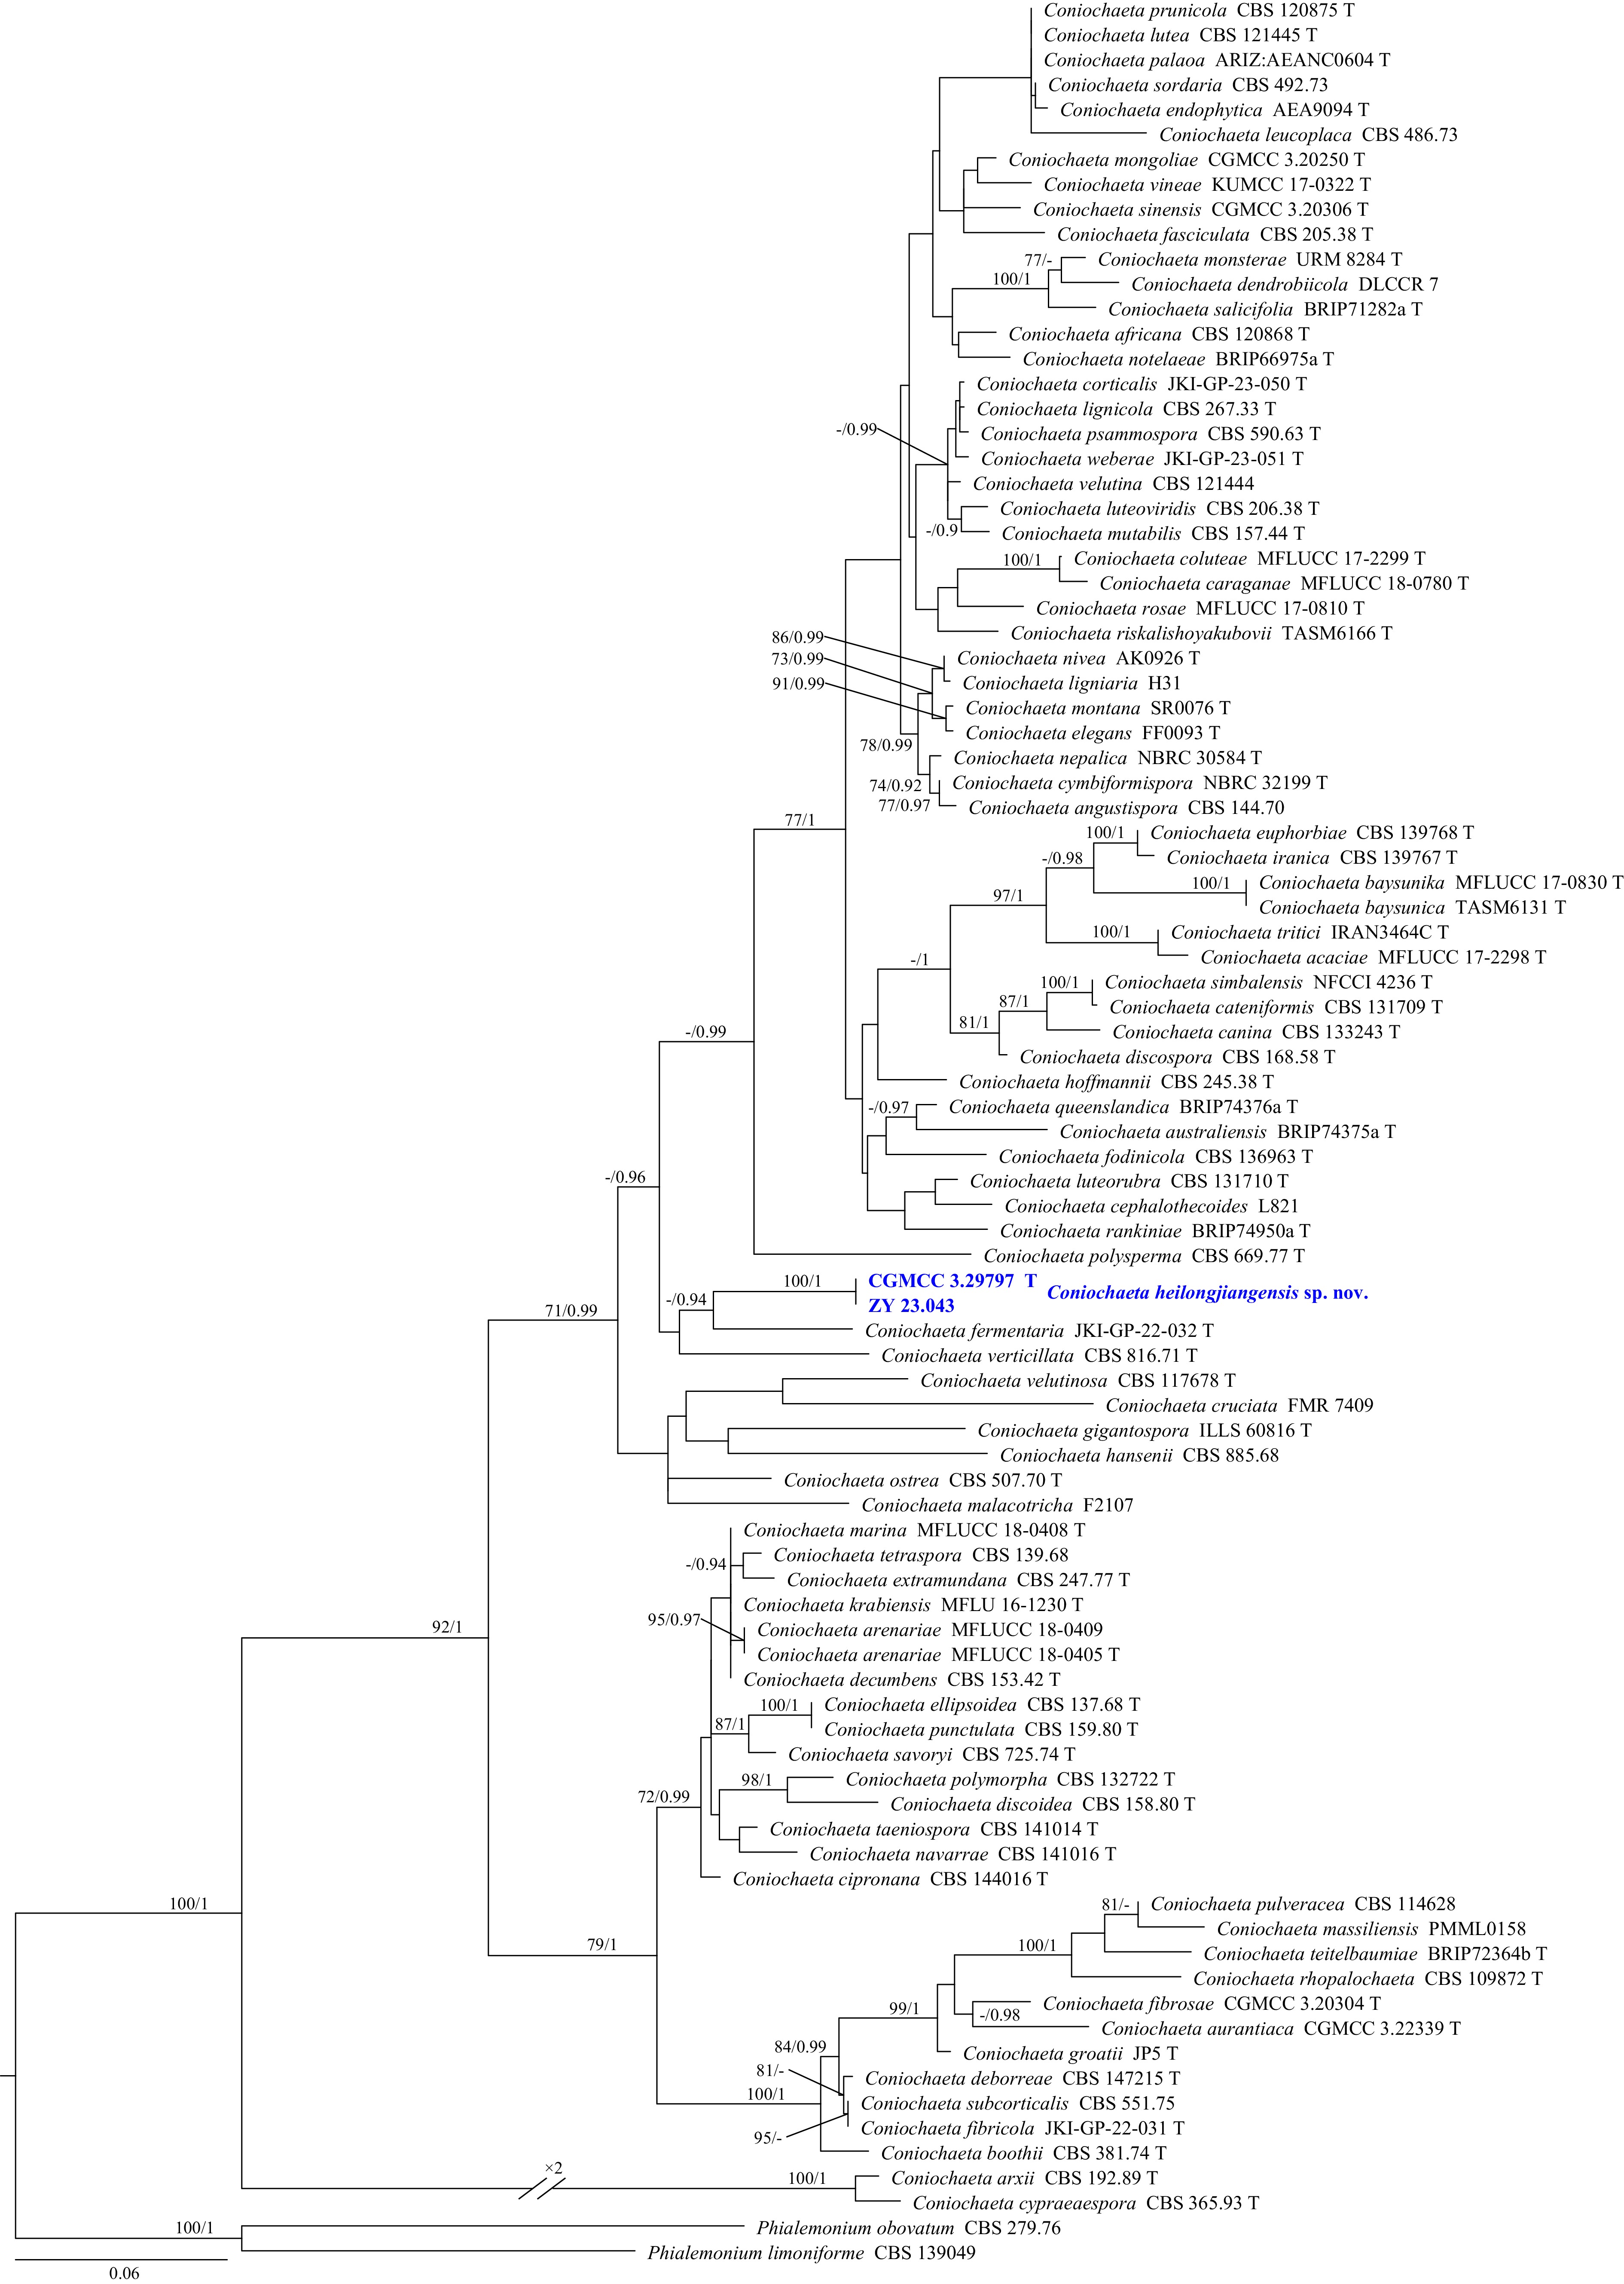
Figure 26.
Phylogram generated from ML analysis based on the combined dataset of ITS and LSU sequence data. Numbers at branches indicate support values (IQ-TREE-BS/BI-PP) above 70%/0.90. The tree is rooted to Phialemonium obovatum (CBS 279.76) and P. limoniforme (CBS 139049). Newly generated sequences are in bold and blue, and 'T' indicates type-derived sequences. The scale bar represents the expected number of changes per site.
-
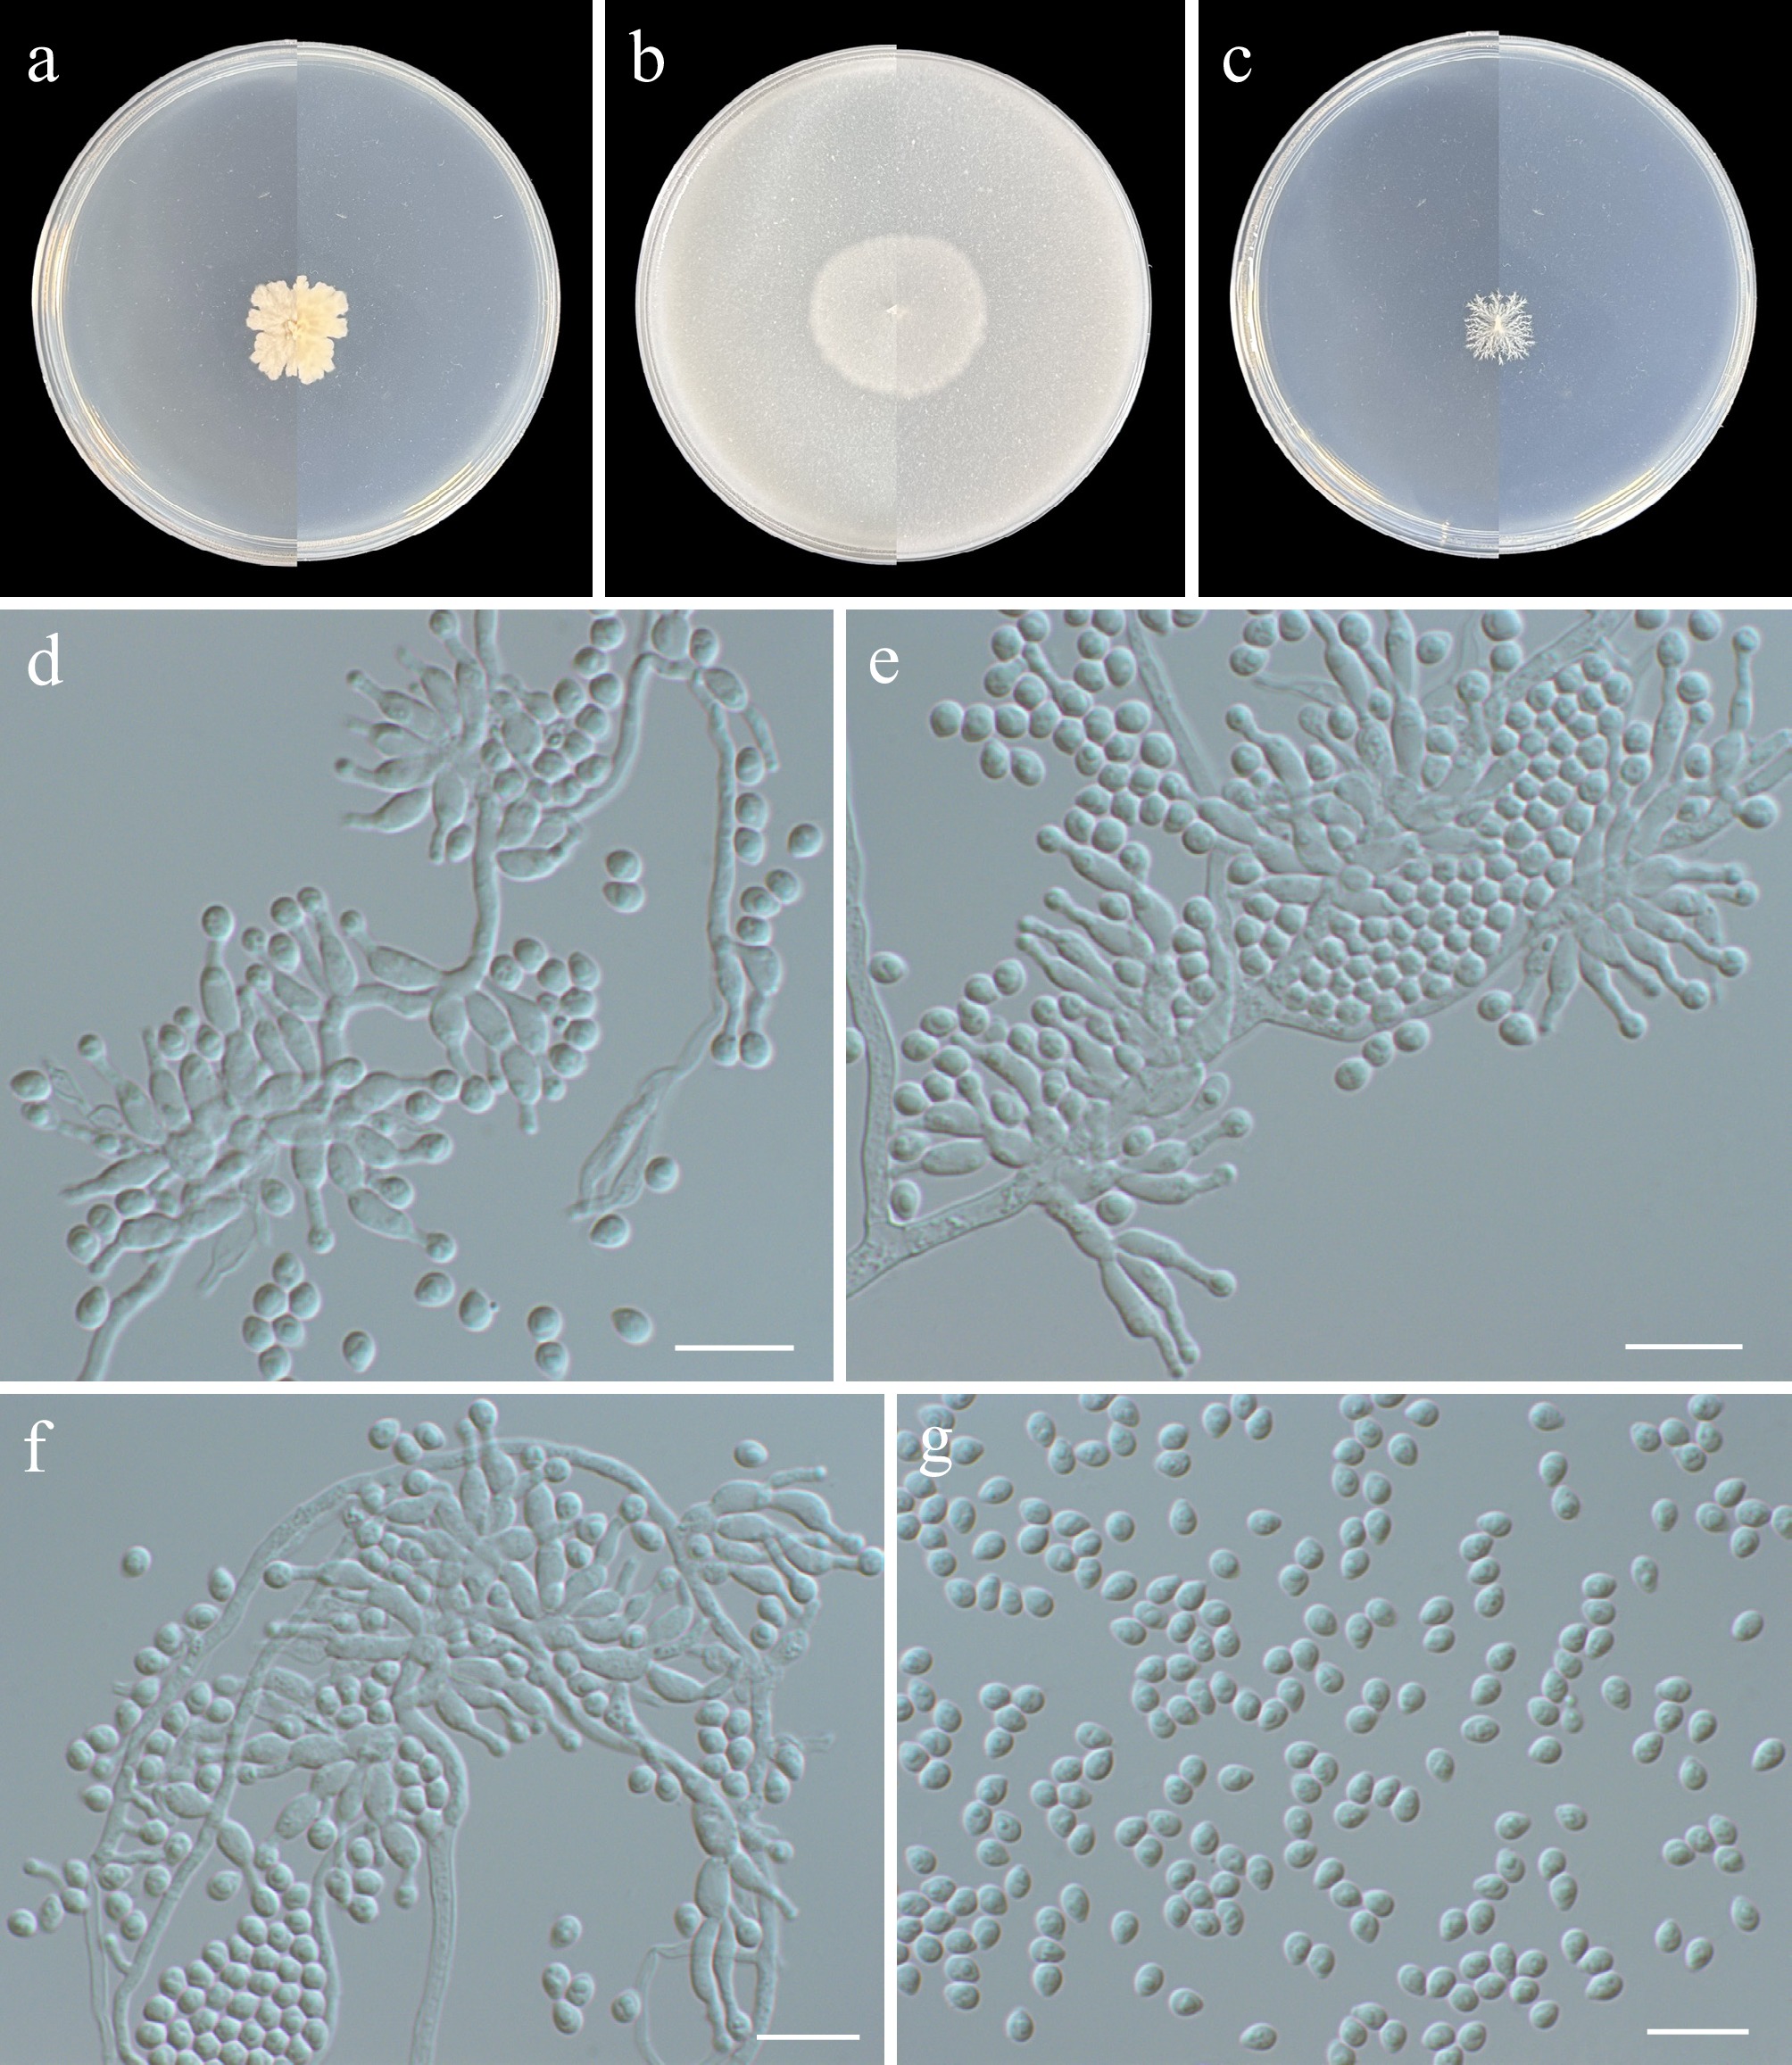
Figure 27.
Coniochaeta heilongjiangensis (from holotype ZY H-23.042). (a)–(c) Upper and reverse views of cultures on PDA, OA, and SNA after 14 d at 25 °C. (d)–(f) Conidiophores, conidiogenous cells, and conidia. (g) Conidia. (d)–(g) Scale bars: 10 μm.
-
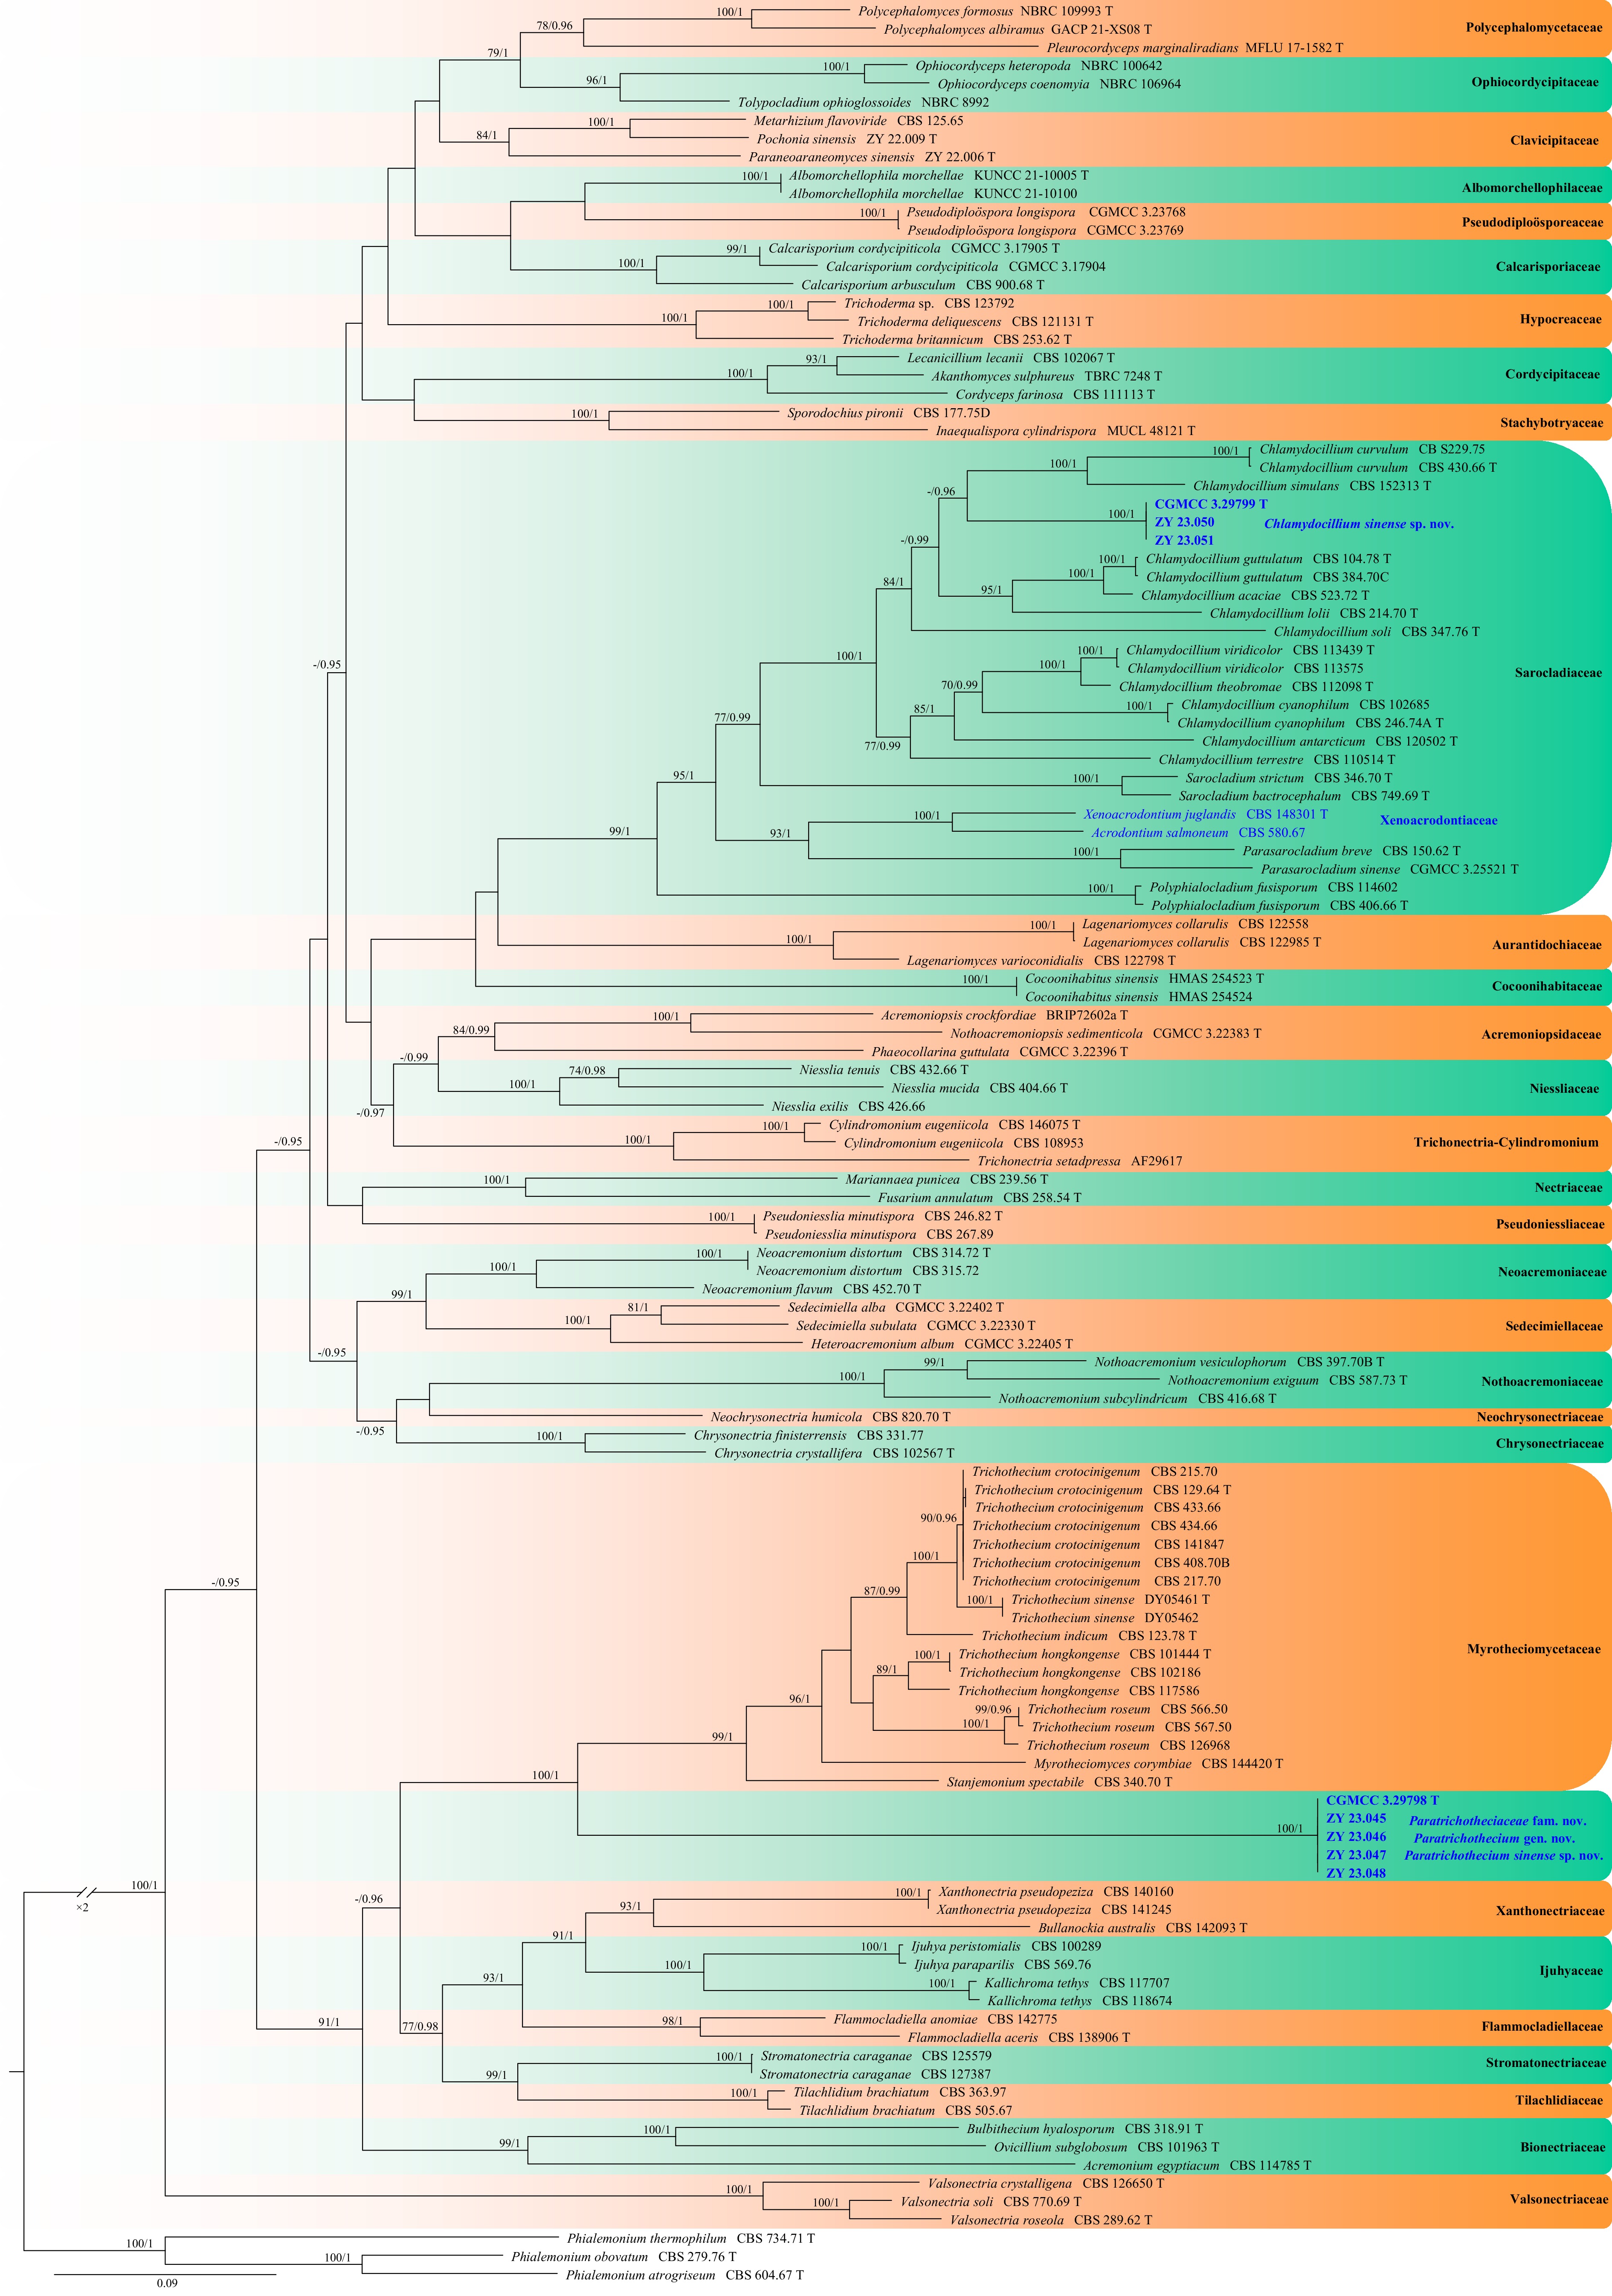
Figure 28.
Phylogram generated from ML analysis based on the combined dataset of ITS, LSU, RPB2, and TEF1 sequence data. Numbers at branches indicate support values (IQ-TREE-BS/BI-PP) above 70%/0.90. The tree is rooted to Phialemonium atrogriseum (CBS 604.67), P. obovatum (CBS 279.76), and P. thermophilum (CBS 734.71). Newly generated sequences are in bold and blue, and 'T' indicates type-derived sequences. The scale bar represents the expected number of changes per site.
-
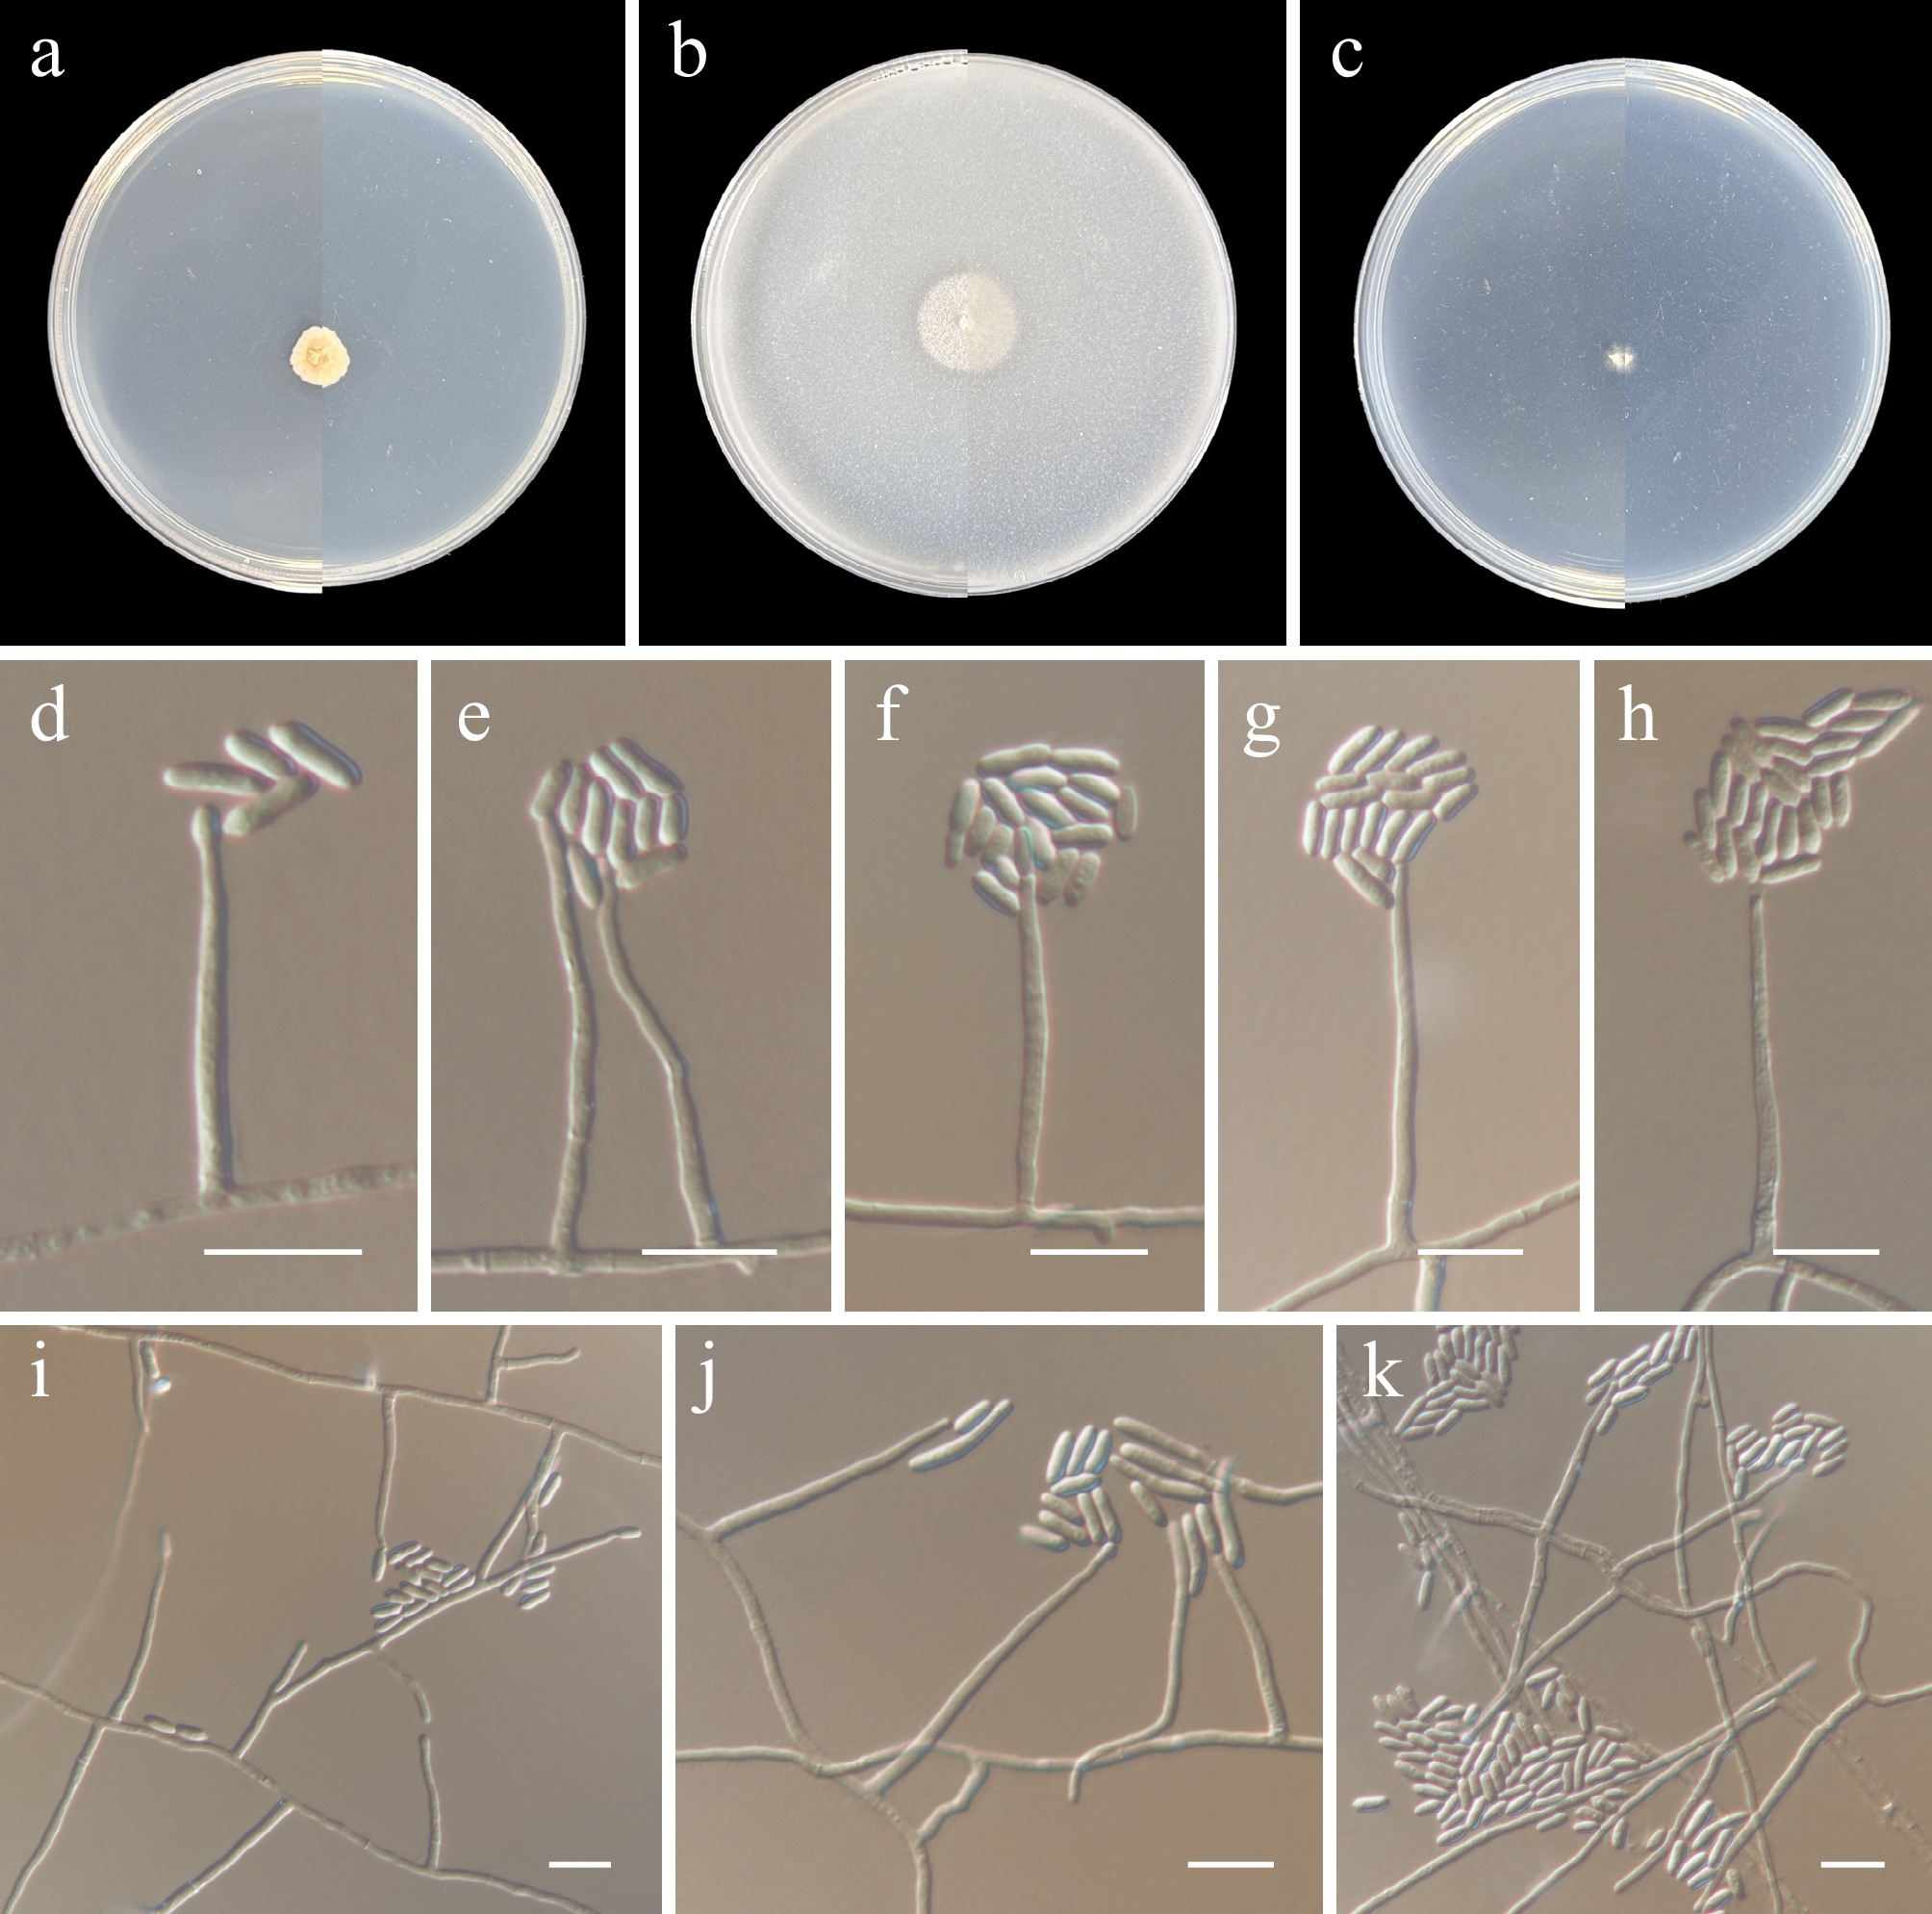
Figure 29.
Paratrichothecium sinense (from holotype ZY H-23.044). (a)–(c) Upper and reverse views of cultures on PDA, OA, and SNA after 14 d at 25 °C. (d)–(k) Phialidic and conidia. (d)–(k) Scale bars: 10 μm.
-
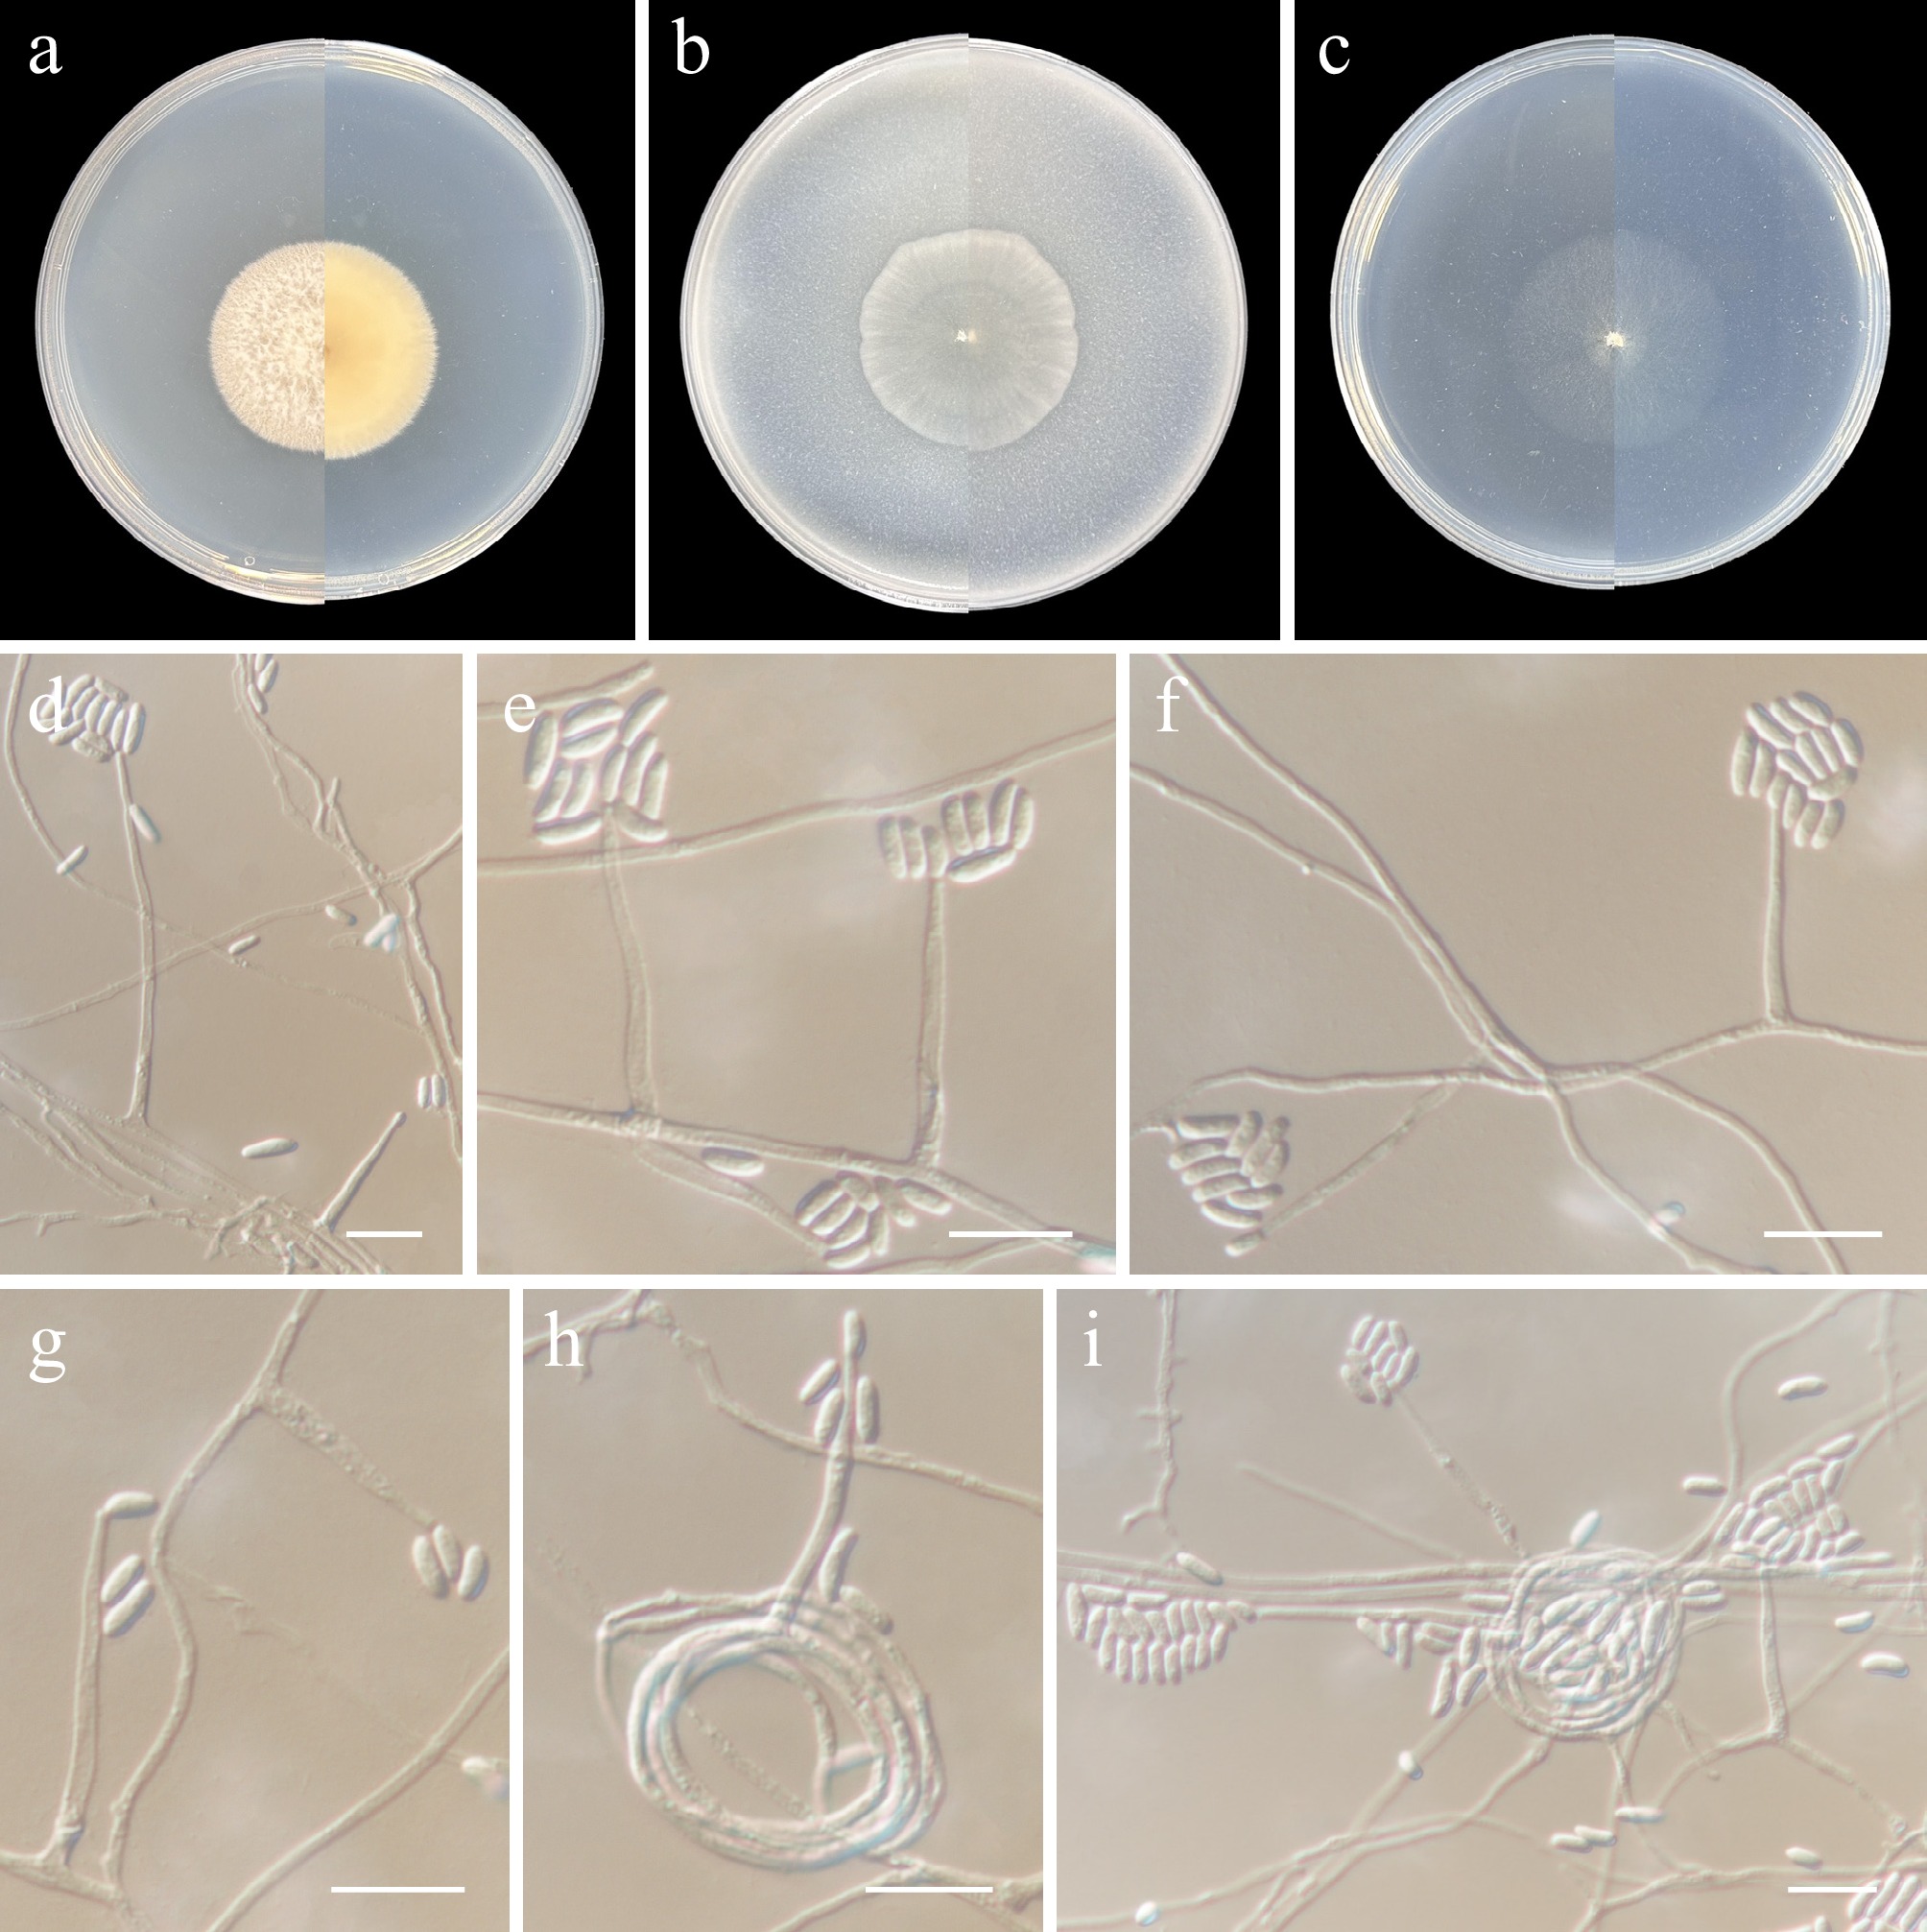
Figure 30.
Chlamydocillium sinense (from holotype ZY H-23.049). (a)–(c) Upper and reverse views of cultures on PDA, OA, and SNA after 14 d at 25 °C. (d)–(g) Monophialides. (h), (i) Conidiophores radiating out from coils formed by the mycelia. (d)–(i) Scale bars: 10 μm.
-
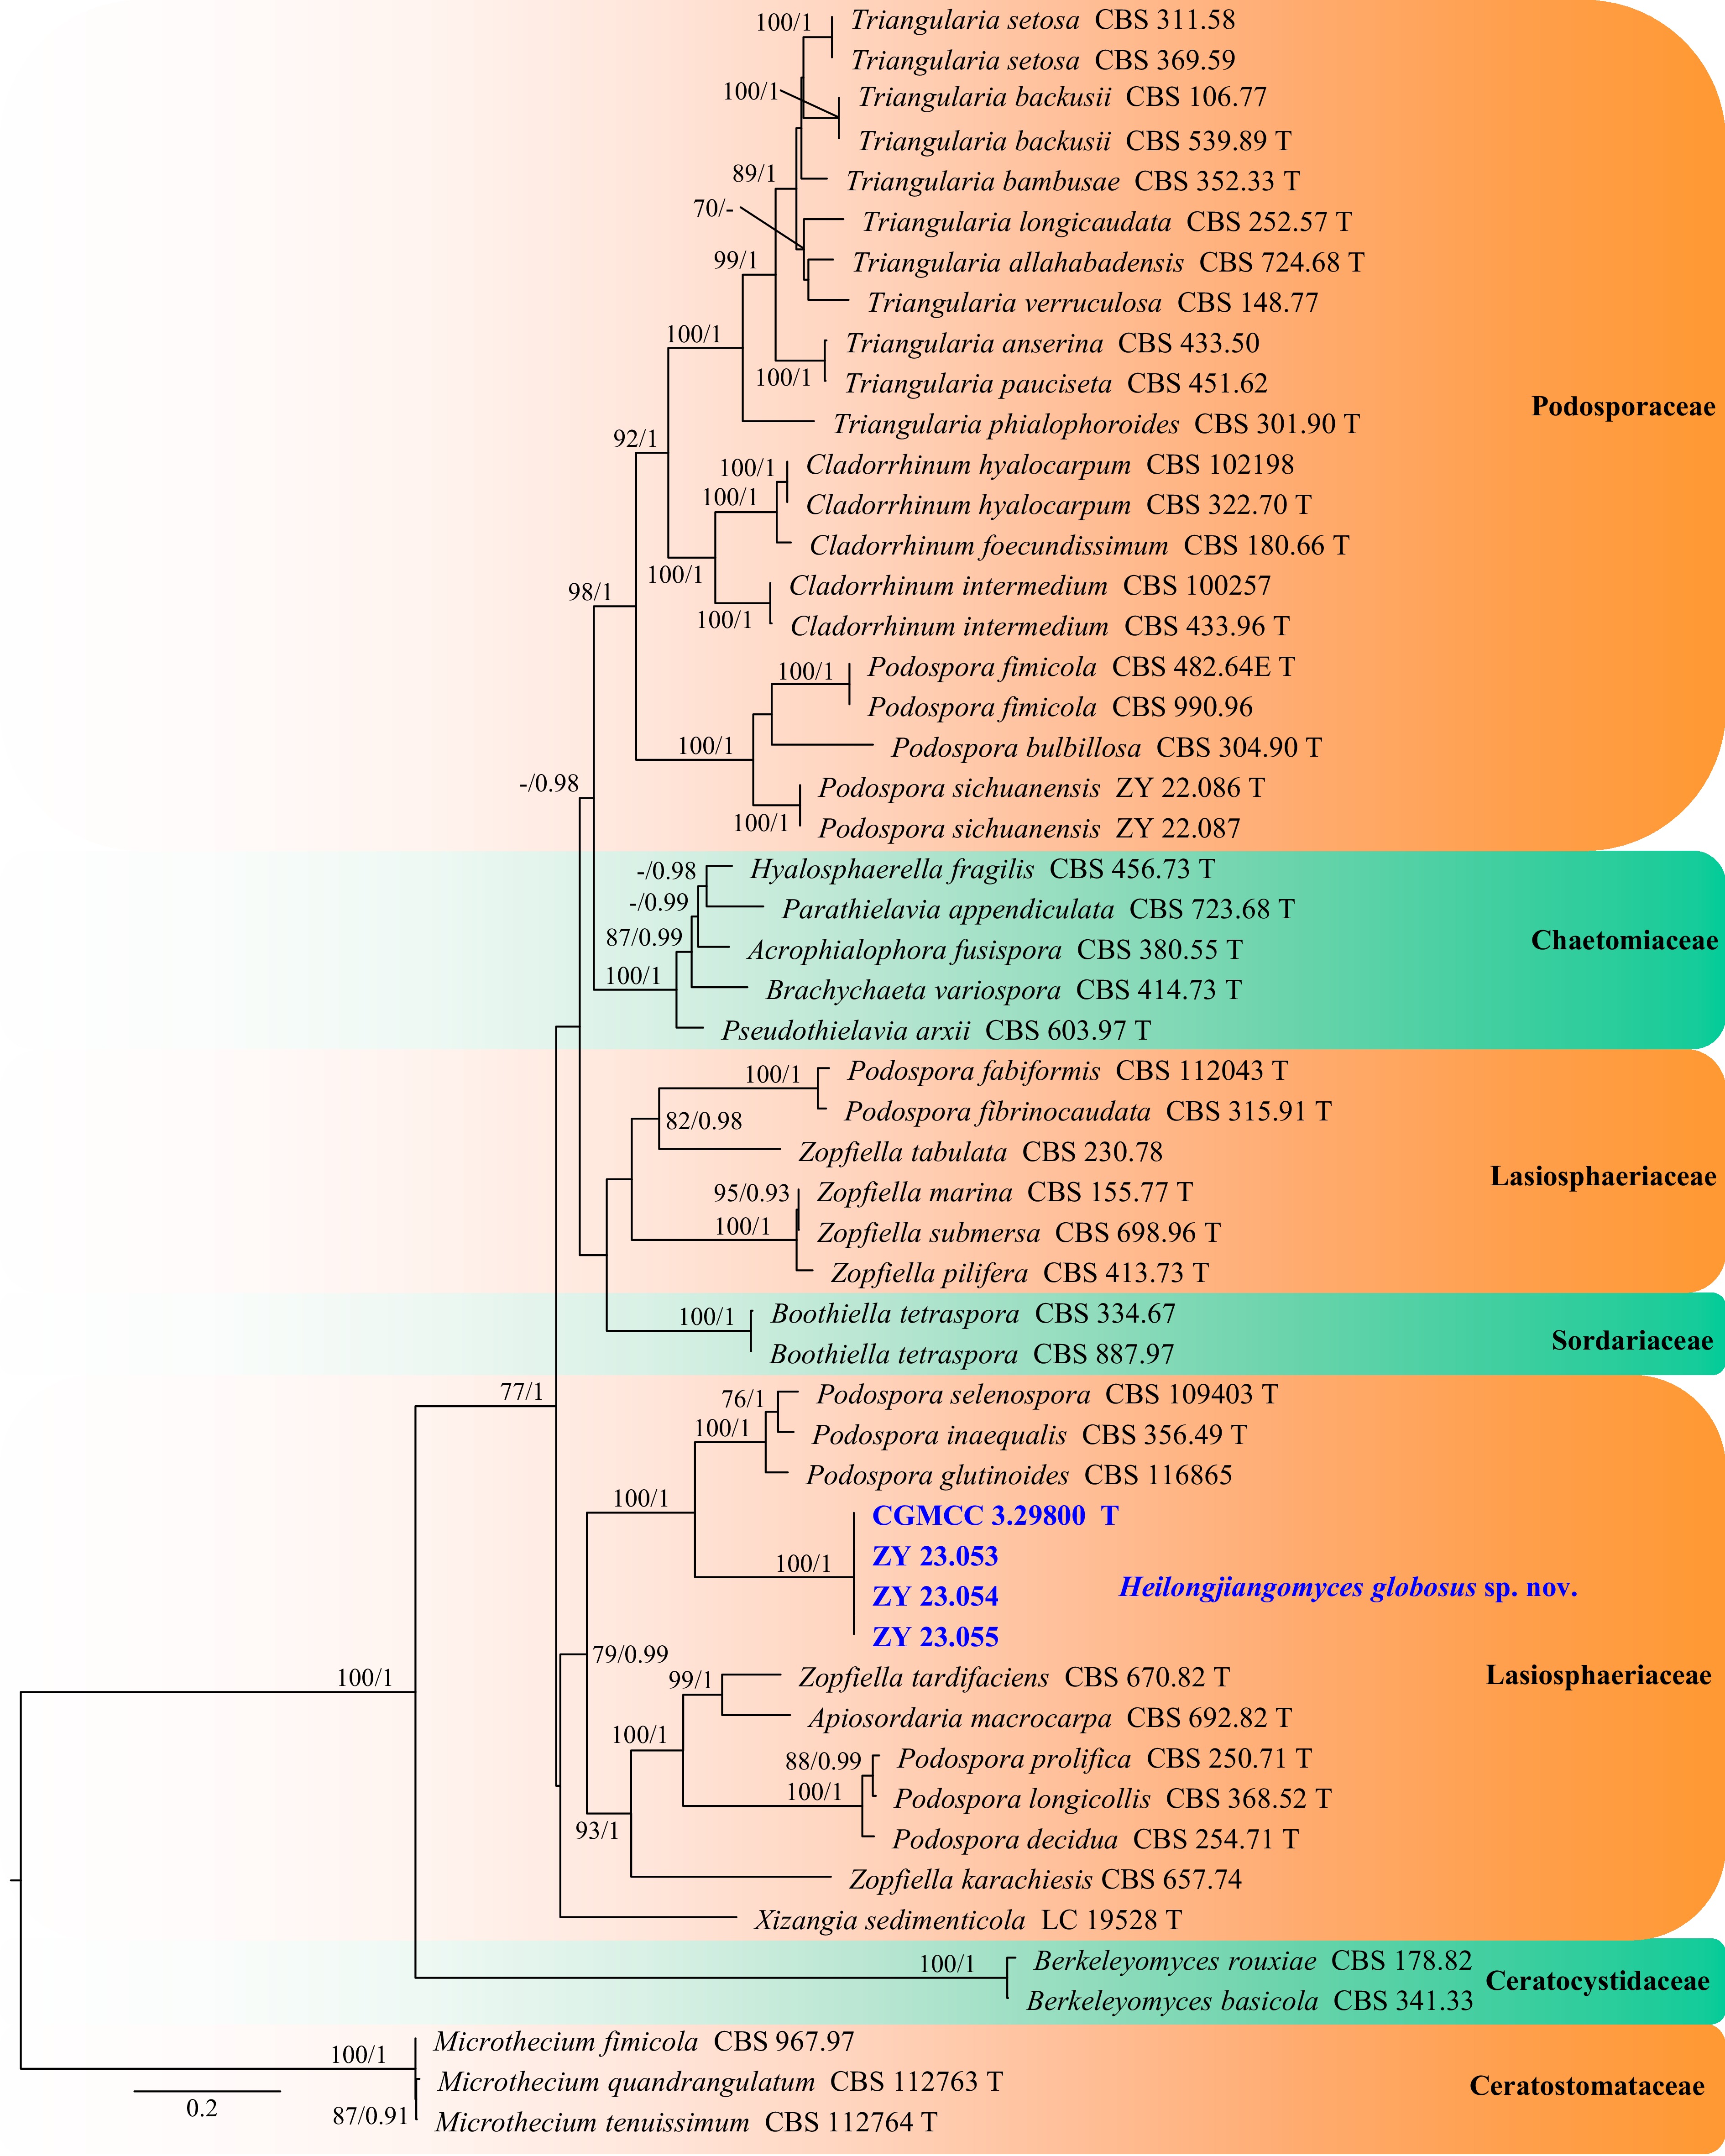
Figure 31.
Phylogram generated from ML analysis based on the combined dataset of ITS, LSU, RPB2, and TUB sequence data. Numbers at branches indicate support values (IQ-TREE-BS/BI-PP) above 70%/0.90. The tree is rooted to Microthecium fimicola (CBS 967.97), M. quandrangulatum (CBS 112763), and M. tenuissimum (CBS 112764). Newly generated sequences are in bold and blue, and 'T' indicates type-derived sequences. The scale bar represents the expected number of changes per site.
-
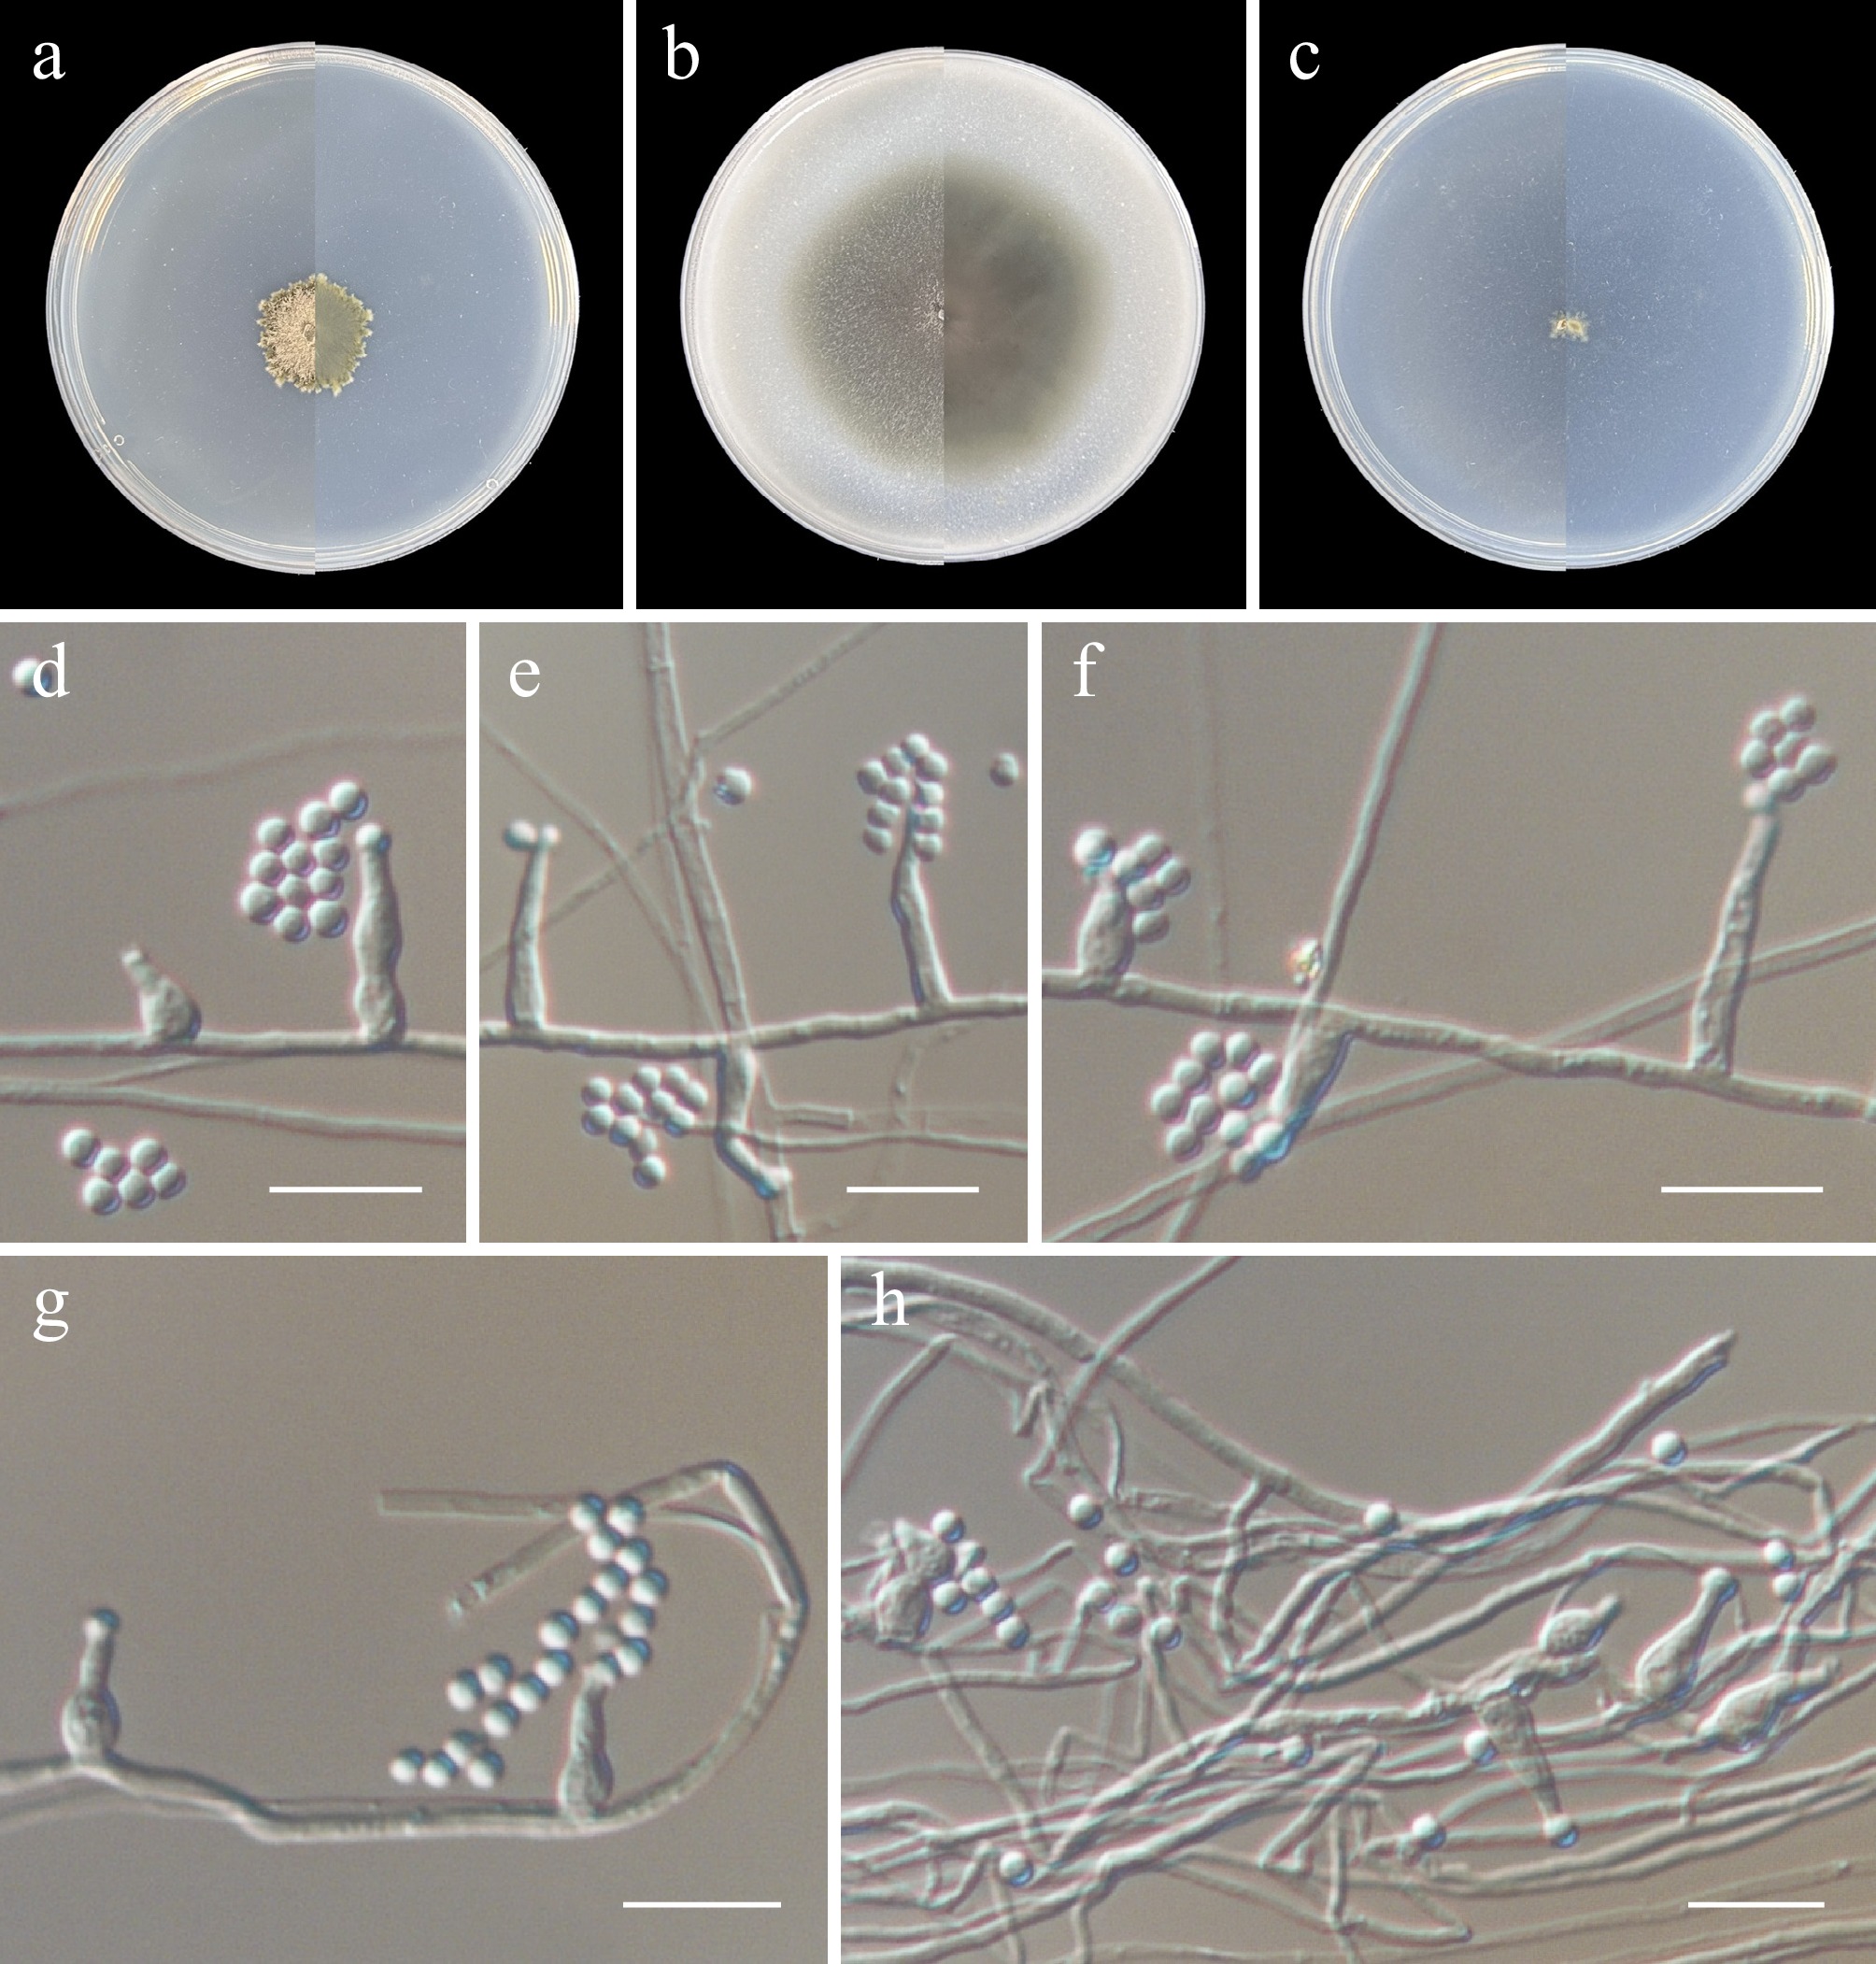
Figure 32.
Pseudosoloacrosporiella sinensis (from holotype ZY H-23.052). (a)–(c) Upper and reverse views of cultures on PDA, OA, and SNA after 14 d at 25 °C. (d)–(h) Conidiogenous cells and conidia. Scale bars: (d)–(h) 10 μm.
-
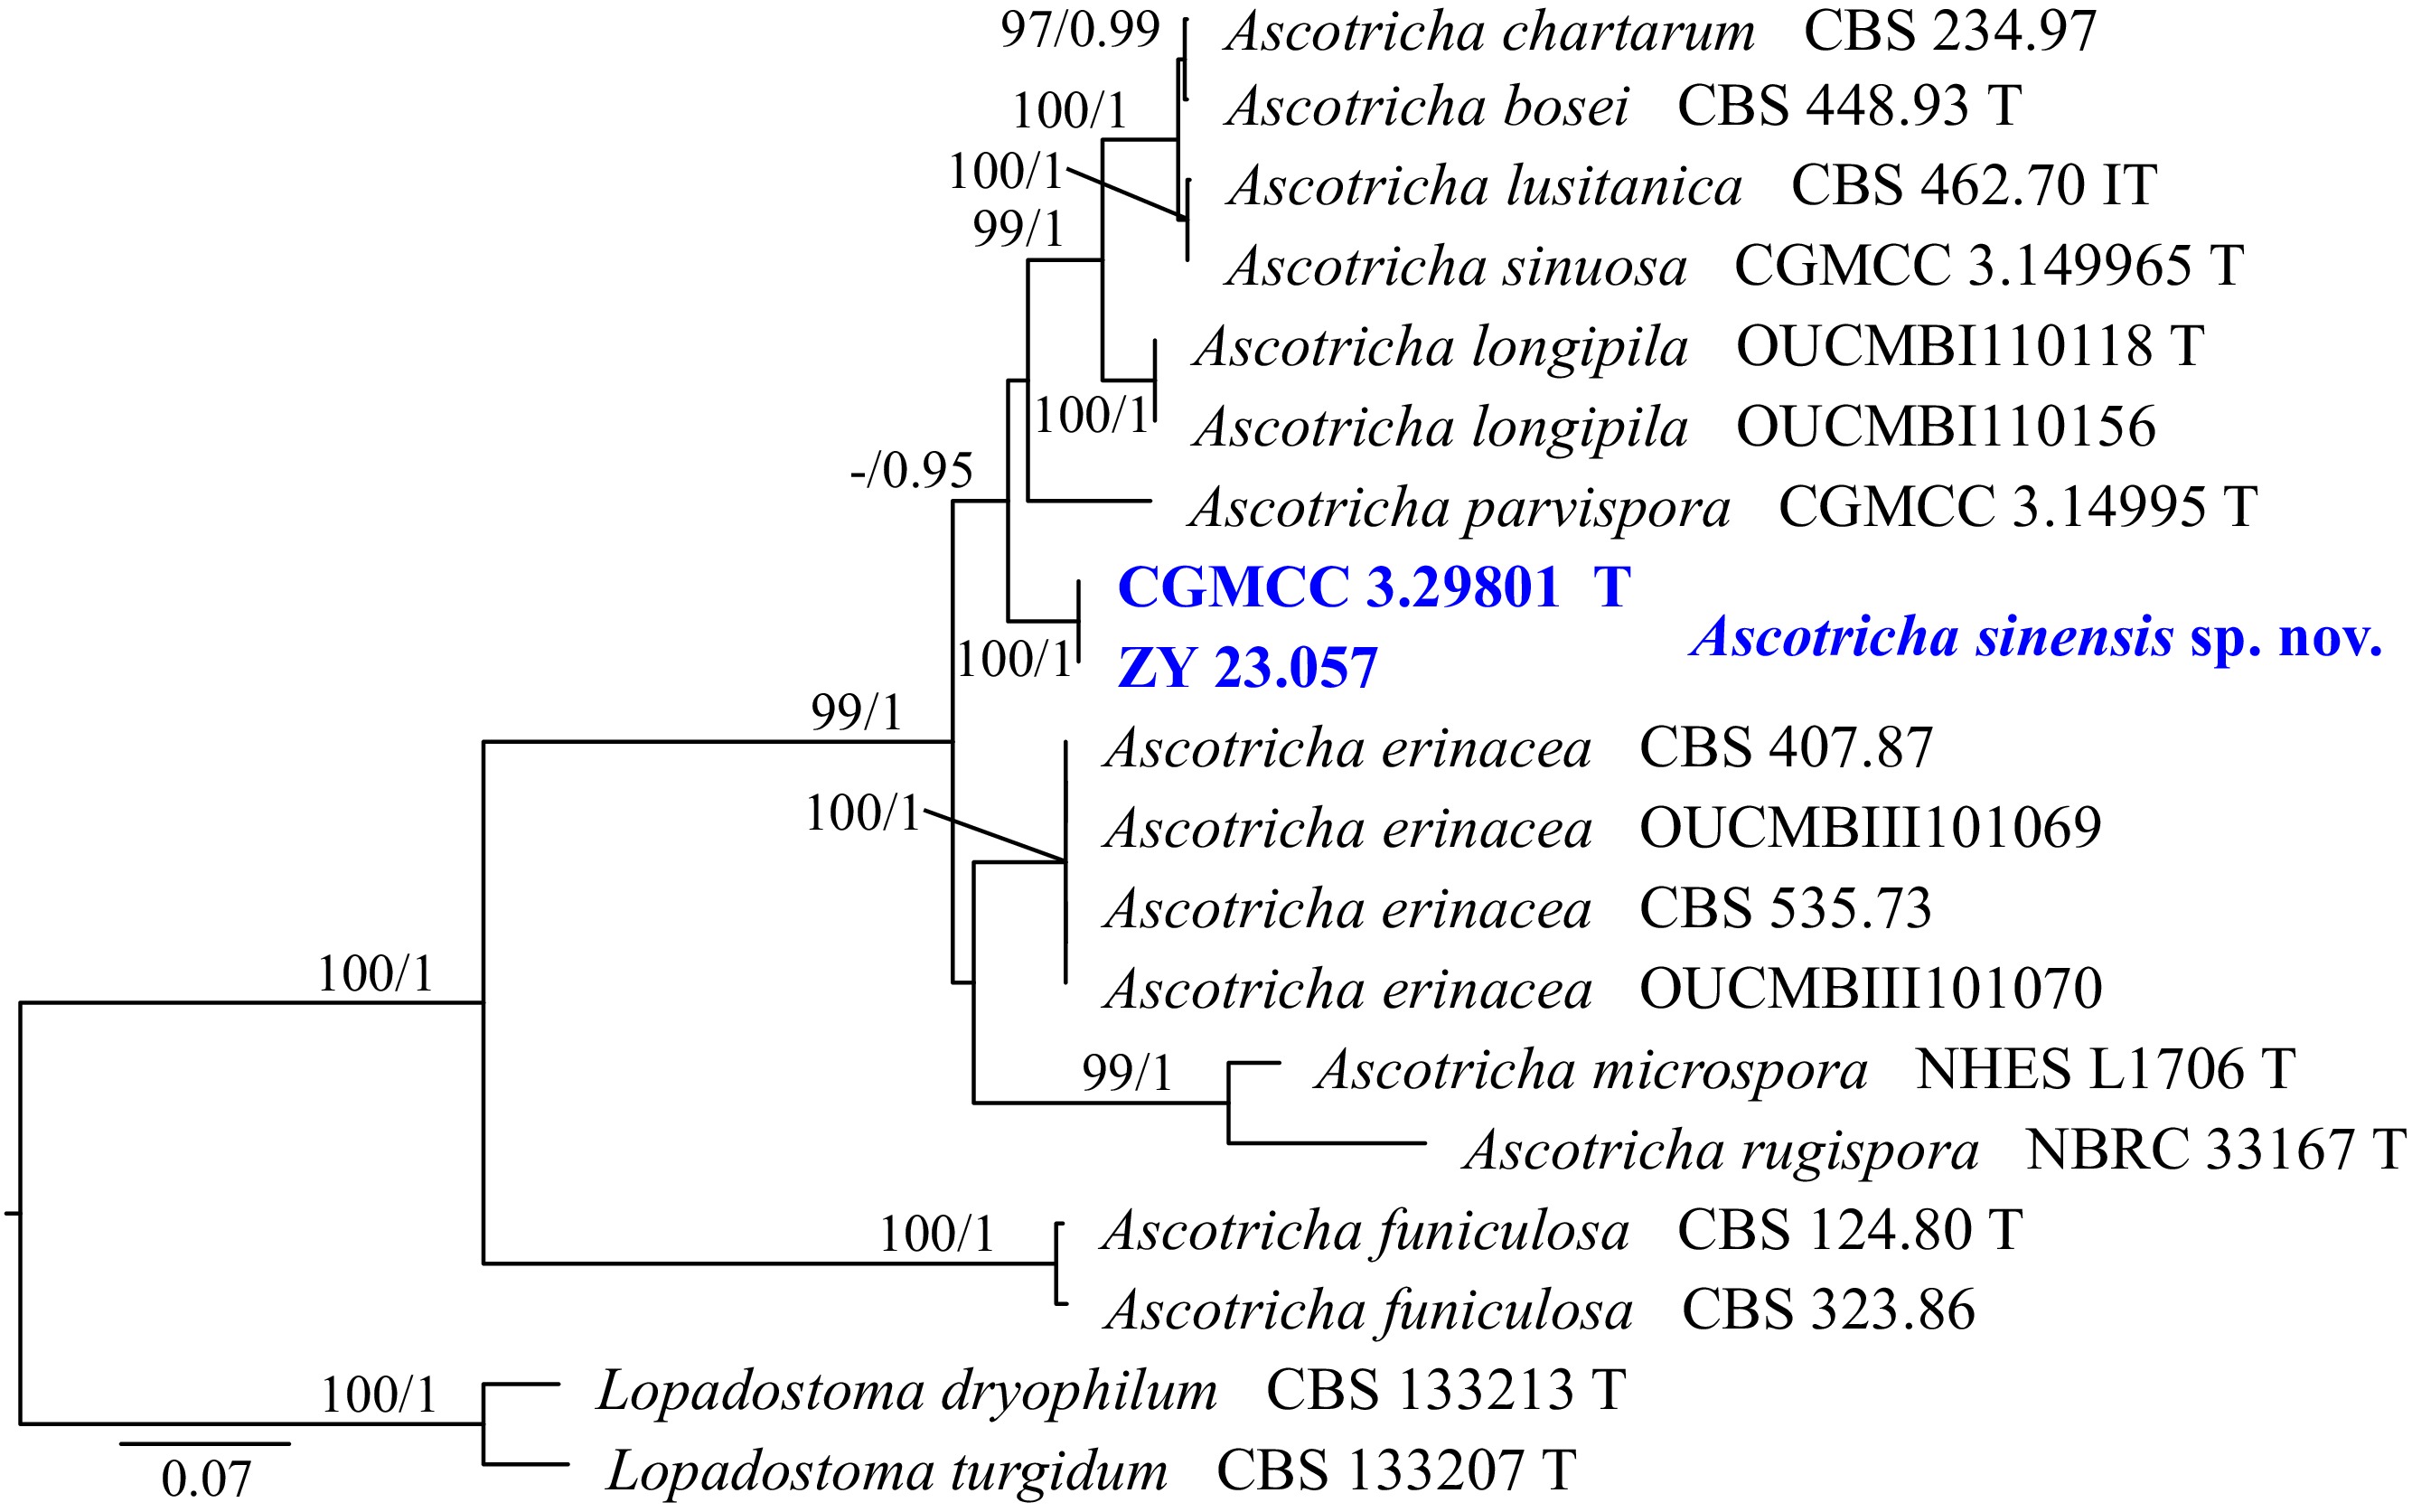
Figure 33.
Phylogram generated from ML analysis based on the combined dataset of ITS and TUB sequence data. Numbers at branches indicate support values (IQ-TREE-BS/BI-PP) above 70%/0.90. The tree is rooted to Lopadostoma dryophilum (CBS 133213) and L. turgidum (CBS 133207). Newly generated sequences are in bold and blue, and 'T' indicates type-derived sequences. The scale bar represents the expected number of changes per site.
-
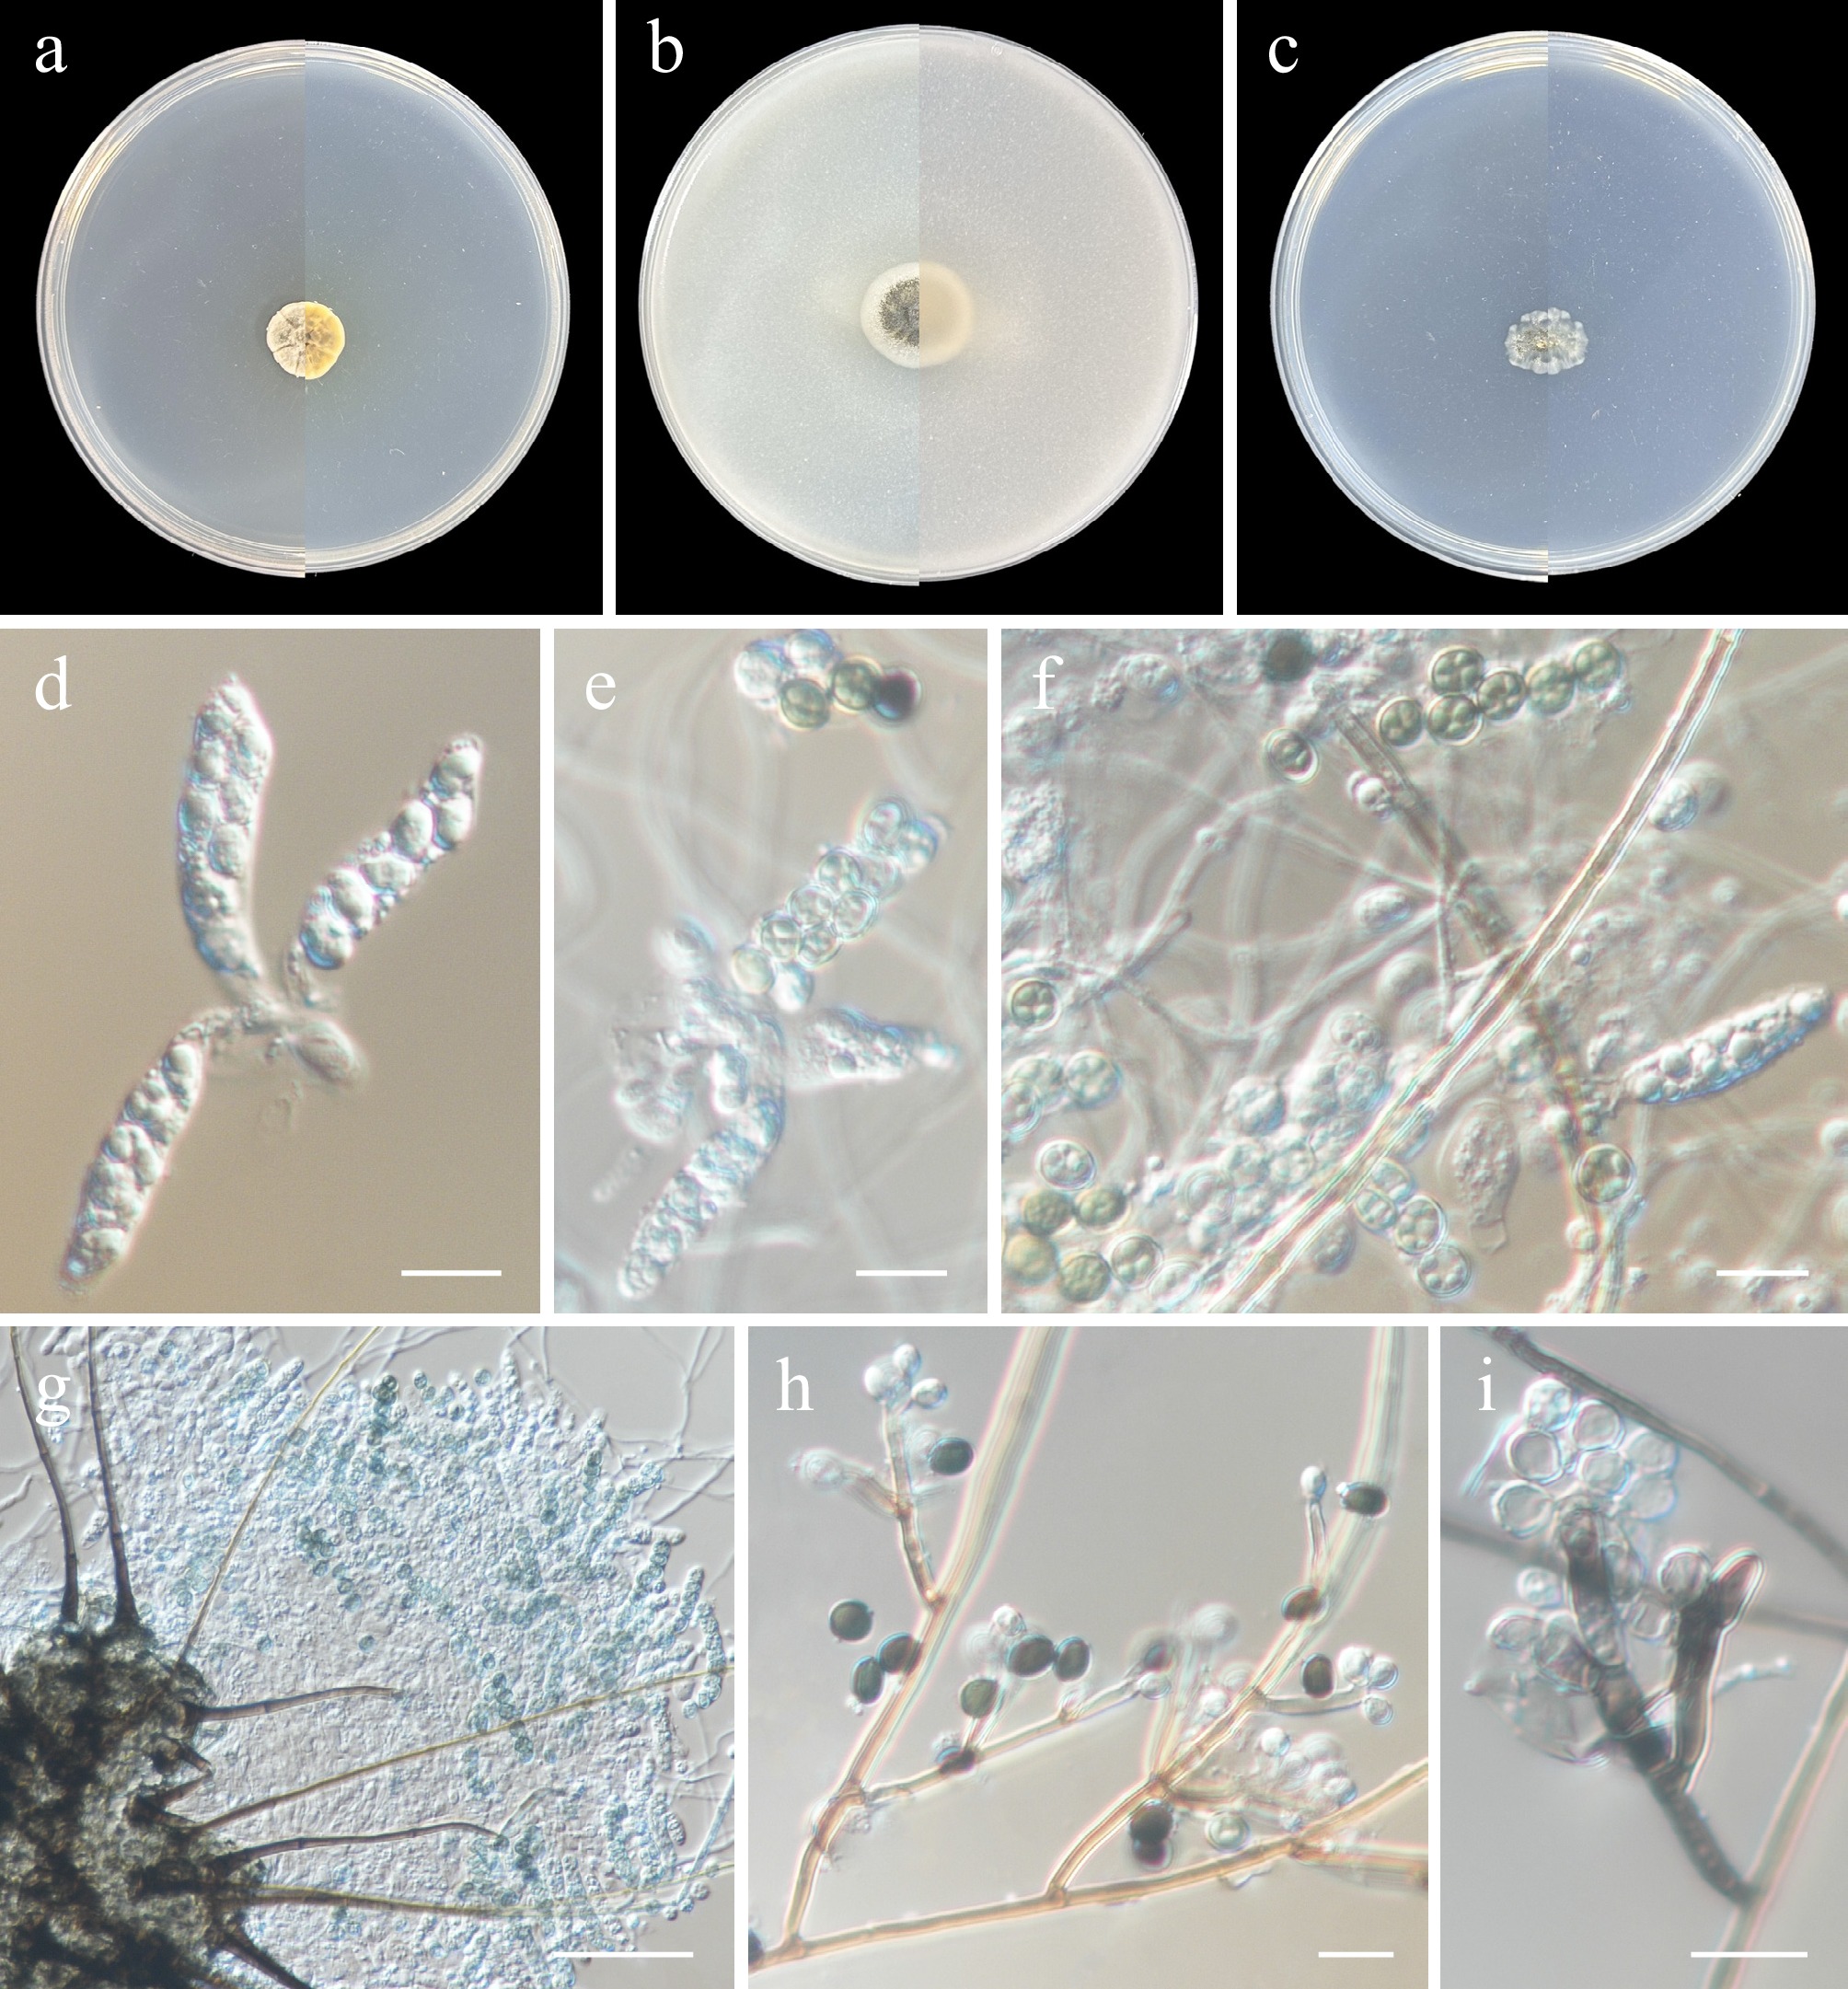
Figure 34.
Ascotricha sinensis (from holotype ZY H-23.056). (a)–(c) Upper and reverse views of cultures on PDA, OA, and SNA after 14 d at 25 °C. (d)–(f) Asci and ascospores. (g) Ascomata and asci. (h), (i) Conidiophores, conidiogenous cells, and conidia. Scale bars: (d)–(i) 10 μm.
-
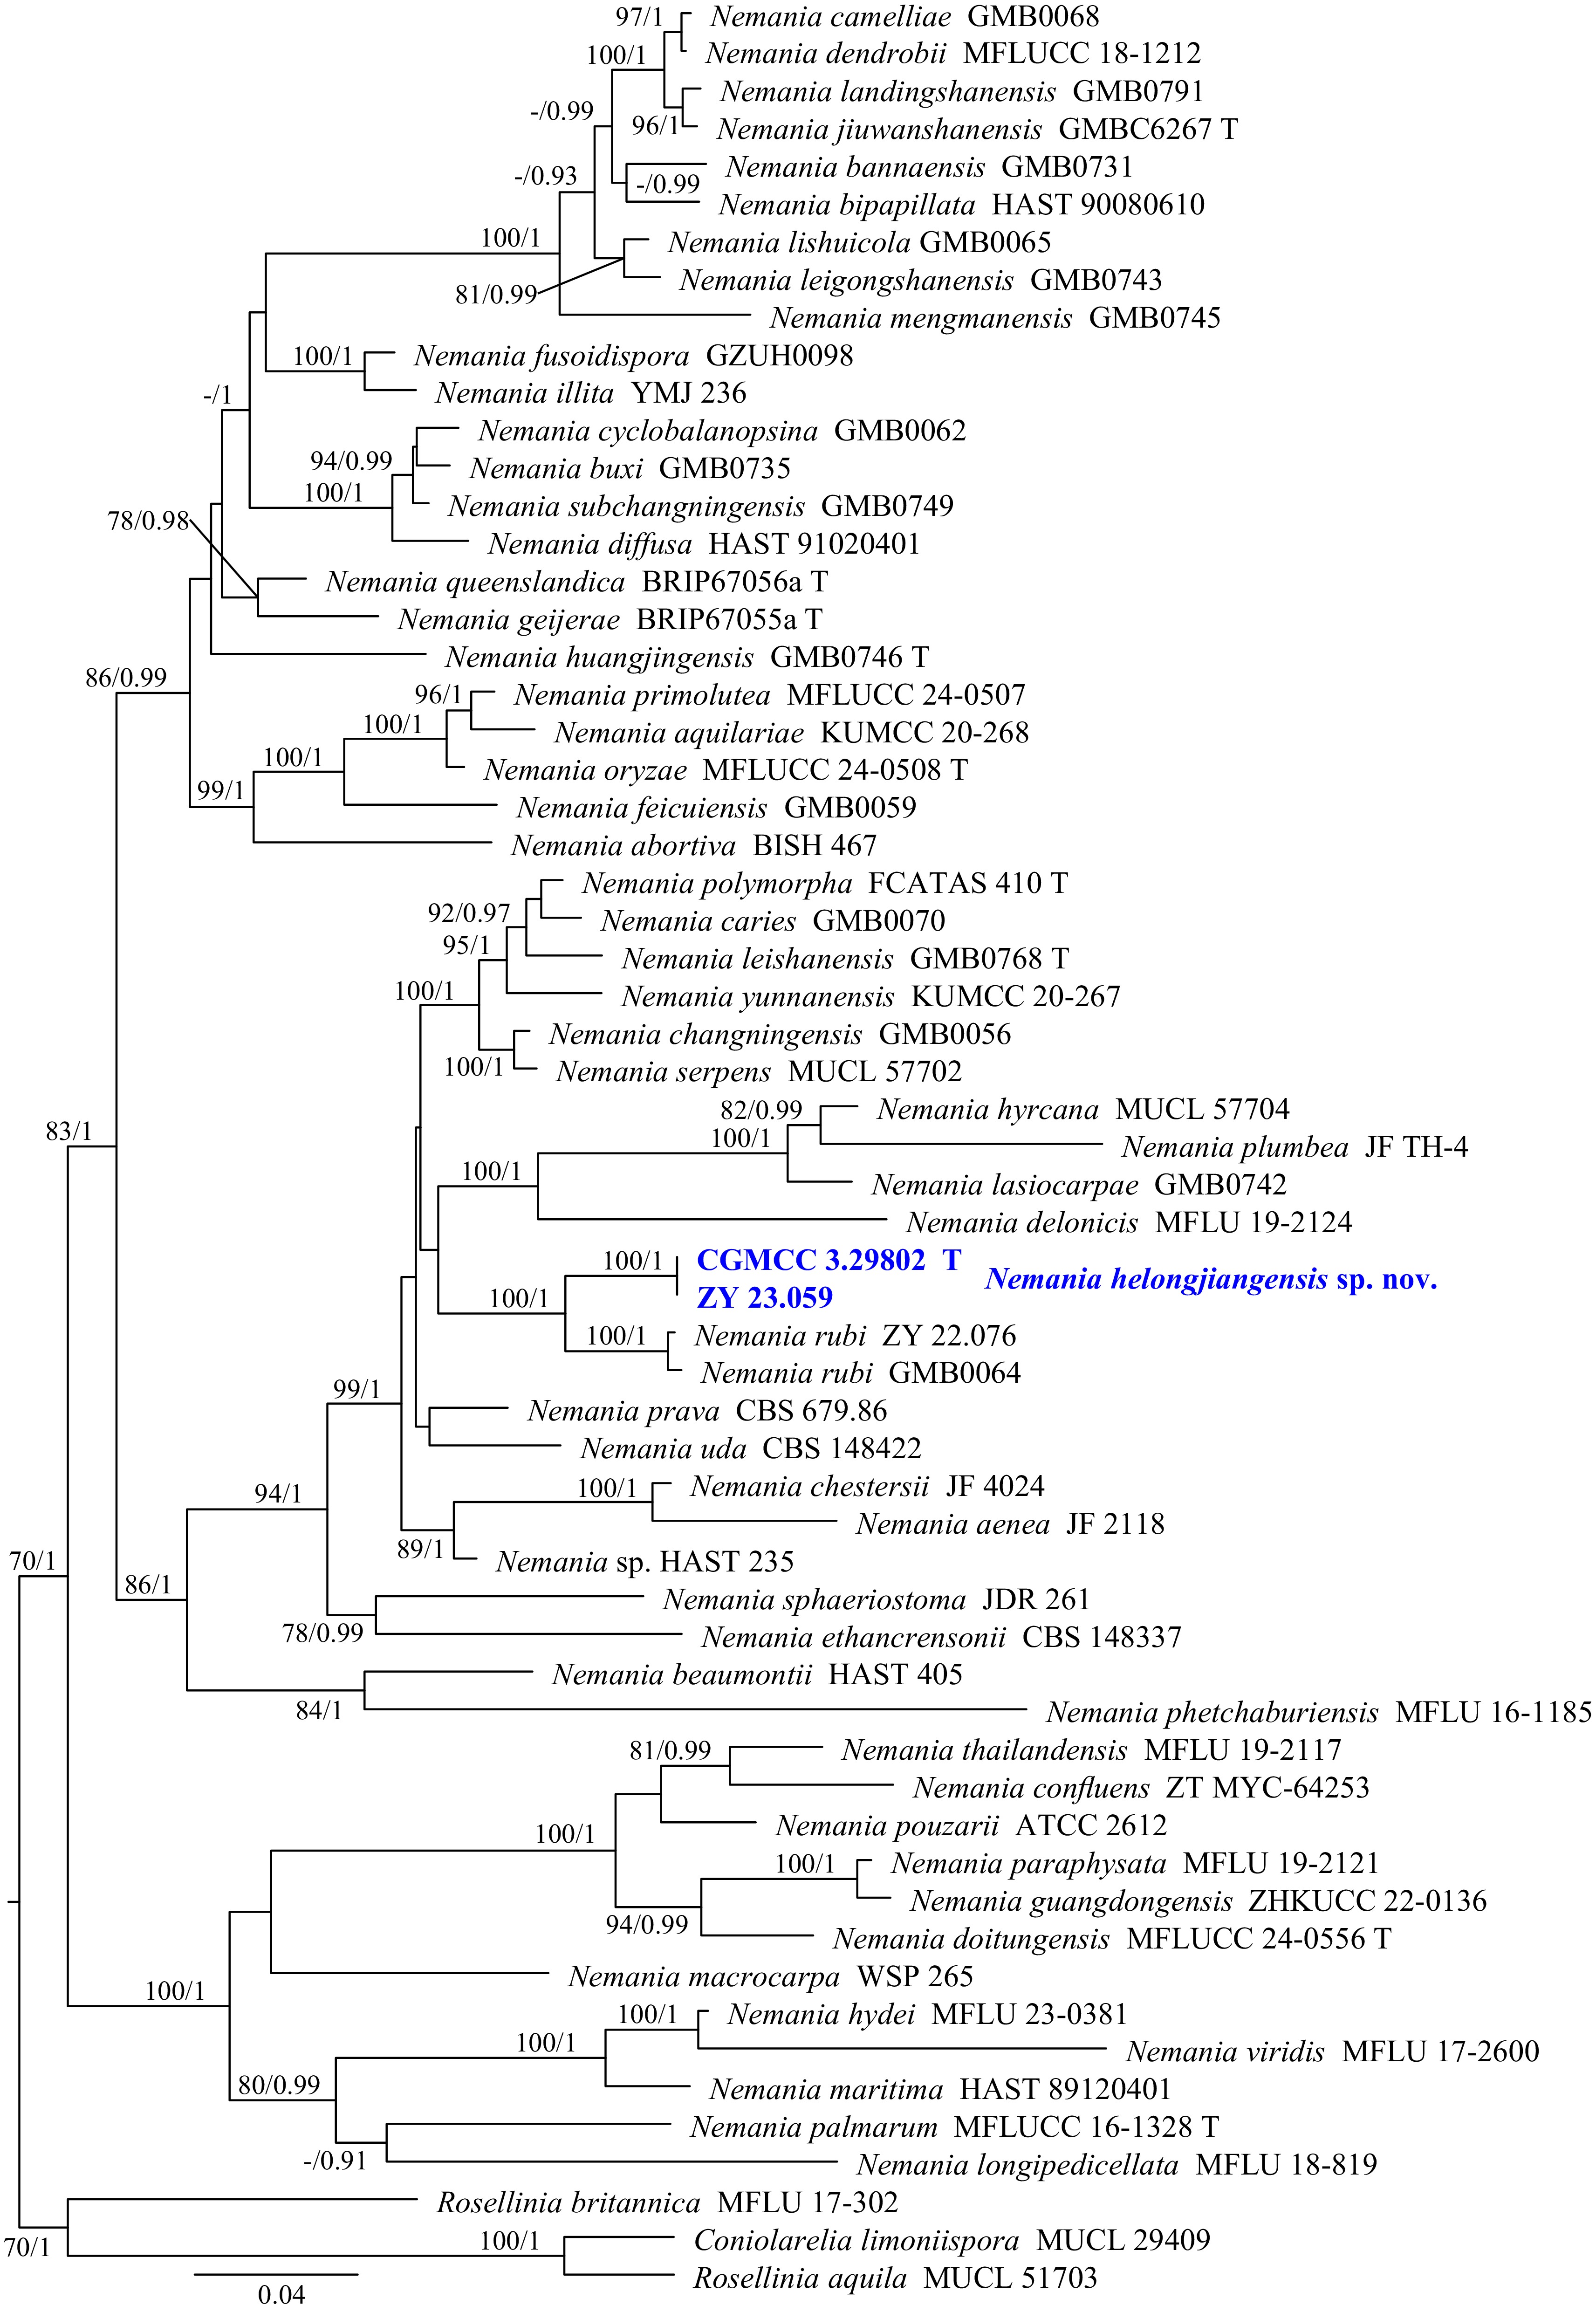
Figure 35.
Phylogram generated from ML analysis based on the combined dataset of ITS, LSU, RPB2, and TUB sequence data. Numbers at branches indicate support values (IQ-TREE-BS/BI-PP) above 70%/0.90. The tree is rooted to Coniolarelia limoniispora (MUCL 29409), Rosellinia aquila (MUCL 51703), and R. britannica (MFLU 17-302). Newly generated sequences are in bold and blue, and 'T' indicates type-derived sequences. The scale bar represents the expected number of changes per site.
-
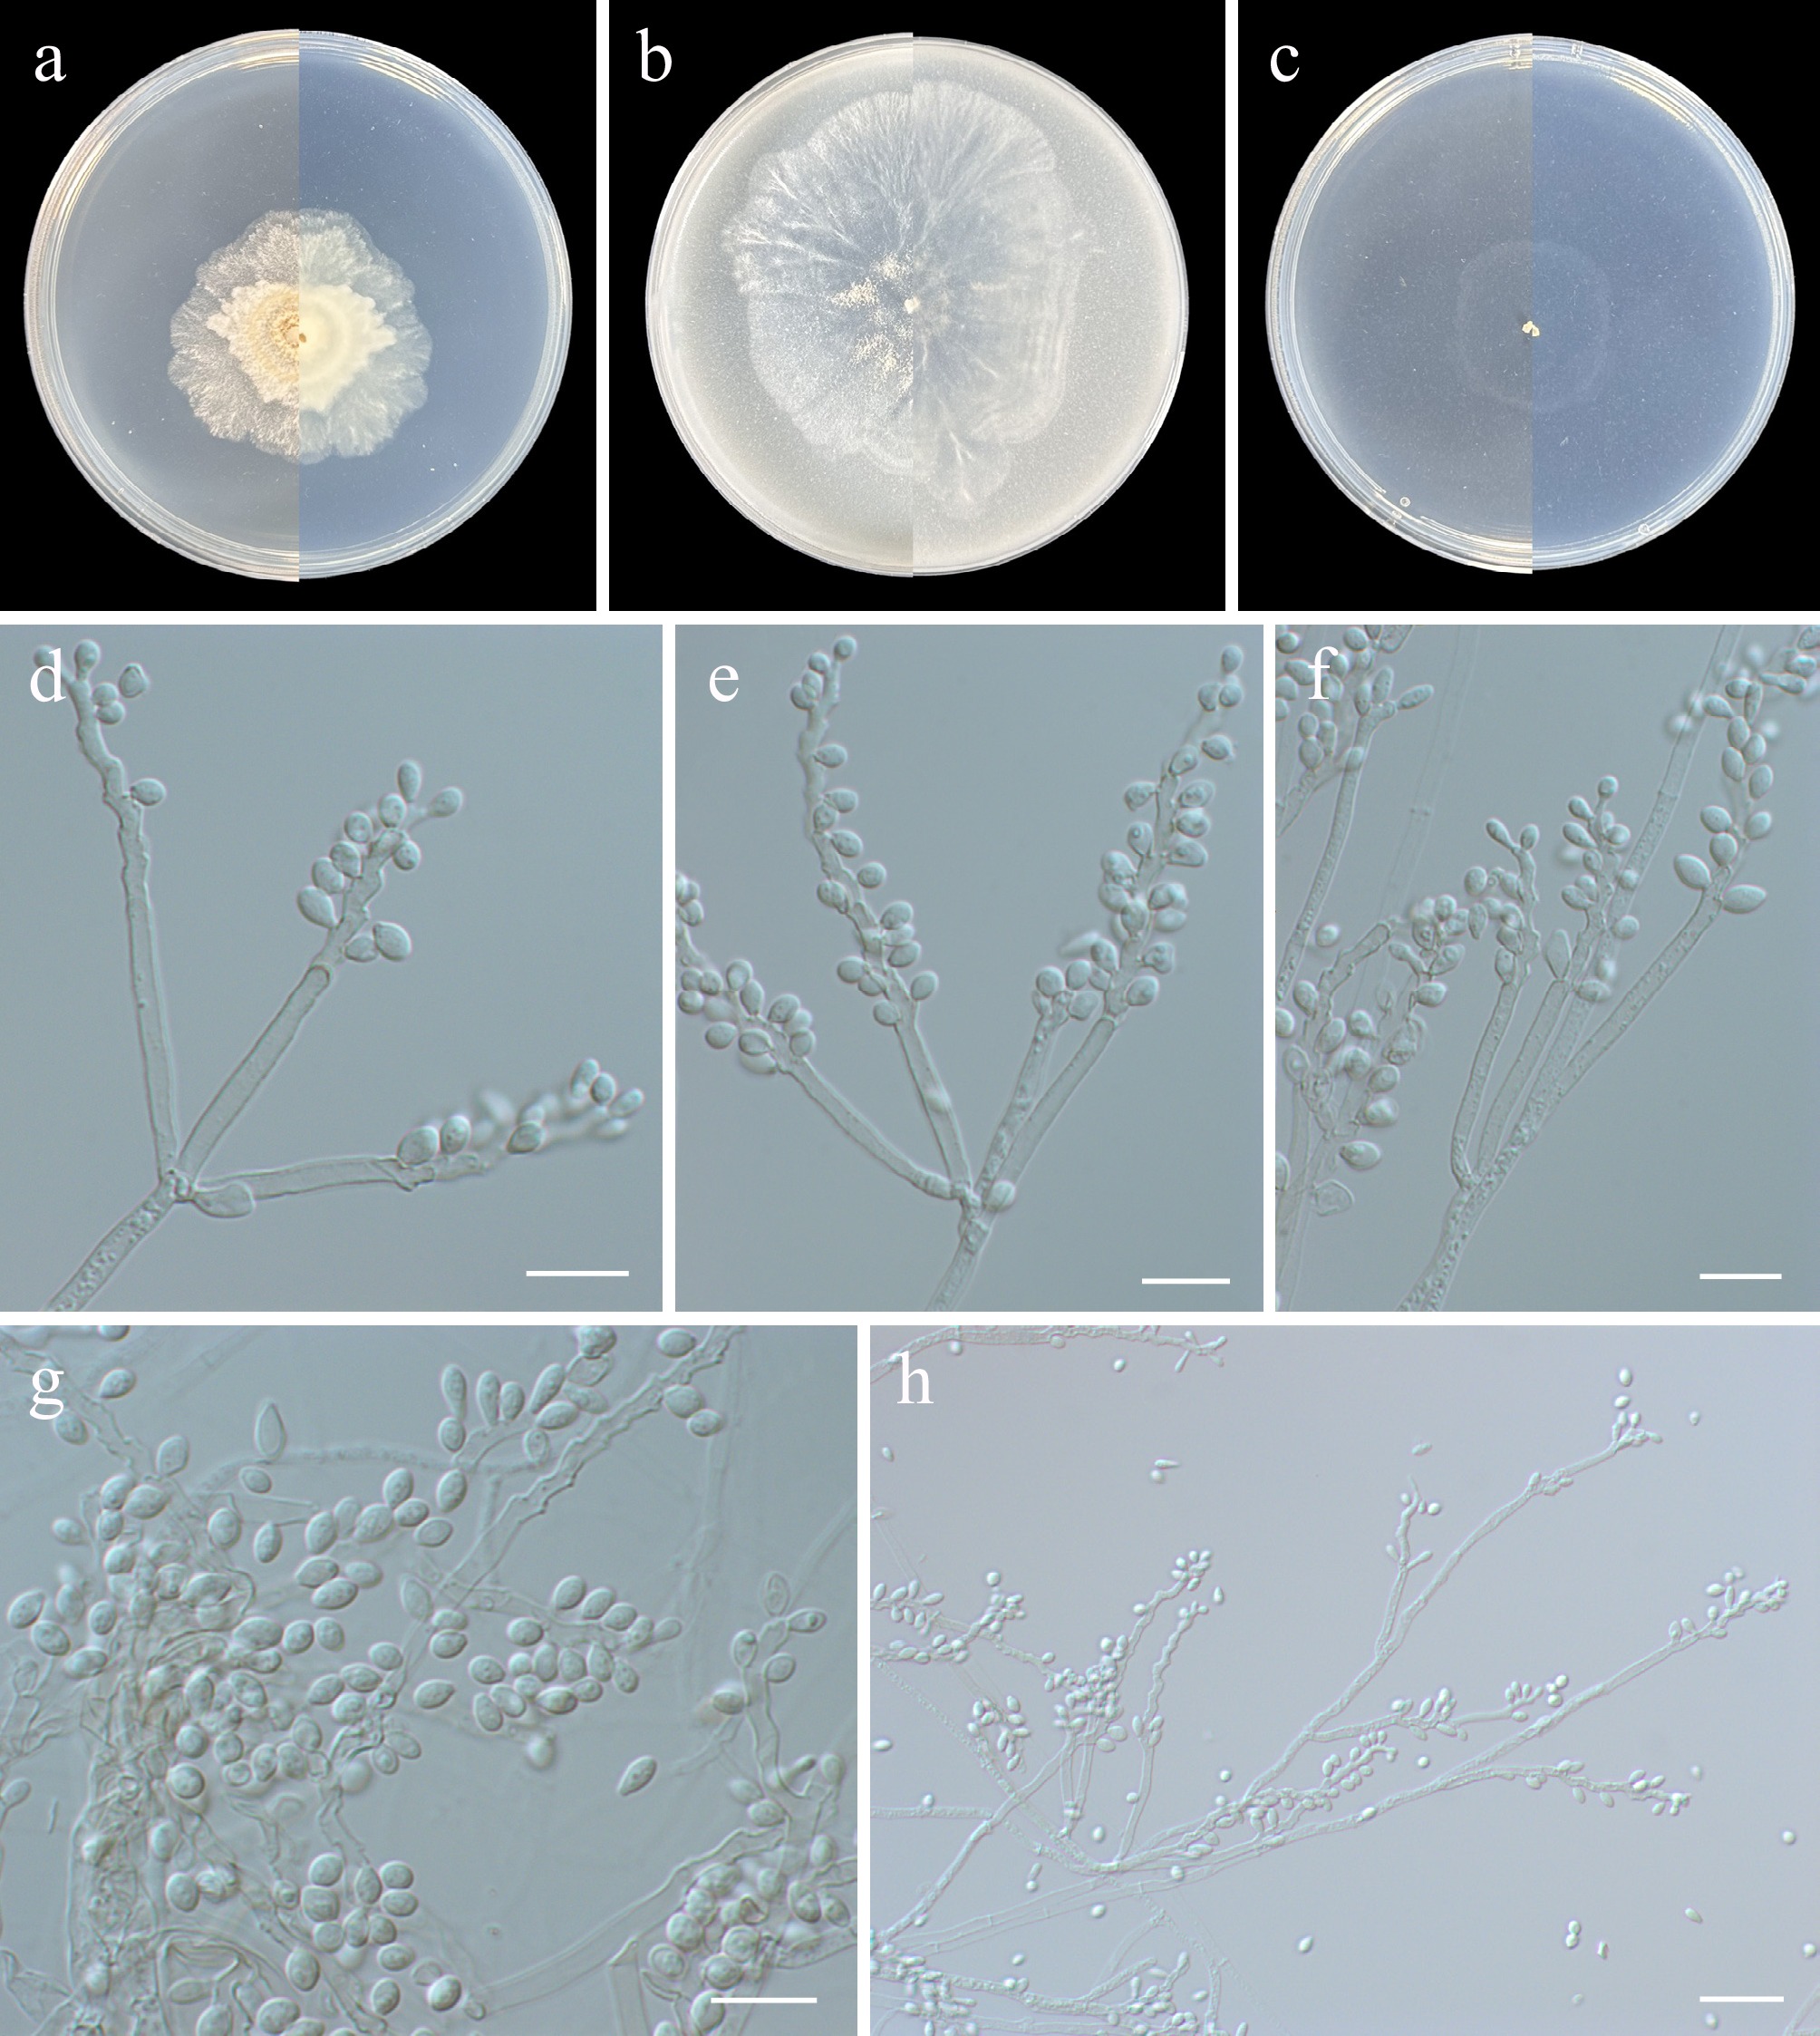
Figure 36.
Nemania heilongjiangensis (from holotype ZY H-23.058). (a)–(c) Upper and reverse views of cultures on PDA, OA, and SNA after 14 d at 25 °C. (d)–(f), (h) Conidiogenous cells and conidia. (g) Conidia. Scale bars: (d)–(g) 10 μm, (h) 20 μm.
-
Gene/
locusPrimer Primer sequence (5’-3’) Annealing temperature (°C) Ref. ITS ITS1 TCCGTAGGTGAACCTGCGG 55 [24] ITS5 GGAAGTAAAAGTCGTAACAAGG ITS4 TCCTCCGCTTATTGATATGC LSU LR0R ACCCGCTGAACTTAAGC 55 [25] LR5 ATCCTGAGGGAAACTTC SSU NS1 GTAGTCATATGCTTGTCTC 55 [24] NS4 CTTCCGTCAATTCCTTTAAG TEF1 EF1-983F GCYCCYGGHCAYCGTGAYTTYAT 55 [26,27] EF1-2218R ATGACACCRACRGCRACRGTYTG EF1-728F CATCGAGAAGTTCGAGAAGG EF-2 GGAAGTACCAGTGATCATGTT EF–986R TACTTGAAGGAACCCTTACC ACT ACT-512F ATGTGCAAGGCCGGTTTCGC 51 [27] ACT-783R TACGAGTCCTTCTGGCCCAT RPB2 fRPB2-5f GAYGAYMGWGATCAYTTYGG 52 [28,29] RPB150 CTGGGGWGATCARAAGAAGG fRPB2-7cR CCCATRGCTTGYTTRCCCAT TUB Bt2a GGTAACCAAATCGGTGCTGCTTTC 51 [30,31] Bt2b ACCCTCAGTGTAGTGACCCTTGGC BT2916 CTCAGCCTCAGTGAACTCCAT 58 BT1819R TTCCGTCCCGACAACTTCGT CaM CF1 GCCGACTCTTTGACYGARGAR 55 [32] CF4 TTTYTGCATCATRAGYTGGAC ITS: the nuclear internal transcribed spacers, LSU: the nuclear large subunit ribosomal RNA, SSU: the nuclear ribosomal small subunit rRNA, TEF1: the translation elongation factor 1-alpha, ACT: the actin, RPB2: the second largest subunit of RNA polymerase II, TUB: the beta-tubulin. Table 1.
Loci, primers, and PCR amplification procedures used in this study.
Figures
(36)
Tables
(1)