-
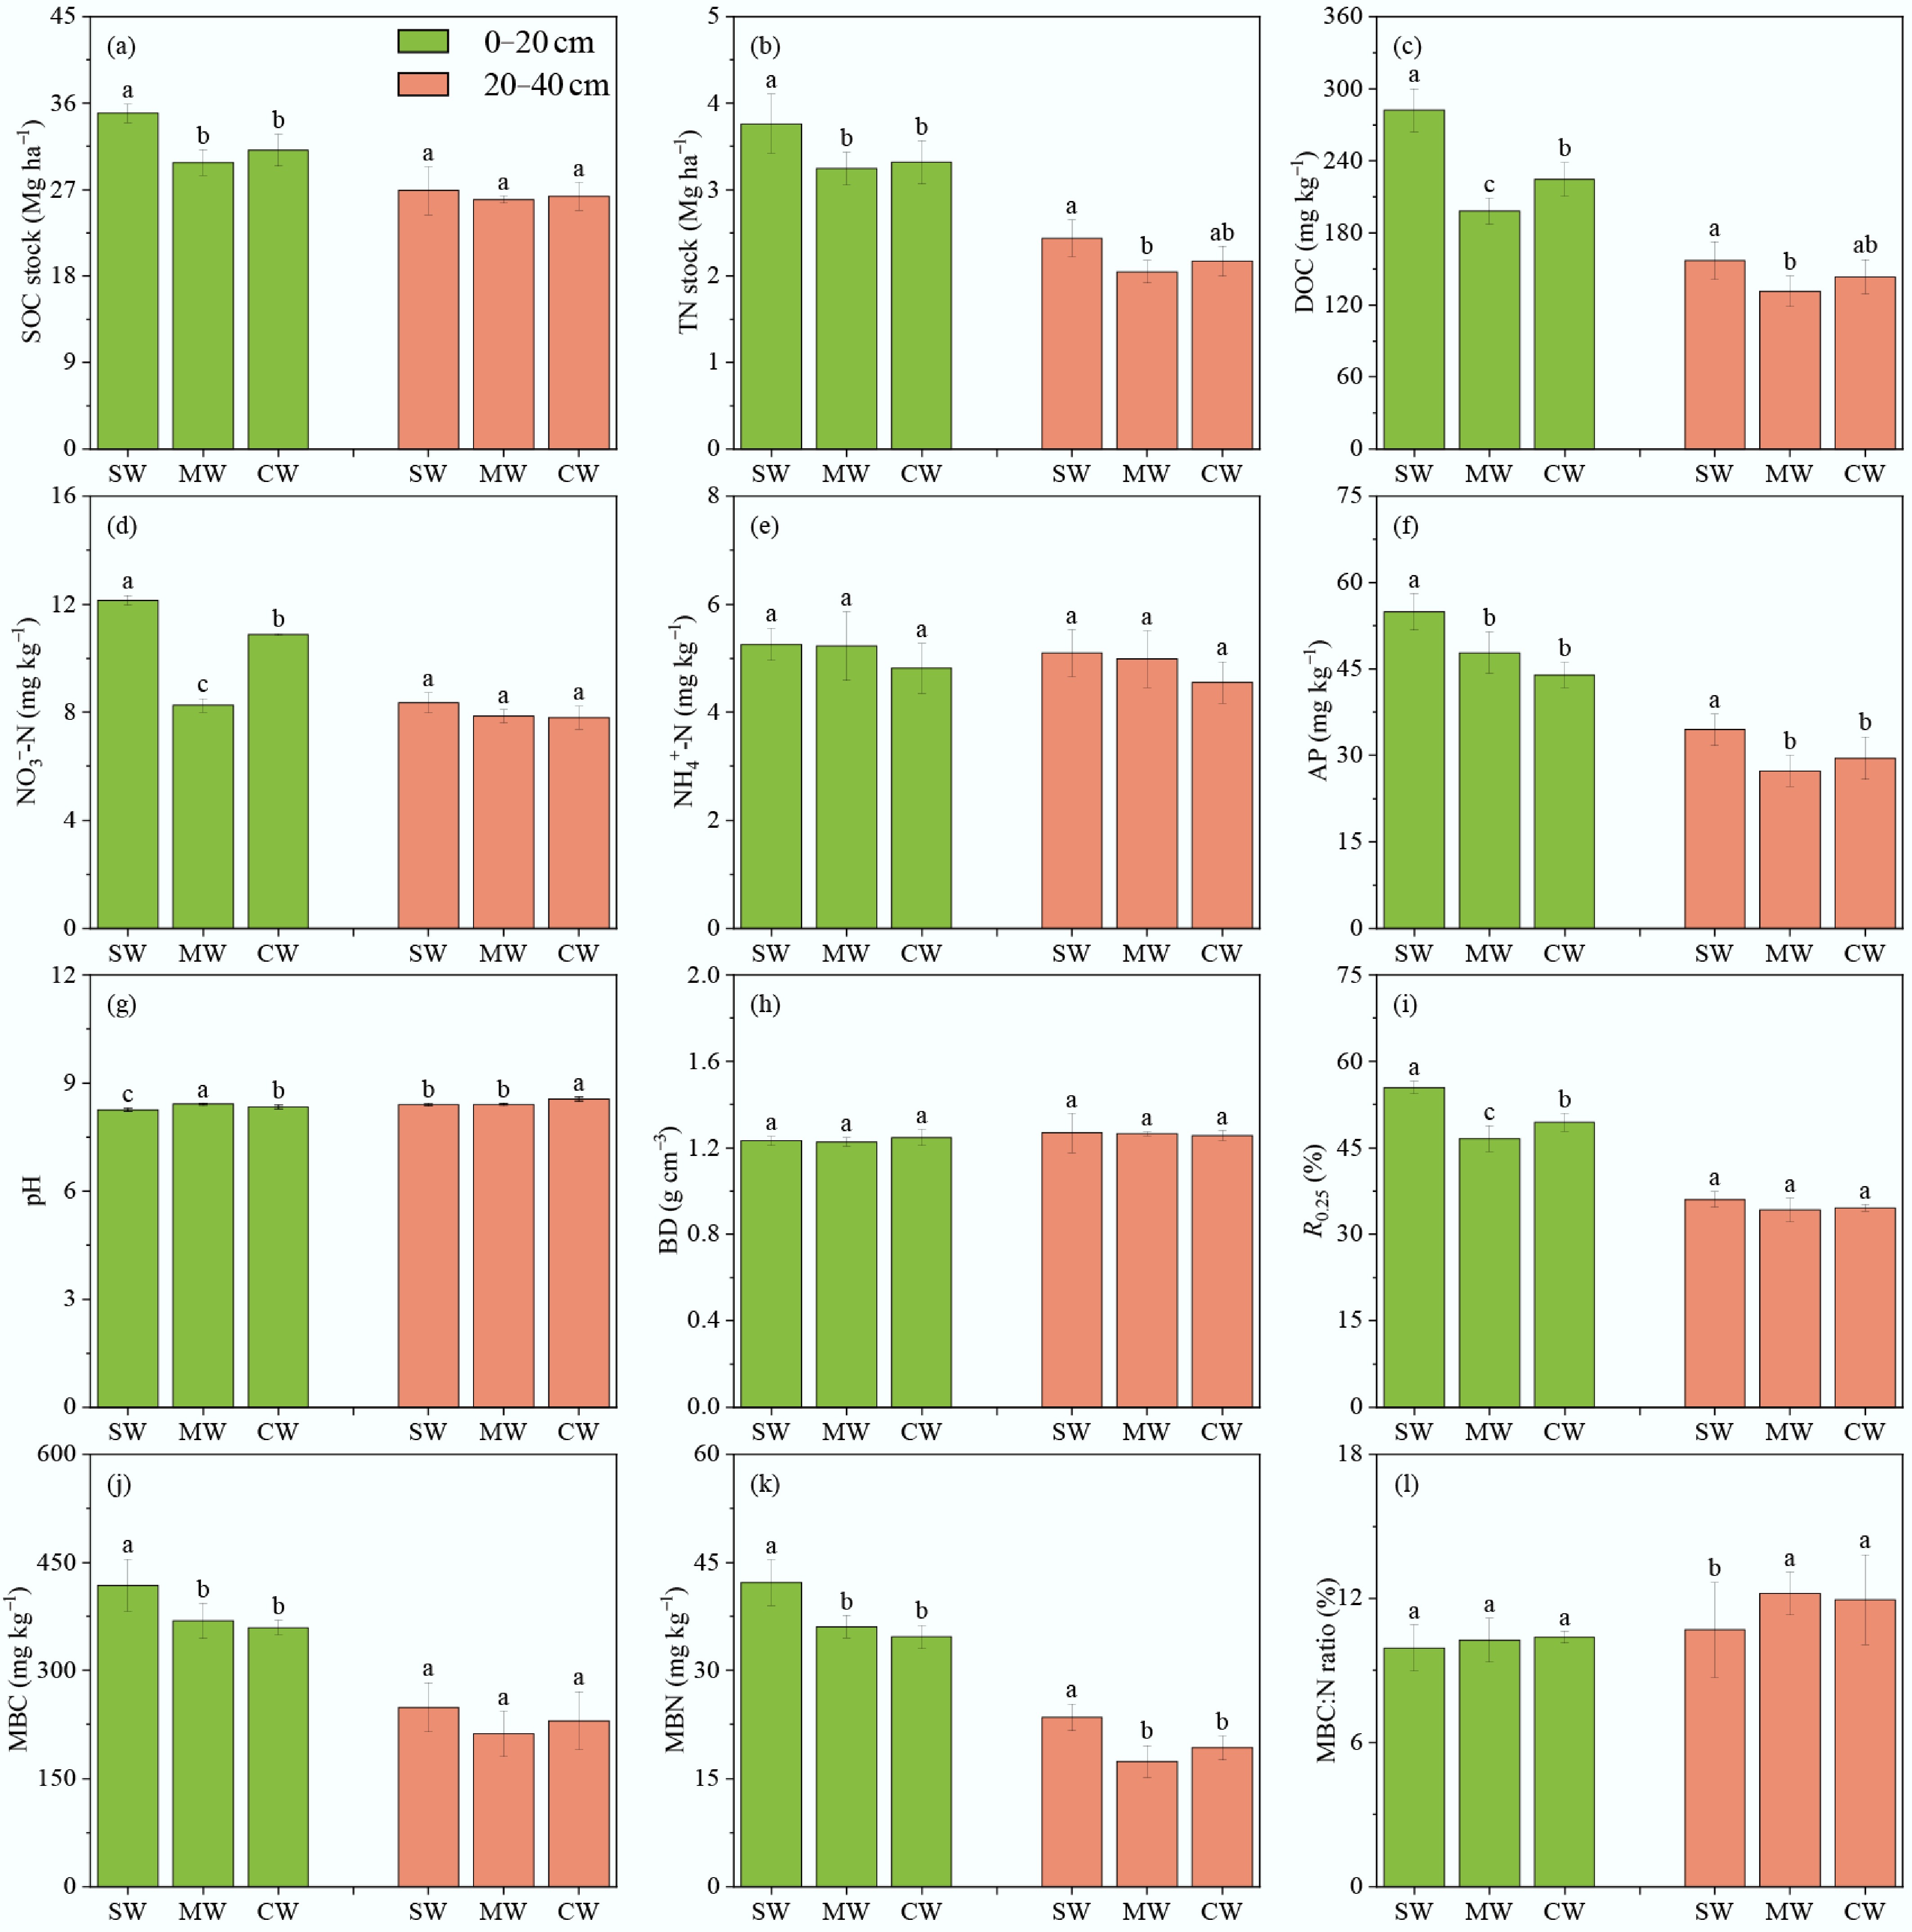
Figure 1.
Soil abiotic and biotic properties in different crop rotation patterns. Values are means ± standard error (n = 4). Significant differences among treatments at p < 0.05 are indicated by lowercase letters. SW, soybean–wheat rotation; MW, maize–wheat rotation; CW, cotton–wheat rotation. SOC, soil organic carbon; TN, total nitrogen; DOC, dissolved organic carbon; NO3−-N, nitrate nitrogen; NH4+-N, ammonium nitrogen; AP, available phosphorus; BD, bulk density; R0.25, > 0.25 mm aggregates; MBC, microbial biomass carbon; MBN, microbial biomass nitrogen; MBC:N, microbial biomass carbon-to-nitrogen ratio.
-
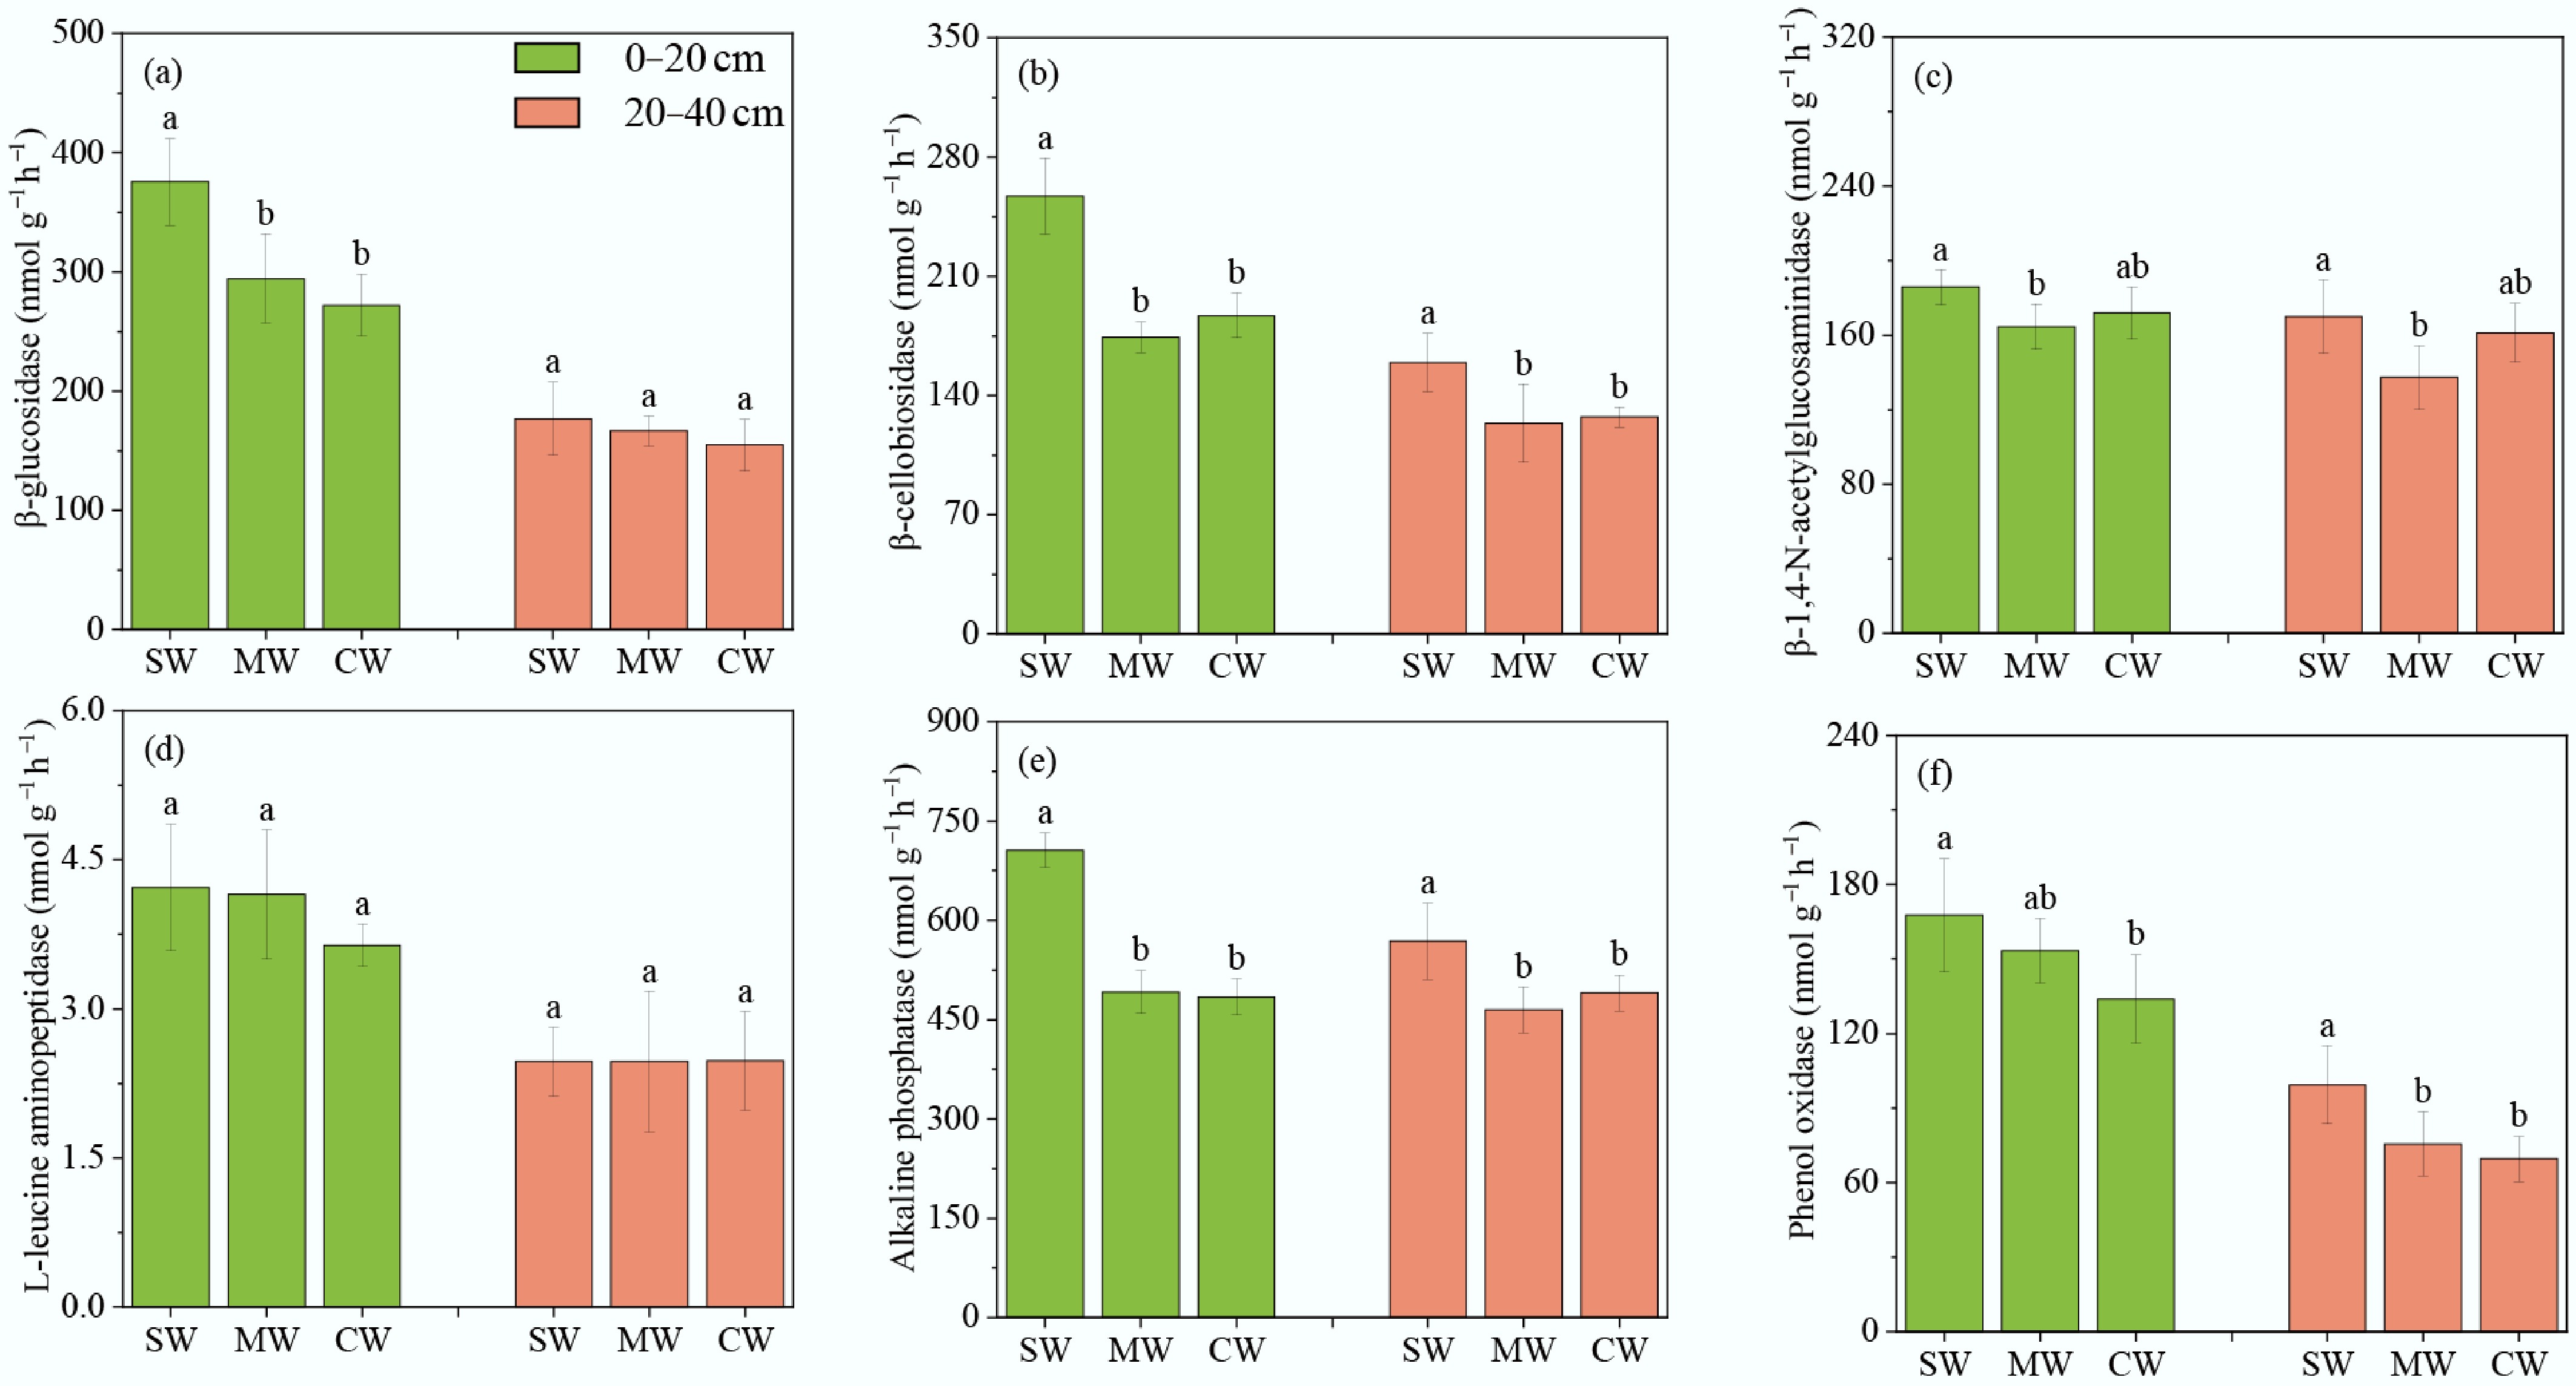
Figure 2.
Soil extracellular enzyme activities under different rotation patterns. Values are means ± standard error (n = 4). Significant differences among treatments at p < 0.05 are indicated by lowercase letters. SW, soybean–wheat rotation; MW, maize–wheat rotation; CW, cotton–wheat rotation.
-
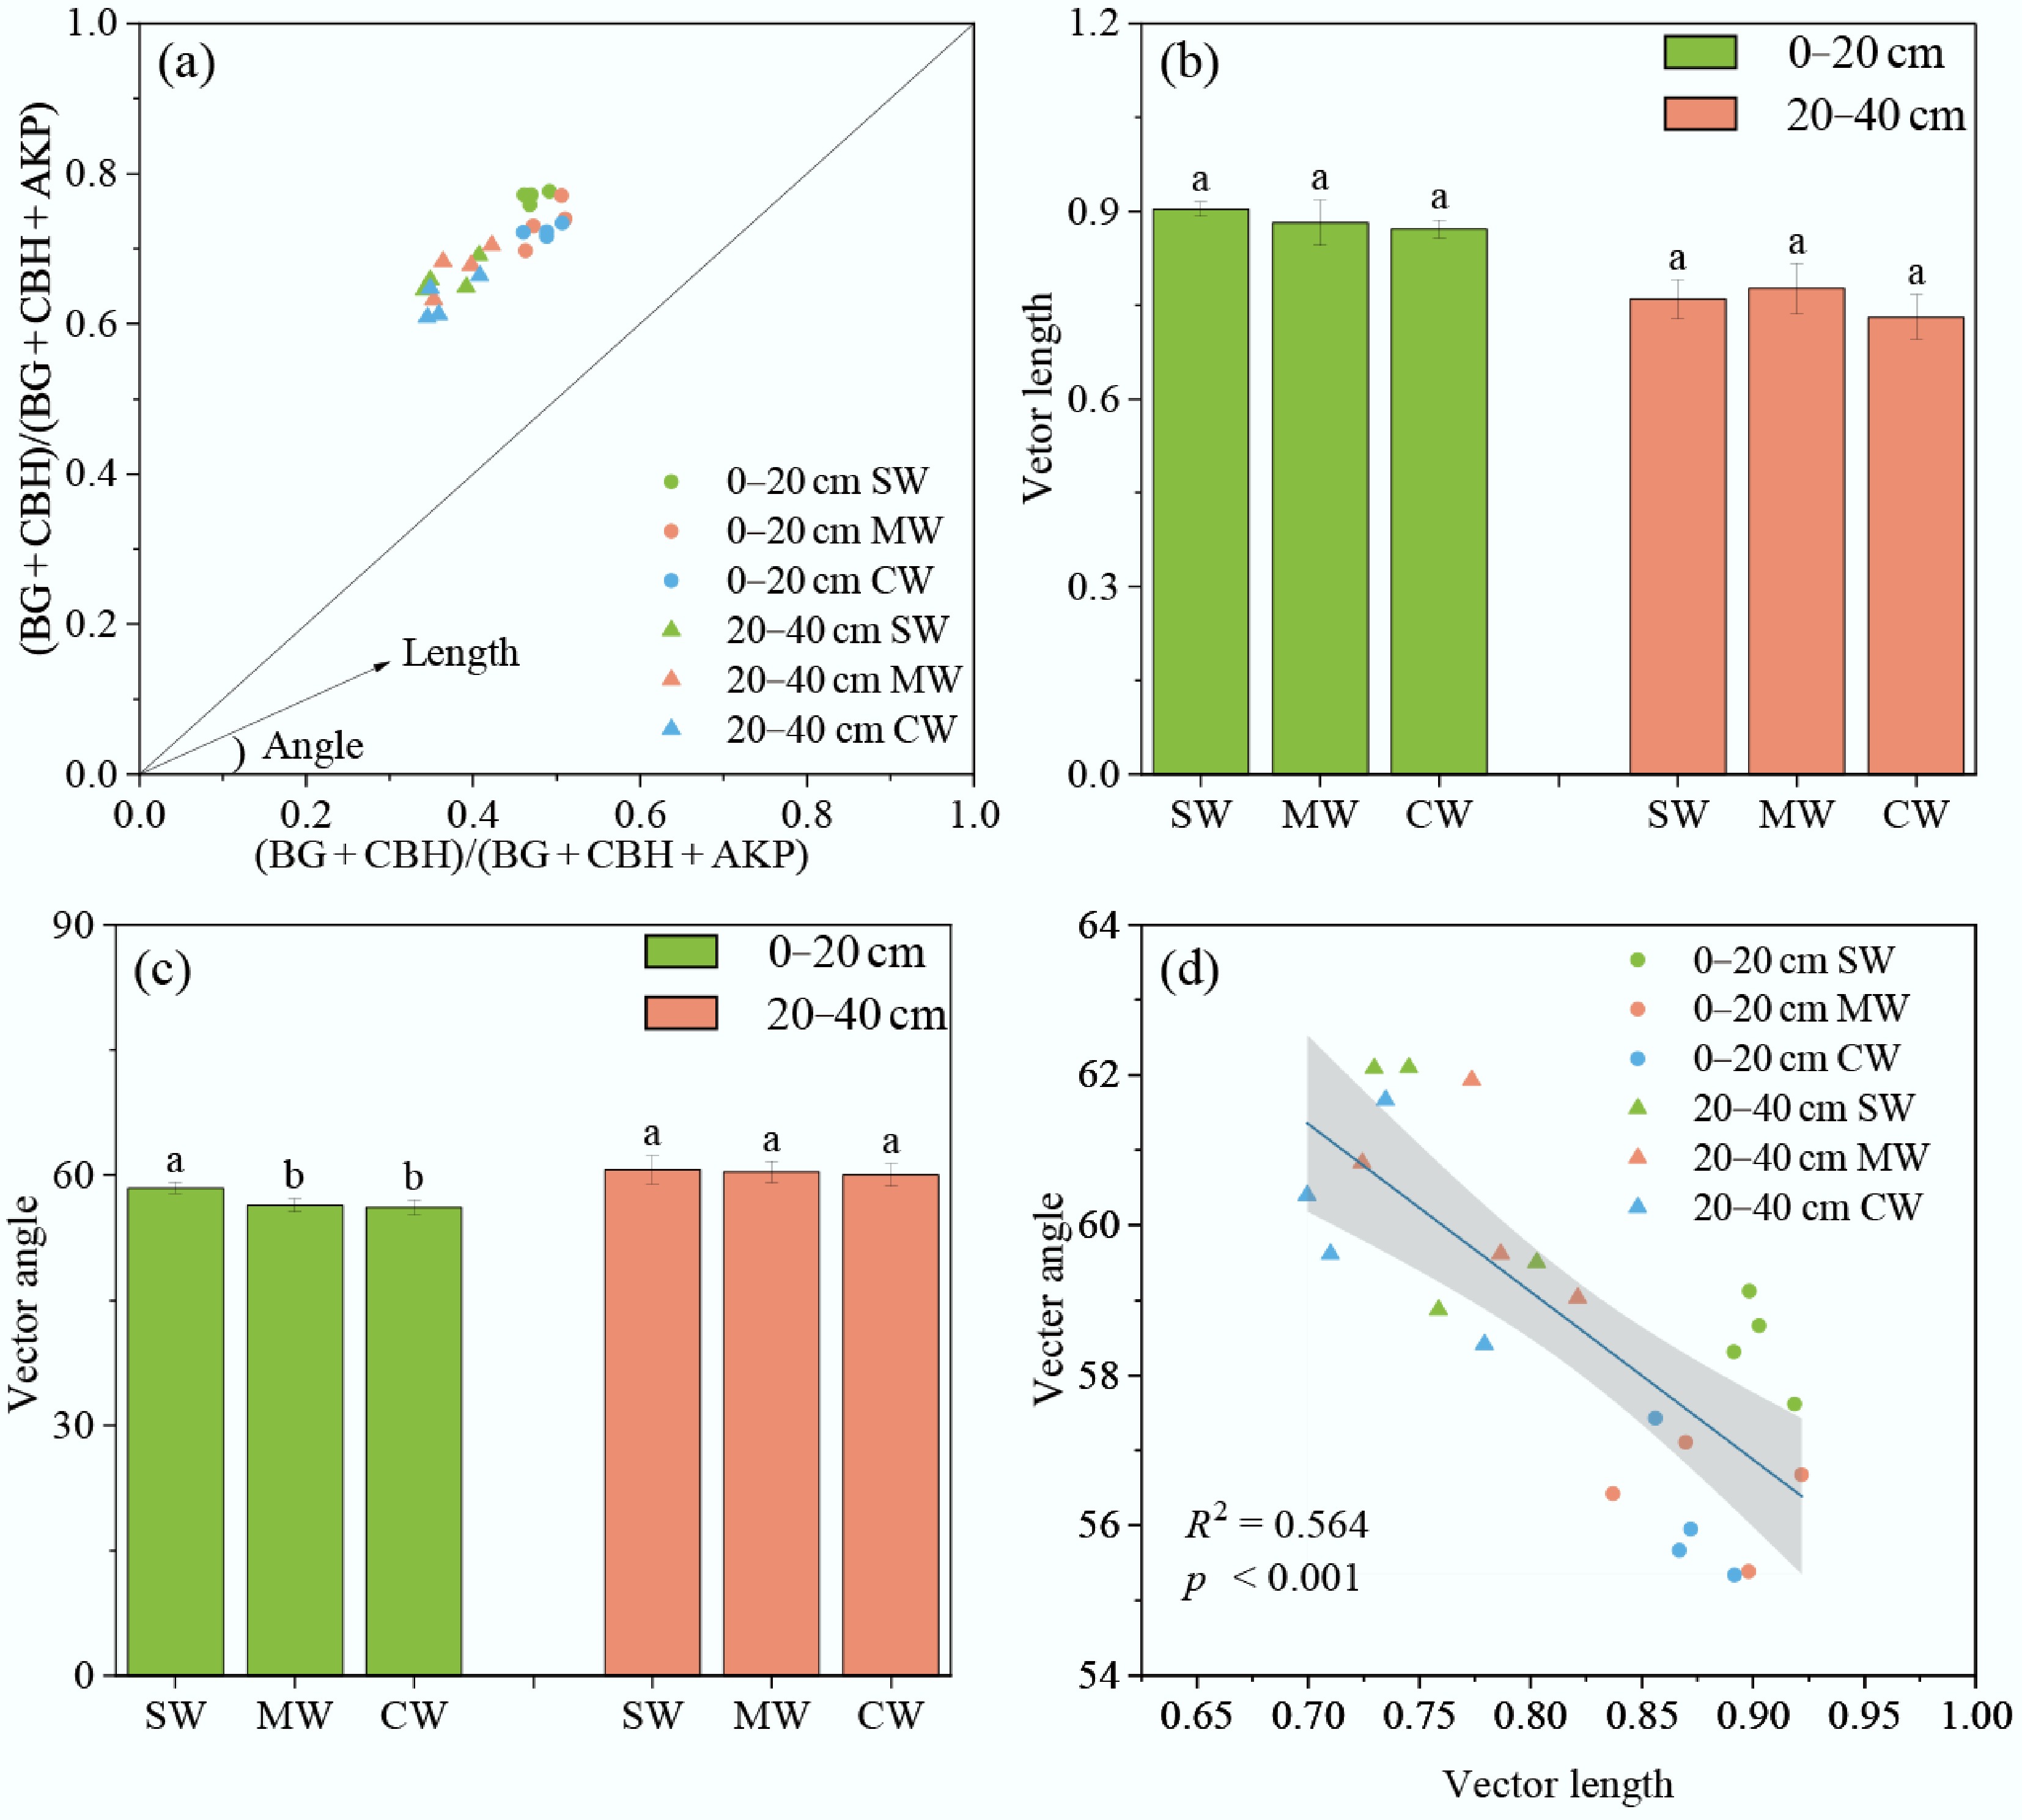
Figure 3.
Enzyme stoichiometry under different rotation patterns. (a) Vector length denotes microbial carbon limitation. (b) Vector angle indicates microbial nitrogen limitation (< 45°) or phosphorus limitation (> 45°). (c) Regression analysis of the relationships between microbial carbon limitation (vector length) and microbial nitrogen or phosphorus limitation (vector angle). (d) Values are the means ± standard error (n = 4). Significant differences among treatments at p < 0.05 are indicated by lowercase letters. SW, soybean–wheat rotation; MW, maize–wheat rotation; CW, cotton–wheat rotation.
-
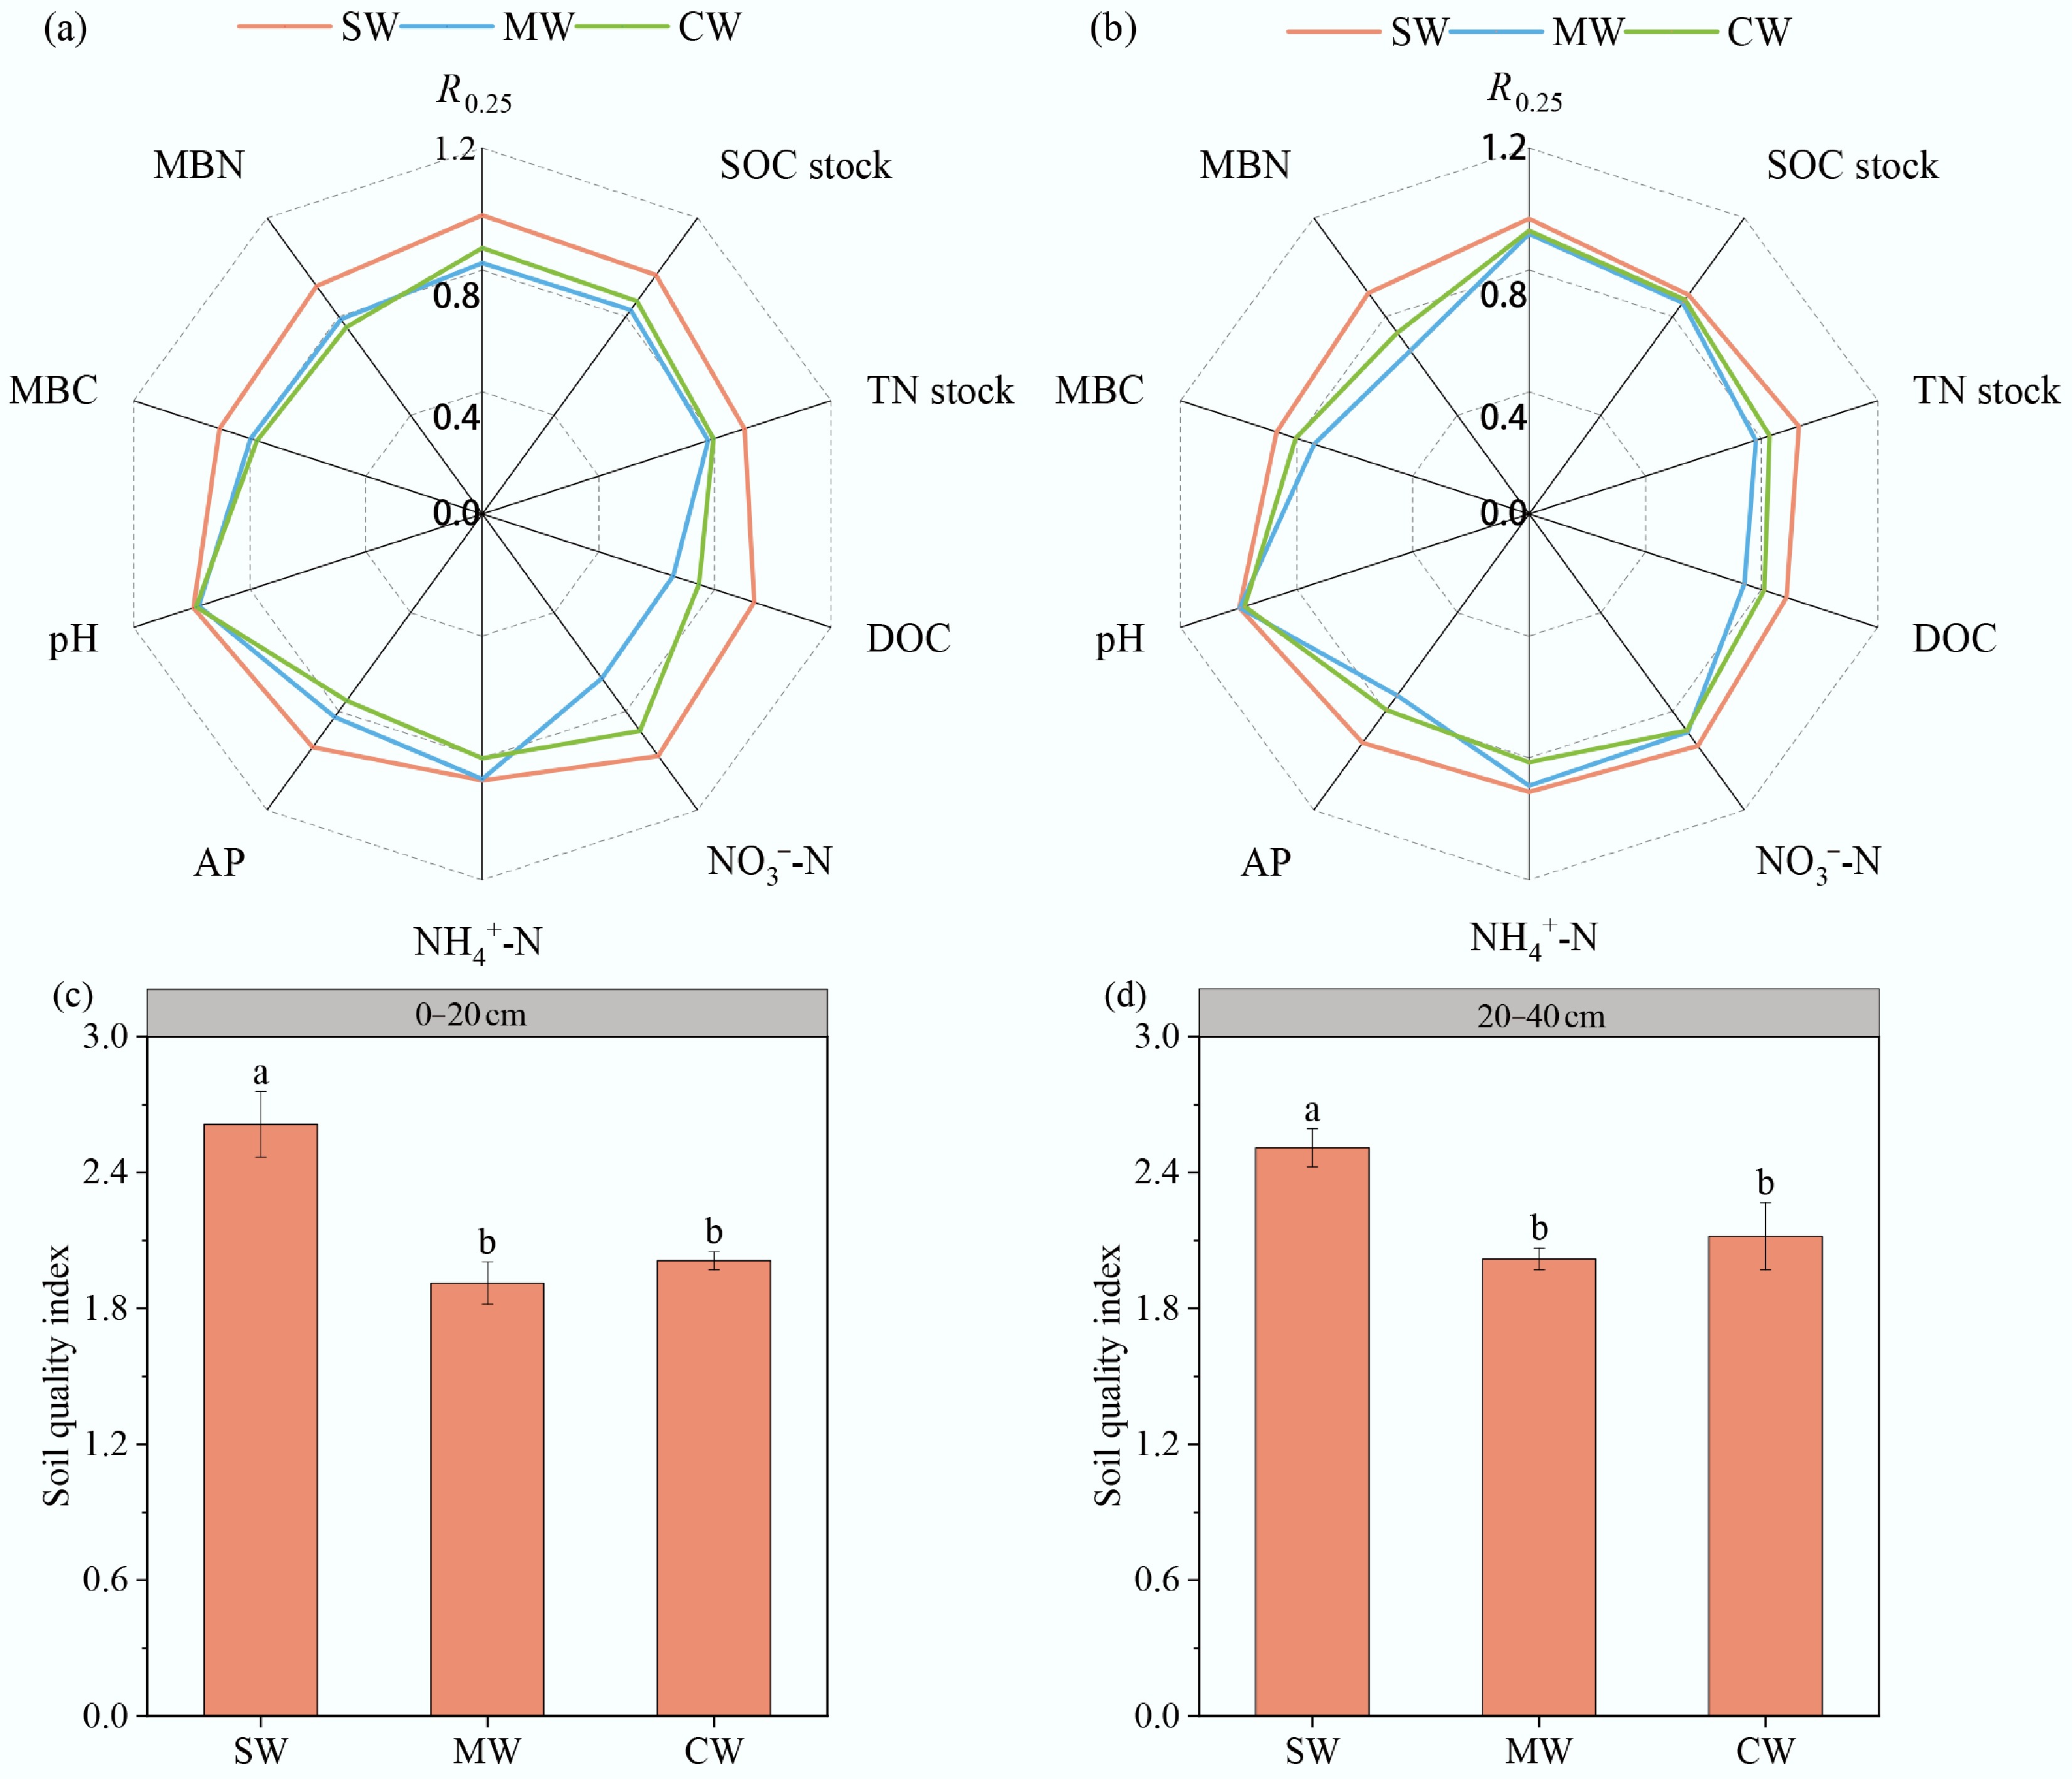
Figure 4.
Standardized comparison of soil abiotic and biotic properties in the (a) topsoil (0–20 cm), and (b) subsoil (20–40 cm); soil quality index under different rotation systems in the (c) topsoil and (d) subsoil. Values are the means ± standard error (n = 4). Significant differences among treatments at p < 0.05 are indicated by lowercase letters. SW, soybean–wheat rotation; MW, maize–wheat rotation; CW, cotton–wheat rotation. SOC, soil organic carbon; TN, total nitrogen; DOC, dissolved organic carbon; NO3−-N, nitrate nitrogen; NH4+-N, Ammonium nitrogen; AP, available phosphorus; R0.25, > 0.25 mm aggregates; MBC, microbial biomass carbon; MBN, microbial biomass nitrogen.
-
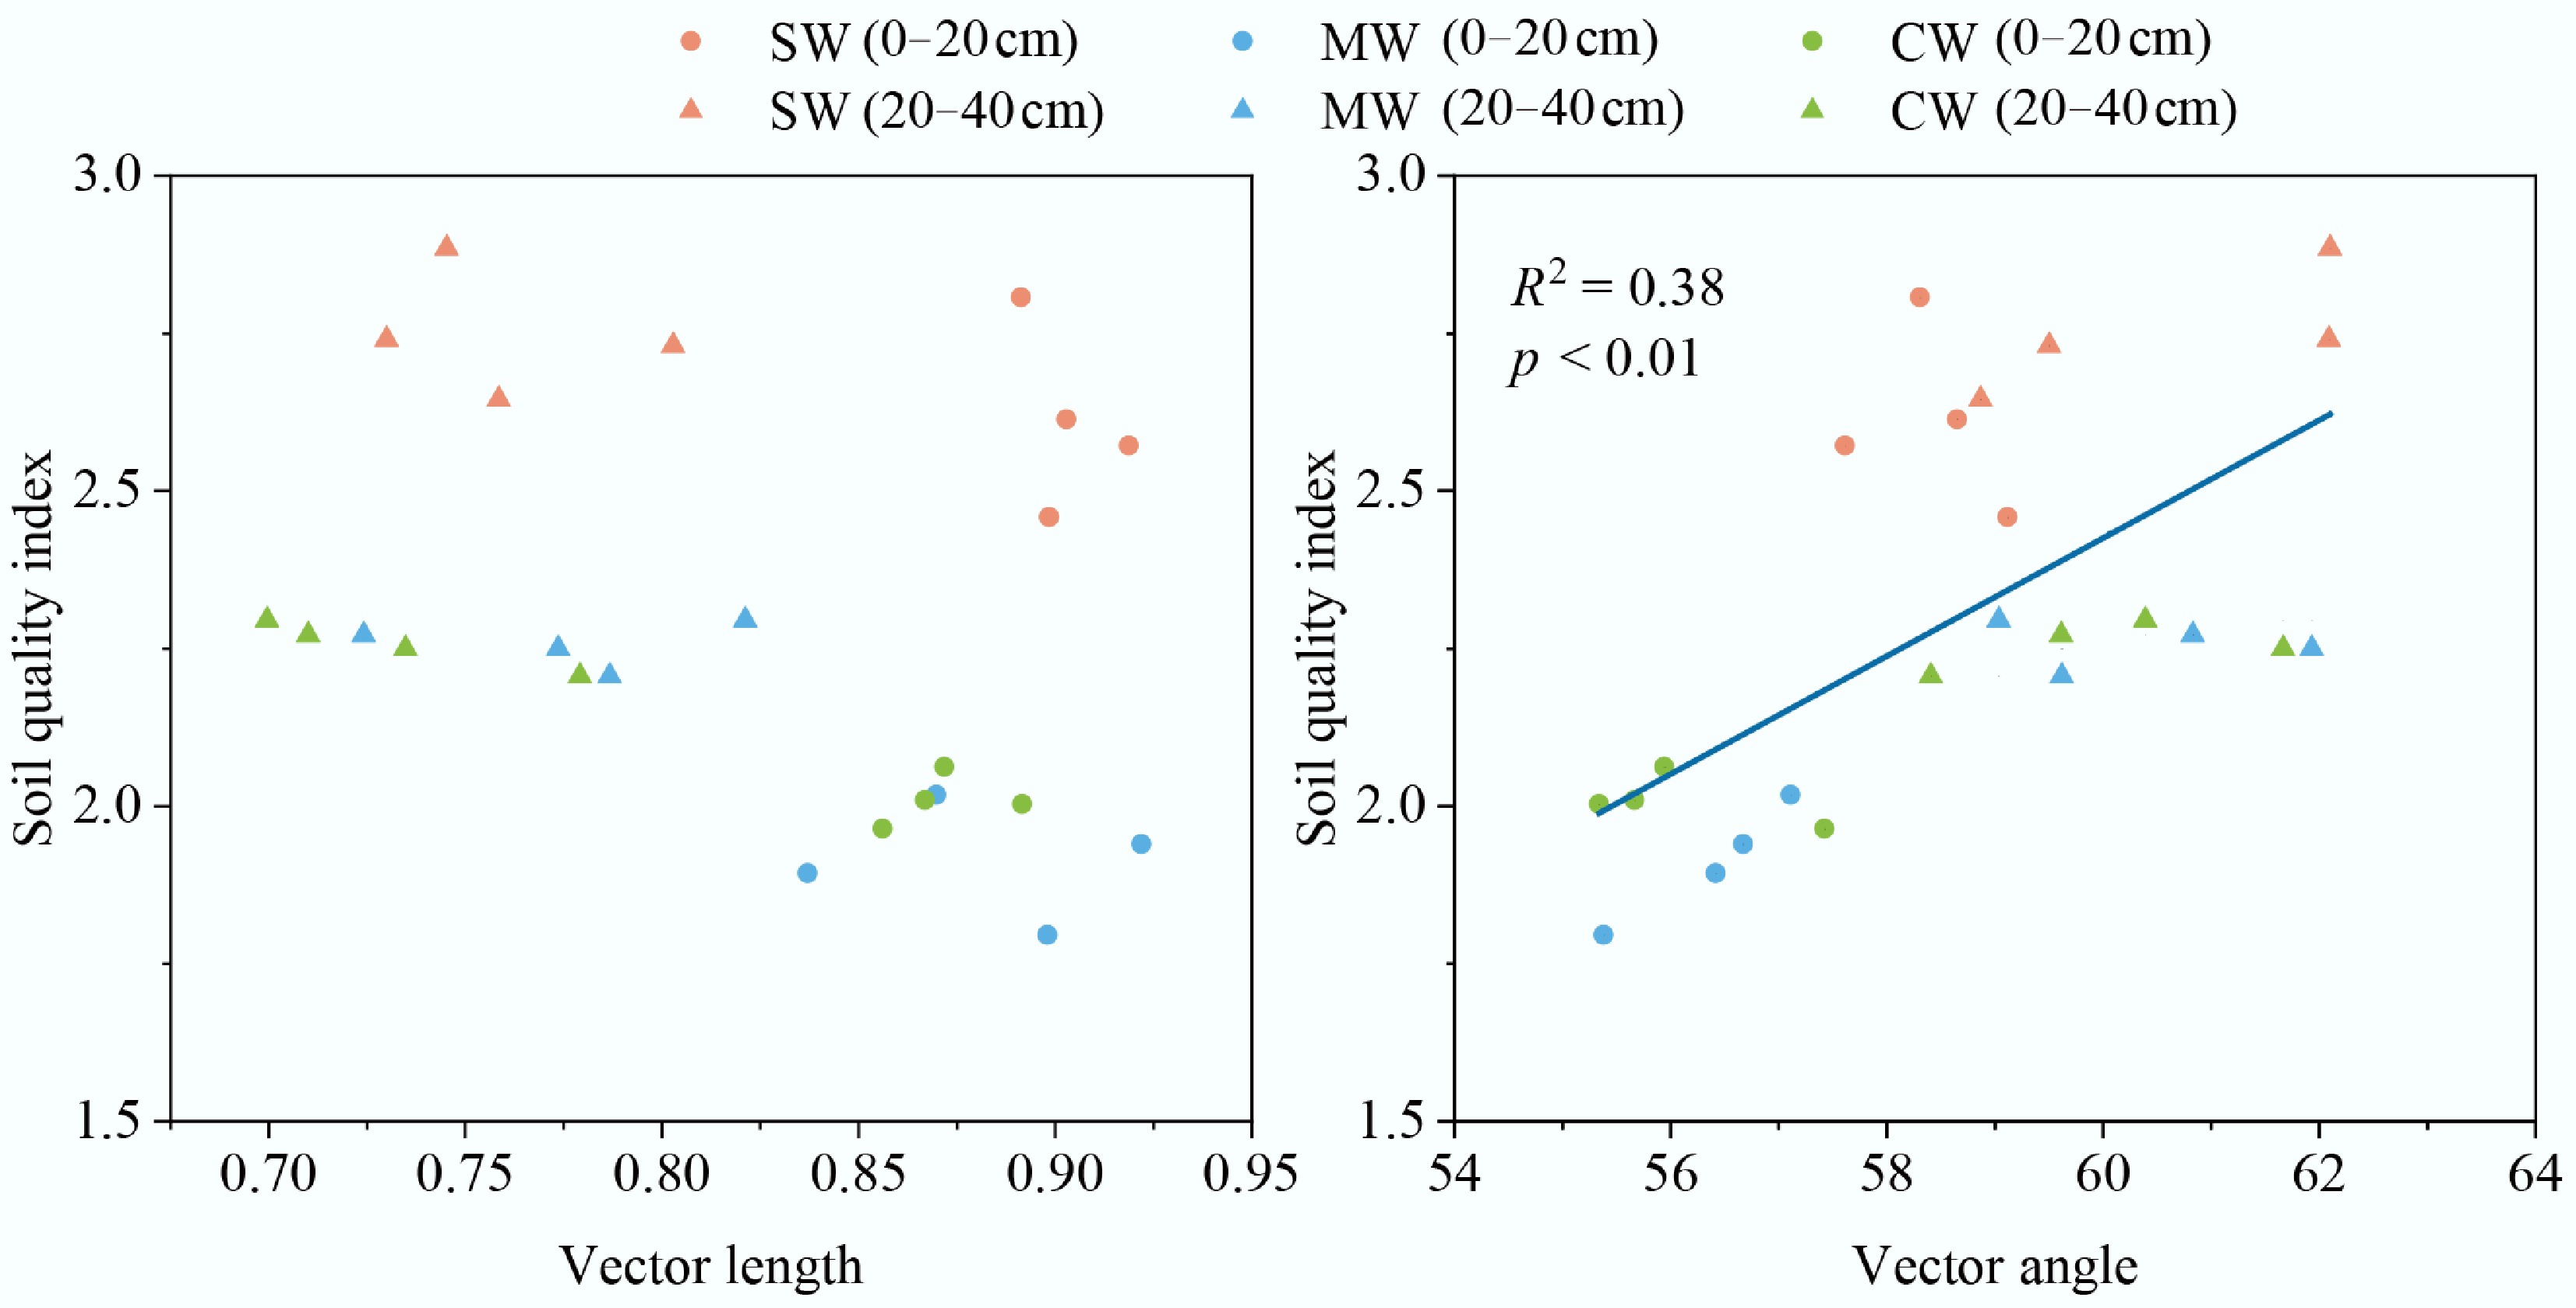
Figure 5.
Linear relationships between soil quality index and vector length (microbial carbon limitation) and vector angle (microbial nitrogen or phosphorus limitation). SW, soybean–wheat rotation; MW, maize–wheat rotation; CW, cotton–wheat rotation.
-
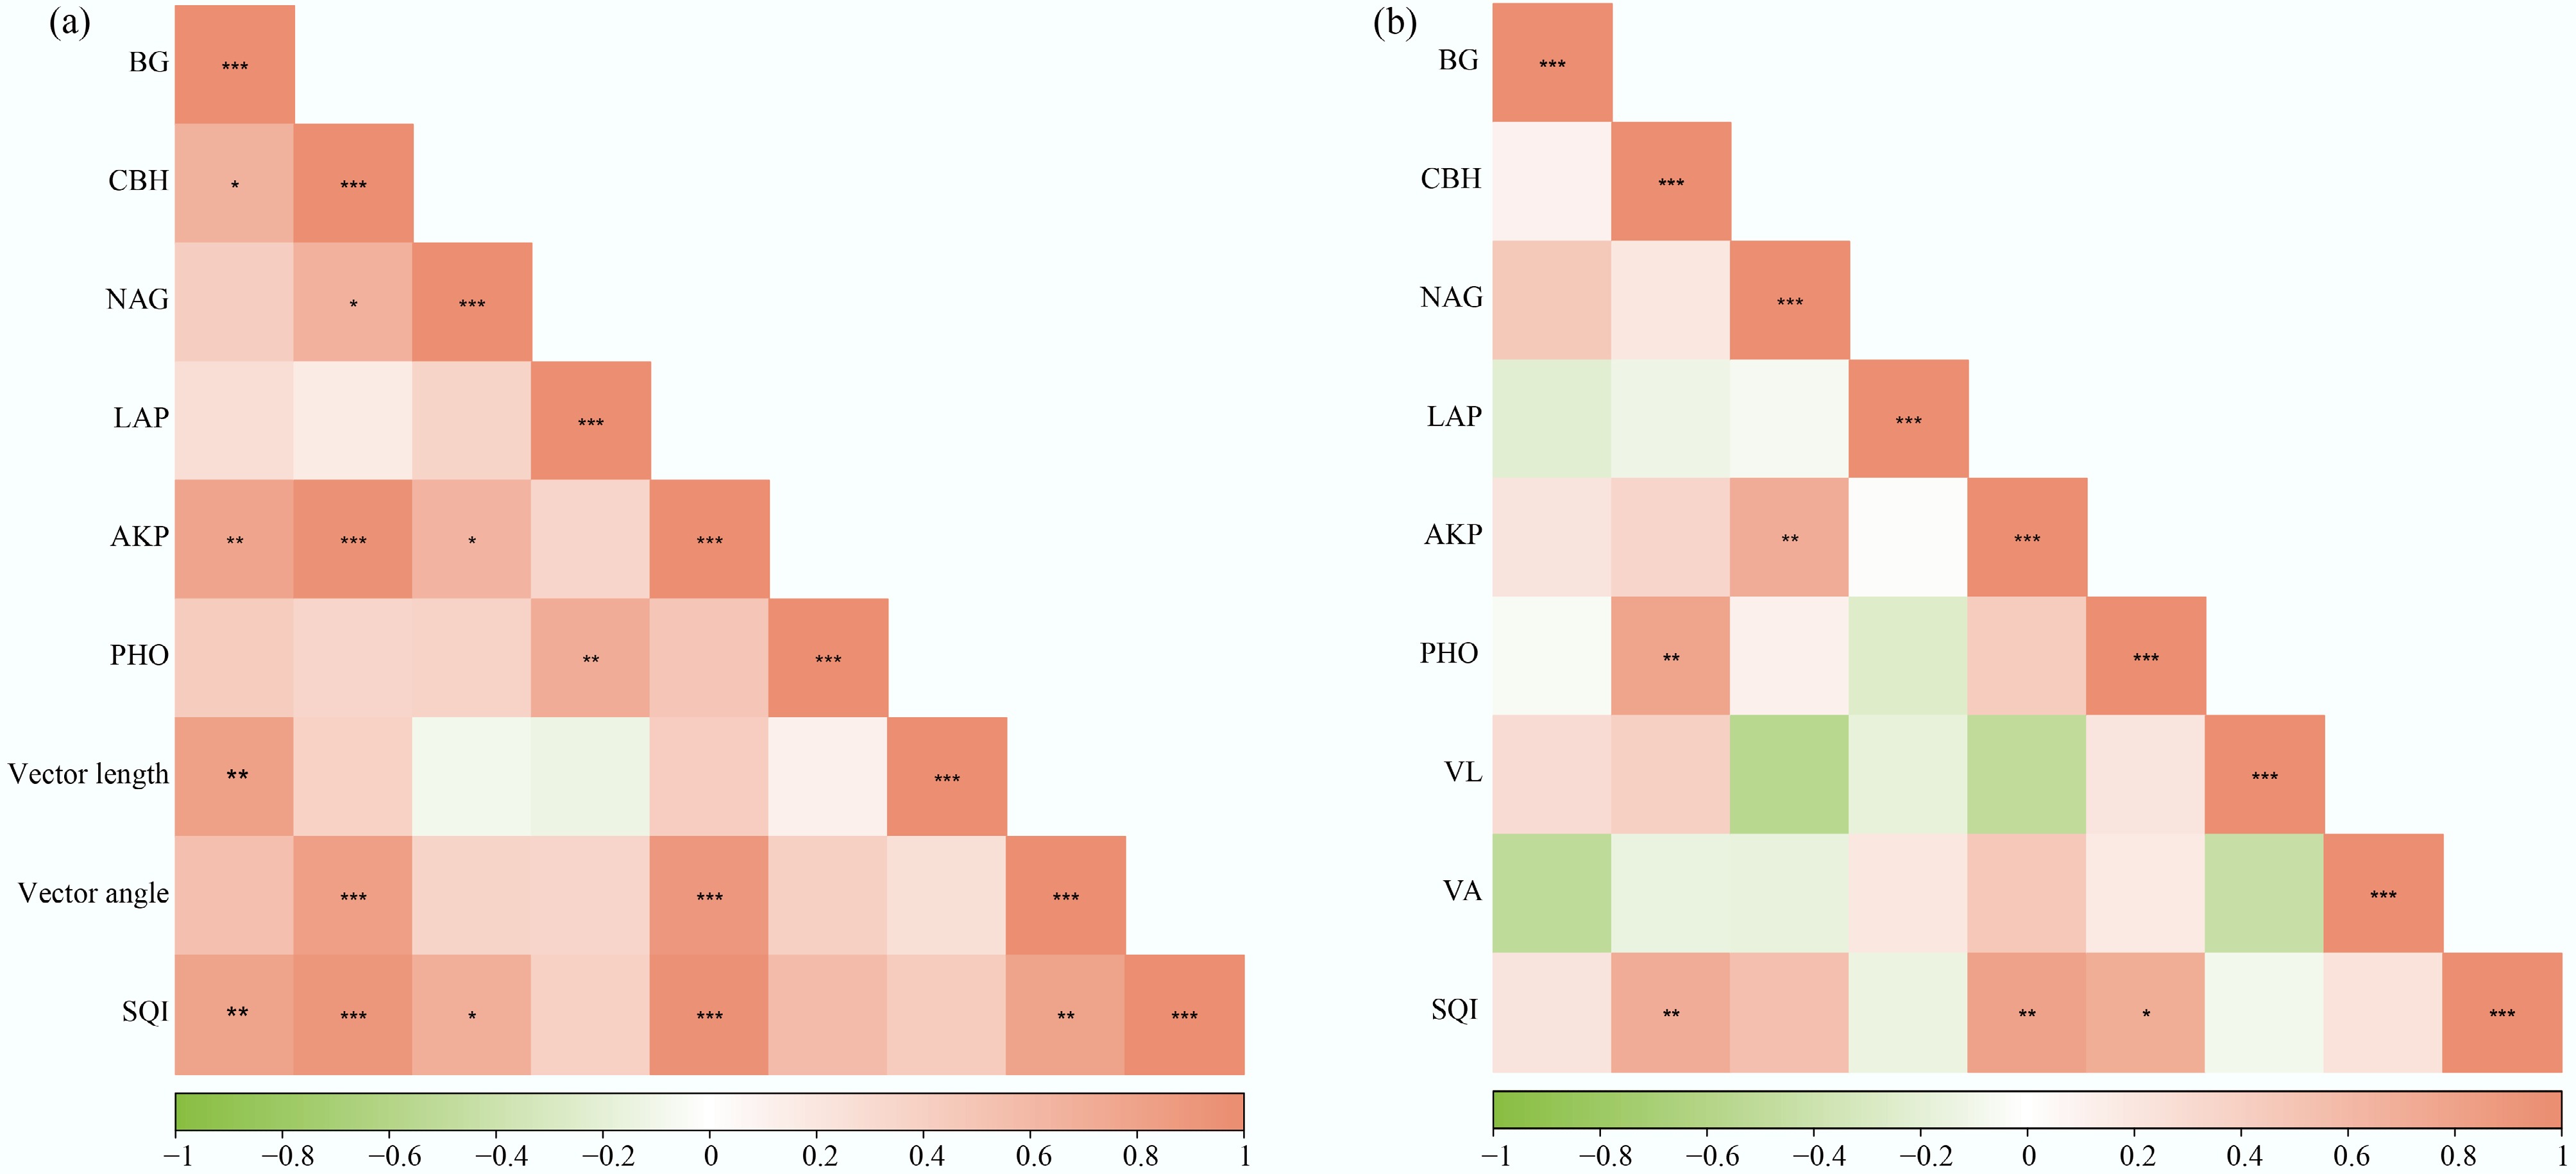
Figure 6.
Correlation analysis between soil quality index and extracellular enzyme activities in the (a) topsoil (0–20 cm), and (b) subsoil (20–40 cm). BG, β-glucosidase; CBH, cellobiosidase; NAG, β-N-acetyl-glucosaminidase; LAP, L-leucine aminopeptidase; AKP, alkaline phosphatase; PHO, phenol oxidase. *** p < 0.001; ** p < 0.01; * p < 0.05.
Figures
(6)
Tables
(0)