-
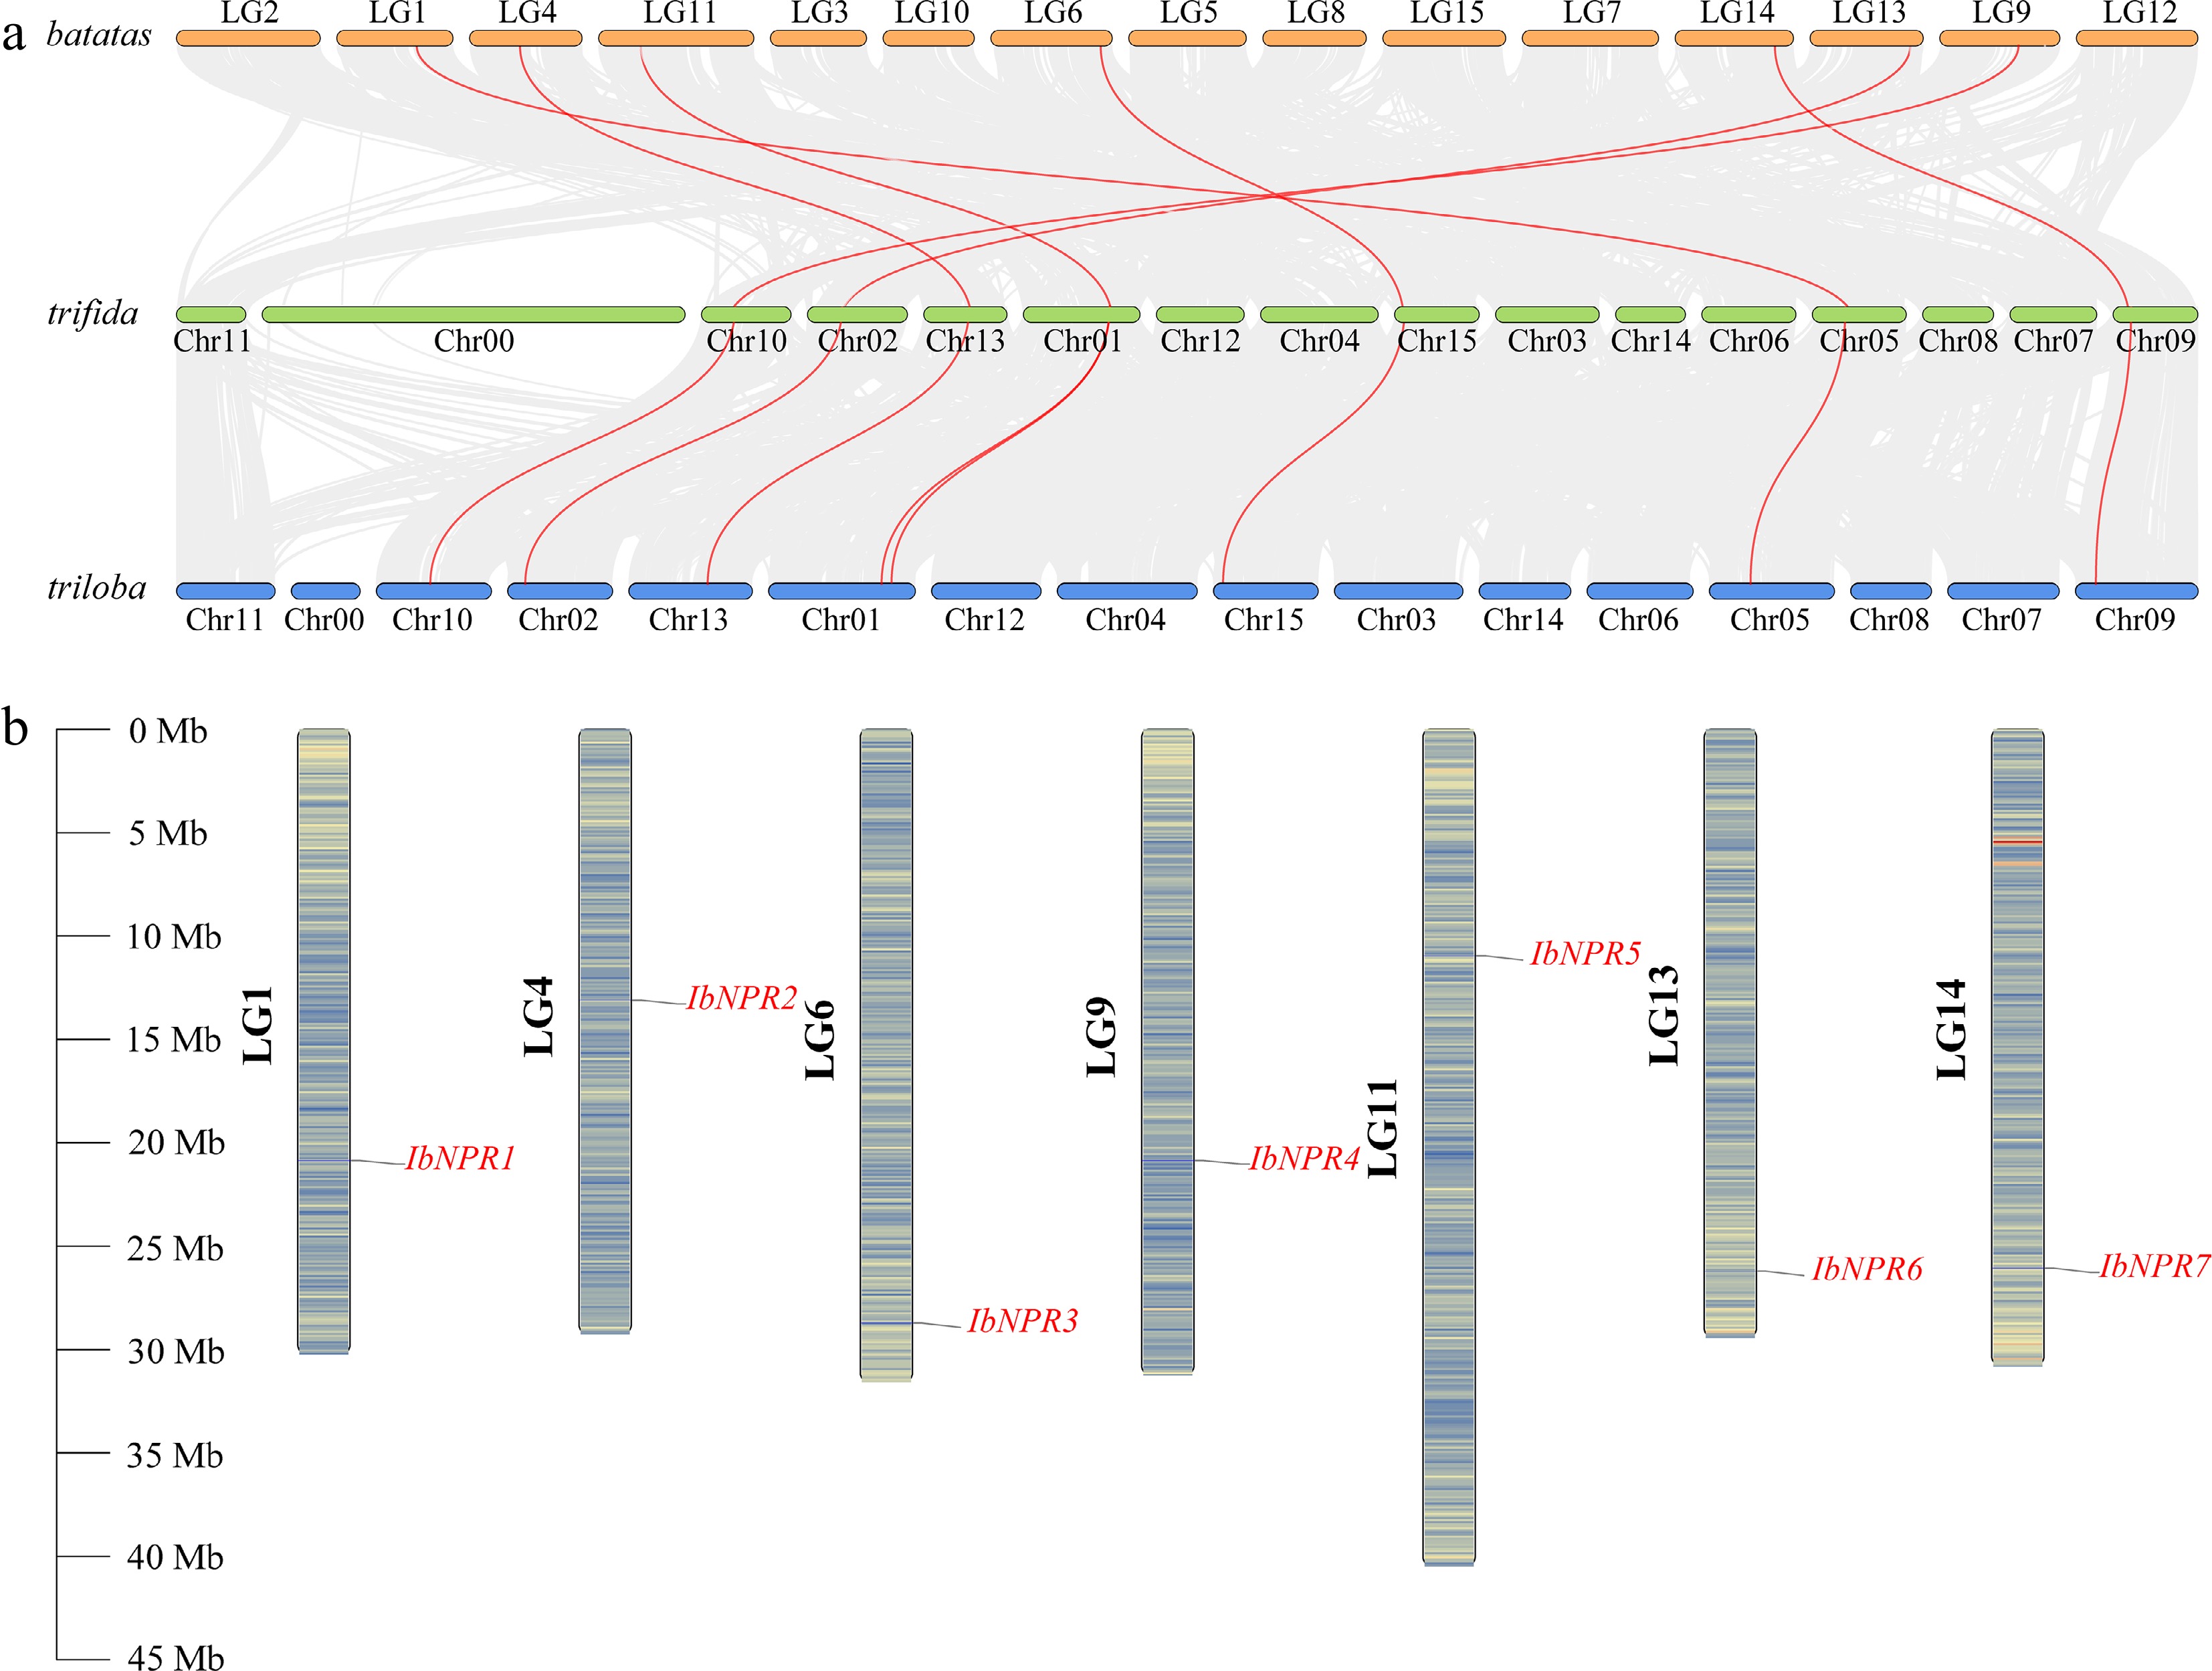
Figure 1.
Chromosomal localization and syntenic relationships of NPRs. (a) Syntenic analysis of NPRs in I. batatas, I. trifida, and I. triloba. Chromosomes of I. batatas, I. trifida, and I. triloba are shown in different colors. Red curves denote the syntenic relationships among I. batatas, I. trifida, and I. triloba NPRs. (b) Chromosomal localization and distribution of NPRs in I. batatas. The chromosome numbers are displayed on the left side, and the gene names are displayed on the right side. The relative chromosomal localization of each NPR gene is marked on the black line of the right side and indicated in units of Mbp. The stripes on chromosomes represent the density of chromosomes.
-
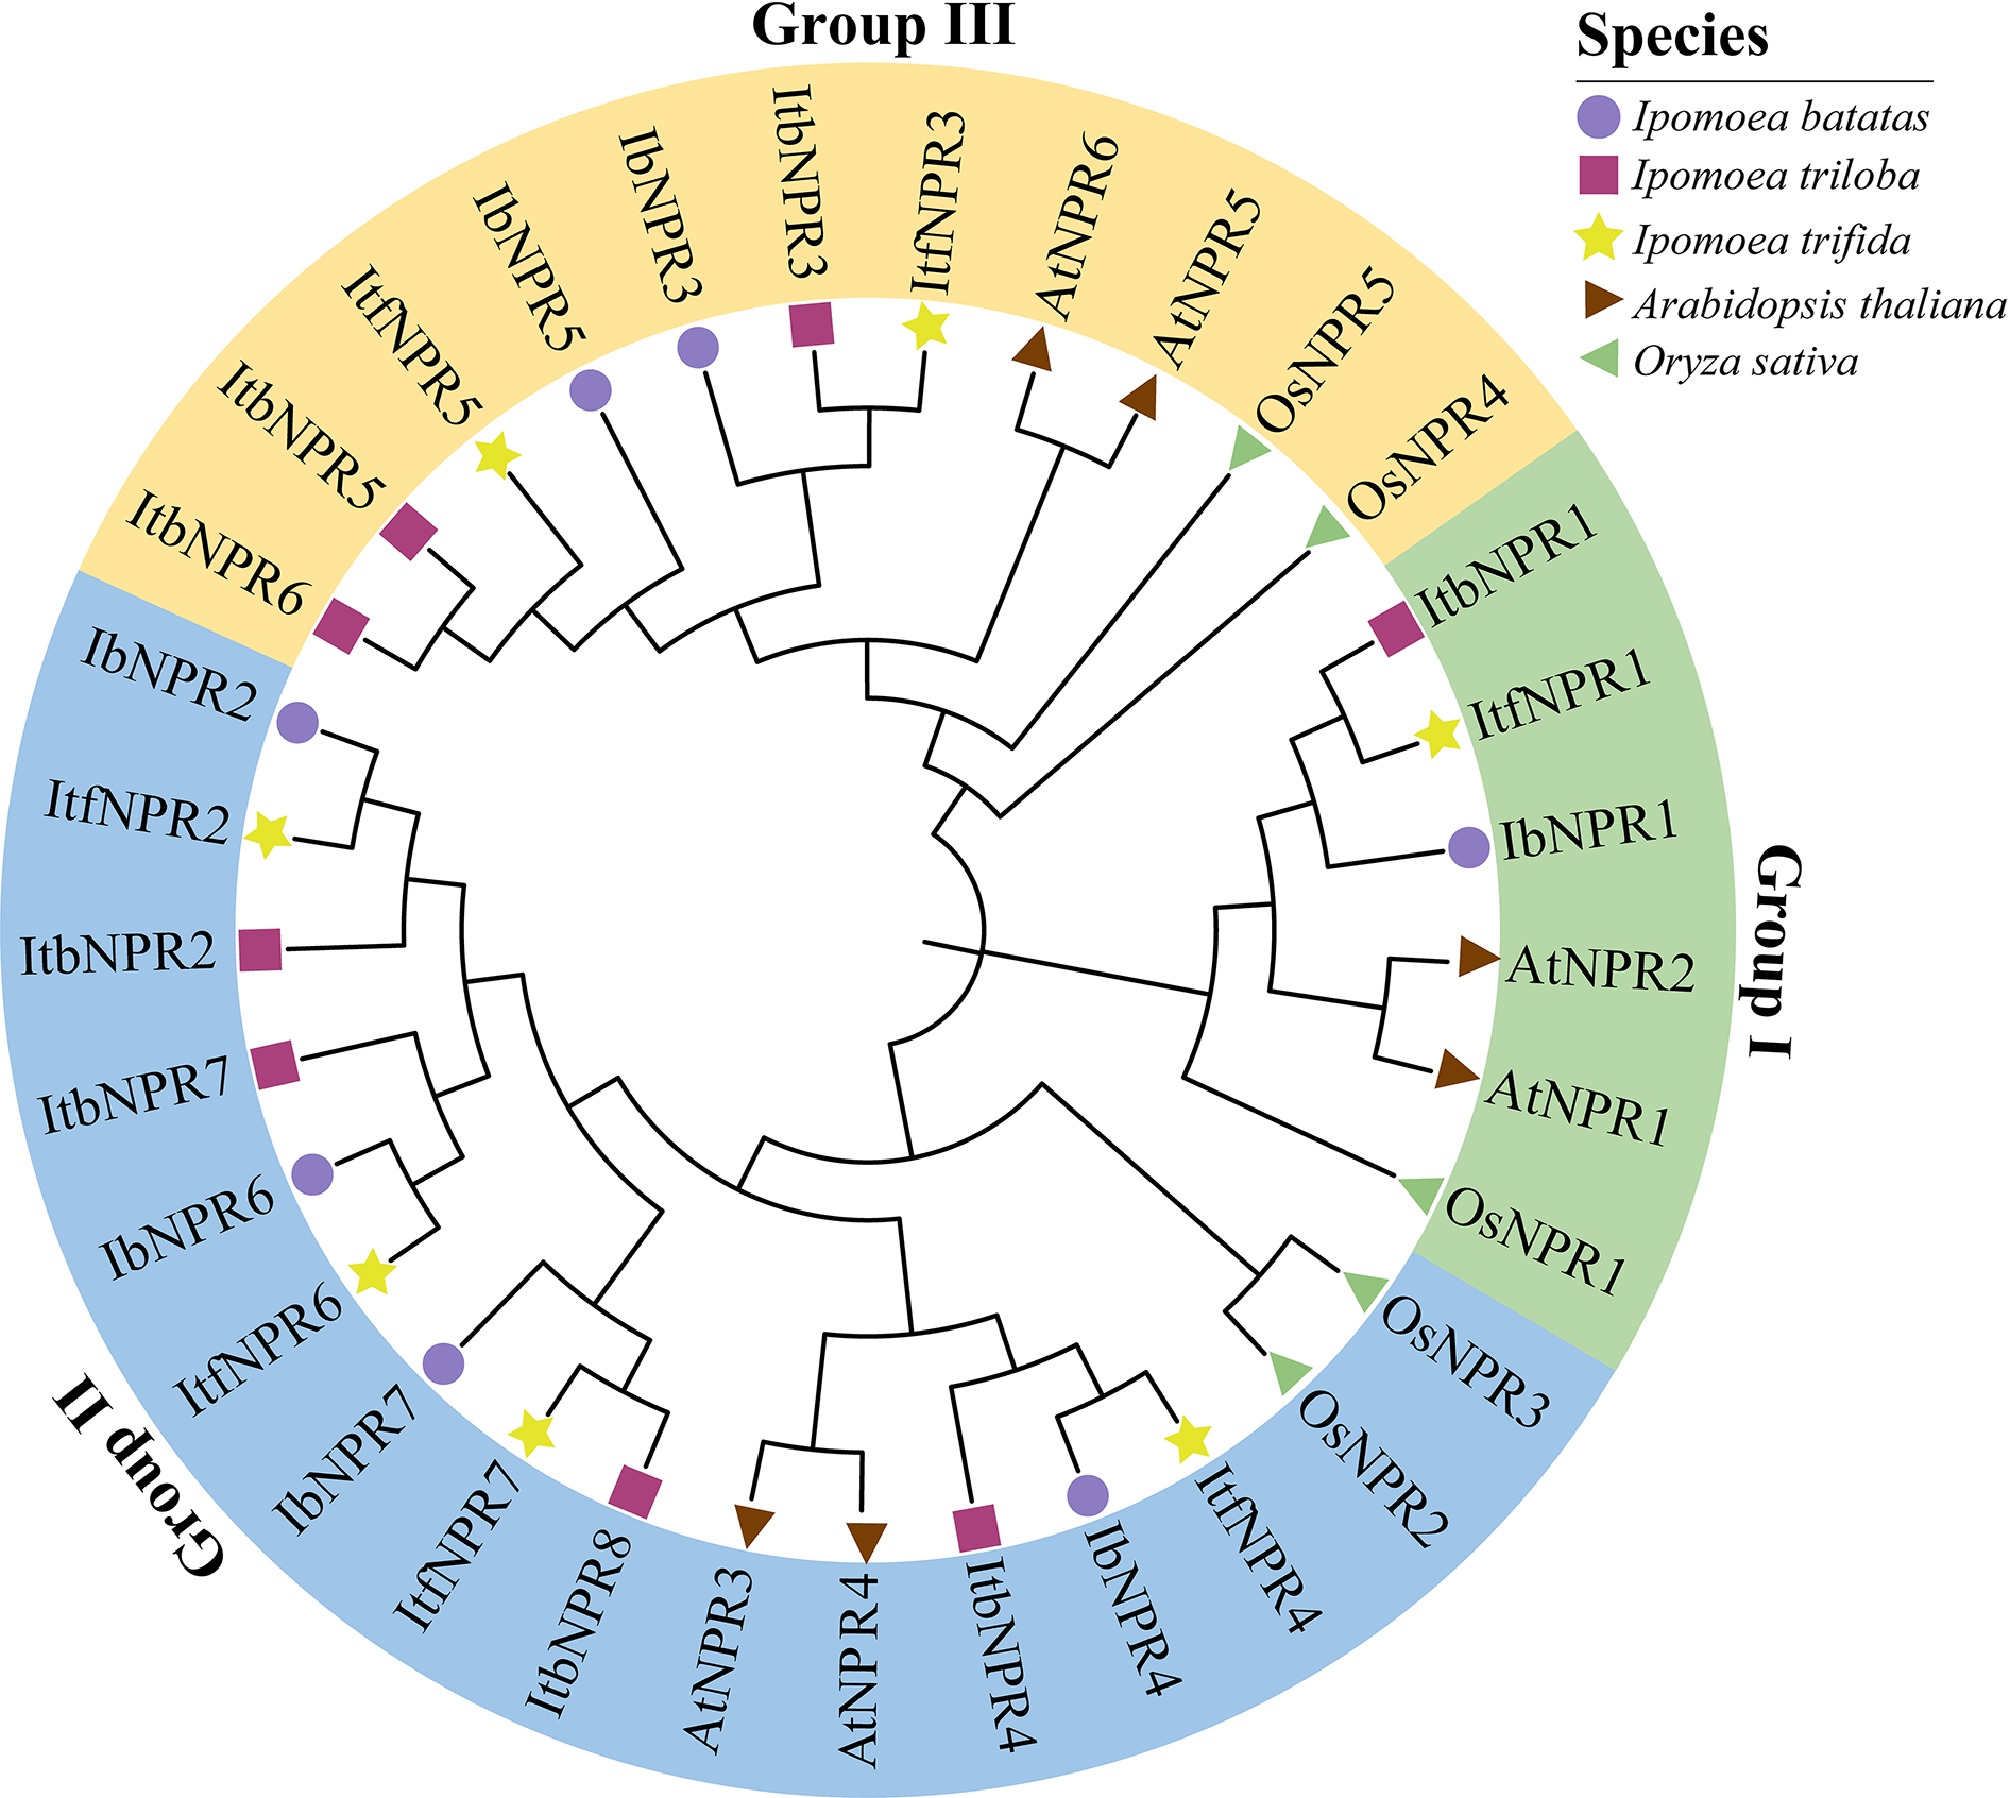
Figure 2.
Phylogenetic analysis of NPRs. Phylogenetic analysis of NPRs in I. batatas, I. triloba, I. trifida, A. thaliana, and O. sativa. According to the neighbor-joining method with 1,000 bootstrap replicates and the function of AtNPRs, the total of 33 NPRs were divided into three groups (Groups I, II, and III, filled with green, blue and yellow, respectively). The purple circles represent seven IbNPRs in I. batatas. The claret squares represent seven ItfNPRs in I. trifida. The yellow stars represent eight ItbNPRs in I. triloba. The brown triangles represent six AtNPRs in A. thaliana. The green triangles represent five OsNPRs in O. sativa.
-
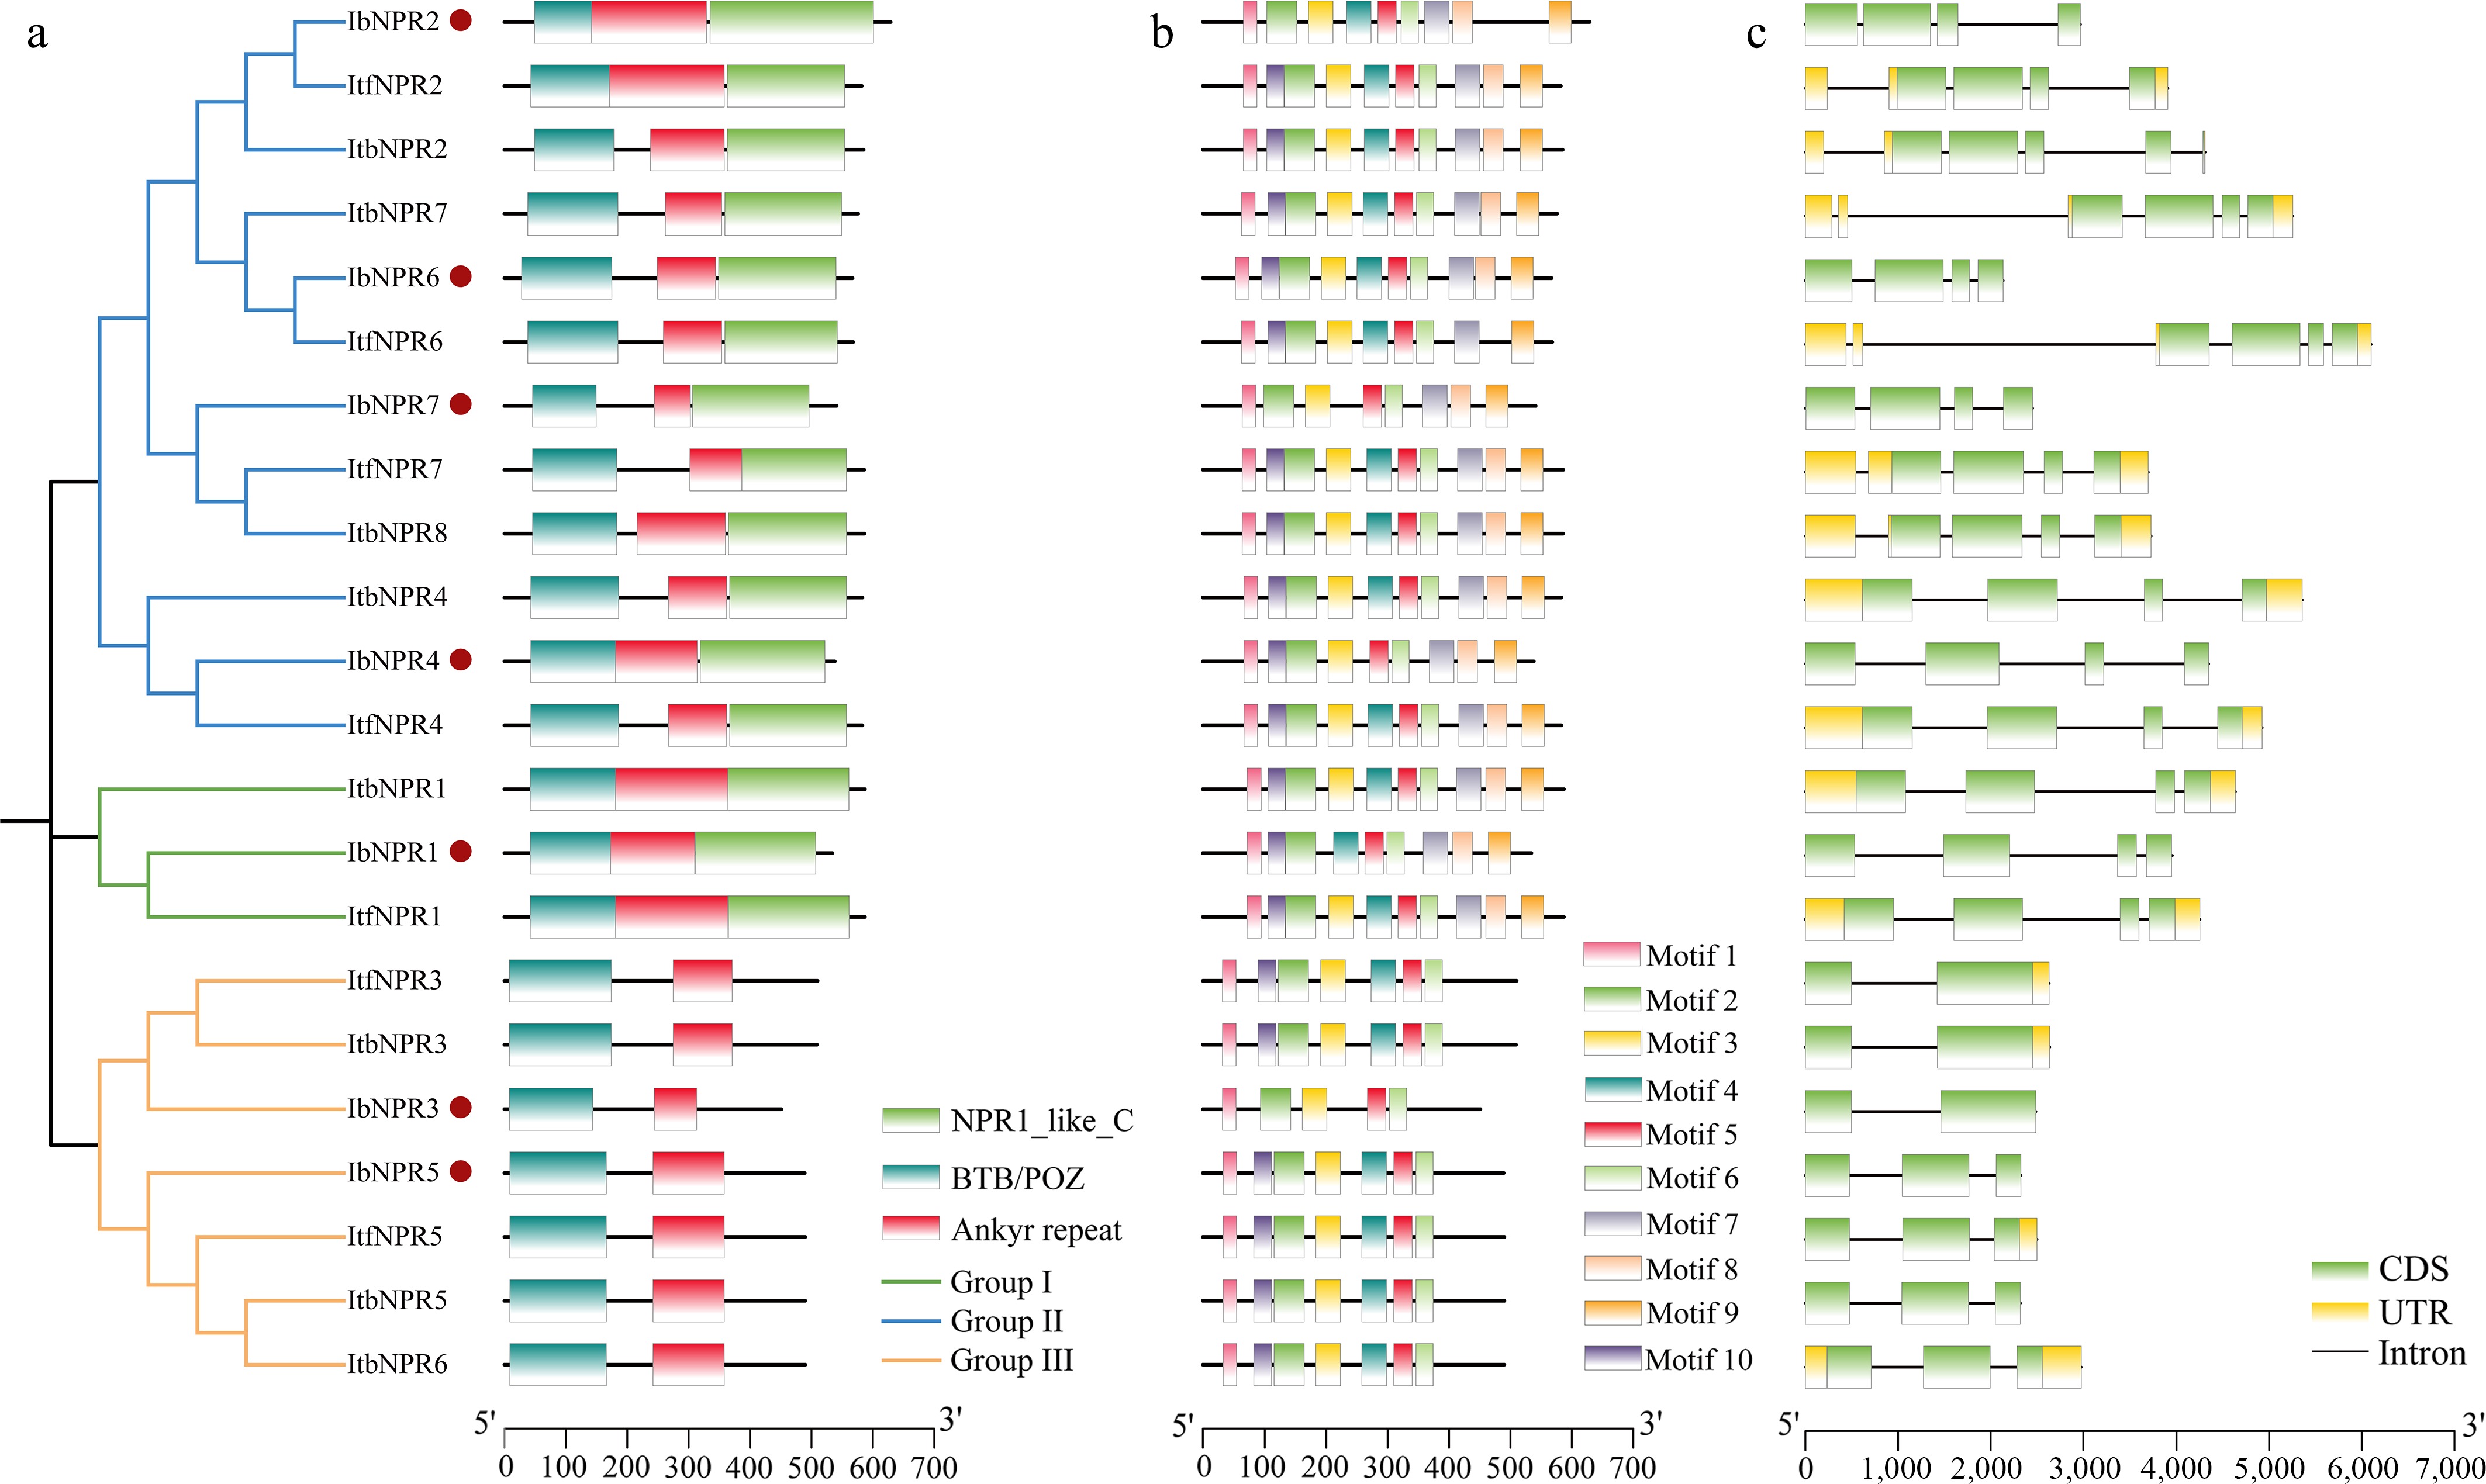
Figure 3.
Conserved motifs and exon–intron structure analysis of NPRs in I. batatas, I. trifida, and I. triloba. (a) The phylogenetic tree shows that NPRs are divided into three subgroups, and the three conserved structural domains are shown in different colors. The red circles represent IbNPRs. (b) Ten conserved motifs, shown in different colors. (c) Exon–intron structures of NPRs. The green boxes, yellow boxes, and black lines represent untranscribed regions (UTRs), exons and introns, respectively.
-
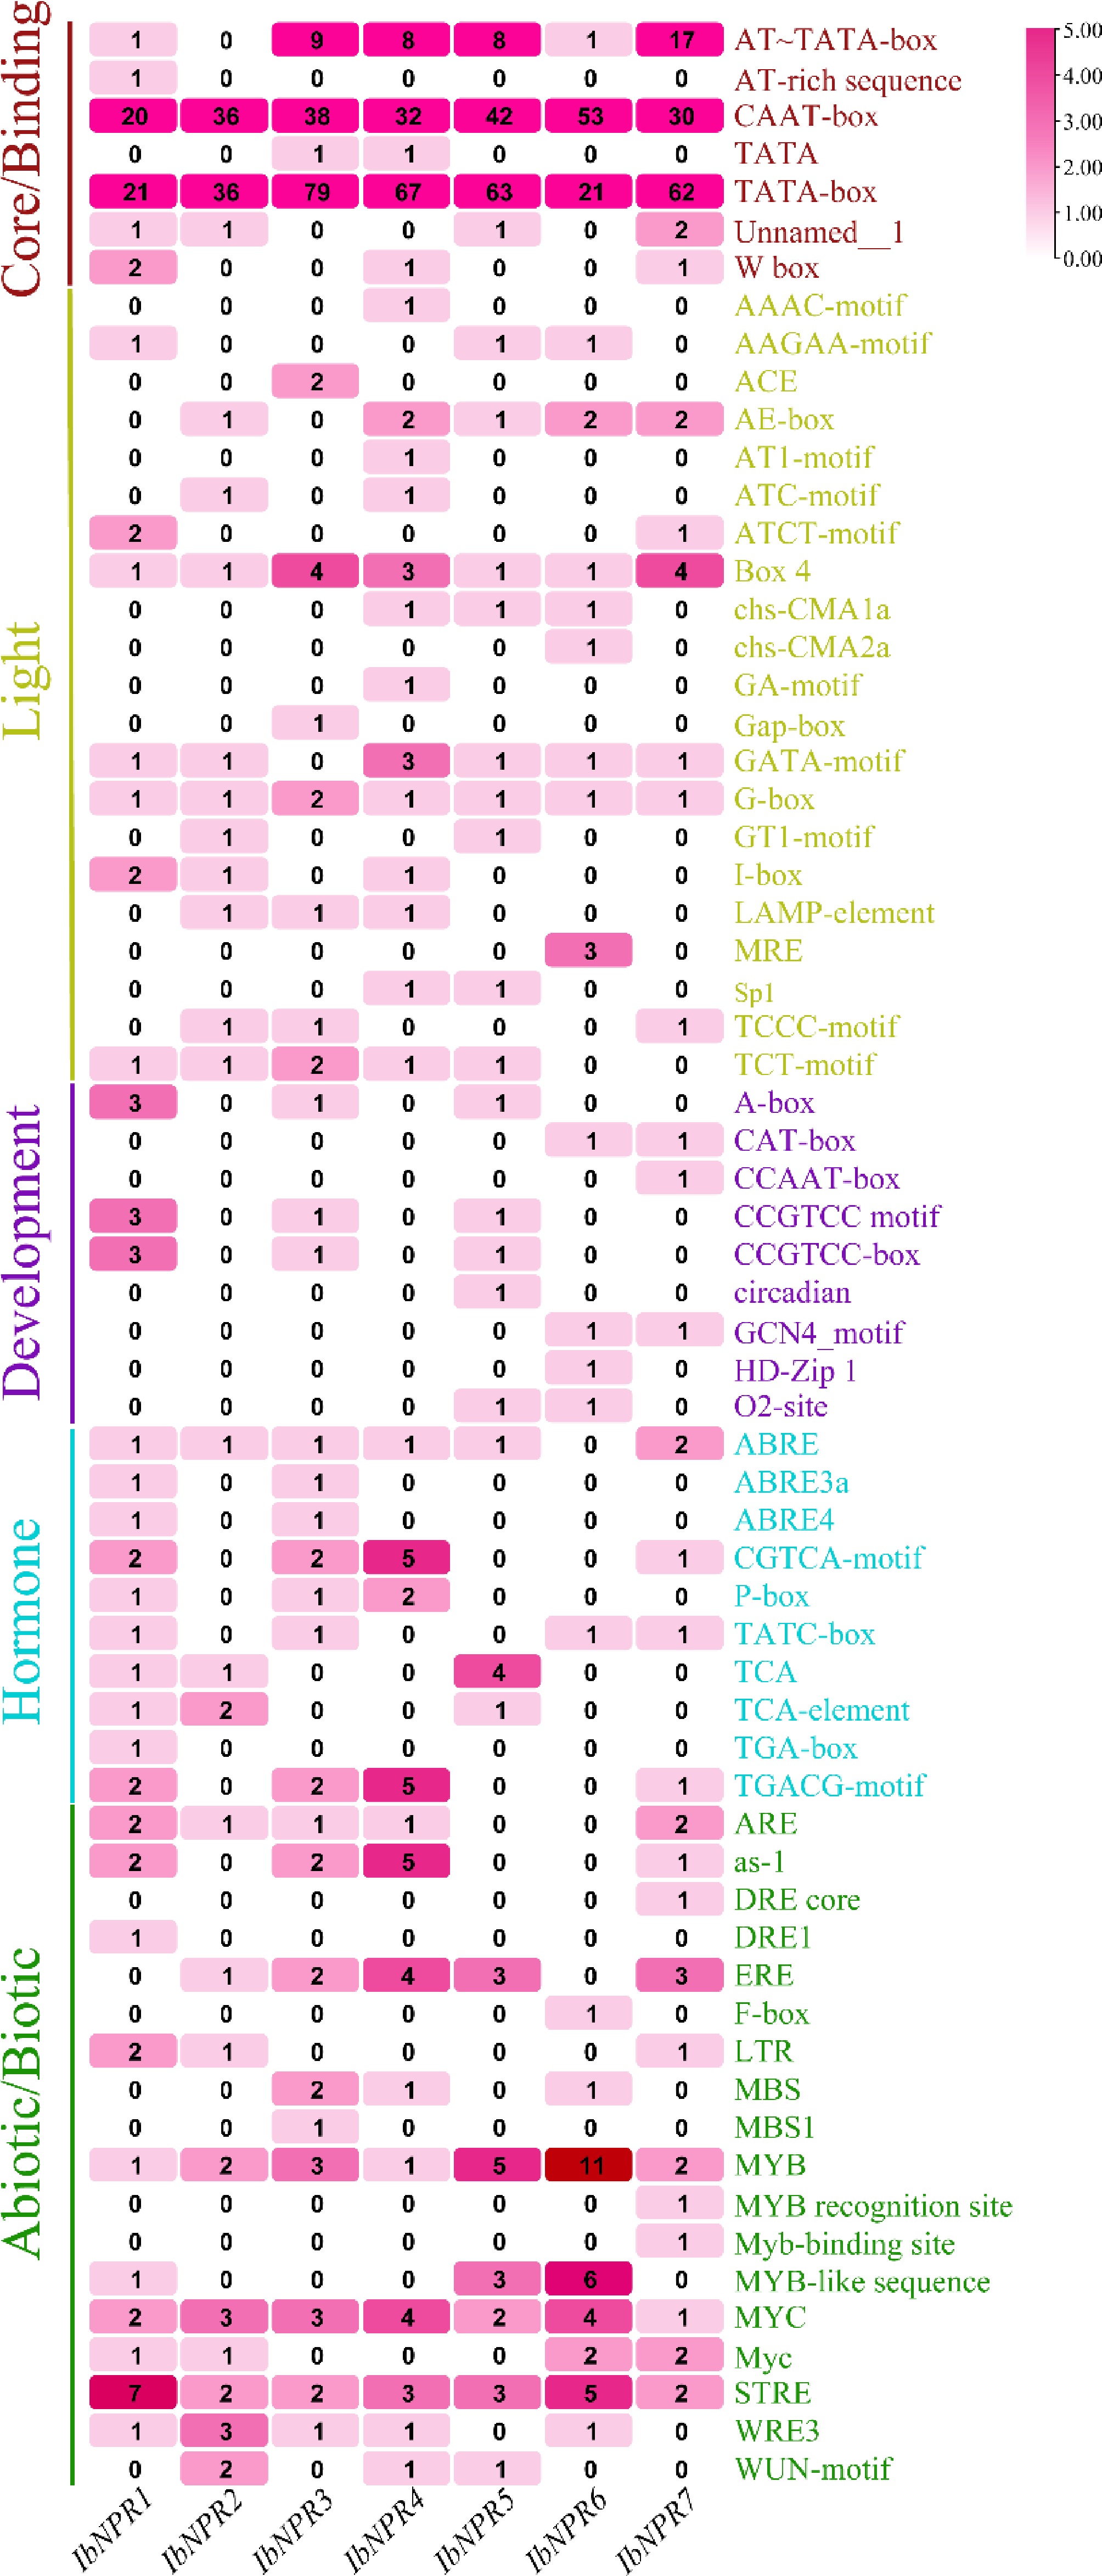
Figure 4.
Cis-element analysis in the promoters of NPRs from I. batatas. The cis-elements were divided into five broad categories. The degree of red colors represents the number of cis-elements in the promoters of NPRs.
-
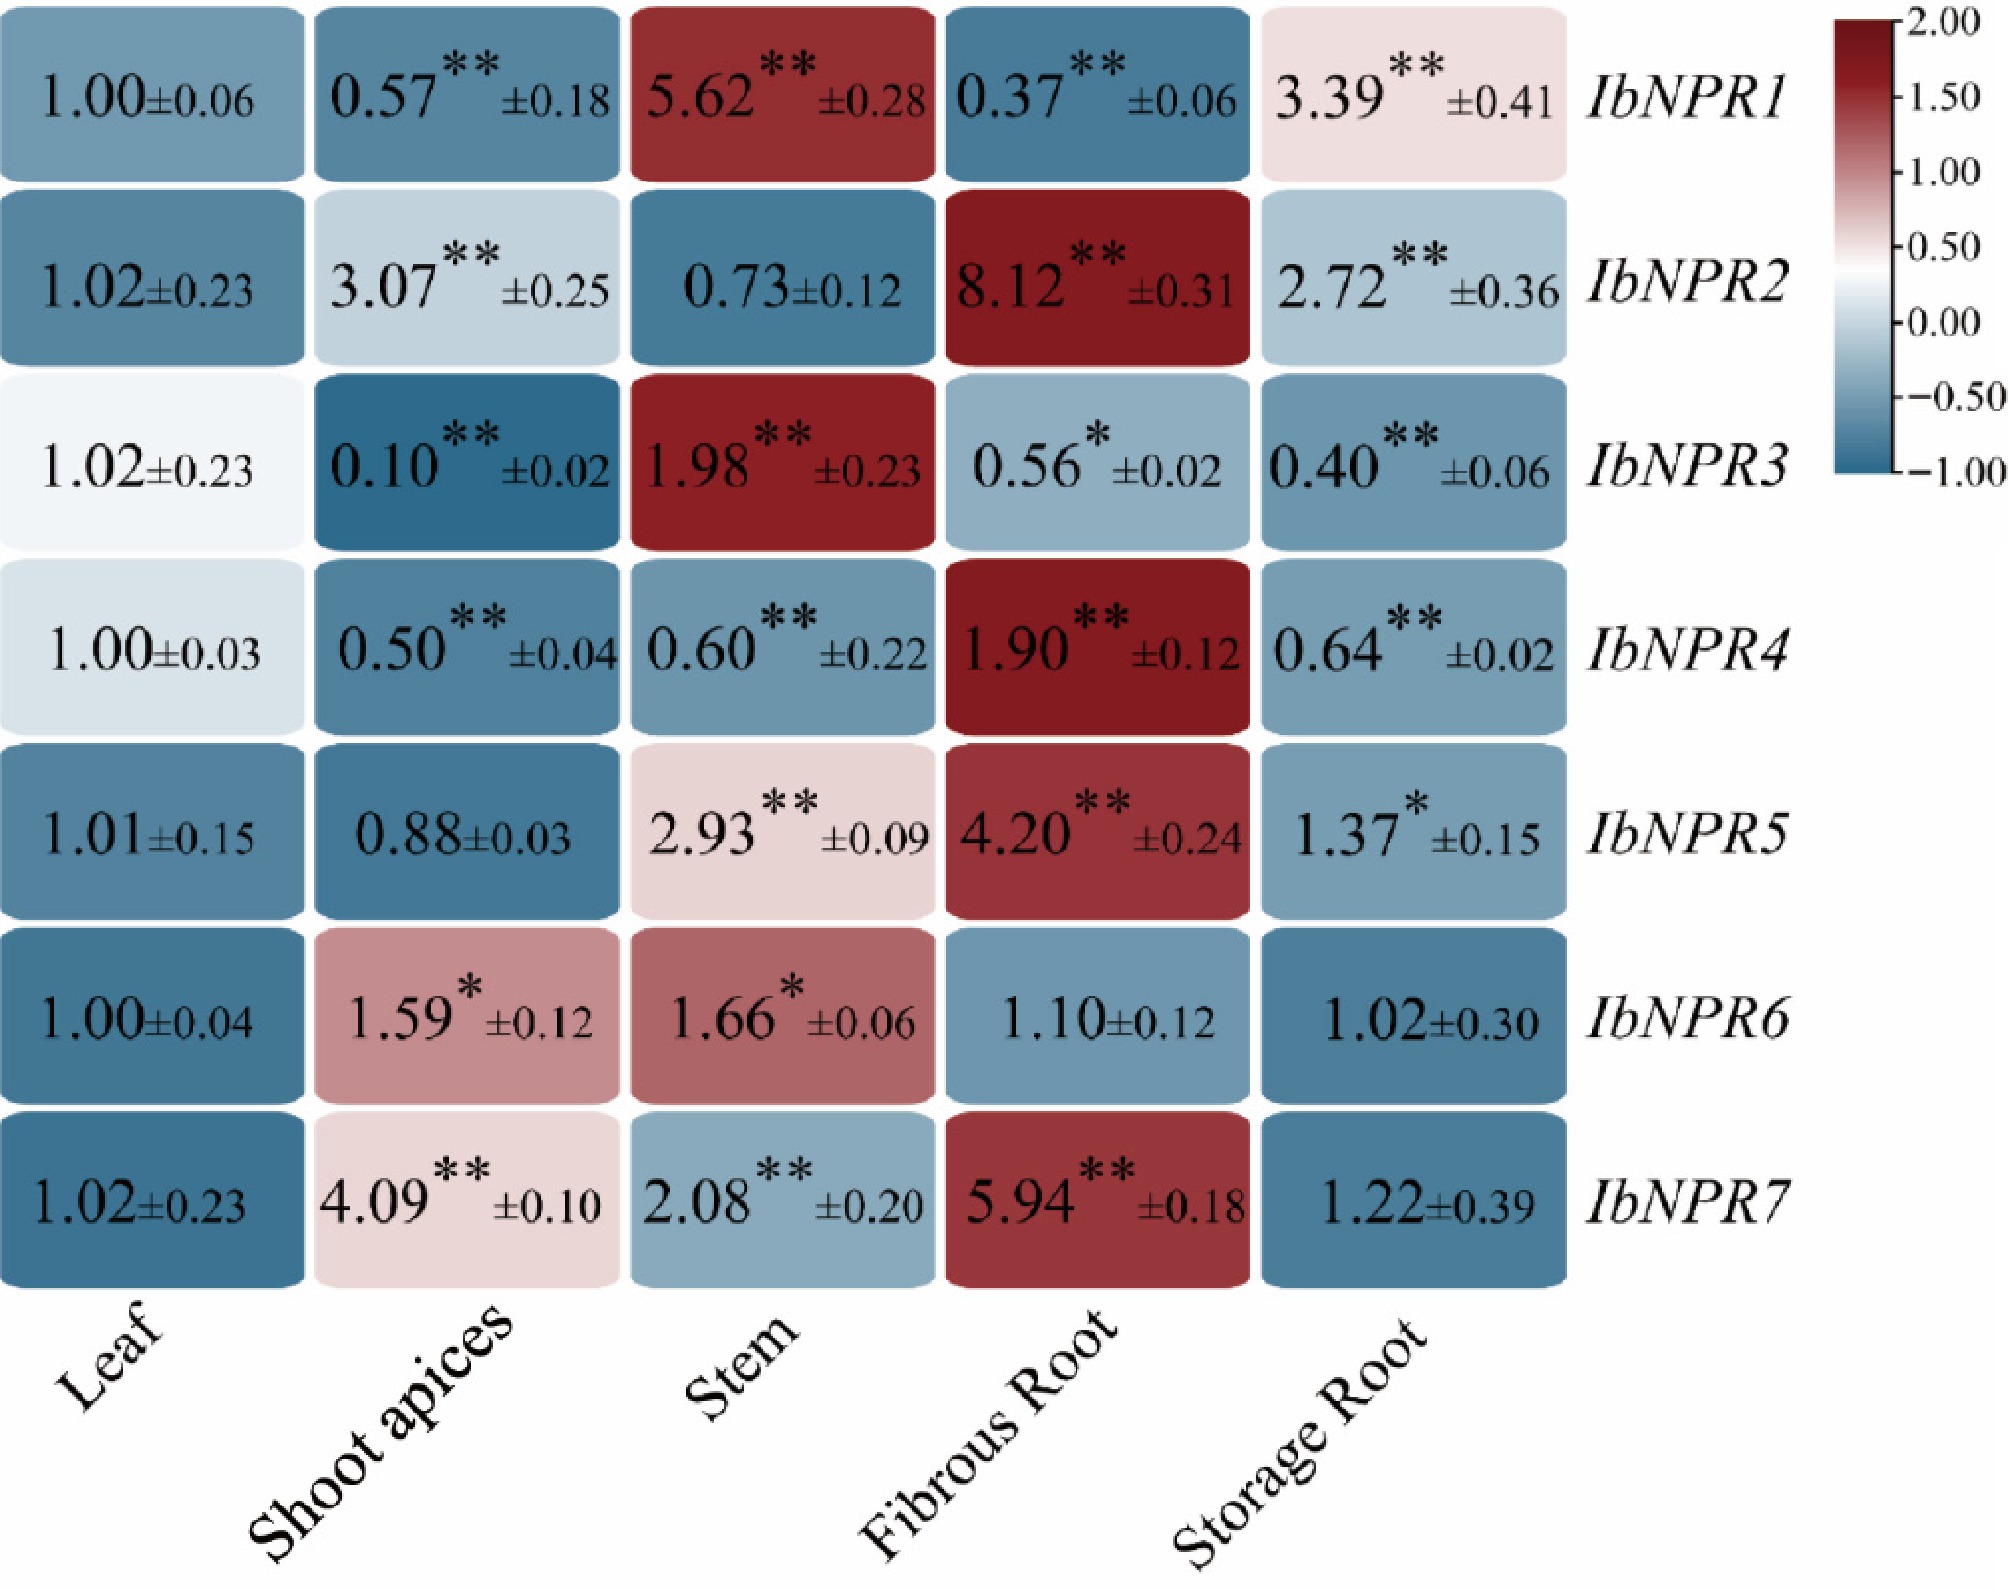
Figure 5.
Expression analysis of NPRs in different tissues of I. batatas. Expression analysis of IbNPRs in the leaves, shoot apices, stems, fibrous roots, and storage roots of I. batatas. The values were determined by qRT-PCR from three biological replicates consisting of pools of three plants, and the results were analyzed using the comparative CT method. The expression level of leaves is set as '1'. Fold change ± SD is shown in the boxes. Asterisks (**) and (*) indicate significant differences at p < 0.01 and p < 0.05, respectively, based on Student's t-test compared with leaves.
-
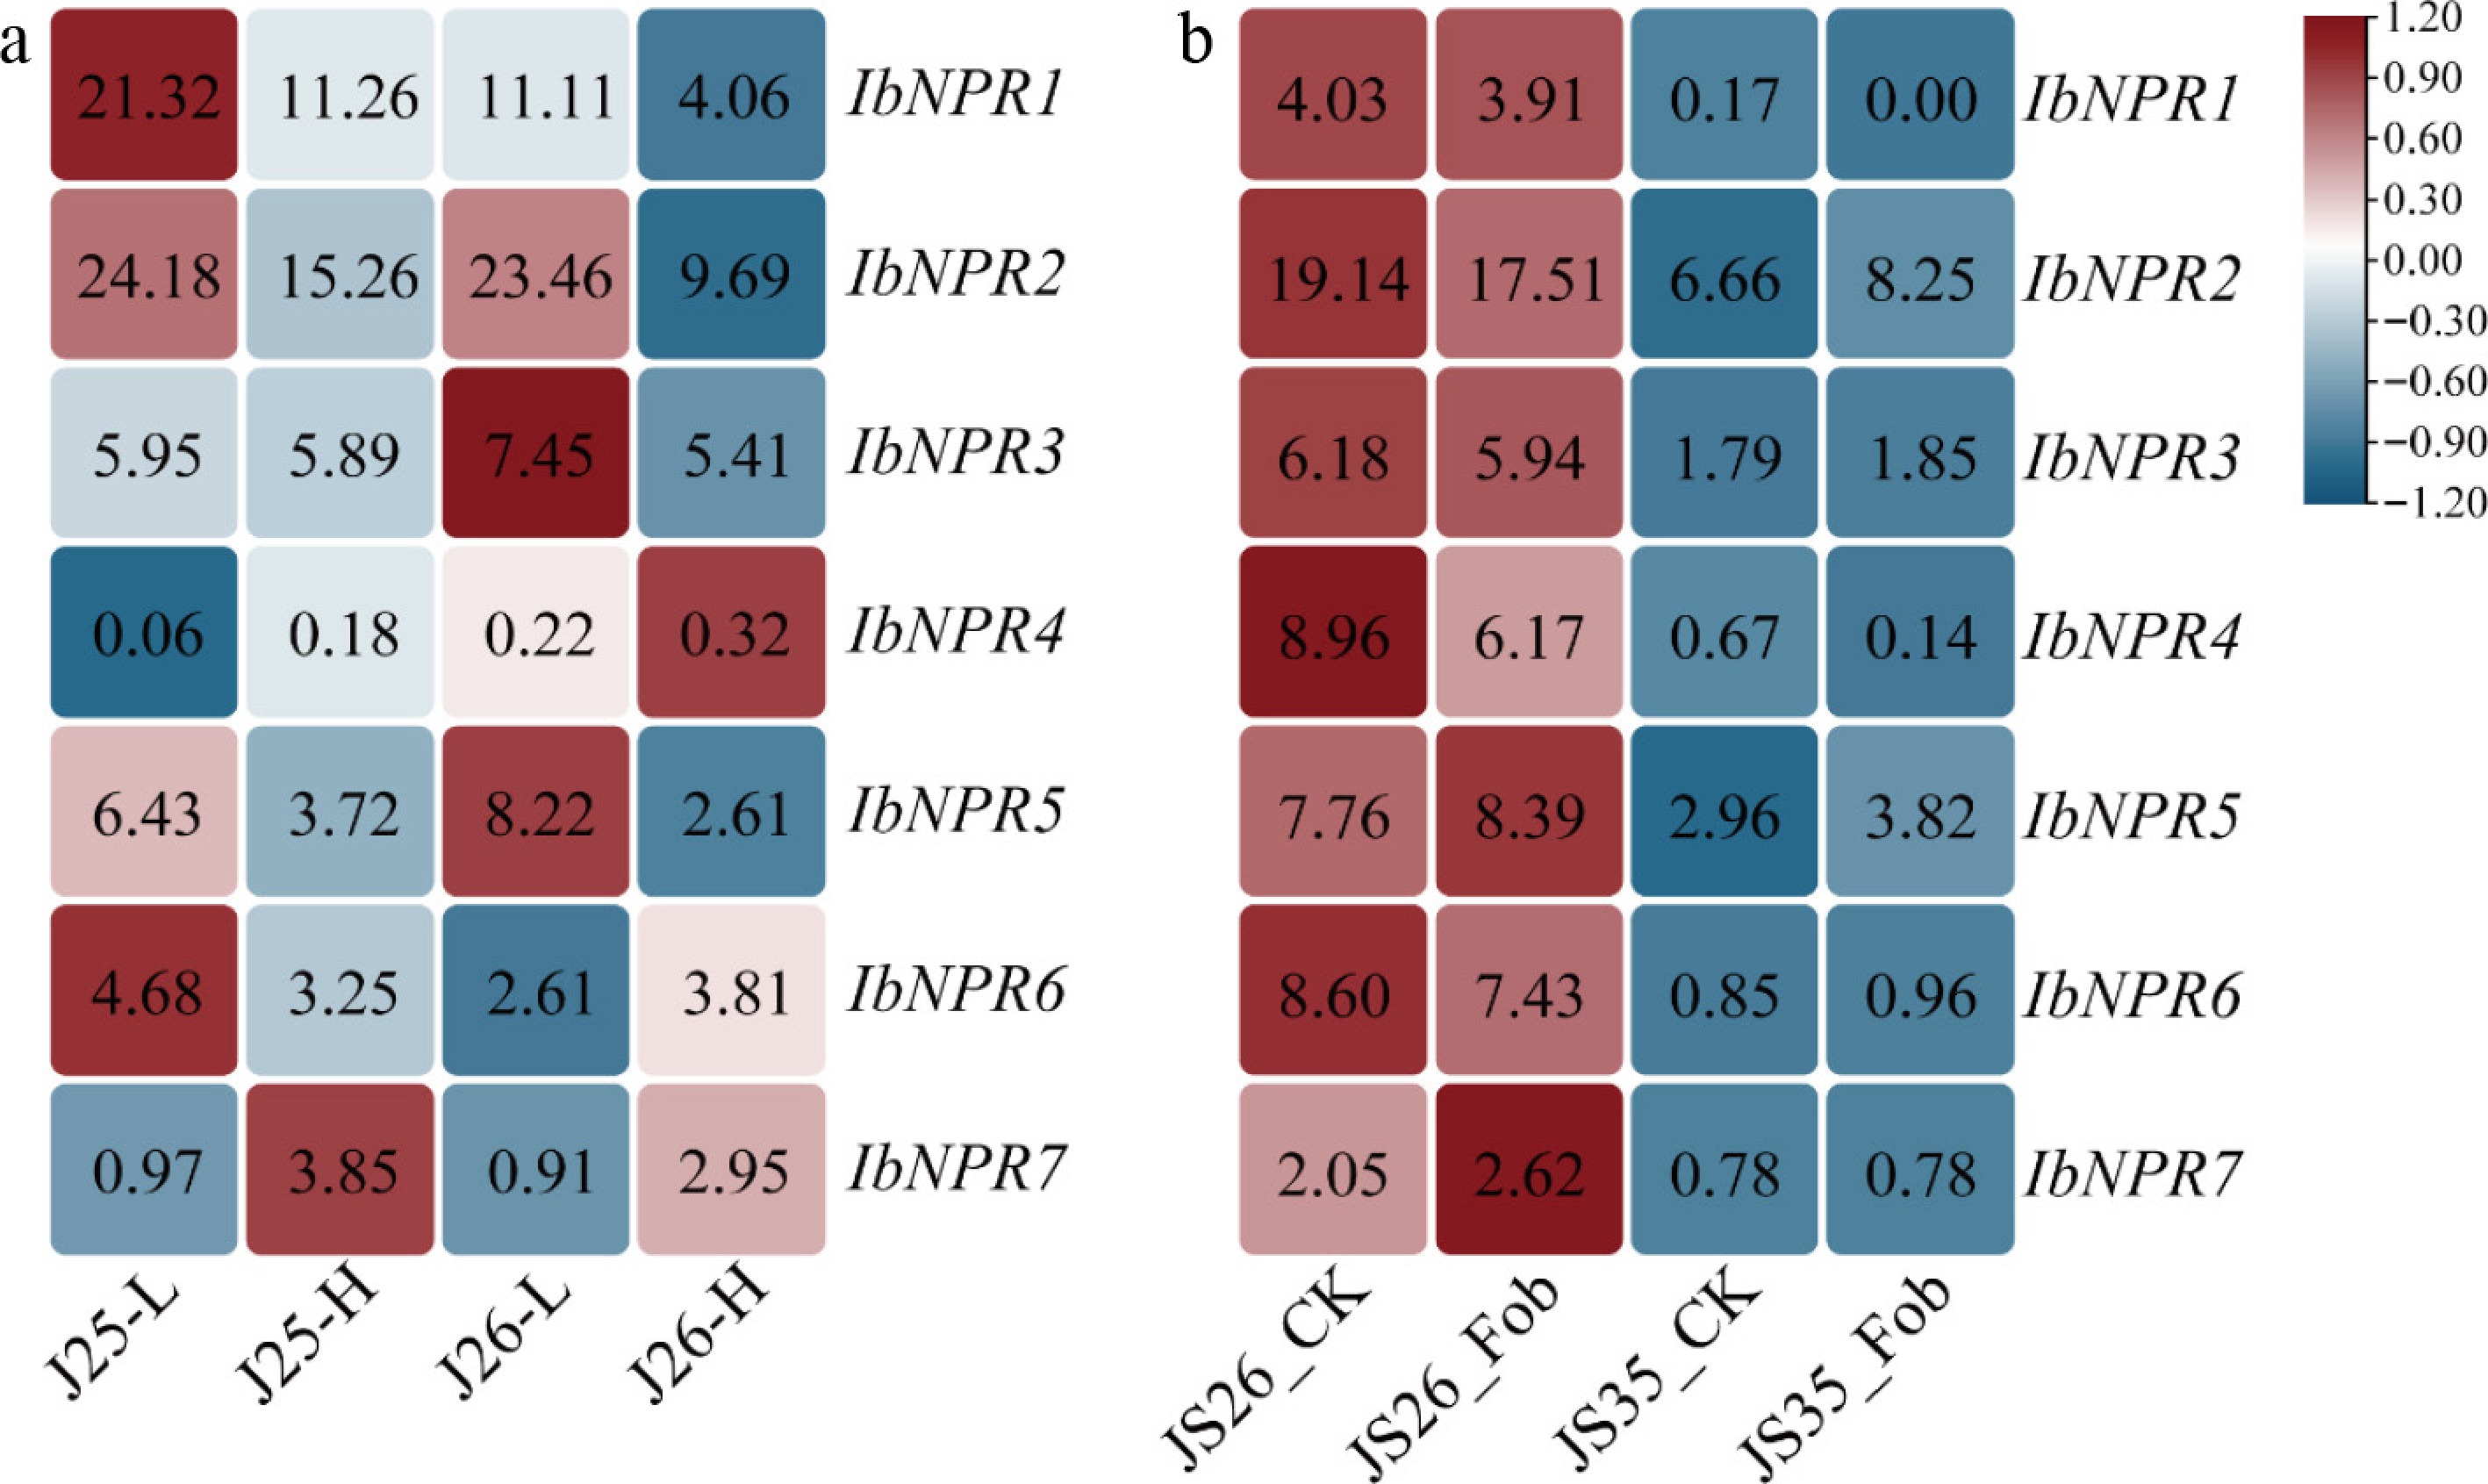
Figure 6.
Expression analysis of IbNPRs under biotic stresses. (a) Expression analysis of IbNPRs at different degrees of viral infection in 'Jishu 25' (J25) and 'Jishu 26' (J26) storage roots (L, low degrees of virus infection; H, high degrees of virus infection). The fragments per kilobase per million mapped reads (FPKM) values are shown in the boxes. (b) Expression analysis of IbNPRs with inoculation with Fob (F. oxysporum) in the disease-resistant variety 'Jishu 26' (JS26) and the disease-susceptible variety 'Jishu 35' (JS35). The FPKM values are shown in the boxes.
-
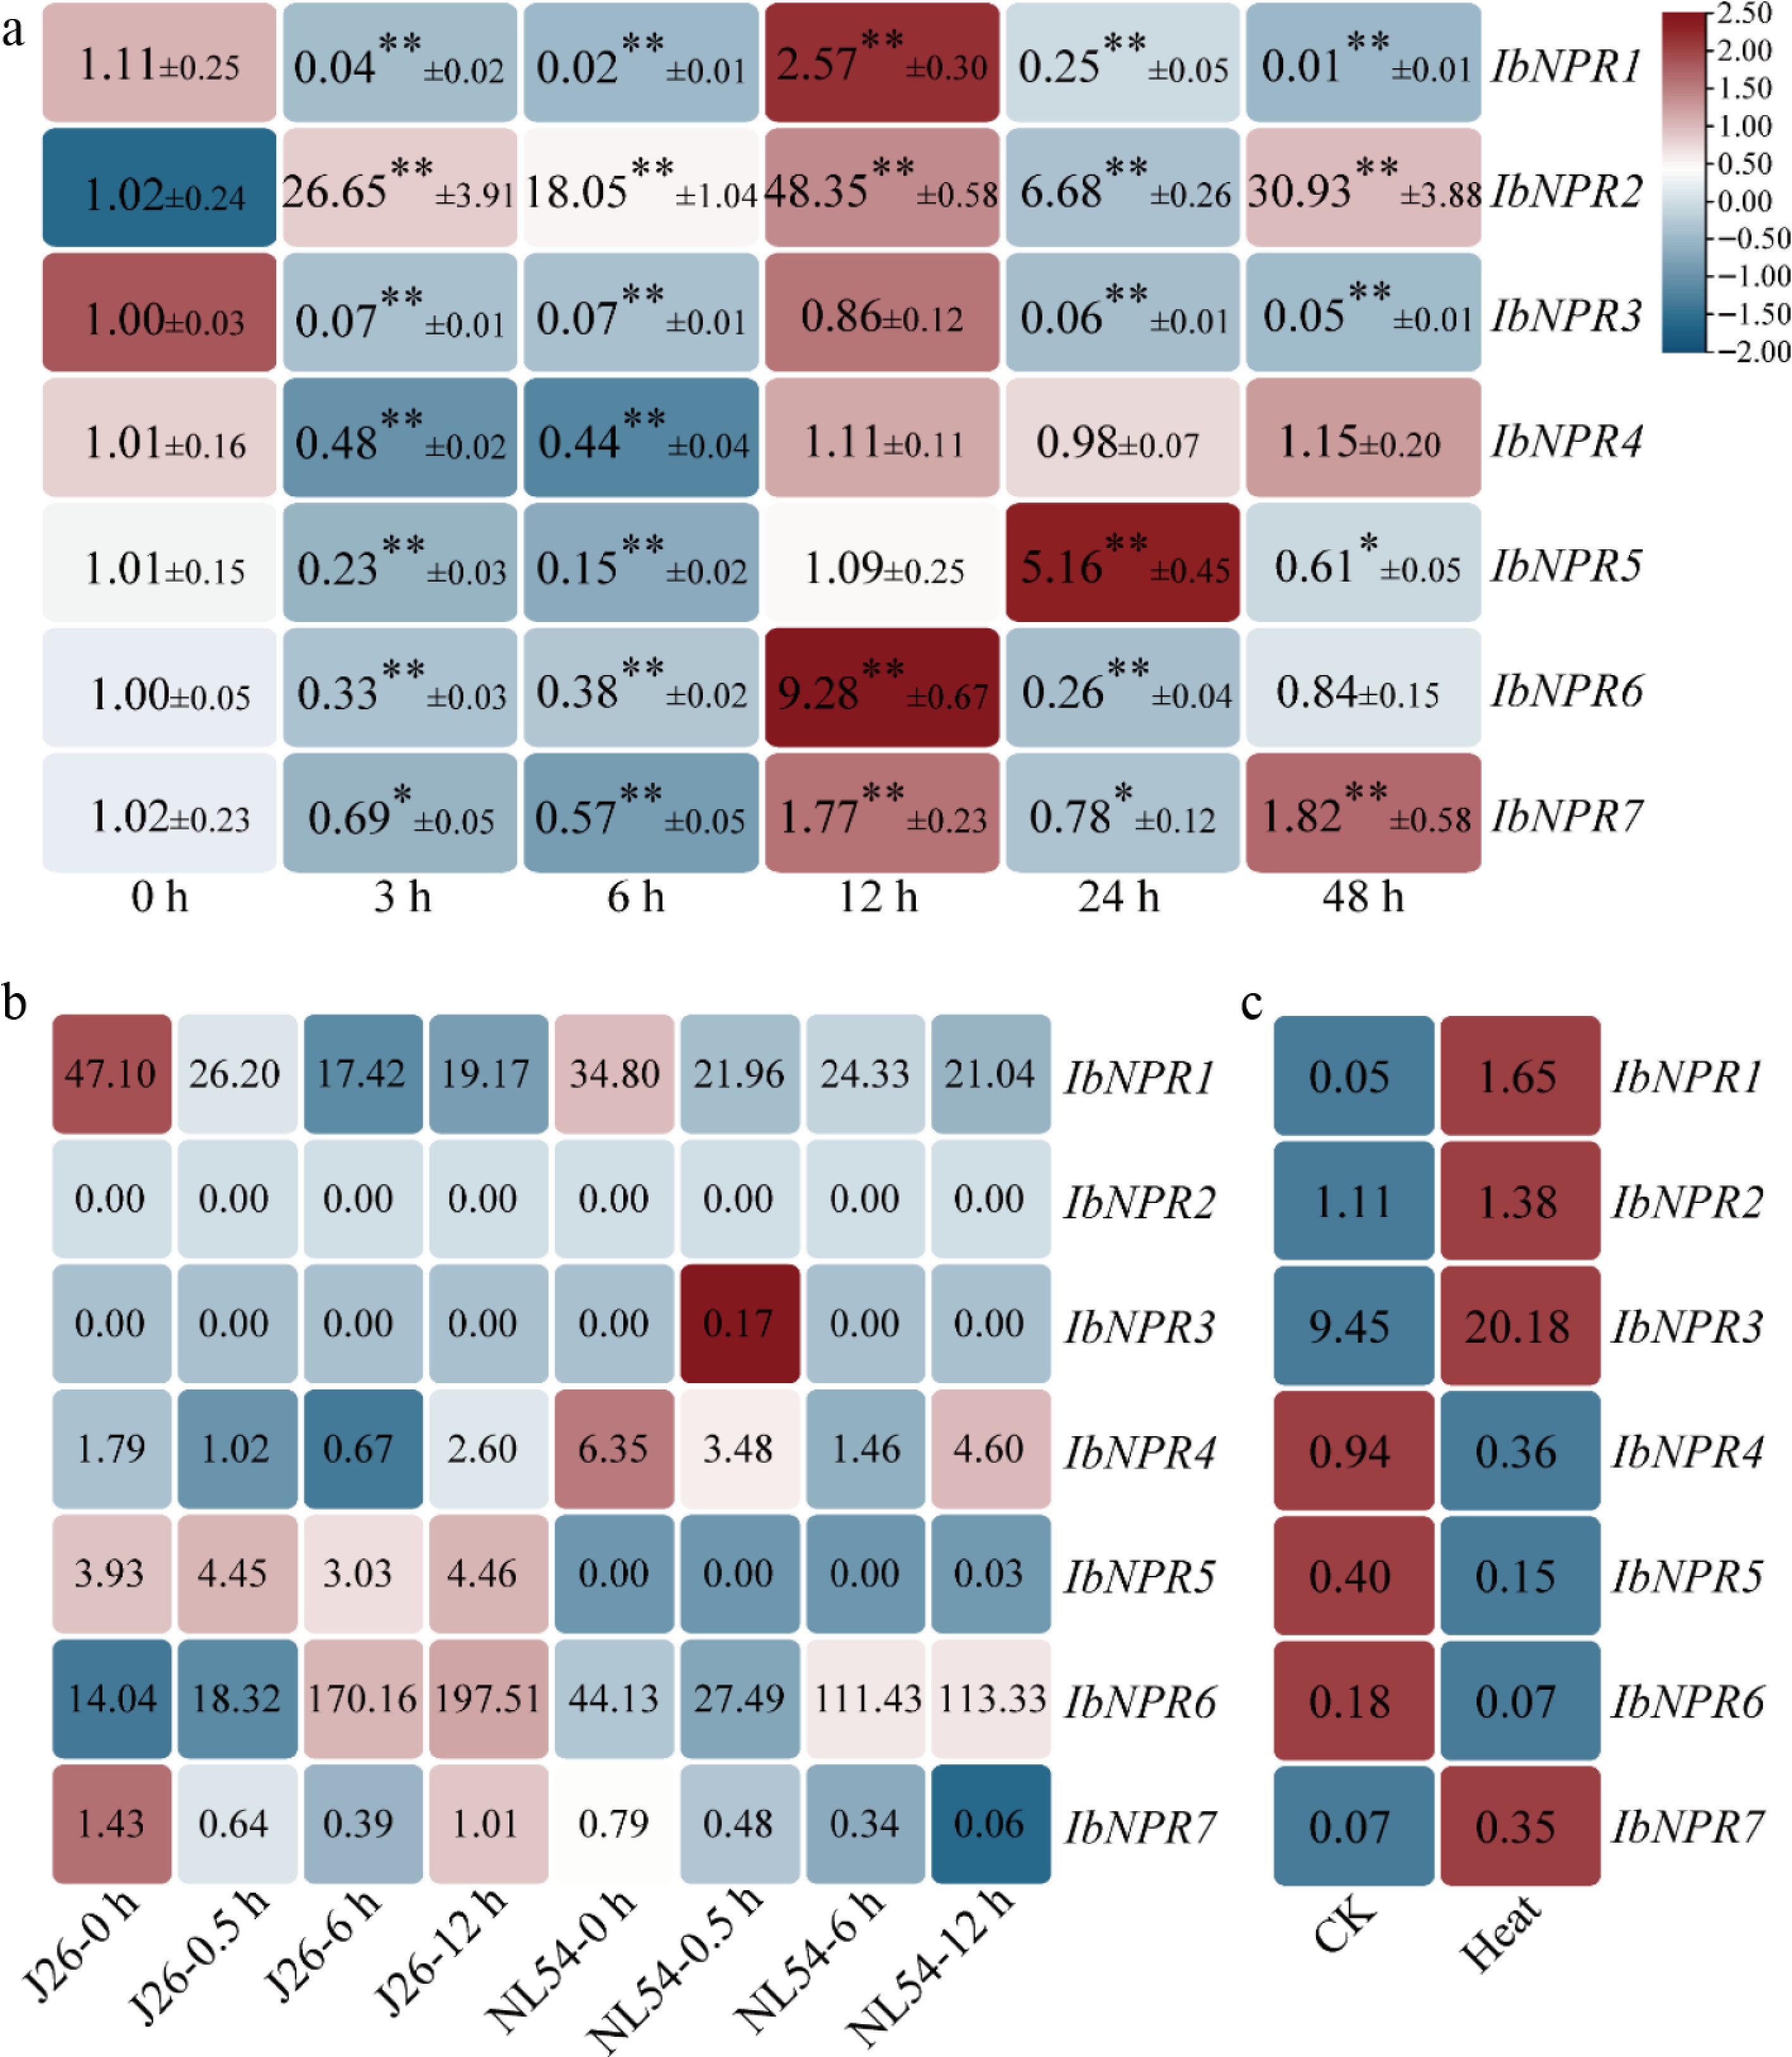
Figure 7.
Expression analysis of IbNPRs under drought, salt, and heat stresses. (a) Expression analysis of IbNPRs in 'Jishu 25' under PEG6000 stress. The values were determined by qRT-PCR from three biological replicates consisting of pools of three plants, and the results were analyzed using the comparative CT method. The expression level of 0 h is set as '1'. Fold change ± SD is shown in the boxes. Asterisks (**) and (*) indicate significant differences at p < 0.01 and p < 0.05, respectively, based on Student's t-test compared with 0 h. (b) Expression analysis of IbNPRs in the salt-sensitive variety 'NL54' and the salt-tolerant line 'Jishu 26' (J26) under NaCl stress. (c) Expression analysis of IbNPRs in 'Xuzishu 8' under heat stress. The FPKM values are shown in boxes.
-
Gene ID Gene name Genomic length (bp) CDS (bp) Protein size (aa) MW (kDa) pI Instability GRAVY Subcellular location g2961.t1 IbNPR1 4,577 1,602 533 59.1 6.03 49.12 −0.134 Cytoplasm (10) g14548.t1 IbNPR2 4,136 1,887 628 69.29 6.53 36.88 −0.18 Nucleus (6) and cytoplasm (5) g24785.t1 IbNPR3 3,040 1,353 450 48.39 6.5 48.71 −0.169 Cytoplasm (9) g36877.t1 IbNPR4 5,567 1,614 537 60.21 6.22 35.45 −0.177 Nucleus (5) and cytoplasm (5) g42979.t1 IbNPR5 4,735 1,467 488 52.97 6.22 46.48 −0.117 Nucleus (5) and the cytoplasm (6) g54830.t1 IbNPR6 2,318 1,701 566 62.86 5.69 45.31 −0.178 Cytoplasm (9) g59006.t1 IbNPR7 6,926 1,623 540 60.33 5.58 45.85 −0.199 Nucleus (5.5) and the cytoplasm (6.5) CDS, coding sequence; MW, molecular weight; pI, isoelectric point; GRAVY, grand average of hydropathicity. The numbers between brackets represent the reliability thresholds of the prediction software. Table 1.
Characteristics of NPRs in I. batatas.
Figures
(7)
Tables
(1)