-
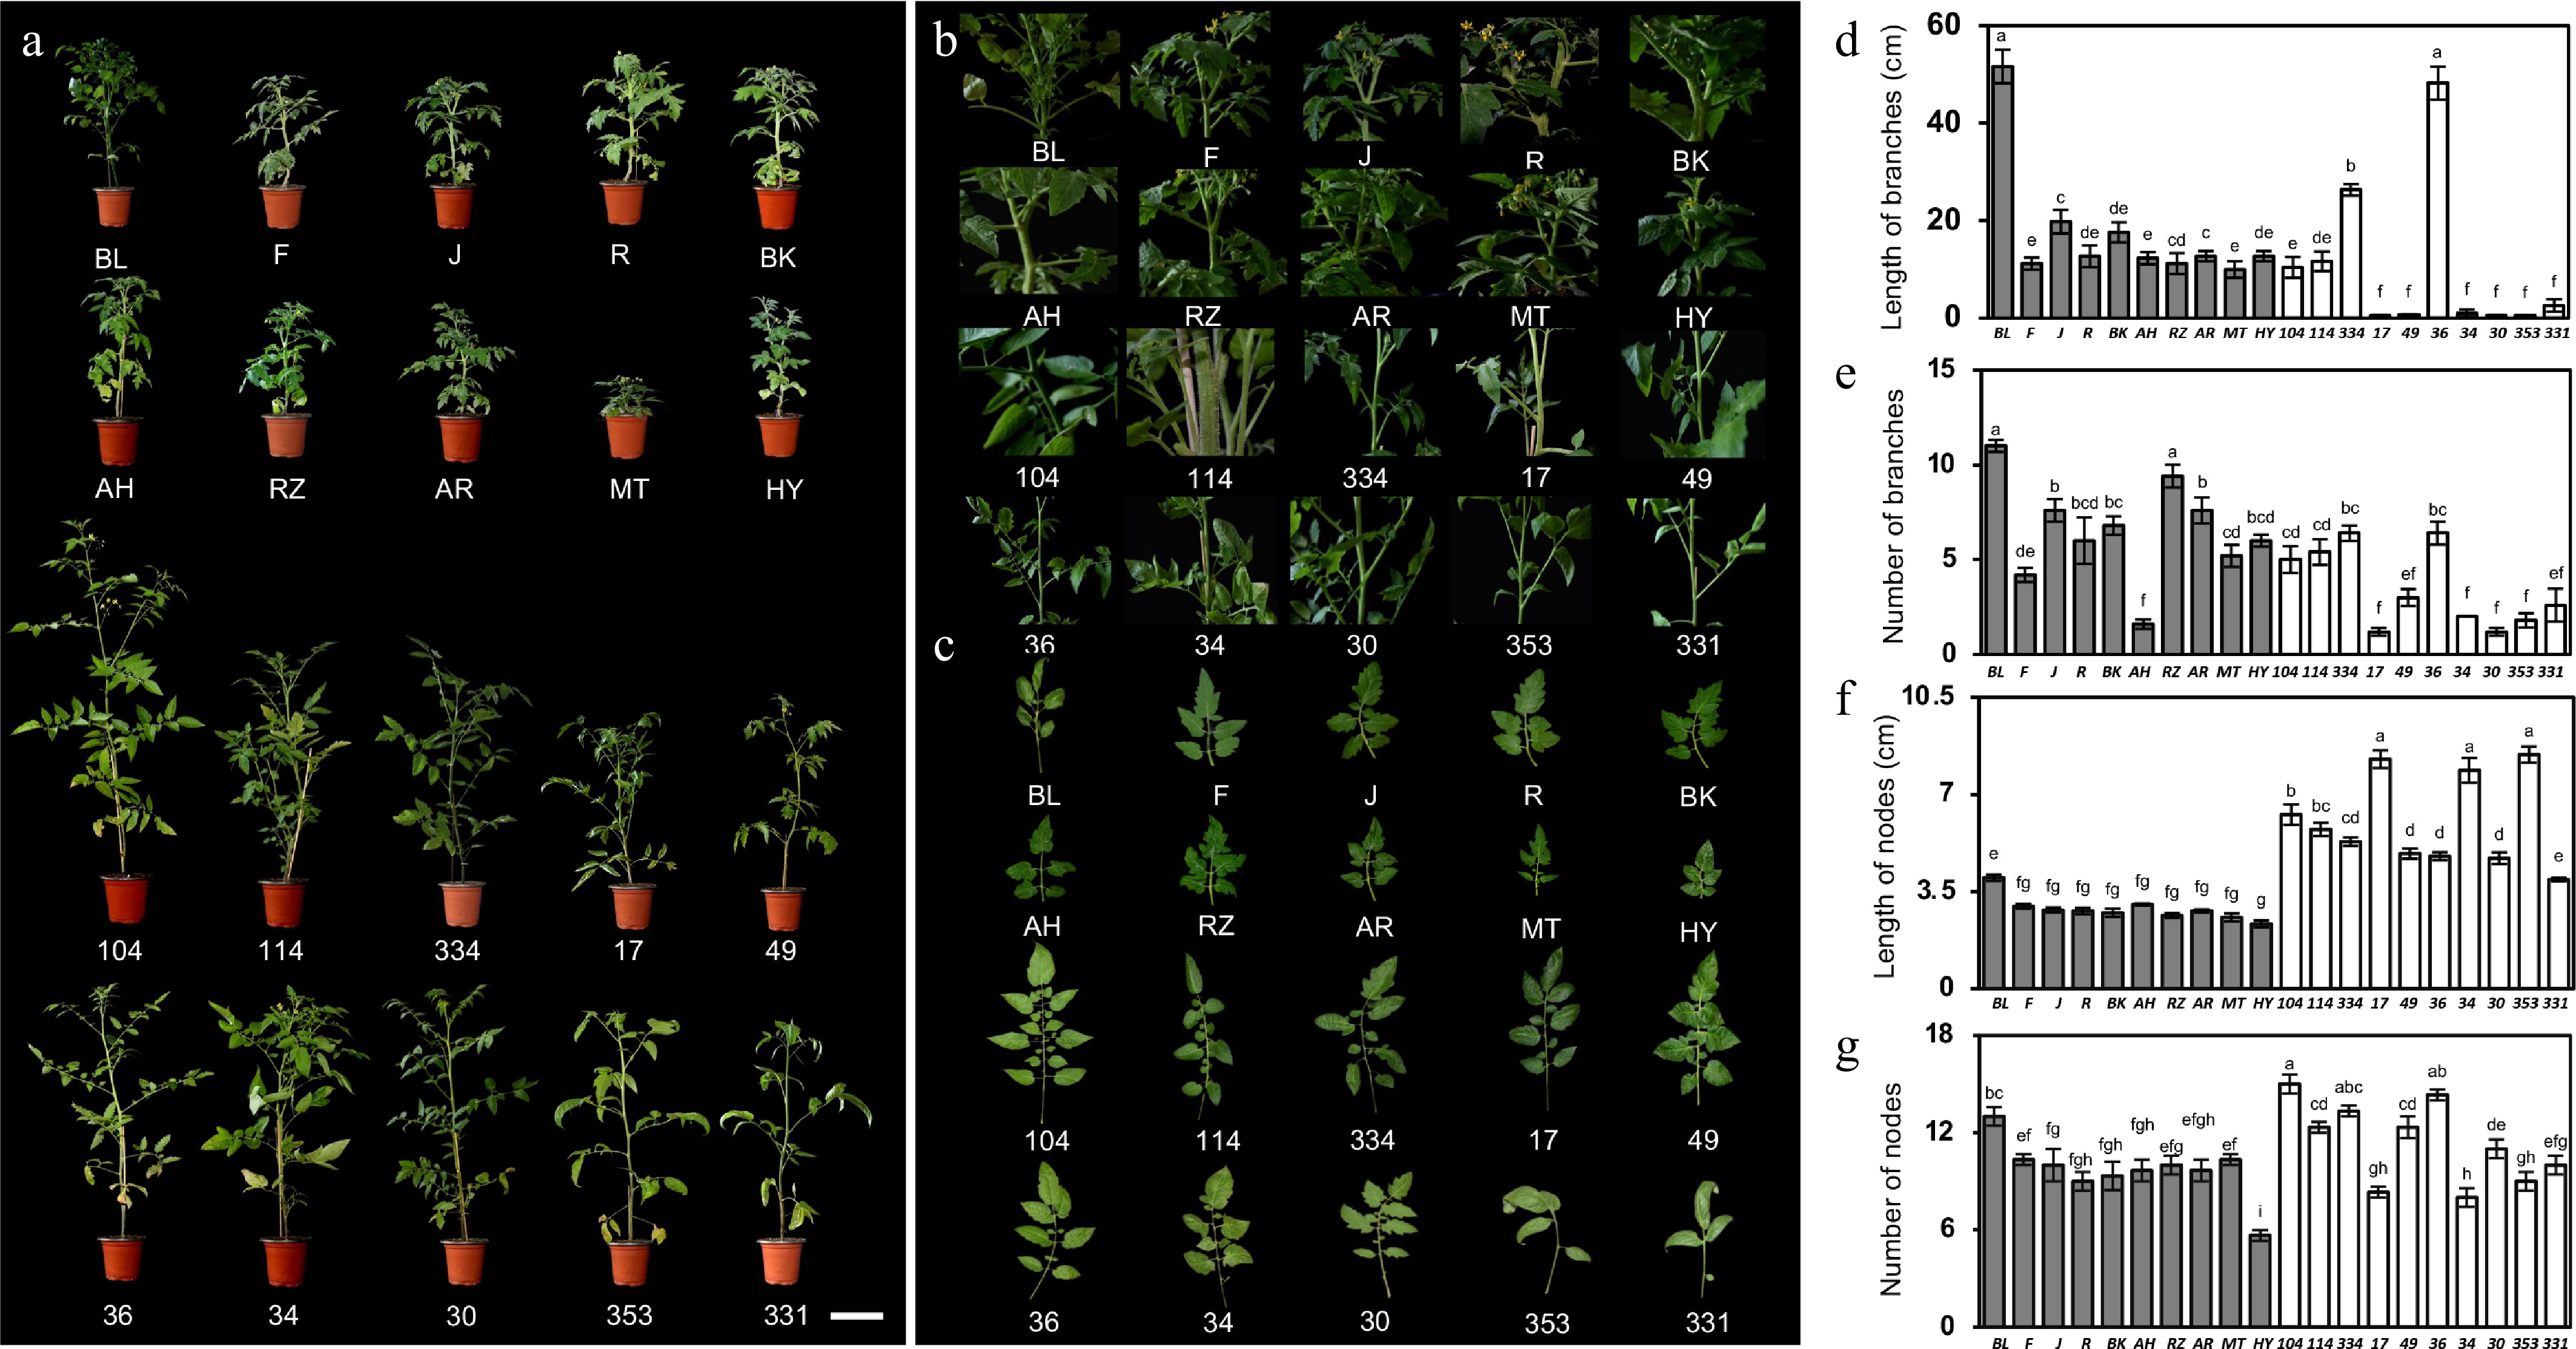
Figure 1.
Variation in lateral branch and internode traits among 20 tomato cultivars. (a) Overall morphology of 20 tomato varieties: Scale bar = 10 cm. (b) Lateral branch development phenoarchitecture of 20 tomato species. (c) Leaf development phenoarchitecture of 20 tomato species. Quantitative analysis of branch and internode traits: (d) branch length, (e) number of branches, (f) internode length, and (g) number of internodes. Data are presented as mean ± SE. Different lowercase letters above the bars indicate significant differences among accessions according to Duncan's multiple range test (p < 0.05).
-
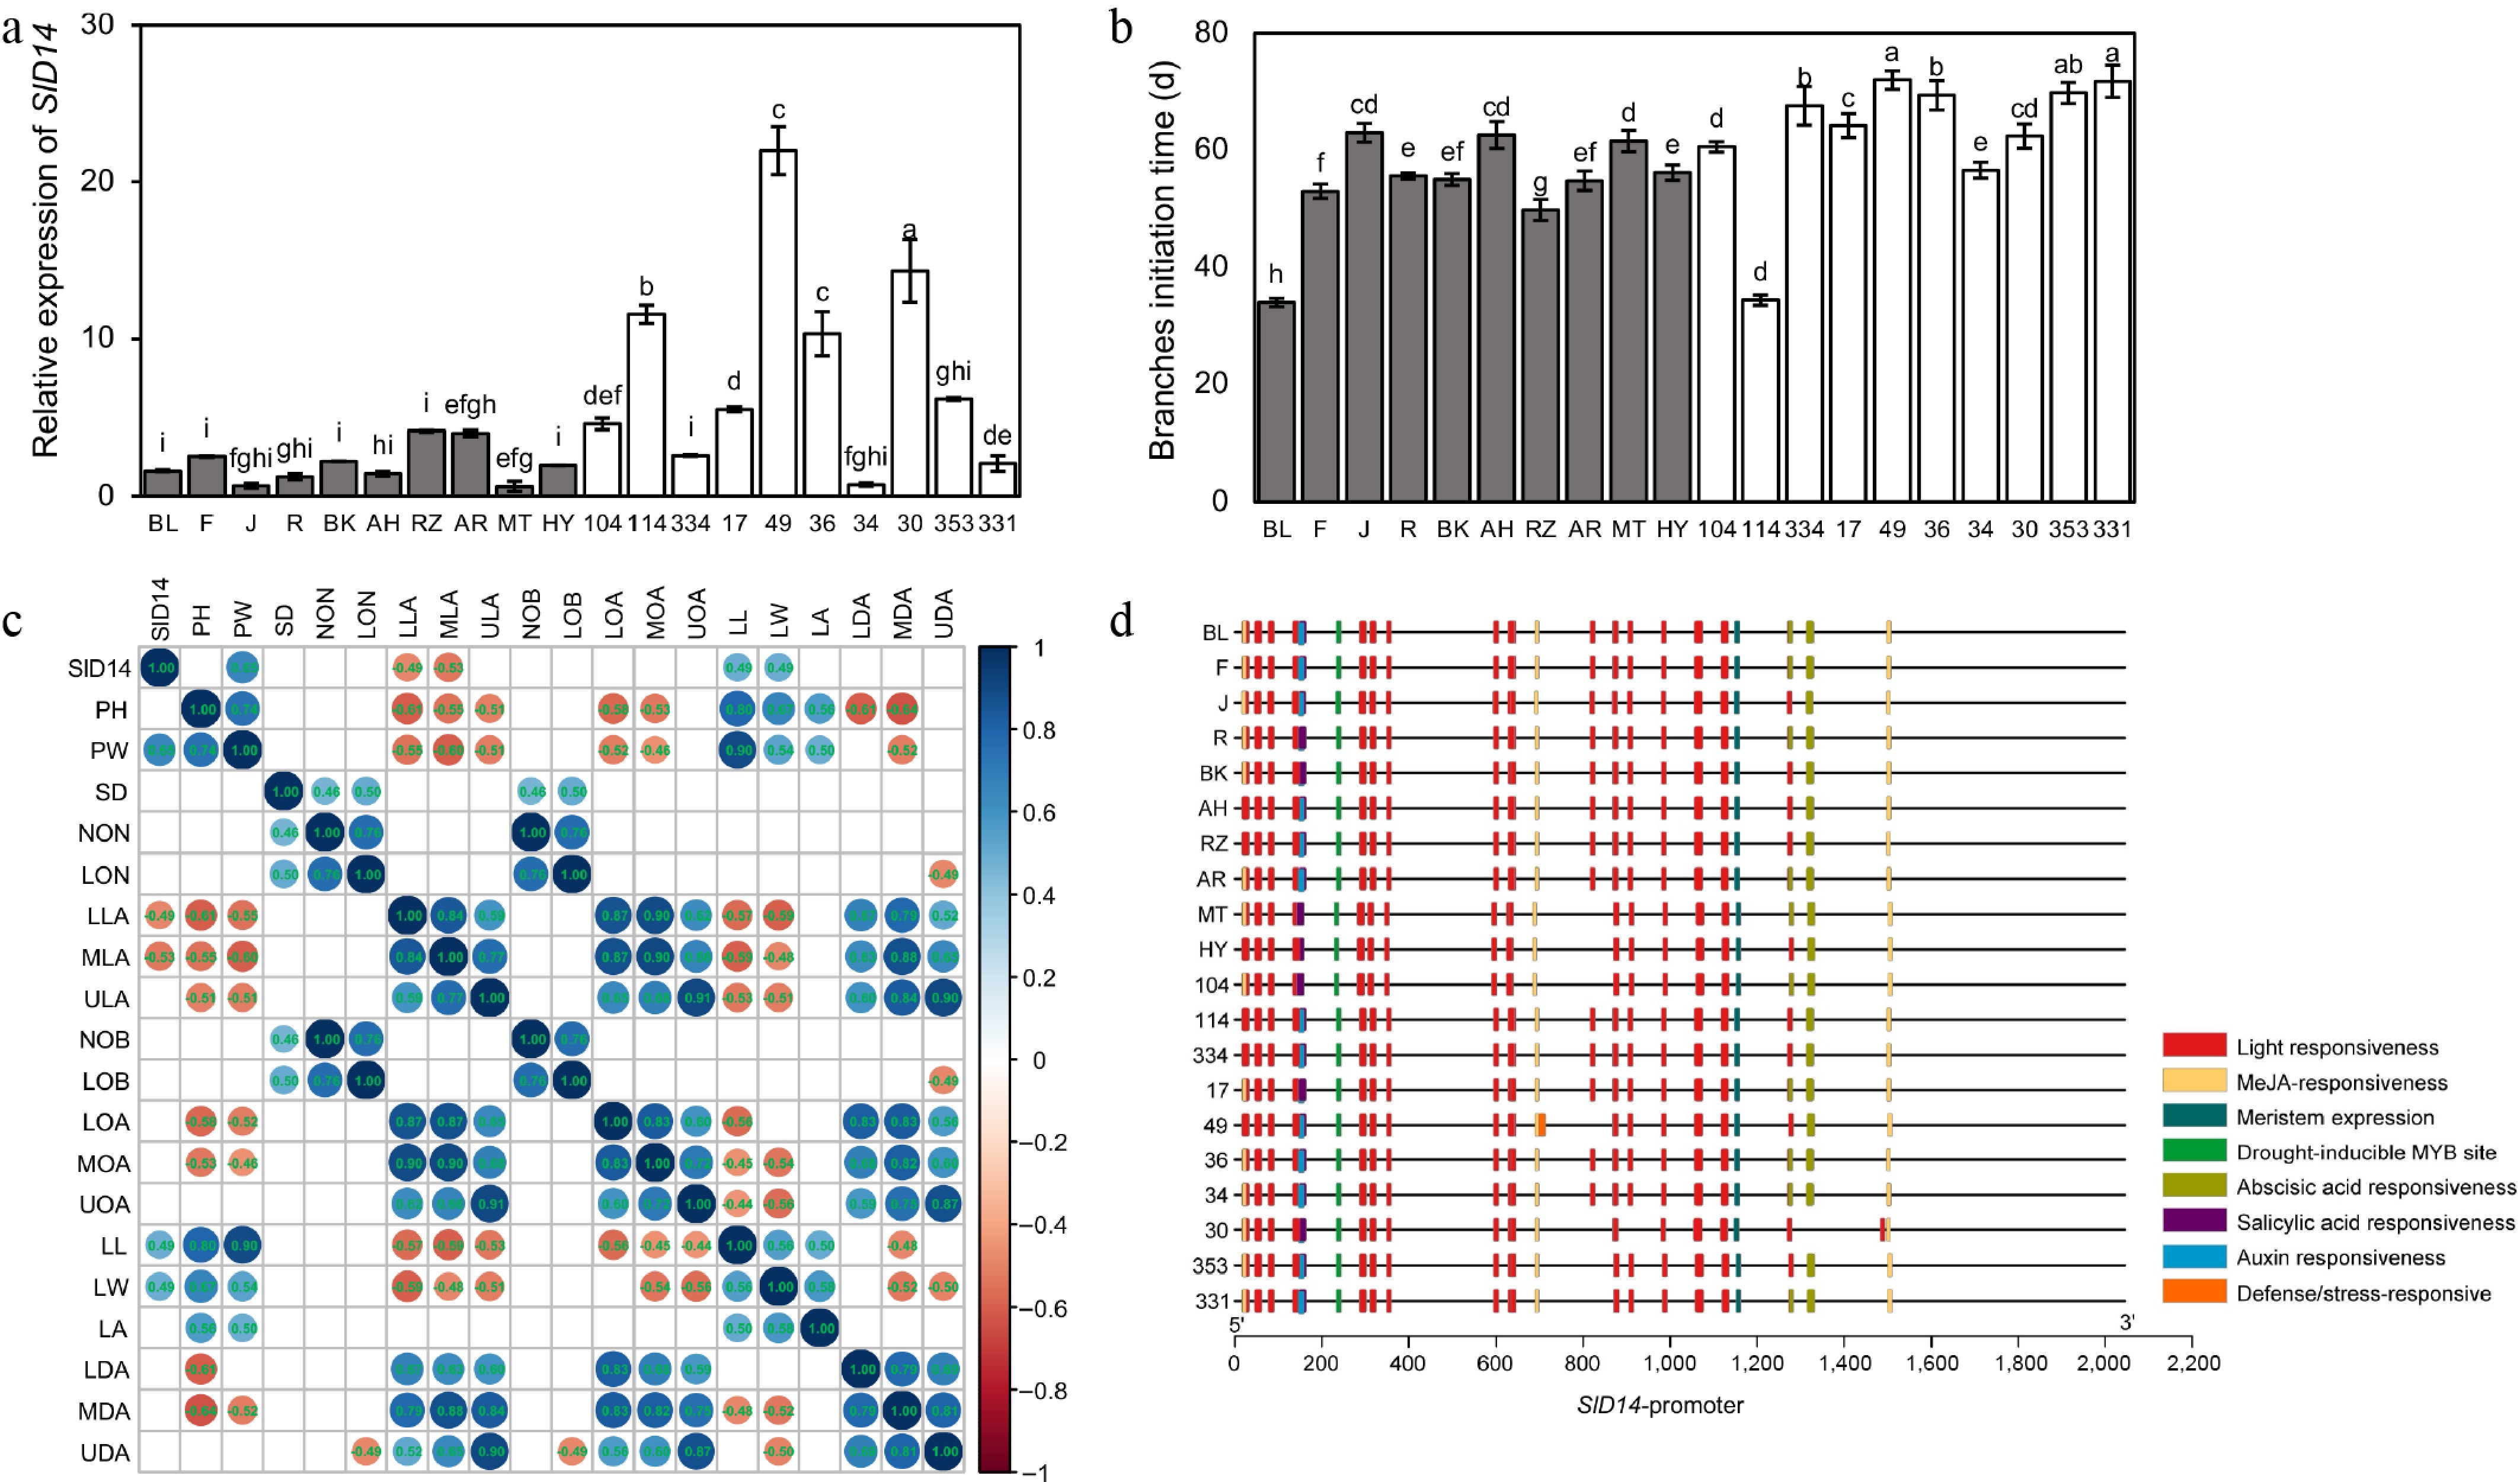
Figure 2.
Expression and promoter analysis of SlD14 and integrated analysis of SlD14 expression and plant growth traits. (a) Relative expression of SlD14 in all 20 tomato varieties. Data are presented as mean ± SE. Different lowercase letters above the bars indicate significant differences among accessions according to Duncan's multiple range test (p < 0.05). (b) Variation in branch initiation time (d) among 20 tomato cultivars. (c) Correlation analysis between SlD14 expression and plant architecture-related traits in 20 tomato plants. The following data were collected: plant height (PH), plant width (PW), number of nodes (NON), length of nodes (LON), stem diameter (SD), number of lateral branches (NOB), length of lateral branches (LOB), upper, middle, and lower leaf angles (ULA, MLA, LLA), upper, middle, and lower opening angle (UOA, MOA, LOA), upper, middle, and lower drooping angles (UDA, MDA, LDA), leaf length (LL), leaf width (LW), and leaf area (LA). (d) Analysis of cis-regulatory elements in the SlD14 promoters of the 20 cultivars Supplementary Table S1.
-
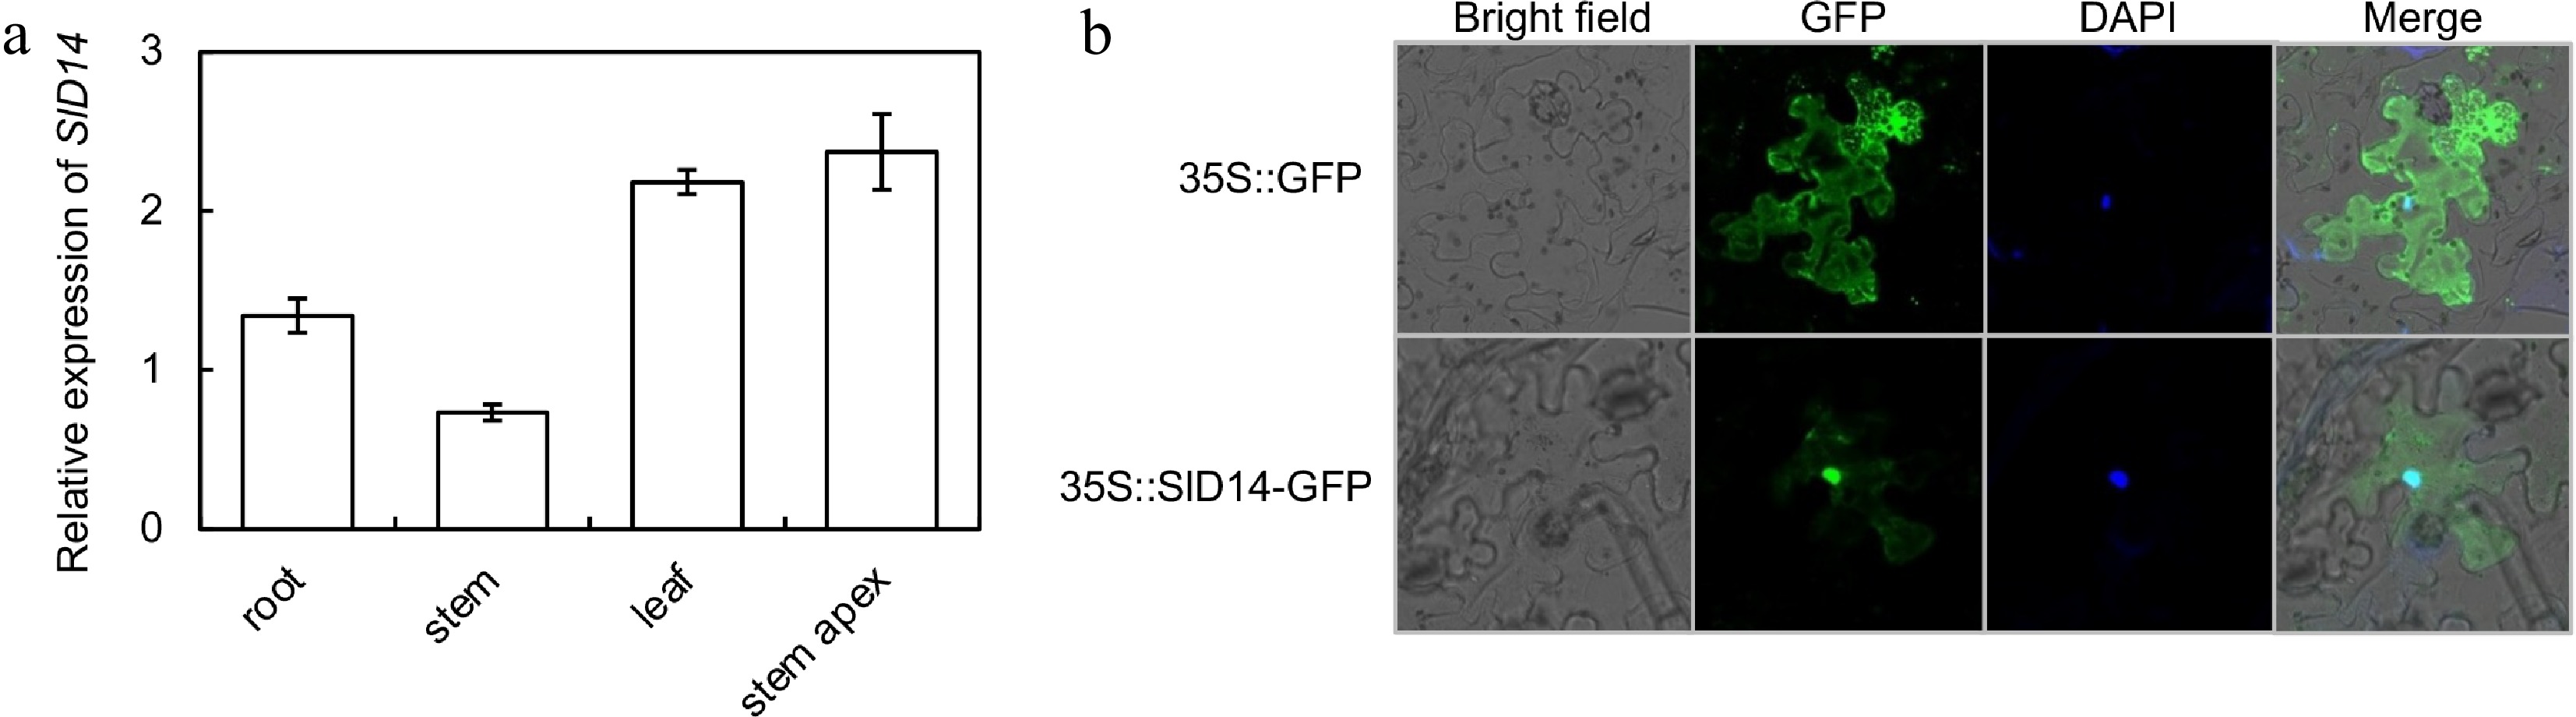
Figure 3.
Expression patterns and subcellular localization of SlD14 in tomato. (a) SlD14 expression in different tomato tissues. Data are presented as mean ± SE. (b) Subcellular localization of 35S::SlD14-GFP in abaxial epidermal cells of tobacco leaves, with 35S::GFP alone as a control.
-
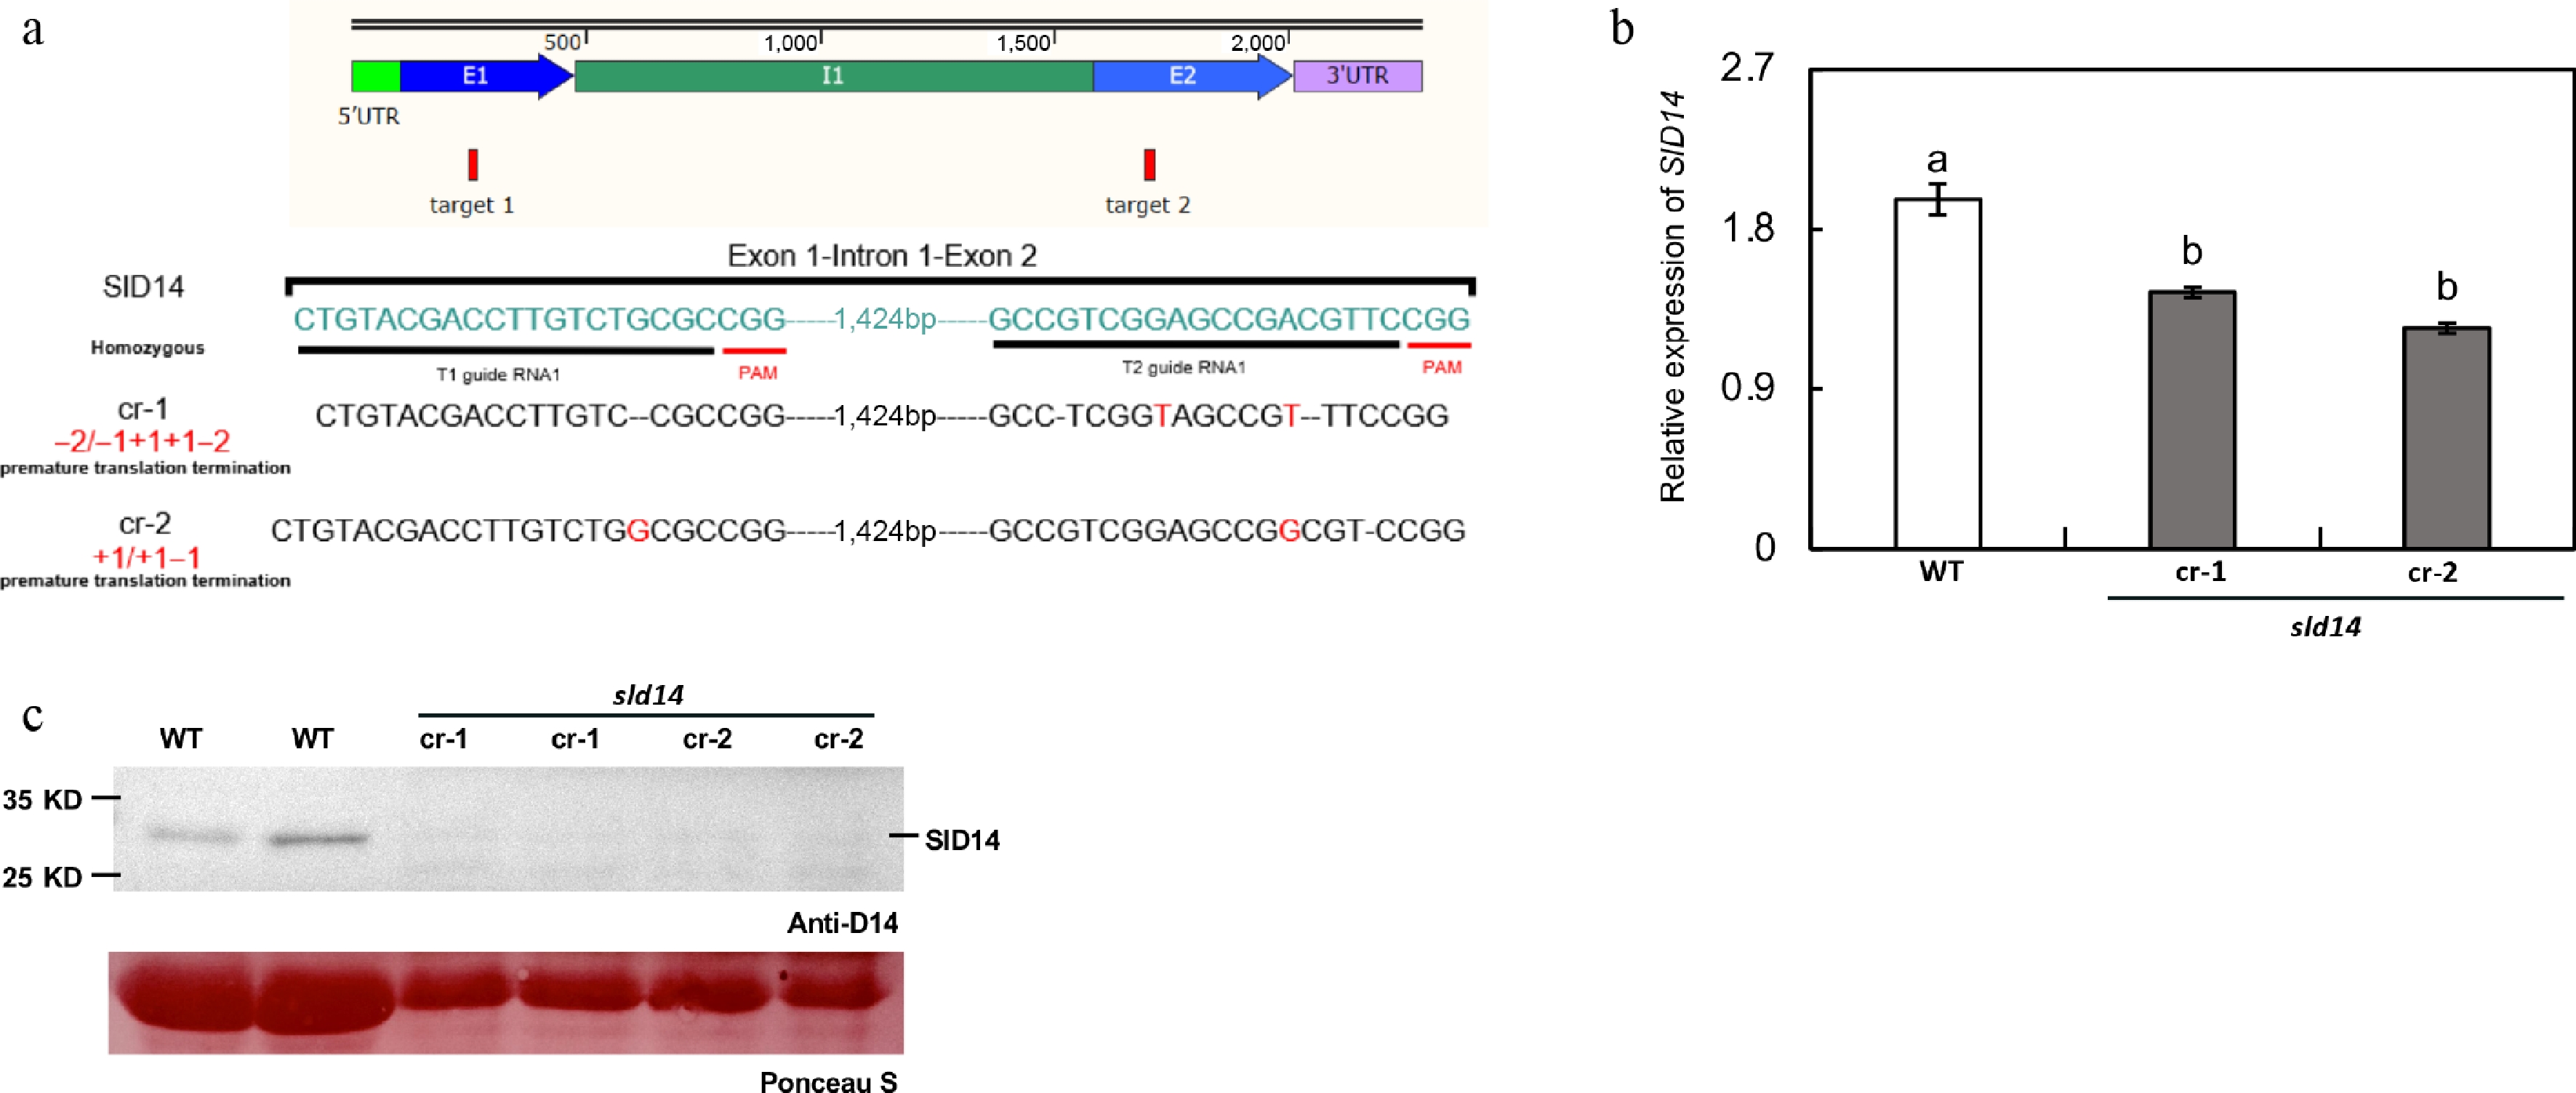
Figure 4.
Sequence and expression analysis of SlD14 in CRISPR/Cas9 knockout tomato lines. (a) Alignment of SlD14 sequences from wild-type (WT) and transgenic knockout lines, highlighting insertions, deletions, and other mutations. Differences from the WT sequence are indicated in red. (b) Relative expression levels of SlD14 in WT and knockout lines. (c) Western blot analysis of SlD14 protein levels in WT, sld14 cr-1, and sld14 cr-2 plants using a SlD14-specific antibody. Data are presented as mean ± SE. Different lowercase letters above the bars indicate significant differences among accessions according to Duncan's multiple range test (p < 0.05).
-
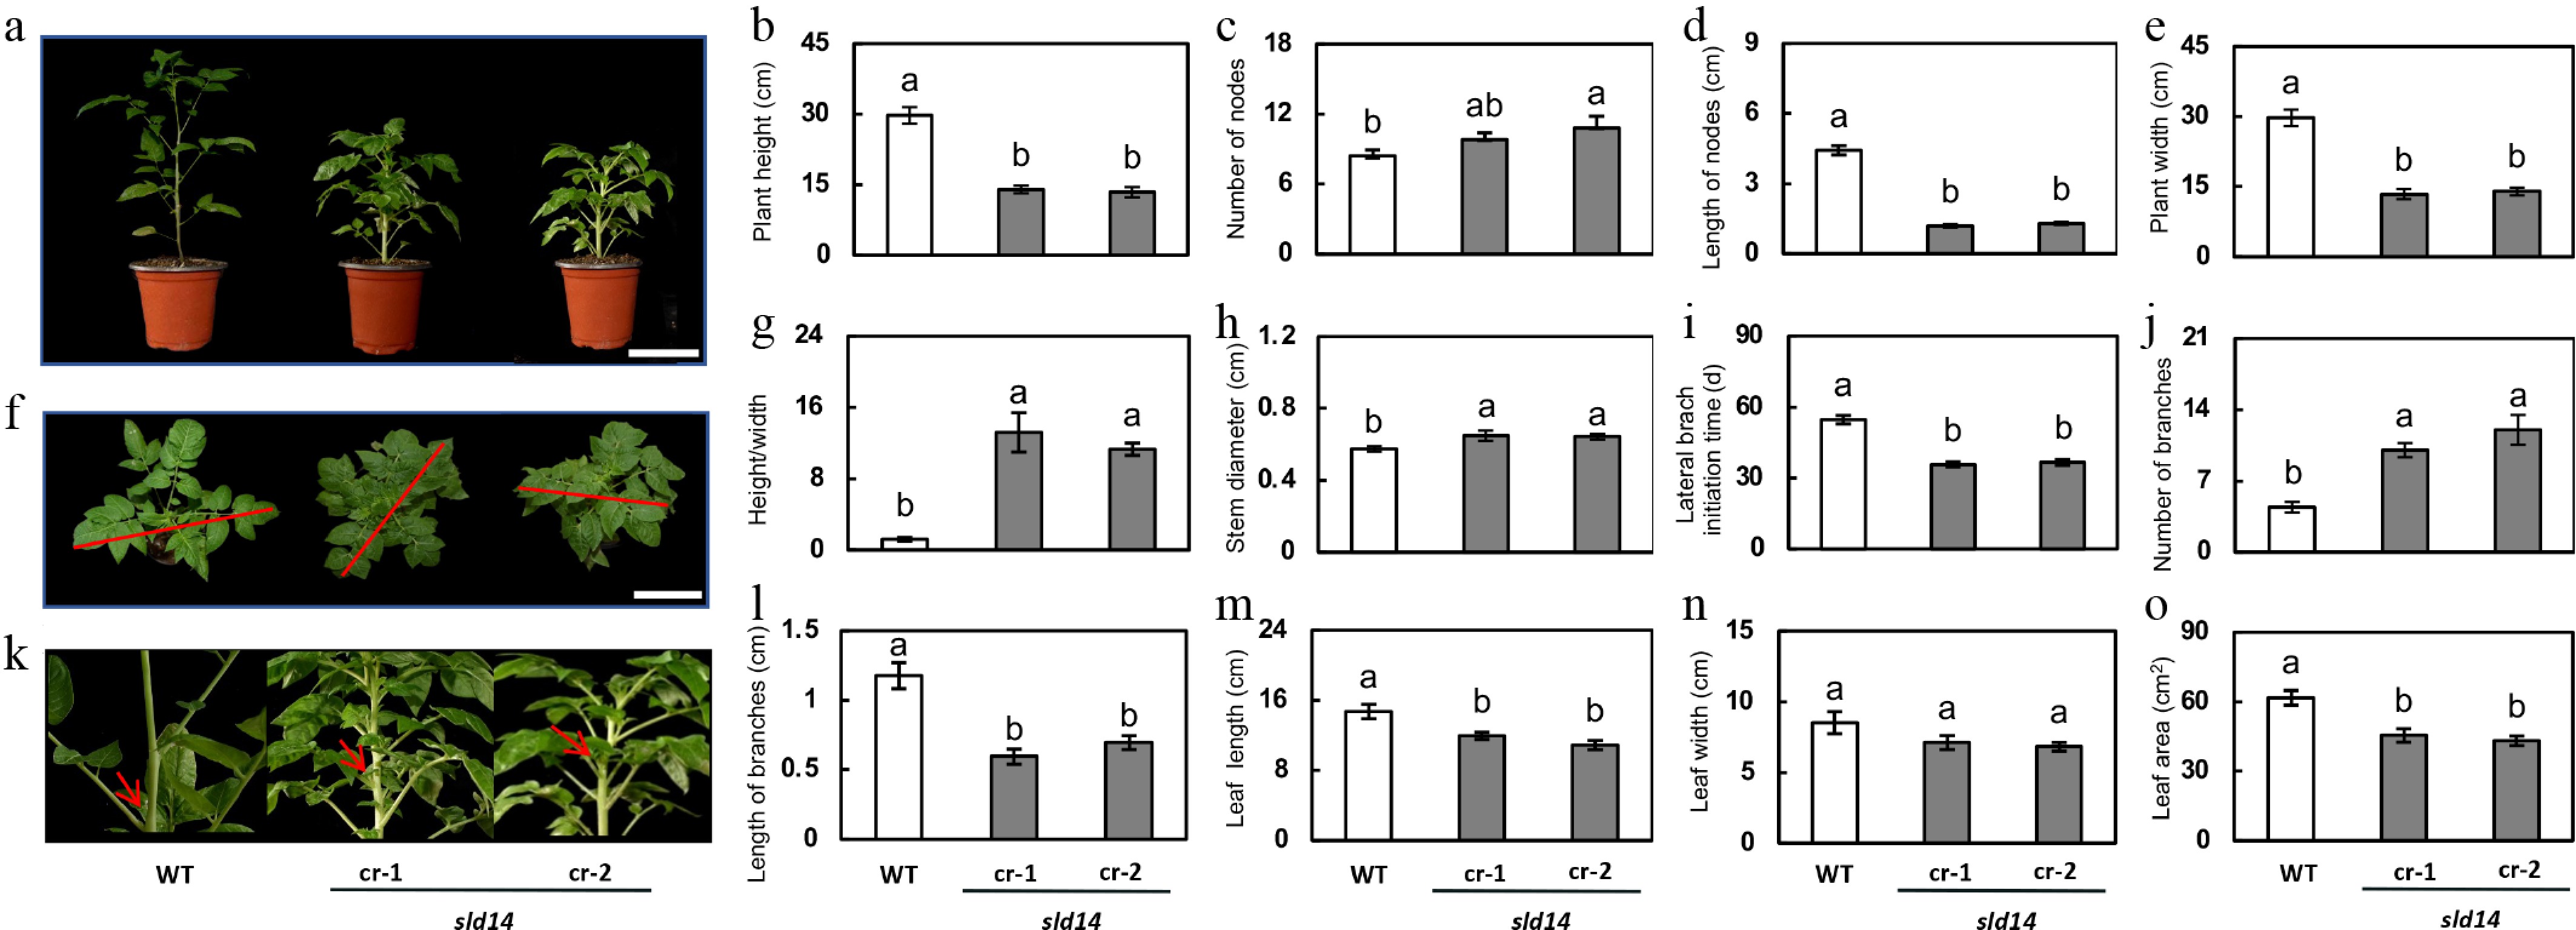
Figure 5.
Morphology of 60-day-old SlD14 knockout and WT tomato seedlings. Morphology of 60-day-old SlD14 knockout (sld14) and wild-type (WT) tomato seedlings, shown in (a) front view, (f) top view, and (k) branching pattern, illustrating clear differences in overall architecture; scale bar = 10 cm. Red arrows indicate the positions of lateral buds or branches. (b) Plant height, (c) number of nodes, (d) length of nodes, (e) plant width, (g) plant height/width ratio, (h) stem diameter, (i) lateral branch initiation time, (j) number of lateral branches, (l) length of lateral branches, (m) leaf length, (n) leaf width, and (o) leaf area of WT and SlD14 mutant lines (sld14 cr-1 and cr-2). Data are presented as mean ± SE. Different lowercase letters above the bars indicate significant differences among accessions according to Duncan's multiple range test (p < 0.05).
-
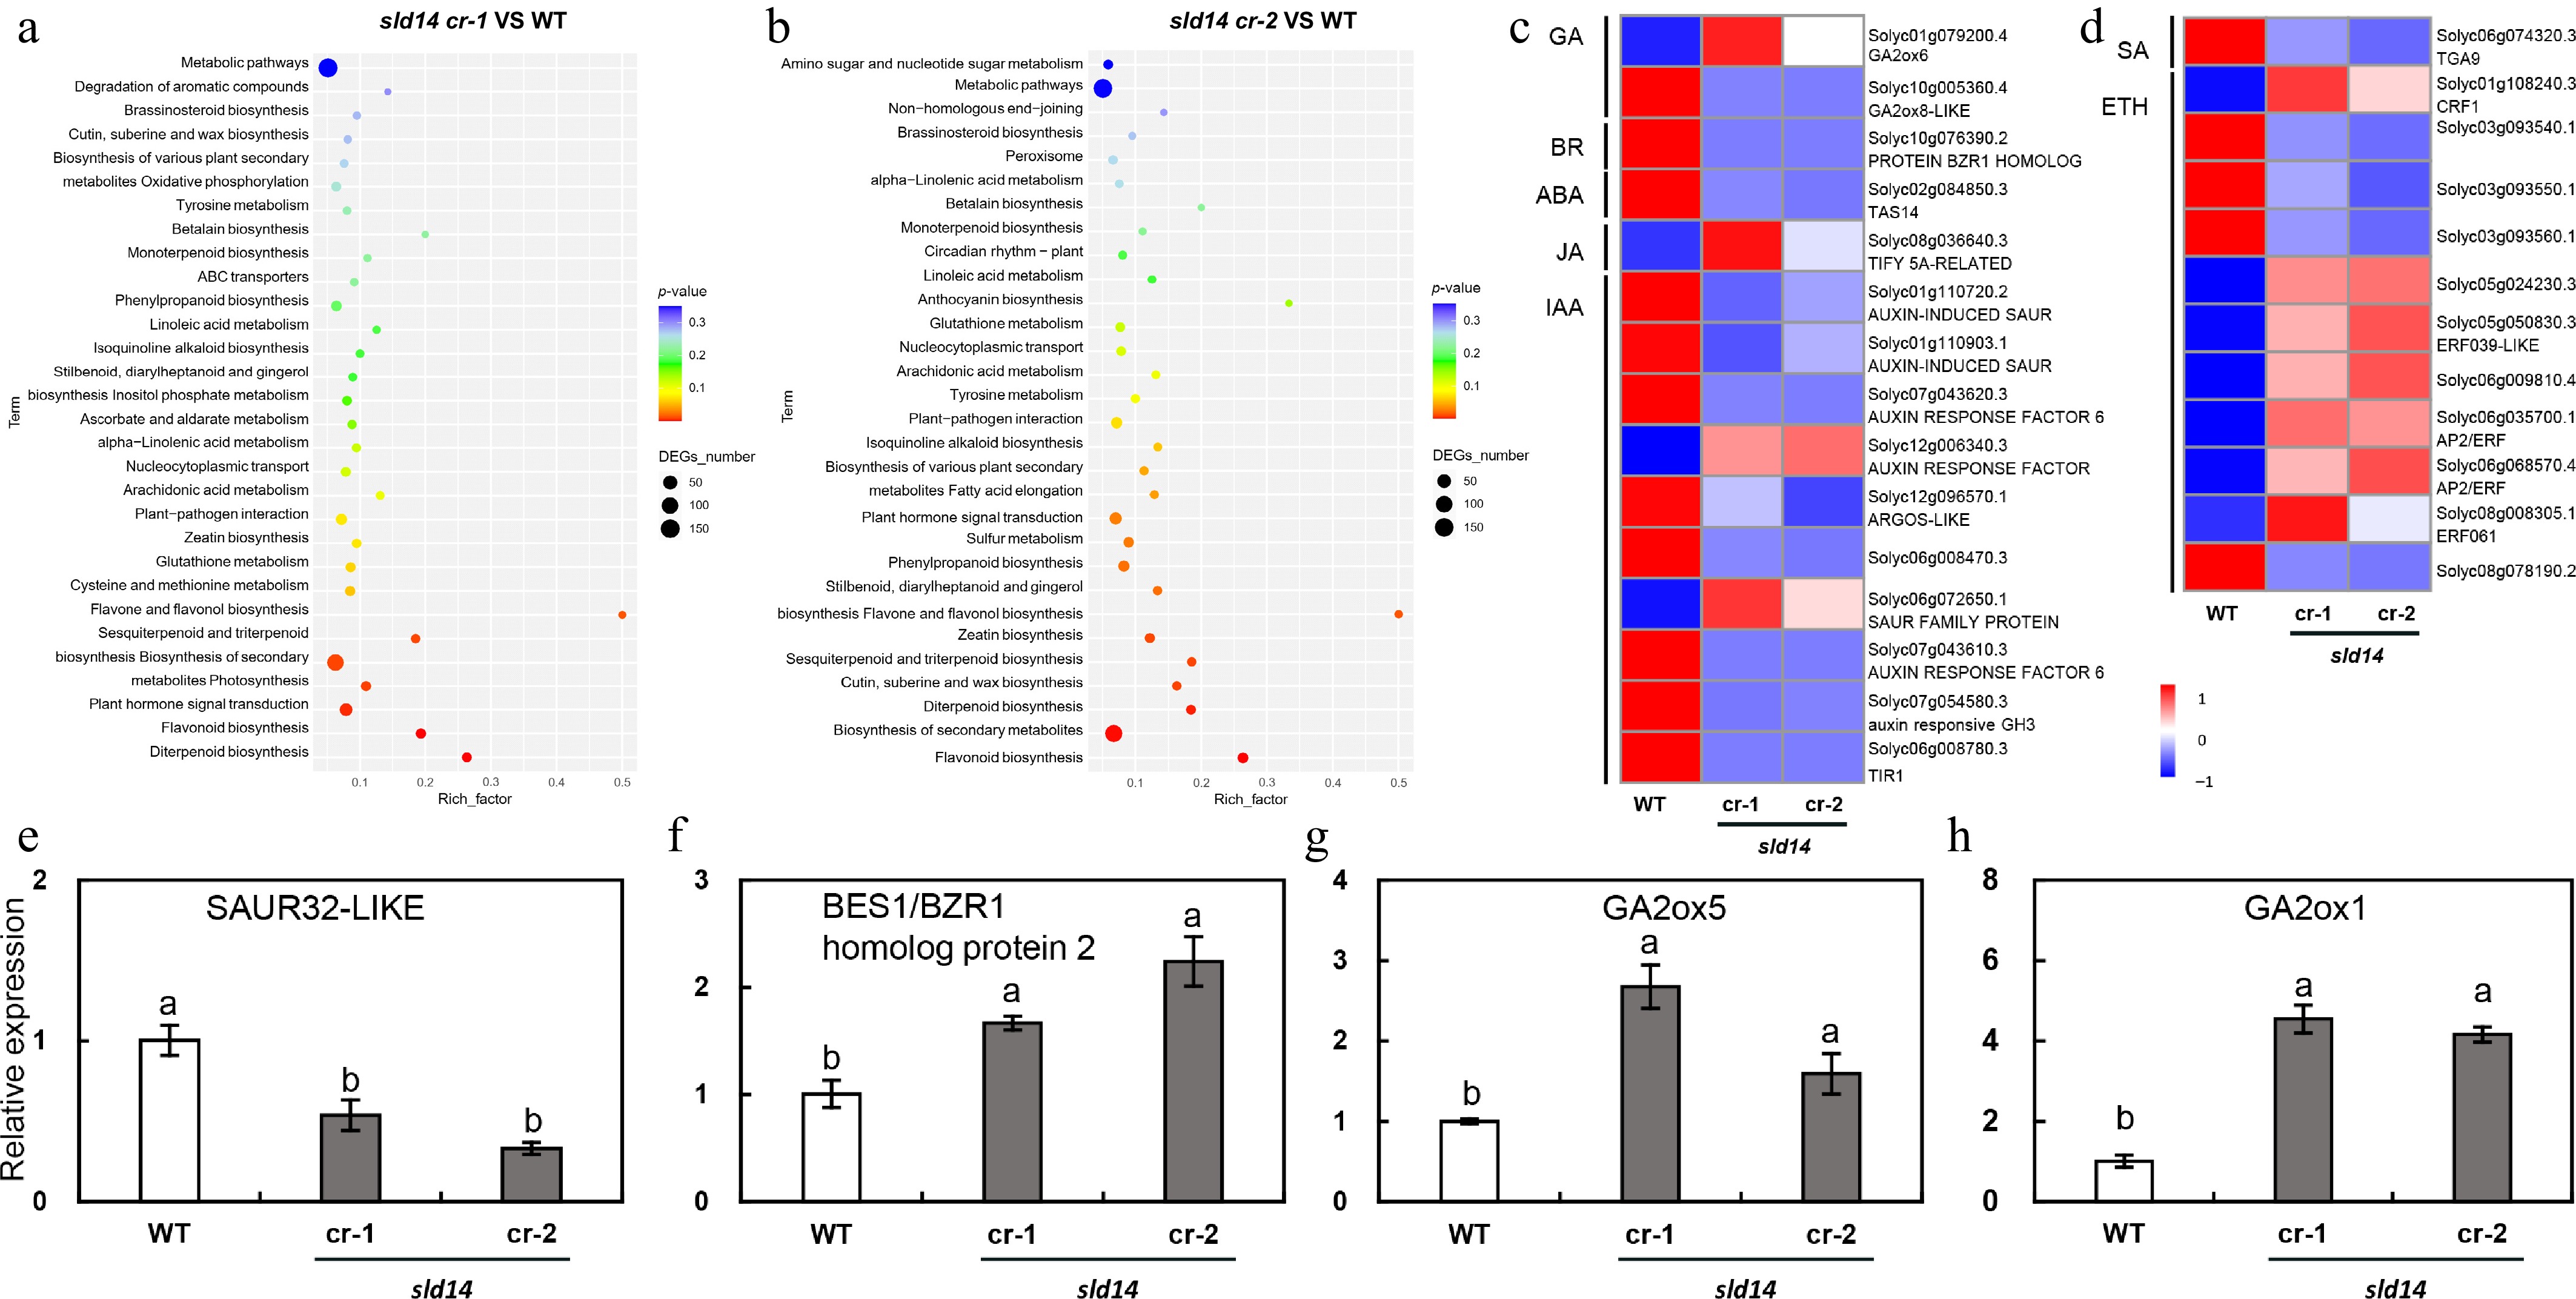
Figure 6.
RNA-seq analysis of the SlD14 mutants and WT plants. (a), (b) KEGG analysis revealed that the biosynthesis of secondary metabolites, plant hormone signaling pathways, metabolic pathways, plant‒pathogen interaction pathways, karyotoplasmic transport, and phenylpropanoid biosynthesis were significantly enriched in both groups. (c), (d) The expression analysis of DEGs related to the synthesis of auxin, jasmonic acid, gibberellin, abscisic acid, brassinosteroid, salicylic acid, and ethylene. (e)–(h) Relative expression levels of SAUR32-like, BES1/BZR1 homolog protein 2, GA2ox5, and GA2ox1 in WT, sld14 cr-1, and sld14 cr-2 plants, as determined by RT-qPCR. Data are presented as mean ± SD. Different lowercase letters above the bars indicate significant differences among accessions according to Duncan's multiple range test (p < 0.05).
Figures
(6)
Tables
(0)