


-
Tea plant [Camellia sinensis (L.) O. Kuntze] is a woody and perennial crop with high economic value as their products are one of the three most popular non-alcoholic drinks in the world[1]. Thus, breeding superior tea plants is a key task for tea breeders and basic work for the tea industry. In nature, heterosis is a universal phenomenon, and some hybridization plants have better traits, such as higher yield than both parents[2]. Utilizing heterosis has become one of the principal methods for tea breeding, and in recent years, many new tea cultivars have been bred via cross breeding in China[3,4]. However, due to allogamy and a high level of self-incompatibility in tea plants, the fruit-setting ratio is low with natural pollination, which leads to a low-efficiency to obtain offspring from certain parents and hinder further breeding work. Fortunately, it has been shown that artificial pollination can increase seed quantity and quality[5,6]. Thus, there is a need for a high-efficiency method of artificial pollination in tea breeding to improve the fruit-setting ratio and efficiency of pollination[1].
Due to mixed pollen, lax-bagged or harvested non-related seeds, which are difficult to avoid in the course of artificial hybridization, it is necessary to ascertain the authenticity of the F1 population and dislodge the false-hybrid progenies prior to genotyping and structuring the genetic map[7]. In the past, the identification depended on morphological characteristics or molecular markers such as random-amplified polymorphic DNA (RAPD) and amplified fragment length polymorphism (AFLP)[8−10]. However, simple sequence repeats (SSRs), as codominant markers, make it easier to observe the parent-offspring relationship. SSR markers are abundant and distributed in eukaryotic genomes[11], and the genotypes of SSRs in hybrid progenies completely complement their parents, which can accurately distinguish the authenticity of cross-offspring[12,13]. Therefore, SSR markers have been used widely in identifying the authenticity and purity of various plant populations such as cabbage[10], cassava[14] and avocado[15]. Similarly, SSR markers have also been used to estimate the pedigree relationship among 128 elite clonal tea cultivars in China. Among these cultivars, 47 pairs of parent-offspring relationships were revealed using 30 SSR markers, suggesting that SSR markers are valuable for parentage identification[16].
Therefore, our studies had the following aims: (1) to assess the improved method of petal-assisted artificial pollination and to test the F1 population purity by this method; (2) to ensure the suitable quantity of SSR markers for false-hybrid identification.
-
In this study, the parents of tea plant cultivars were planted at the Enshi Academy of Agricultural Sciences (109°48' E, 30°32' N). There were three hybrid combinations (Table 1) used for artificial hybridization, and the parents of each combination had large phenotypic differences. These tea plants were all more than 10 years old and not pruned for at least two years. Pollination was performed when the female parents of the combinations were in the full-bloom stage. The flowering stage was inconsistent among the different cultivars, resulting in the hybrid pollination stage lasting from October to November in 2010. A repeated hybridization experiment was conducted in the second year.
Table 1. Experimental artificial hybrid combinations.
Code Hybrid combination Quantitya L × B Longjing 43♀ × Baihaozao♂ 1250 J × L Jiaming 1♀ × Longjing 43♂ 1350 B × L Baihaozao♀ × Longjing 43♂ 1200 a Quantity of pollinated flowers. Procedure and evaluation of the petal-assisted pollination method
-
The pollination method was based on the procedures described below. (1) Firstly, it was important that the female plants had sufficient row spacing and light transmittance in the tea garden. (2) The alabastrums of the male parents were sampled when the maternal flowers were in the full bloom stage, and the alabastrums were placed evenly into a box, which had a padded layer of absorbent paper. The box was covered with a layer of absorbent paper and was maintained inside, overnight in preparation for the next day. (3) Before pollination, the pollen from the male parents was collected using a soft brush and gently shaking into a clean paper, and the pollen was then transferred from the paper into a plastic dish. (4) After pollen collection, the female parent alabastrums were tagged after emasculation, and the remaining untagged alabastrums on the same branch were removed. Notably, the flowers were pollinated immediately after emasculation. (5) Paternal pollen was kept in the dish and then placed on the stigma of tagged flowers (Fig. 1). Pollination was successful when the stigma became golden due to pollen. (6) The pollinated flowers were bagged in the next 15 d to prevent invasion of pollen from other cultivars.
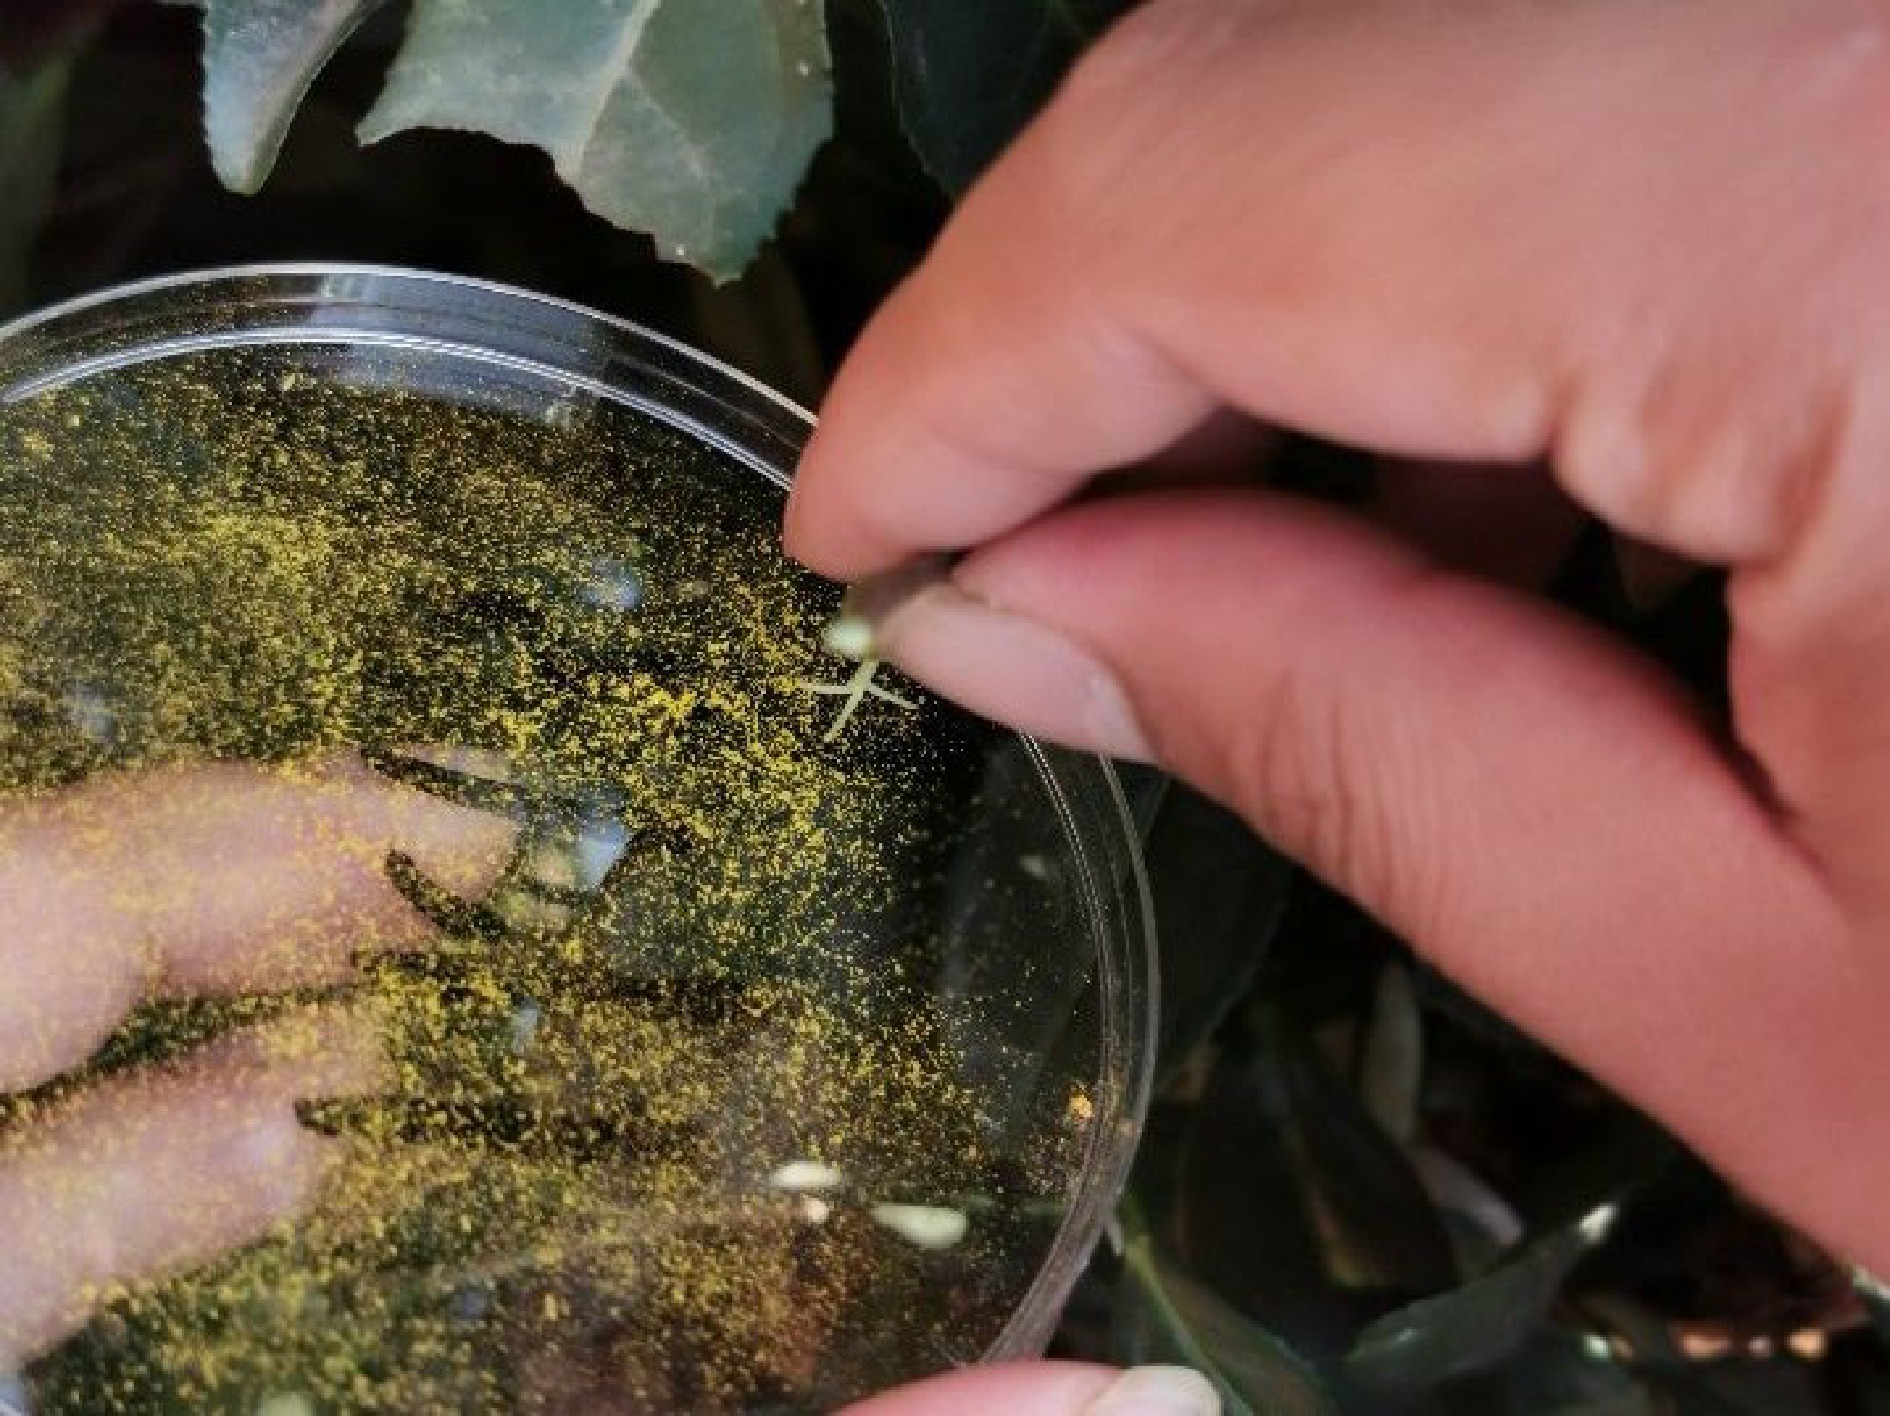
Figure 1.
Schematic diagram of artificial pollination.
The method was assessed by analysing the following indexes of the F1 population: fruit-setting ratio (FSR; the ratio between survival and total quantity of pollinated flowers), seed quantity (SQ), and germination rate (GR) and survival rate (SR). To study the environmental influences on fruit-setting ratio, the rainfall in Enshi City, Hubei Province (China) from November 2010 to December 2011 was monitored for correlation analysis with fruit-setting ratio. The data were analysed and calculated using SPSS 22.0 and Microsoft Excel 2016 (
www.microsoftstore.com.cn ).DNA extraction and genotyping
-
The F1 population consisting of more than 200 individuals was grown at the Tea Research Institute of CAAS in Hangzhou, China using the J × L hybridized combination as parents. The leaves of 184 randomly selected F1 individuals and two parents were collected and stored at −70 °C until DNA extraction using a DP305 Plant Genomic DNA Kit (Tiangen, Beijing, China). The isolated DNA was diluted to 10 ng/μL and stored at −20°C.
Thirty two SSR markers (Table 2) randomly selected from 15 tea plant linkage groups (LGs) were screened by PCR amplification to determine the F1 population genotype. The PCR amplification was performed in a 10 μL reaction volume consisting of the following ingredients: 3.5 μL of 2× Taq Master Mix for PAGE (Vazyme biotech, Nanjing, China), 4.1 μL of ddH2O, 0.2 μL of each primer (10 μM) and 20 ng of template DNA. The PCR procedure was as follows: high-temperature pre-denaturation at 94 °C for 4 min; 35 cycles of denaturation at 94 °C for 30 s, annealing at 58 °C for 30 s and extension at 72 °C for 30 s; and a final extension at 72 °C for 10 min. The PCR products were mixed with 2 μL of 6× Loading Buffer and then run on a 10% PAGE gel. The separated bands were visualized using silver staining and imaged for downstream analysis[17]. In order to get more accurate results, each sample was genotyped at least twice. Meanwhile, the PAGE gels with clear and separated bands were selected to record the genotype data according to the method described previously by Tan et al.[12].
Table 2. SSR marker information.
Name Forward primer Reverse primer NCBI accession LGa Nab PICc A27 TTGCTGGGGTTGTCTATG TCAATTGTGGCCAATTCT JQ398741 LG07 2 0.294 A41 GATTCTGCTGCCATTGTATTCC CGCCTCGTCTTCGTCGTTA EU787433 LG05 3 0.369 A44 TGCAACTCGGCCTTCTGT GGAGCTGACTTAGCCCTCA FE861192 LG11 4 0.7 A114 TAGCTTTGTGGAGCCTGAG ATCTTCCTTCGCTAACCC CV013769 LG11 2 0.316 A134 ACCCAAAATATGAAACAACATG TGACTACTGCACTGACACTGCTA − LG09 2 0.297 A142 ATGCTTCAGGGAGTGACCAT ATTTATGCCAAACTACCAACAG FE861636 LG02 4 0.547 A157 GGGGTTAGGGTTTTGGTCAC ATGCCTTAACAAGAACACTACAAG FE942901 LG11 2 0.275 A187 CCTCCTGCTTTGTTTATGCT TACCGACAATCACTTGTGGATC FE861247 LG12 2 0.32 CsFM1012 AGCCACCATACCCACACATT ACAAACCAATGCTACTGCCC GAAC01011288 LG01 3 0.541 CsFM1051 AACCCATTTCGTCTTTGTGC AGAATCAACAACACCCTGGC GAAC01009709 LG08 2 0.316 CsFM1061 TTGGCAGGAAAAGAAAAGGA AGCAGCGAGTTCTTTGTGGT GAAC01002340 LG03 3 0.543 CsFM1068 CAGGCCTTCGTTTTCTTTTG TTCCTCATCTTCTGTCTCCCTC GAAC01009576 LG15 3 0.55 CsFM1097 CGGCAGATTTGGTGATAGGA AACAAAATGGGAACCCACAA GAAC01004794 LG09 4 0.563 CsFM1102 GCATACACTCTTCCGGTGGT ACAATCTCAACCTCCATCCG GAAC01008204 LG11 3 0.318 CsFM1156 CACAAGGAGGGGGTACGTTA CACCTTCCACAGAGGGAGAC GAAC01009838 LG02 3 0.567 CsFM1158 CGTGCCTGCATTGCTAATAA GTACCAGTAACTGCGGGGAA fd_17402 LG12 3 0.295 CsFM1298 TTGTTTGATTTGCCGGTGTA TTGAAGGATCTCCGAAGGAA GAAC01015282 LG08 3 0.309 CsFM1349 TGGGCCAGAAGAGAAAAGAA GGTGTTCCTGGCACTTCAAT GAAC01012393 LG12 3 0.543 CsFM1357 TCGGCGATGGAAAAGATAAC CTTGTGAACGGGCTTCTCTC GAAC01009805 LG13 3 0.567 CsFM1390 TCTCCCTCTCTCCTCTGCAC GGAGCAACCCAAAACTGCTA GAAC01008822 LG01 3 0.285 CsFM1411 ATACTCTGCTCCGTCTGCGT TCGGTGCTACAAACAAATGC GAAC01010715 LG01 4 0.395 CsFM1435 CCCGTGACACAATTCACATC CTGGGCATATGCTGGTGTTA GAAC01011748 LG03 3 0.302 CsFM1459 TTTTTCACGGTAAAGTCGGG CCCTAGCTGCAGAAACCATC GAAC01013904 LG08 3 0.558 CsFM1504 TGGTAAACGGAAAGAATGGC AGCTAGCCCTGTGAAAACCA GAAC01005613 LG03 2 0.298 CsFM1509 GACGATGGACCCTTCTTTGA CATCATCATCATCCTCACCG GAAC01005346 LG14 3 0.561 CsFM1529 TGTTCTTGATTTCCTCTACTCCA TTTGAGGGAAAGGTGAGGAG GAAC01049476 LG11 3 0.379 CsFM1550 CGAGACATCGAACACCACAG CGTATCGTAGCGGTGAAGGT GAAC01040688 LG13 3 0.551 CsFM1562 CTTCCAGAAGTCCCATCGAA CTCTCTCCCAAAACGTCCAG GAAC01038212 LG09 3 0.37 CsFM1565 CAAATTTTGTCGTCGTCGTG TCGCCTAAATTCGTGAGCTT GAAC01003369 LG03 2 0.307 CsFM1597 GGTGGTGATCGTCTTGGTCT AAACGAAACGAAACGAATGG GAAC01002473 LG08 4 0.566 CsSSR103 TGGCAGTCATGATAGGCATT TGCTGCAAATGATGAACACA HP770422 LG03 3 0.339 CsSSR117 CCACCGTCGTCTTCTTCTTC CTCGTTGTTGGAGTTGCTGA KA283538 LG10 3 0.53 a Linkage group (LG). b Number of allele (Na) in J × L. c Polymorphism information content (PIC) in J × L. According to the molecular weight, only the clear bands within the scope of the target fragment in PAGE were selected and the target bands from large to small were labelled alphabetically, for instance, A, B, C, and D. Single bands appeared in homozygous genotypes, and two bands appeared in heterozygous genotypes. In line with the molecular weight, the bands were recorded as AA, AB, BB, etc. In addition, the bands that were detected as mismatching from parents were record as 'E', and missing bands were noted as '−'. All genotype data were recorded using Excel to establish an original database.
Identifying the authenticity of F1 progeny (J × L)
-
All genotype data were converted into genotype files (.csv), which could be used by Cervus 3.0.7 (
www.fieldgenetics.com/pages/home.jsp ). Allele frequency analysis was performed to generate the allele frequencies needed by the simulation and parentage analysis modules. The following summary statistics were also generated to assess the suitability of loci for parentage analysis: expected heterozygosity, observed heterozygosity and polymorphic information content (PIC). After frequency analysis, the output files (.alf) were used to run simulations. The simulations estimated critical values of Delta (Δ) at a pre-determined level of confidence (95% and 99%) to allow statistical evaluation of the parentage tests. By comparing Trio Delta among the offspring, maternity and paternity in the parentage analysis, all candidate individuals in which the Trio Delta exceeded the critical Δ for 95% and 99% confidence would be flagged as '+' and '*', respectively. False-hybrid offspring were identified by the lack of flags in the data report.Optimizing the number of SSR markers for identification
-
According to the identification results, a false-hybrid offspring of J × L was sampled to determine the appropriate quantity of SSR primer pairs as follows: the number of SSR markers was gradually increased from 5 to 30 to reveal the tendency between the number of the false-hybrid individuals and SSR markers. It was beneficial to select an appropriate quantity of SSR markers, which could make the identification a more efficient and less time-consuming process.
-
From pollination in November 2010 to September 2011, there was a decline in the fruit-setting ratio of all hybridized combinations during fruit ripening (Fig. 2). The average fruit-setting ratio gradually decreased from 84.09% to 12.90% during fruit ripening. Overall, the results (Fig. 2) show that the fruit-setting ratio of L × B was consistently higher than J × L, except in December 2010 and March 2011. In contrast, the fruit-setting ration of B × L was consistently lower than the other combinations. In the initial pollination stage and final mature phase, L × B had the highest fruit-setting ratio, which reached 92.64% and 16.64%, respectively. In contrast, B × L had the lowest fruit-setting ratio in the initial pollination stage and final mature phase with values of 74.75% and 10.67%, respectively.
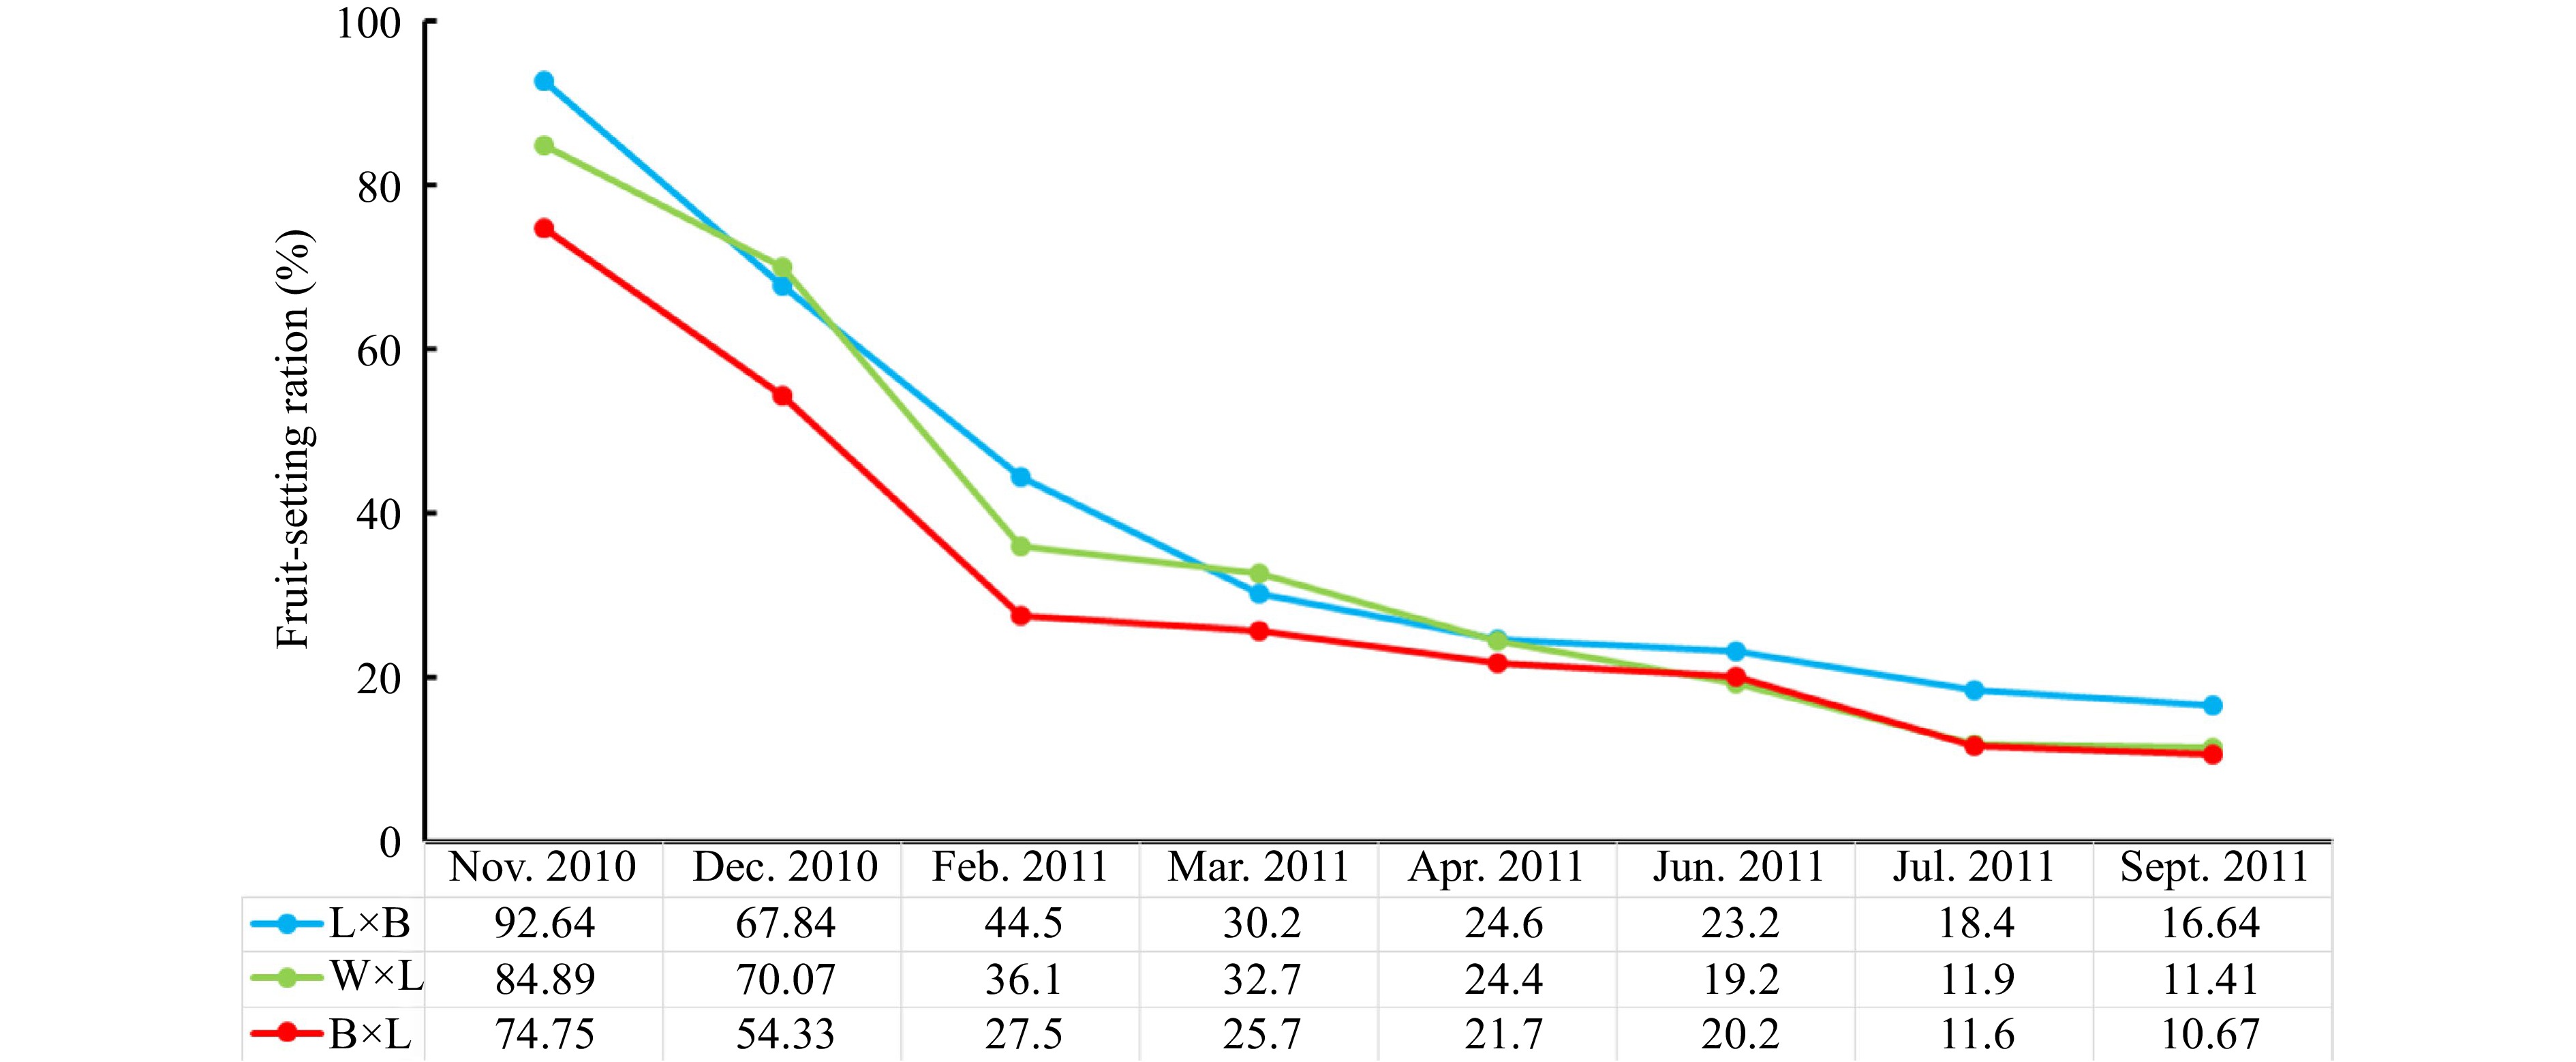
Figure 2.
Comparison of fruit-setting ratios among hybrid combinations.
The results (Fig. 3) show that fruit-setting ratio at the mature phase was significantly decreased due to the influence of the dramatic reduction at the initial pollination stage. Specifically, the fruit-setting ratio was reduced from 65.34% to only 27.3% in 2011, and this ratio reached 92.64% in 2010. Similarly, the final fruit-setting ratio was 16.64% in the mature phase during 2010 compared with 12.60% during the same period of 2011. Interestingly, the rainfall presented a different pattern (Fig. 4). The rainfall shows a 112.34% increase from 2010 to 2011, and it had values of 770 mm and 1635 mm in 2010 and 2011, respectively. Correlation analysis revealed a significant negative association between the final fruit-setting ratio and rainfall (P < 0.01).
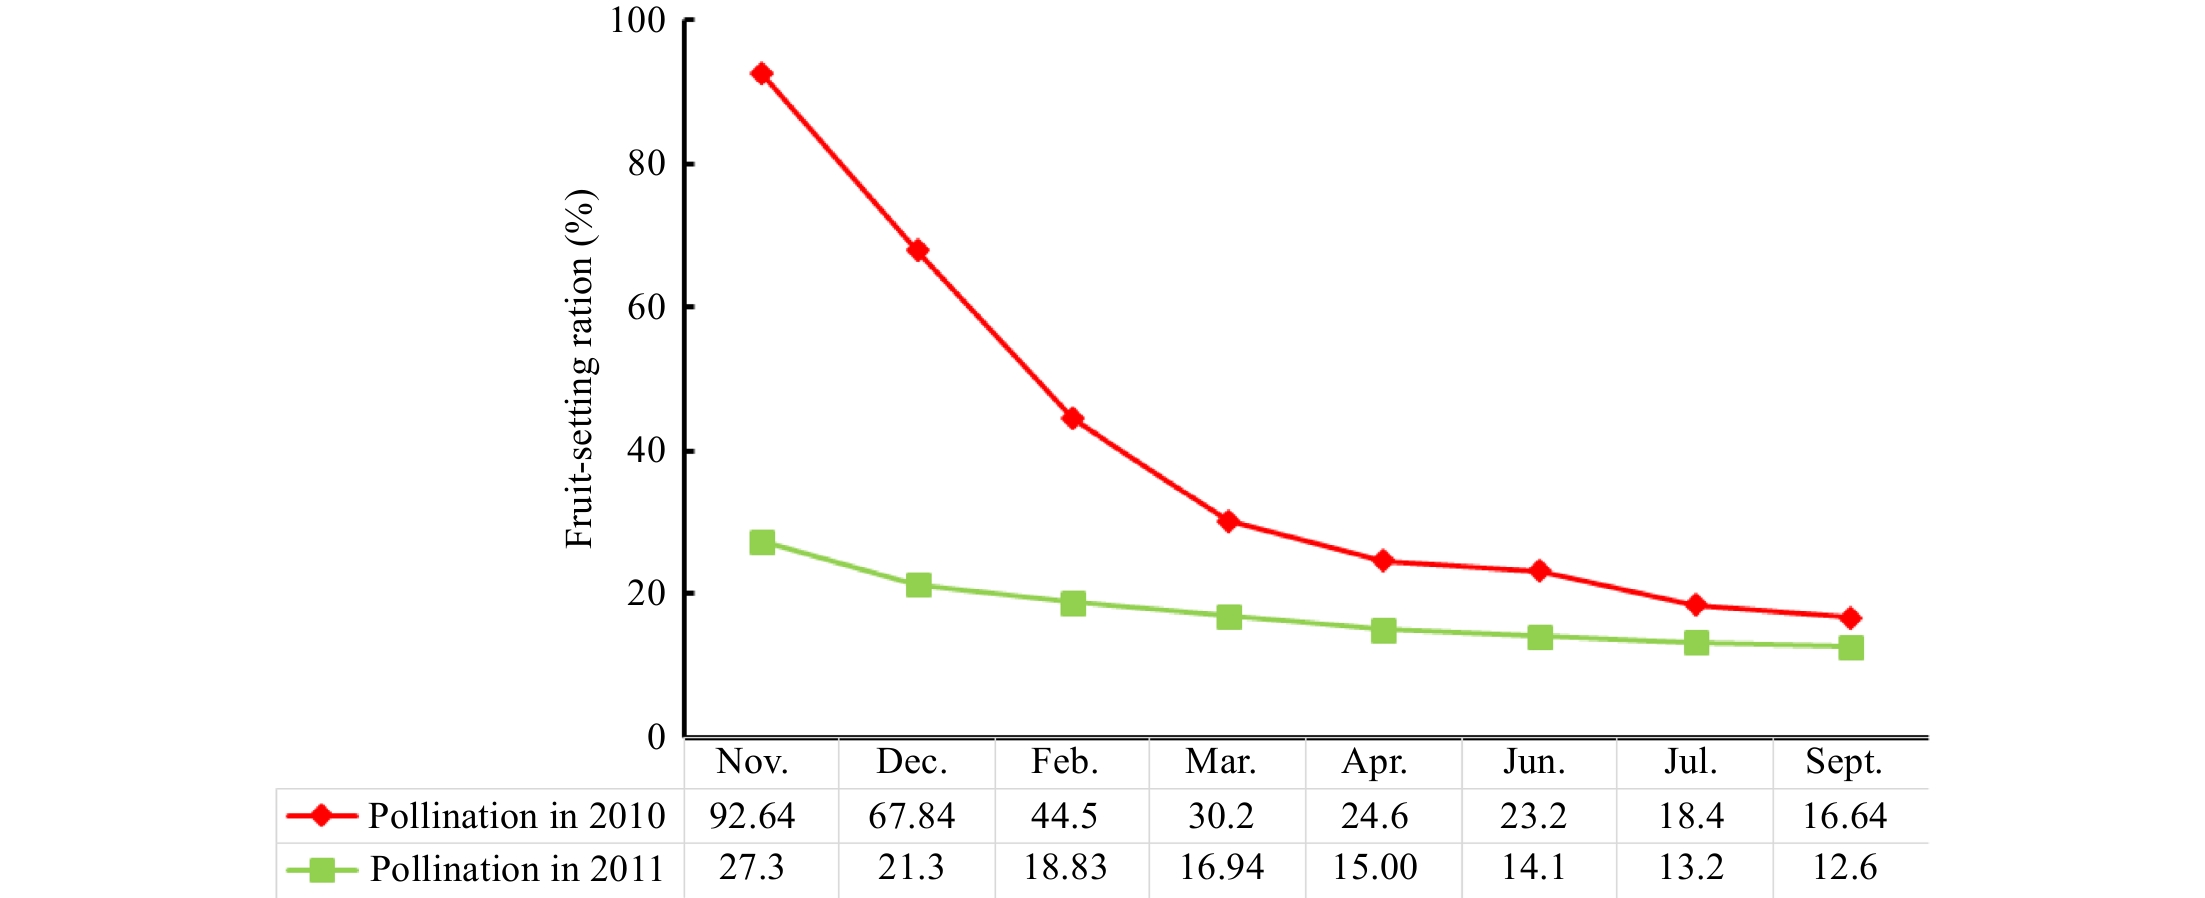
Figure 3.
Comparison of fruit-setting ratio in 2010 and 2011.
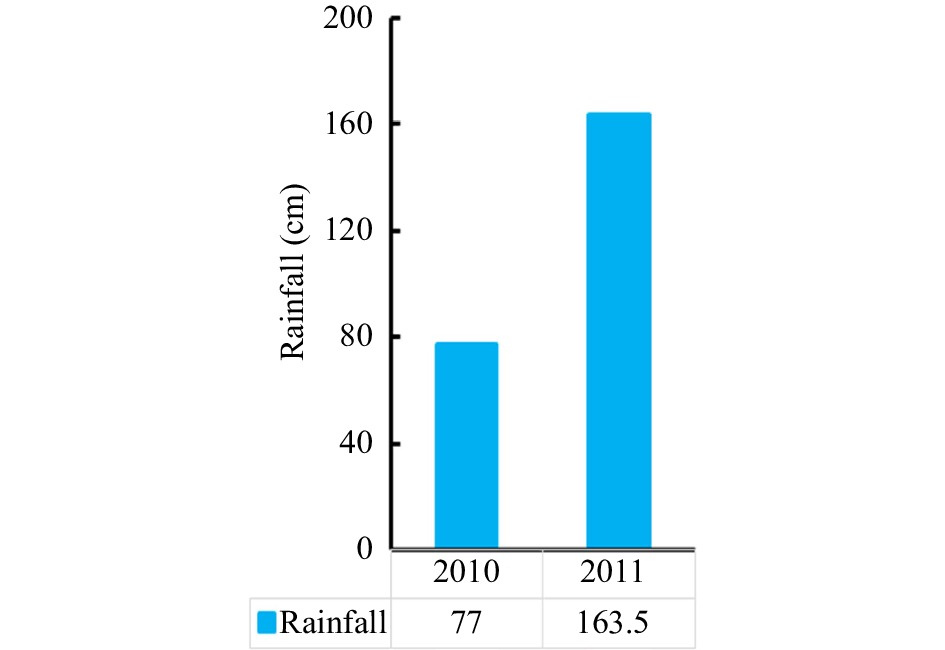
Figure 4.
Rainfall in 2010 and 2011.
Comparison of F1 progeny
-
The results showed (Table 3) that 500−600 pistillate flowers per capita can be pollinated per day and that the pollen amount from only one staminate flower is sufficient to pollinate at least five pistillate flowers. Among the hybridized combinations, the seed number, GR F1 and SR F1 of B × L were the lowest with values of 220, 45.45% and 75%, respectively. Interestingly, as a reciprocal cross, L × B had the highest seed number (537), GR F1 (70.90%) and SR F1 (96.32%). This finding was in agreement with the final fruit-setting ratio (Fig. 2). A correlation analysis was performed using the above factors. The analysis indicates that the seed number, GR F1 and SR F1 were positively correlated with fruit-setting ratio, but none of these factors reached significant levels (P > 0.05).
Table 3. Pollination efficiency and growth of F1 progeny.
Code name PEa PUb SQc GR F1 (%)d SR F1 (%)e L × B 500−600 5 537 70.90 96.32 J × L 500−600 5
299
78.26
98.29
B × L
500−600
5
220
45.45
75.00
Mean352 65.87 89.87 a Pollination efficiency. The quantity of per capita pollination per day (PE). b Pollen utilization. The quantity of pistillate flowers pollinated by one staminate flower (PU). c Seed quantity (SQ). d Germination rate of F1 group (GR). e Survival rate of F1 group (SR). False-hybrid identification of F1 progeny
-
The 32 SSR primer pairs used in this identification show that Critical Δ was approximately equal to 0 and 3.75 for the 95% and 99% confidence levels, respectively (Table 4), demonstrating that the candidate offspring were recognized as false-hybrids when the Δ values were less than the corresponding confidence. Therefore, nine false-hybrid individuals (4802, 4806, 4901, 4910, 5117, 5301, 5314, 5418, and 5513) were observed among the 184 candidate offspring at the 95% confidence level. A higher number of false-hybrid individuals at the 99% confidence level was observed, including seven false-hybrid individuals (4902, 5213, 5318, 5320, 5505, 5508, and 5519) in addition to the ones observed at the 95% confidence level (Table 4). Moreover, the number of mismatching loci for all false-hybrid individuals ranged from one to nine (Fig. 5), and four false-hybrid individuals (4806, 4901, 5117, and 5513) had the highest number of mismatching loci. Interestingly, only one mismatching loci was observed for all SSR markers in the additional seven false-hybrid individuals found at the 99% confidence level, while more than one mismatching loci was discovered in the nine false-hybrid individuals observed at the 95% confidence level.
Table 4. Parentage identification statistics.
Code Confidence Critical Δ No. of
false-hybridFalse-hybrid
rate (%)J × L 99% 3.75 16 8.70 95% > 0 9 4.89 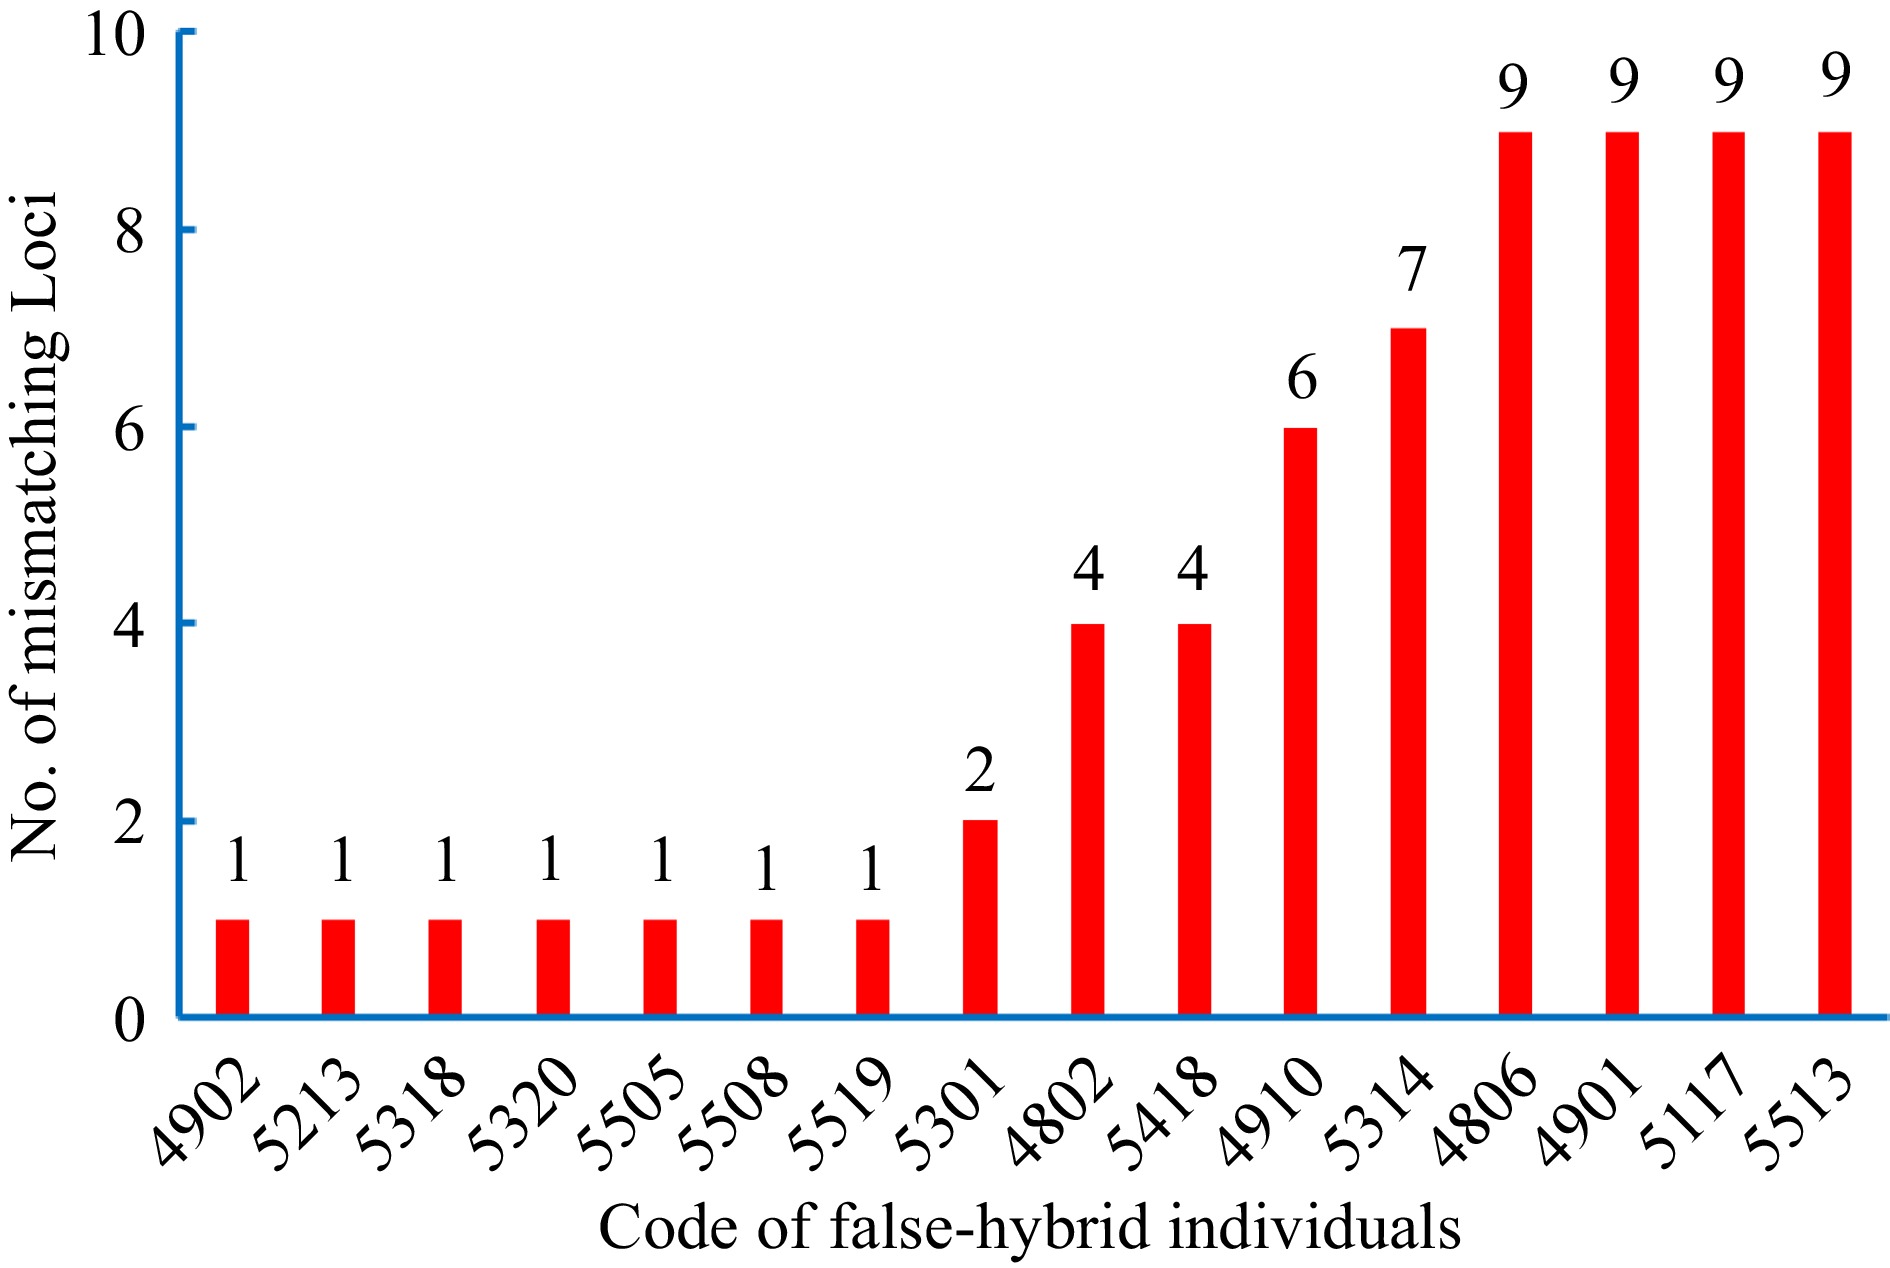
Figure 5.
Number of mismatching bands in the false-hybrid individuals.
Optimization of SSR identification
-
With increasing numbers of SSR primers, the quantity of false-hybrid individuals detected at the 95% confidence level shows a gradual increasing trend (Fig. 6). Figure 6 shows that no false-hybrid individual was detected when using fewer than five primers. Moreover, when at least 15 primers were used, a marker from each linkage group was involved in the identification, resulting in approximately 90% false-hybrid individuals being detected. Finally, accurate identification was achieved when more than 20 primers were utilized.
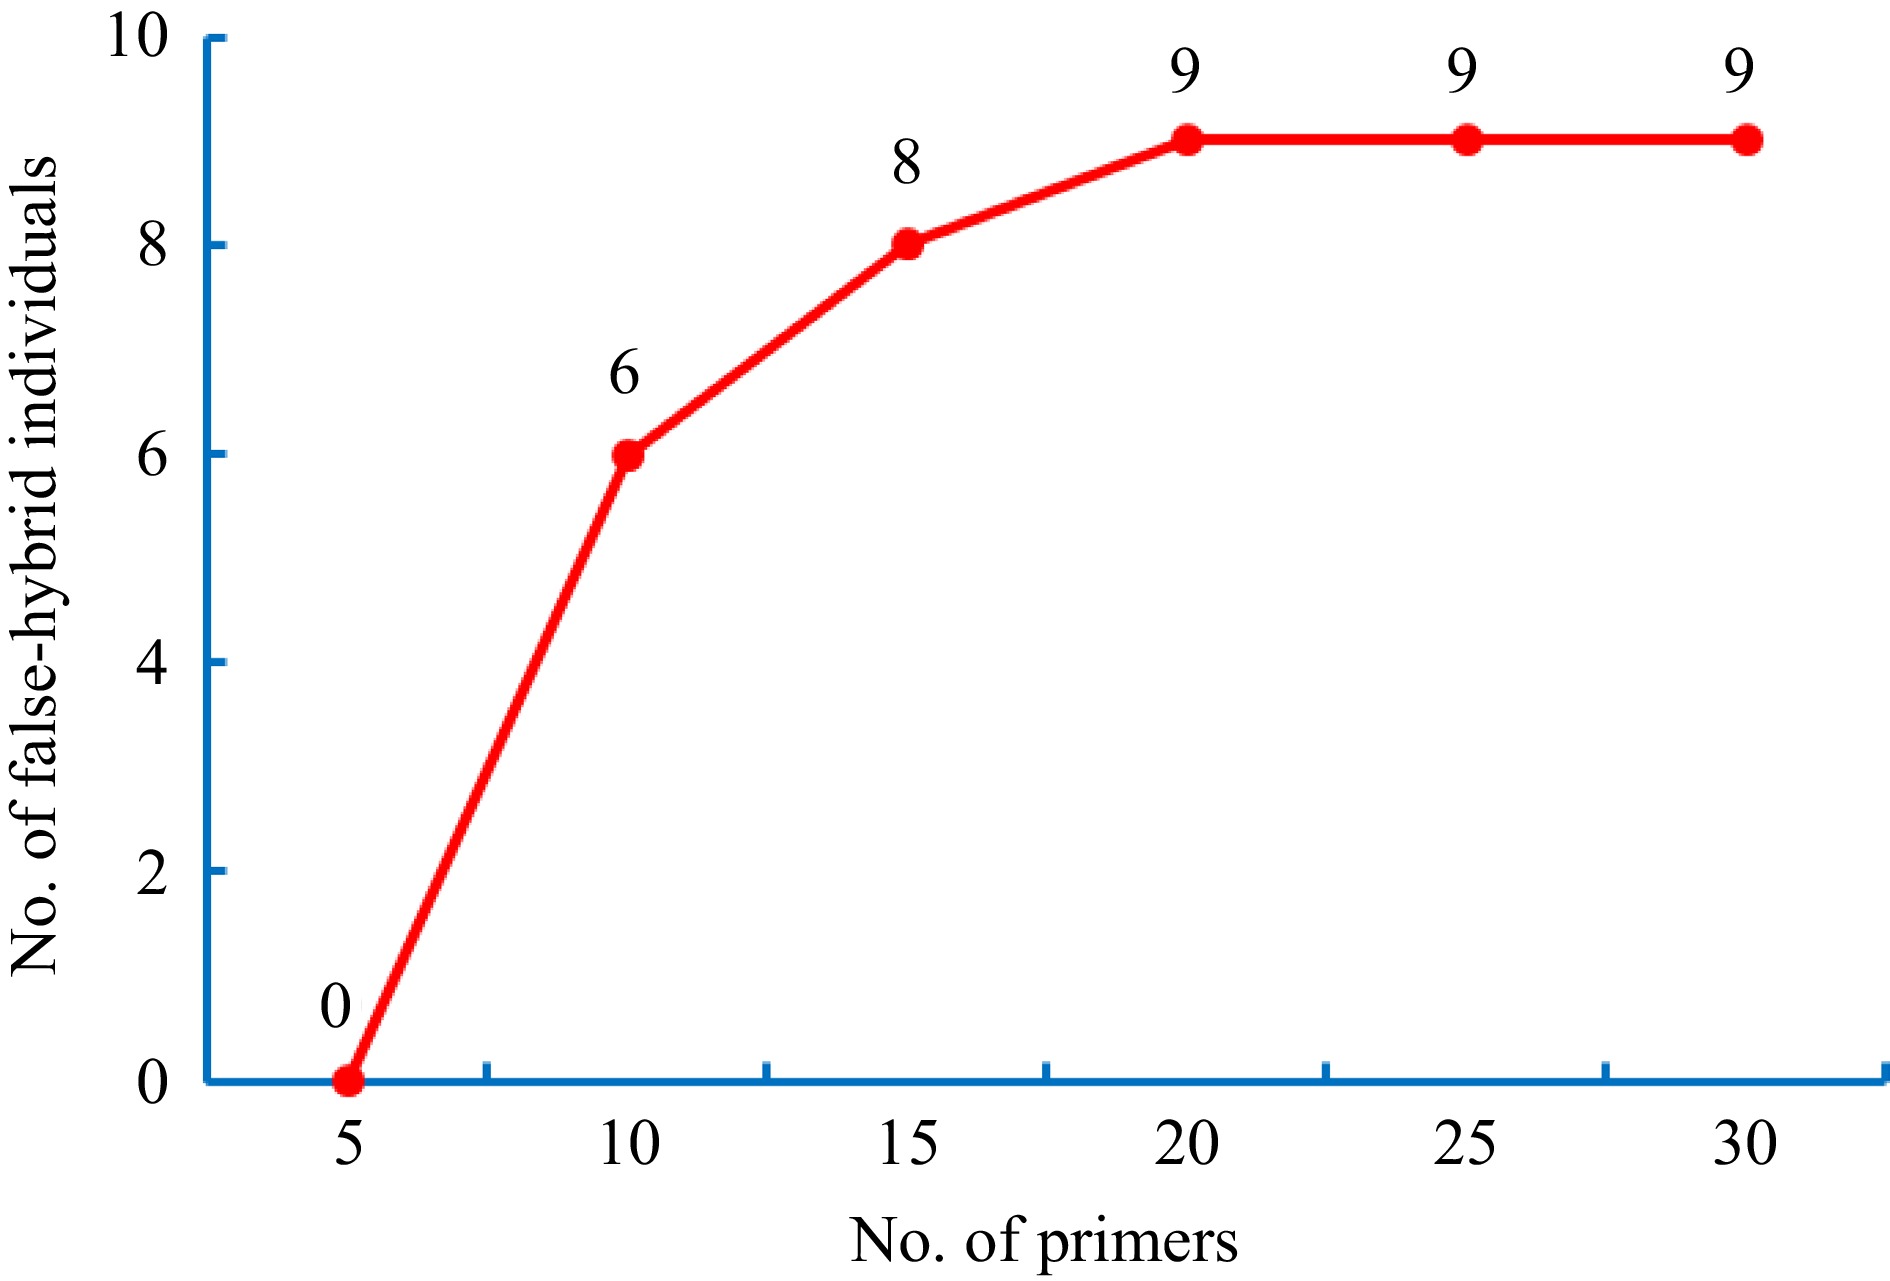
Figure 6.
Influence of the number of primers for false-hybrid identification (95% confidence).
-
Natural pollination mainly relies on insects[18], birds[19], and wind[20], as pollinators for many flowering plants, which results in a lower quality of offspring and production compared to artificial pollination. Particularly, the fruit-setting ratio of natural pollination ranges from 0.98% to 2.7%, and the majority of seeds have low seed vigour in tea plants due to limited outcrossing opportunities, insufficient pollination and pollen tube damage[6,21]. In our study, petals were used to replace brushes as pollination tools because they are soft, which avoided damage to the pollen tube. Moreover, the petals have a high absorbance capacity that can provide an abundance of pollen to the pistil. Assessment of the growth of the F1 population indicates that this method was beneficial to produce healthy seeds to improve the survival rate of the F1 population.
Environmental factors, such as the pollination site and temperature, may affect pollen performance[22]. Our study surveyed the relative influence of the fruit-setting ratio and rainfall during the initial pollination stage, and a significant interaction between these factors was found. Field observation indicates that a portion of the pollinated flowers was ruined after each rainy period. Thus, we speculated that the frequency of heavy rain may have attributed to the sharp decrease in the fruit-setting ratio as indicated by our data analysis (Fig. 3 & 4). Therefore, this study suggests that the pollination site should be a tea region that has little rainfall after pollinating to avoid the loss of pollinated flowers.
In recent years, several studies have demonstrated that the artificial pollen mixture can increase the quantity of progenies. For example, Hansen & Nielsen used three Abies nordmanniana female parents and the mixed pollen from three A. nordmanniana male parents[23]. The results show that all maternal parents produced more progenies than expected. Similarly, the mixed pollen method has been shown to be effective in improving the average fruit-setting ratio to reach at least 13% in tea plants[23, 24]. However, although mixed pollen can increase seed quantity, it decreases the purity of the F1 population. In our study, the petal-assisted method avoided this issue. This method produced an average fruit-setting ratio of 12.90% with a false-hybrid rate of only 4.89% at the 95% confidence level. Moreover, the false hybrids were readily identified and eliminated using SSR markers. Therefore, the method was considered appropriate for structuring a pure F1 population.
In addition, we evaluated if the quantity of SSR markers had an impact on the accuracy of identification. To compare the effectiveness among SSR markers, we set up six gradients of SSR markers for identification with an increase of five SSR markers in each gradient. As a result, all false-hybrid individuals were detected when using more than 20 SSR primers. In contrast, if less than 20 SSR markers were used, it was difficult to detect all false-hybrid individuals. Moreover, we were unable to detect any false-hybrid individuals if less than five SSR markers were used. Thus, we concluded that at least 20 SSR markers were necessary to obtain accurate results. If the number of SSR markers is continually increased, it will lead to higher costs and more time-consuming procedures. Based on previous studies, the present study used tea plants that had 15 linkage groups[12, 25, 26]. Therefore, combined with the quantity of linkage groups and SSR markers, our data suggest that one to two SSR markers randomly selected from each linkage group are appropriate for false-hybrid identification of F1 progeny according to the higher confidence level. The result will be useful for the development of tea breeding technology. Future relative studies in this field will not only deepen our understanding of tea genetics, but also facilitate the application of new technologies in tea breeding.
This subject was supported by the Chinese Modern Agricultural Industrial Technological System (CARS-19) and the Key Scientific and Technological Project for New Variety of Tea Plant Breeding of Zhejiang Province (2016C02053).
-
The authors declare that they have no conflict of interest.
-
# These authors contributed equally: Liyuan Wang, Liyi Xu
- Copyright: © 2023 by the author(s). Published by Maximum Academic Press, Fayetteville, GA. This article is an open access article distributed under Creative Commons Attribution License (CC BY 4.0), visit https://creativecommons.org/licenses/by/4.0/.
-
About this article
Cite this article
Wang L, Xu L, Aktar S, He M, Wu L, et al. 2023. Petal-assisted artificial pollination method enhanced the fruit setting ratios in tea plant (Camellia sinensis). Beverage Plant Research 3:7 doi: 10.48130/BPR-2023-0007 

Petal-assisted artificial pollination method enhanced the fruit setting ratios in tea plant (Camellia sinensis)
- Received: 25 November 2022
- Revised: 22 January 2023
- Accepted: 30 January 2023
- Published online: 08 March 2023
Abstract: Pollination methods play an important role in developing F1 populations. Our study presents an improved method of petal-assisted artificial pollination in tea plants. The field operation using this method exhibited high efficiency in which more than 500 pistillate flowers per day can be pollinated per capita, and the pollen amount from only one staminate flower was sufficient to pollinate more than five pistillate flowers. Additionally, we surveyed the fruit-setting ratio in three F1 groups, which were established using this method and the influence of rainfall on the fruit-setting ratio. The results indicate that the fruit-setting ratio was superior among the tested F1 population with an average value of 12.90%, and a significant negative correlation was observed between rainfall and fruit-setting ratio. By analyzing the growth states of each F1 population, both a high germination rate and survival rate were observed. Furthermore, the purity for 184 individuals in the F1 population of 'Jiaming 1' × 'Longjing 43' (J × L) were analyzed with 32 selected simple sequence repeats (SSRs). The purposes of this paper are (1) to demonstrate that this method is beneficial to establish high purity F1 populations and (2) to identify the number of SSR markers that are suitable for identification. The parentage analysis detected nine false-hybrid individuals, and the rate of false-hybrid was only 4.89% at 95% confidence, demonstrating that a low false-hybrid rate can be achieved using the method. Furthermore, one to two SSR markers randomly selected from each linkage group or chromosome were recommended as a sufficient quantity for SSR identification.
-
Key words:
- False-hybrid /
- SSR markers /
- Artificial pollination /
- Fruit-setting ratio