


-
Tea, cocoa, and coffee are the three major non-alcoholic beverages in the world. Tea was first found and consumed in China as a beverage as early as 5,000 years ago[1, 2]. In China, tea is an important cash crop, with 3,264.1 kilo hectares (kha) of planting acreage, 2916.4 kha of harvested area, and 3,063.2 kilotons of tea production in 2021 (
www.ctma.com.cn ).The tea plant (Camellia sinensis (L.) O. Kuntze) originated in Yunnan China[3], and its natural distribution area covers mainly southwest China, south China, and north southeast Asia. Because of self-incompatibility and a long history of introduction, tea plants have high heterozygosity and a wide range of genetic diversity[4, 5]. With the completion of the tea genome assembly, many tea germplasms have had their genomes re-sequenced to evaluate the evolutionary and phylogenetic relationships of tea germplasms.
Hunan is located at the evolutionary transitional zone edge of the Yunnan-Guizhou plateau[5, 6], and tea germplasms are abundant, including four representative landrance tea germplasms, 'Rucheng Baimaocha' (RCBM), 'Chengbu Dongcha' (CBDC), 'Jianghua Kucha' (JHKC) and 'Anhua Yuntai' (AHYT)[7]. These tea landraces differ not only morphologically but also in their processing suitability, cold resistance, and yield[8, 9]. The study of such abundant tea germplasms can help clarify the origin and evolution of tea cultivars and landraces and provide effective ways to interpret and determine the functions of specific genes that can be used for plant breeding.
In this study, 36 tea plants of four Hunan tea landrace were collected. Based on whole-genome resequencing data, the main objectives were to (1) characterize the SNPs and INDEL variations in the four landrace populations, (2) gain insight into the phylogenetic relationships and population structure of four landrace populations, and (3) investigate selected genes related to population differences between AHYT and other three populations.
-
The 36 accessions newly sequenced in this study are listed in (Table 1, Supplemental Table S1, Fig. 1). Eleven 'Rucheng Baimaocha' (RCBM) were sampled from Rucheng country of Hunan province and Renhua country of Guangdong province, nine 'Chengbu Dongcha' (CBDC) were sampled from Ziyuan country of Guangxi and Chengbu country of Hunan province, eight 'Jianghua Kucha' (JHKC) were sampled from Jianghua country of Hunan province, eight 'Anhua Yuntai' were sampled from the Tea Germplasm Repository of Tea Research Institute, Hunan Academy of Agricultural Sciences (28.477379° N, 113.354626° E, Changsha, Hunan, China). One bud and a leaf were sampled from the ancient tea plant, and then were stored in a −80 °C freezer.
Table 1. Sampling information of four Hunan tea landrace populations.
Populations Abbreviation Sample
sizeOrigin Plant type Processing
suitabilityPlanting region Chengbu Dongcha CBDC 9 Chengbu County Arbor and semi-arbor Black tea, Green tea Hunan and Guangxi Provinces Jianghua Kucha JHKC 8 Jianghua County Arbor and semi-arbor Black tea Southern Hunan Rucheng Baimaocha RCBM 11 Rucheng County Shrub and semi-arbor Black tea, White tea Guangdong and Hunan Provinces Anhua Yuntai AHYT 8 Anhua County Shrub Black tea, Green tea Throughout China 
Figure 1.
Representative resources of four tea populations.
Determination of biochemical composition
-
The first batch of one bud and two leaves were collected in spring, steamed for 2 min, and then dried at 90 °C. The water extracts, tea polyphenols, total amino acids, and caffeine content of 36 accessions were determinated according to GB/T 8305-2013, GB/T 8313-2002, GB/T 8314-2013, and GB/T 8312-2013 (HPLC), respectively. The Box plot and T-test were completed using an online tool (
www.omicshare.com/tools ).DNA extraction and sample sequencing
-
The total genomic DNA was extracted from tea leaves using a commercial DNA extraction kit (Tiangen, Beijing, China) following the manufacturer's instructions. Library construction and sequencing were completed at Novogene Bioinformatics Technology Co Ltd (Beijing, China). The insert size of the libraries was 500 bp, and the length of the pair-end reads was 150 bp. Genomes sequenced using next-generation sequencing technology on an Illumina HiSeq 2000 platform (Illumina, San Diego, CA, USA).
Read mapping, SNP calling and, SNP annotation
-
The high quality paired-end reads were mapped to the C. sinensis var. sinensis 'Shuchazao' reference genome using BWA (v0.7.12) with the parameter: 'mem -t 4 -k 32 -M'. PCR or optical duplicates were removed using SAMtools v 0.1.19 (parameter: rmdup)[10]. Low-quality SNPs were filtered out by minimum minor allele frequency (mnMAF > 0.05) and missing data per site (MDpS < 10%), and finally converted into a variant call format file (VCF). We performed SNP calling on a population scale using a Bayesian approach as implemented in the package SAMtools[11]. The high-quality SNPs obtained here were subsequently used SNP annotation through ANNOVAR package v 2018-04-16[11]. The draft genome sequence of CSS 'Shuchazao' was downloaded from
https://ftp.ncbi.nlm.nih.gov/genomes/all/GCF/004/153/795/GCF_004153795.1_AHAU_CSS_1/GCF_004153795.1_AHAU_CSS_1_genomic.fna.gz [5]. The gene annotation and TE annotation used in this study were also obtained from the draft genome sequence of CSS 'Shuchazao'[12].Population structure analysis
-
A neighbor-joining tree was constructed using the program TreeBeST (v1.92) (
http://treesoft.sourceforge.net/treebest.shtml ) with 1000 bootstrap replicates. The tree was displayed using MEGA7 and Fig Tree (v1.4.2) (Fig Tree:http://tree.bio.ed.ac.uk/software/figtree/ ). The principal component analysis was performed using PLINK v1.07 software with default parameters (http://pngu.mgh.harvard.edu/~purcell/plink/ )[13]. ADMIXTURE (v1.23) was used to infer population structure[14]. To identify the best genetic clusters K, cross-validation error was tested for each K value from 2 to 8. The termination criterion was 10–6 (stopping when the log-likelihood increased by less than ε = 10–6 between iterations). Nucleotide diversity (θπ), and population differentiation statistics of fixation index (FST) using VCFtools v 0.1.14[15].Selective sweep
-
To identify potential selective sweeps between population A and population B, log2(πB/πA) and FST was calculated together using VCFtools with a 20 kb sliding window and a step size of 10 kb. Windows that contained less than 10 SNPs were excluded from further analysis. The windows that were simultaneously (1) in the top 5% of Z-transformed FST values and (2) in the bottom 5% log2(πB/πA) were considered to be candidate selective regions in population A. The genes in the merged candidate selective regions along the tea genome were considered as candidate selective genes.
-
Tea plants of 36 accessions from four landraces were subjected to genomic resequencing, and approximately 1,670 GB of high-quality reads were obtained against the reference genome, with an average quality score of 20 (Q20), mapping rate of 92.44%–98.94%, and coverage depths of 11.05–17.09X. The RCBM population showed the least number of clean bases, clean reads, mapped reads, average depth, and coverage (at least 4X) among the four populations (Table 2). Across the samples, we identified an average of 1.38 million (M) SNPs (range = 1.11–1.47 M SNPs) and 6.82 × 10³ INDELs (range = 5.06–7.65 × 10³ INDELs). AHYT showed the lowest number of average SNPs and average INDELs, respectively, and CBDC showed the greatest number of average SNPs and average INDELs (Supplemental Table S2).
Table 2. Summary statistics for whole-genome resequencing.
Sample AHYT RCBM CBDC JHKC Raw bases (bp) 46408354867 41563182791 47080373438 43453617038 Clean bases (bp) 46253486600 41447606318 46953944550 43328803425 Effective rate (%) 99.66 99.72 99.73 99.71 Q20 (%) 96.96 97.16 97.07 96.70 GC content (%) 39.63 40.55 39.48 39.48 Clean_reads 308356577 276317375.5 313026297 291543979.2 Mapped_reads 302704469 265177407 306306291 283301609 Mapping_rate (%) 98.13 96.03 97.83 97.22 Average_depth 14.33 12.56 14.36 13.64 Coverage_4X 76.14% 68.31% 74.33% 72.96% Average SNP(bp) 1327773 1378576 1436020 1403998 Average INDEL(bp) 6561 6777 7212 6766 Phylogenetics and population structure
-
In order to illustrate the phylogenetic relationship and population structure of four tea populations, we downloaded the genome sequences of 62 tea germplasms on NCBI (Supplemental Table S3), included 1 C. Atrothea (CSR), 1 C. crassicolumna (CSR), 3 C. taliensis (CSR), 21 C. sinensis var. assamica (CSA), 8 C. sinensis var. pubilimba (CSP), 28 C. sinensis var. sinensis (CSS). Based on the SNPs of 98 accessions, population structure, neighbor-joining (NJ) phylogenetic tree and principal component analysis (PCA) were constructed to demonstrate the genetic relationship and population structure of the 98 accessions. Generally, the minimum CV (Cross-validation) error value is the best K (Fig. 2a). When k = 3, the 98 tea accessions were divided into three groups, the first group included 22 accessions mainly were C. sinensis var. assamica, the second group included 23 tea varieties (C. sinensis var. sinensis) mainly from Zhejiang and Fujian province, and the third group mainly included four Hunan tea landraces, and some tea varieties from Guizhou, Sichuan and Chongqing. It is worth noting that 'Yaoshan Xiulv' from Guangxi is also divided into the second group because it has been bred from local tea species of Zhejiang Province (Fig. 2b & c). The results of PCA analysis were also consistent with the results of population structure analysis, the 98 tea accessions were mainly divided into three groups (Fig. 2d).
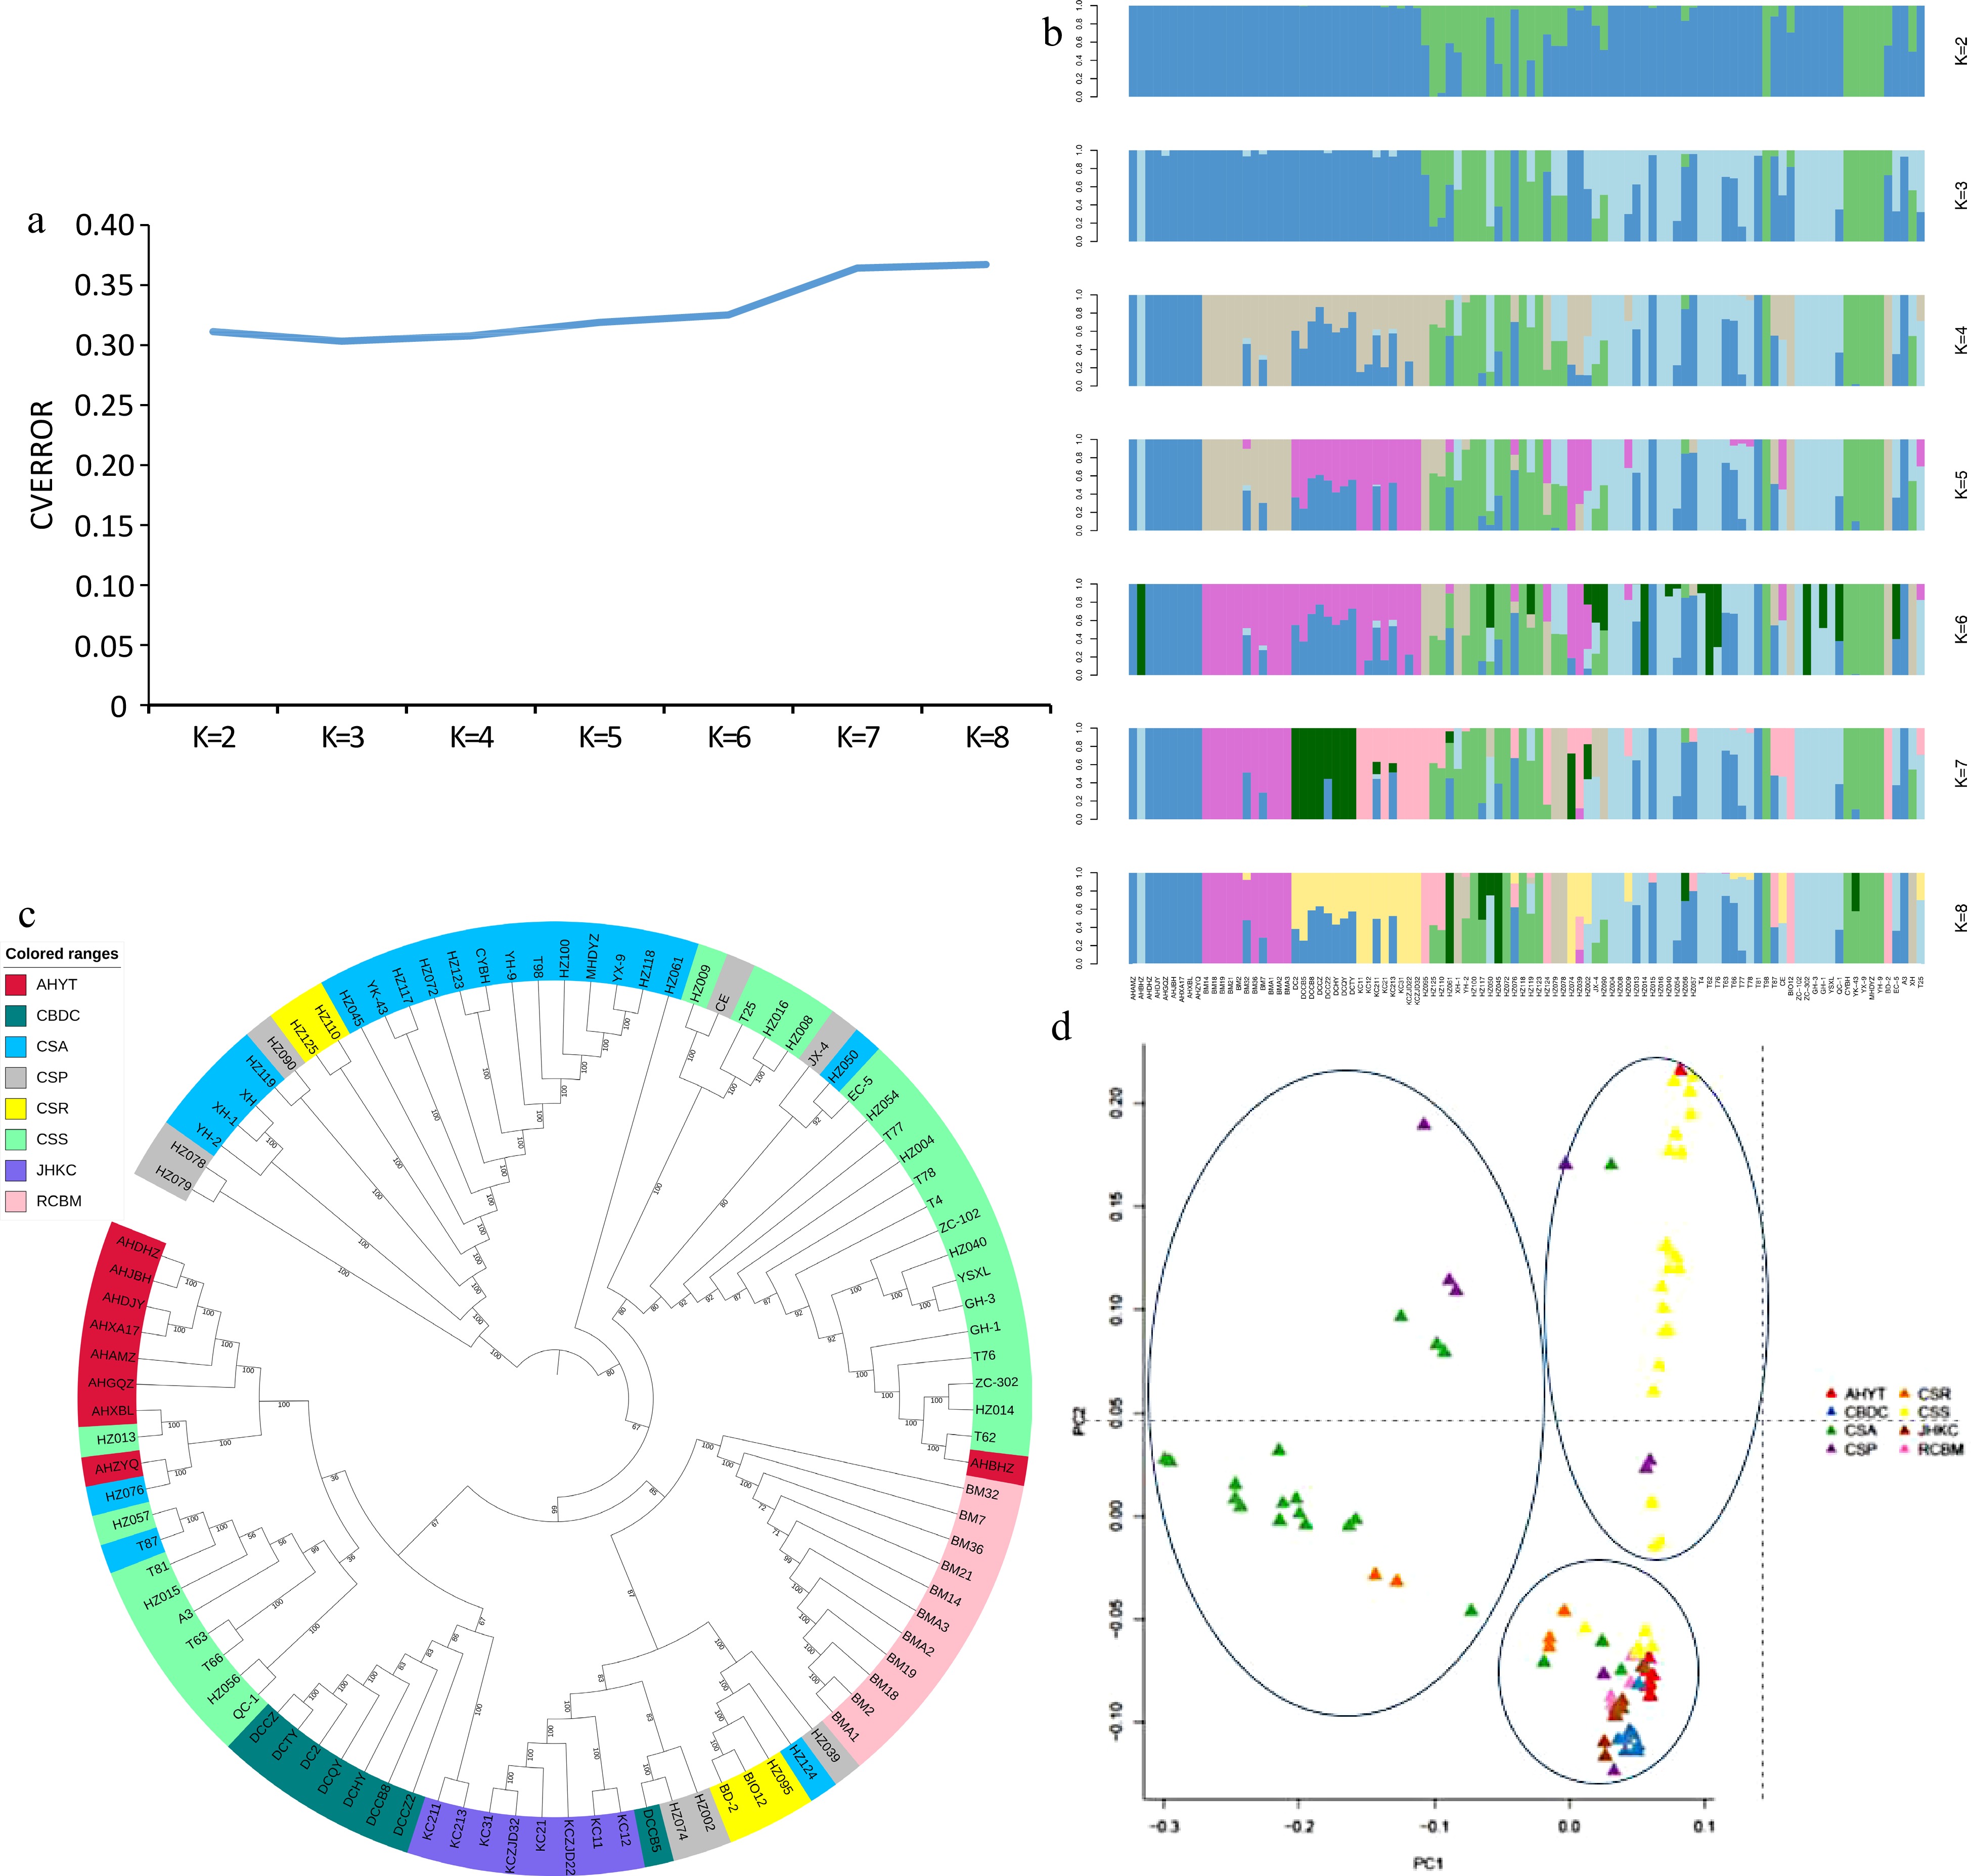
Figure 2.
(a) Cross-validation error results of different K values. (b) Population genetic structure of 98 accessions. The length of each colored segment represents the proportion of the individual genome inferred from ancestral populations (K = 2−8). (c) NJ tree of the 98 tea accessions. (d) PCA plot of the 98 tea accessions.
The third group also can be further divided into three subgroups: CBDC, AHYT and some tea varieties from Guizhou, Sichuan and Chongqing are clustered into one group, RCBM and JHKC are separately divided into one subgroup. The genetic differentiation coefficients of the four populations also prove this, the pairwise fixation index (FST) between four populations varied from 0.039 to 0.122 (Fig. 3a). The distance for CBDC-AHYT was the lowest among all the population pairs analyzed (FST = 0.039), and that for RCBM-AHYT was the highest (FST = 0.122). Thus, RCBM and AHYT populations have obvious genetic divergence. The FST values are consistent with the result of the NJ pairwise genetic distances, where the genetic relationship between RCBM and the other groups is distant. The nucleotide diversity (θπ) of the four groups varied from 0.039 to 0.122, with CBDC showing the highest diversity and RCBM harboring the lowest diversity. Generally, the linkage disequilibrium (LD) value of domesticated species tends to be higher than that of wild species due to positive selection. In our findings, the LD decay rate was the fastest in RCBM and slowest in JHKC (Fig. 3b).

Figure 3.
Genetic diversity and divergence of four tea populations. (a) θπ and FST among four tea populations. (b) LD decay of four tea populations.
Potential selected genes related to population differences
-
AHYT landrace is one of the first batch national tea varieties that has been certified by the National Crop Variety Approval Committee in China. 'Zhuyeqi', 'Xiangbolv', and 'Baihaozao' were also screened from the AHYT landrace, because of its strong cold resistance, high yield, and excellent green and black tea quality, which have been popularized not only in Hunan but also in the southern region of the Yangtze River tea-growing areas such as Henan and Shandong provinces[16]. In order to decipher the selected genes and reveal the molecular mechanism of differences between AHYT and other three populations, we scanned the tea genome for regions among CBDC and AHYT, JHKC and AHYT, and RCBM and AHYT, and found 407, 380, and 147 candidate genes, respectively, in the top 5% of both FST and Log2Ratioθπ scores (Fig. 4a−4c, Supplemental Table S4−S6). Thirty-three genes were found in all three groups (Fig. 4d). All candidate genes were used for gene annotation and NCBI blast.
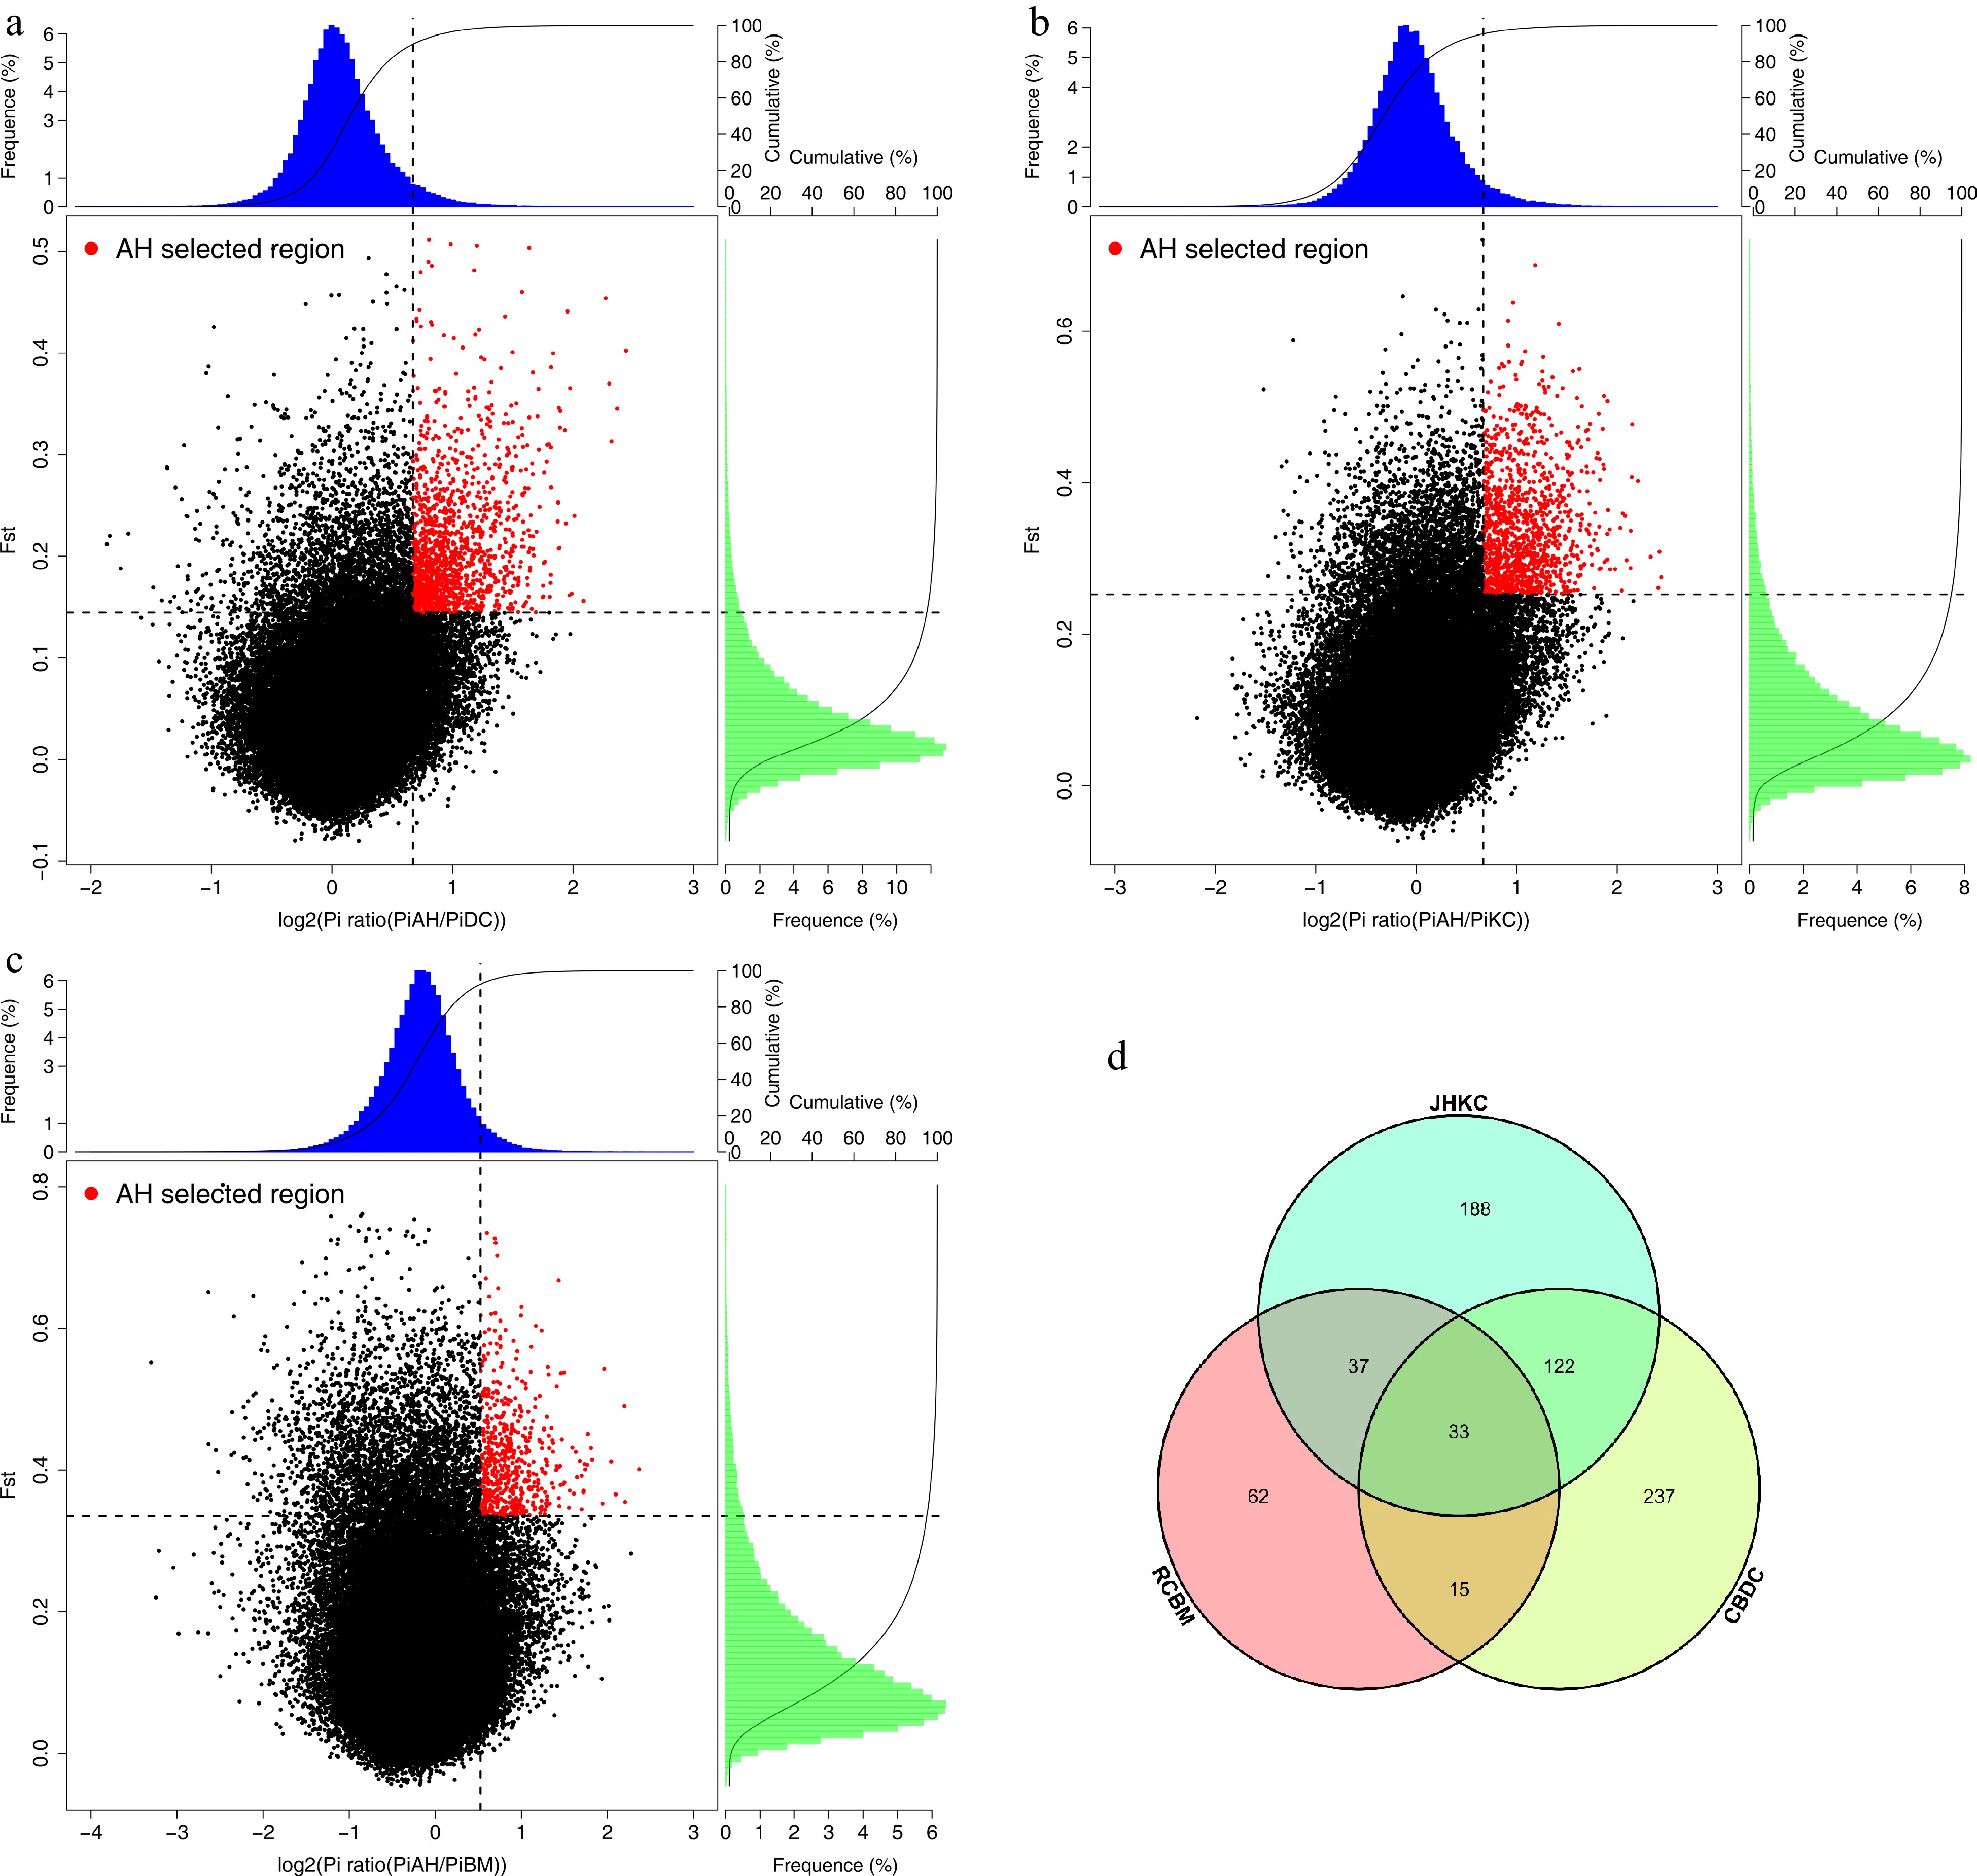
Figure 4.
Selected genes were identified in AHYT. (a) Distribution of Log2(θπ AHYT/θπ CBDC) and Z(FST) calculated values. (b) Distribution of Log2(θπ AHYT/θπ JHKC) and Z(FST) calculated values. (c) Distribution of Log2(θπ AHYT/θπ RCBM) and Z(FST) calculated values. The red points are selected genomic regions under 5% value of Z(FST) and Log2(θπ AHYT/θπ control populations). (d) Venn diagram of selected gene numbers.
Among the candidate genes for the CBDC population, six genes that have been reported in tea plants were identified. These genes were mainly involved in stress tolerance and biosynthesis of important secondary metabolites. One such gene was TEA010590, encoding a transcription factor basic-helix-loop-helix (CsbHLH) (GenBank: HQ660376), which may be involved in hormonal signal transduction, including that for abscisic acid, methyl jasmonate, and gibberellic acid, as well as abiotic stress responses in tea plants[17]. Another gene, TEA028050, may encode tea caffeine synthase (CsTCS) (GenBank: AB031281), which has a functional role in caffeine biosynthesis in tea plants[18].
Among the candidate genes for the JHKC population, 380 candidate genes were identified: six genes that have been reported in tea plants were identified, and these genes are mainly involved in stress tolerance. These genes are as follows: TEA001486, encoding CsbZIP4 (GenBank: KC008714), which may function as a positive regulator of salt stress response through the SOS1 pathway[19]; TEA025462, encoding hexokinase (CsHXK3) (GenBank: KX078245), which plays an important role in the regulation of cold responses in the tea plant[20]; and TEA032012, encoding auxin response factor 1 (CsARF1), which is relevant for the regulation of bud dormancy and bud break in the tea plant[21]. It is worth noting that the ascorbate peroxidase (APX) gene was also identified in both CBDC (GenBank: JQ011381) and JHKC (GenBank: JQ011380). Thus, APX is a key enzyme in the antioxidant reaction and an important component of plant response to environmental stress[22].
Among the candidate genes for the RCBM population, 147 selection candidate genes were identified, and only TEA032966 was reported in the tea plant. This gene encodes cinnamyl alcohol dehydrogenase 3 (CsCAD3), which is pivotal in the synthesis of the monomeric precursors of lignin[23].
-
Tea is a perennial and self-incompatible cash crop. Because of its long-term domestication and ability to hybridize, its genetic background is complex. This also makes it difficult to classify different hybrid offspring accurately[3, 24−26]. In addition, many morphological features are continuous, which makes it challenging to classify tea germplasm using morphological methods, and traditional morphological classification is sometimes inconsistent with the recent classification based on molecular features. Traditional morphological characterization and whole-genome analysis differ hugely in many aspects[27, 28]. To explain the evolutionary process of the tea plant more intuitively, further studies are needed to decipher the classification from wild tea into the domesticated tea plant[29]. C. sinensis var. assamica is characterized by larger leaves, suitable for black tea processing, and an arborous or a semi-arborous habitat, whereas C. sinensis var. sinensis is characterized by shrub growth habitat, medium or smaller leaves, and cold tolerance[30]. Although this can explain the domestication process of the tea plant, there are also some challenges in the actual classification.
CBDC and JHKC are arborous or semi-arborous tea plants with large leaves. Studies based on morphology, anatomy, cytology, enzymology, chemistry, and molecular biology have shown that CBDC and JHKC belong to the transition type of genetic evolution of tea germplasms, which may be domesticated from the original type of Yunnan Daye and could be classified into C. sinensis var. assamica. The species of AHYT are mainly shrub type, medium and small leaf resources, which could be classified into C. sinensis var. sinensis. RCBM is one of the representative germplasm resources of C. sinensis var. pubilimba, is distantly related to CBDC, JHKC, and AHYT[31−35]. To verify the taxonomy of 36 tea accessions, before this study, we analyzed the water extracts, tea polyphenols, total amino acids, and caffeine content of these 36 accessions (Fig. 5). The results showed that CBDC and JHKC had higher contents of water extracts and tea polyphenols than AHYT, which was consistent with published results[36]. However, based on the results of phylogenetic analysis, PCA, and population genetic structure, when K = 4, 36 tea accessions were divided into two groups: CBDC and AHYT, RCBM and JHKC, JHKC tea is closer to RCBM in genetic relationship, while CBDC is closer to cultivated tea resources AHYT (C. sinensis var. sinensis) in genetic background. Taking into account the population genetic structure and FST, we found that the AHYT, suitable for processing as a green and black tea, had frequent gene exchanges with CBDC, AHYT is closely related to the CBDC in genetic relationship, which is all inconsistent with previous studies using random amplified polymorphic DNA markers and morphological classification. At the same time, two C. taliensis (BIO12 and BD-2) and one C. crassicolumna (HZ095) from Yunnan, and three C. sinensis var. pubilimba from Guangxi and Guangdong were clustered into one subgroup with JHKC, the natural hybrid progeny KC21-1 and KC 21-3 bred from JHKC population is also closer to the CBDC in genetic background.
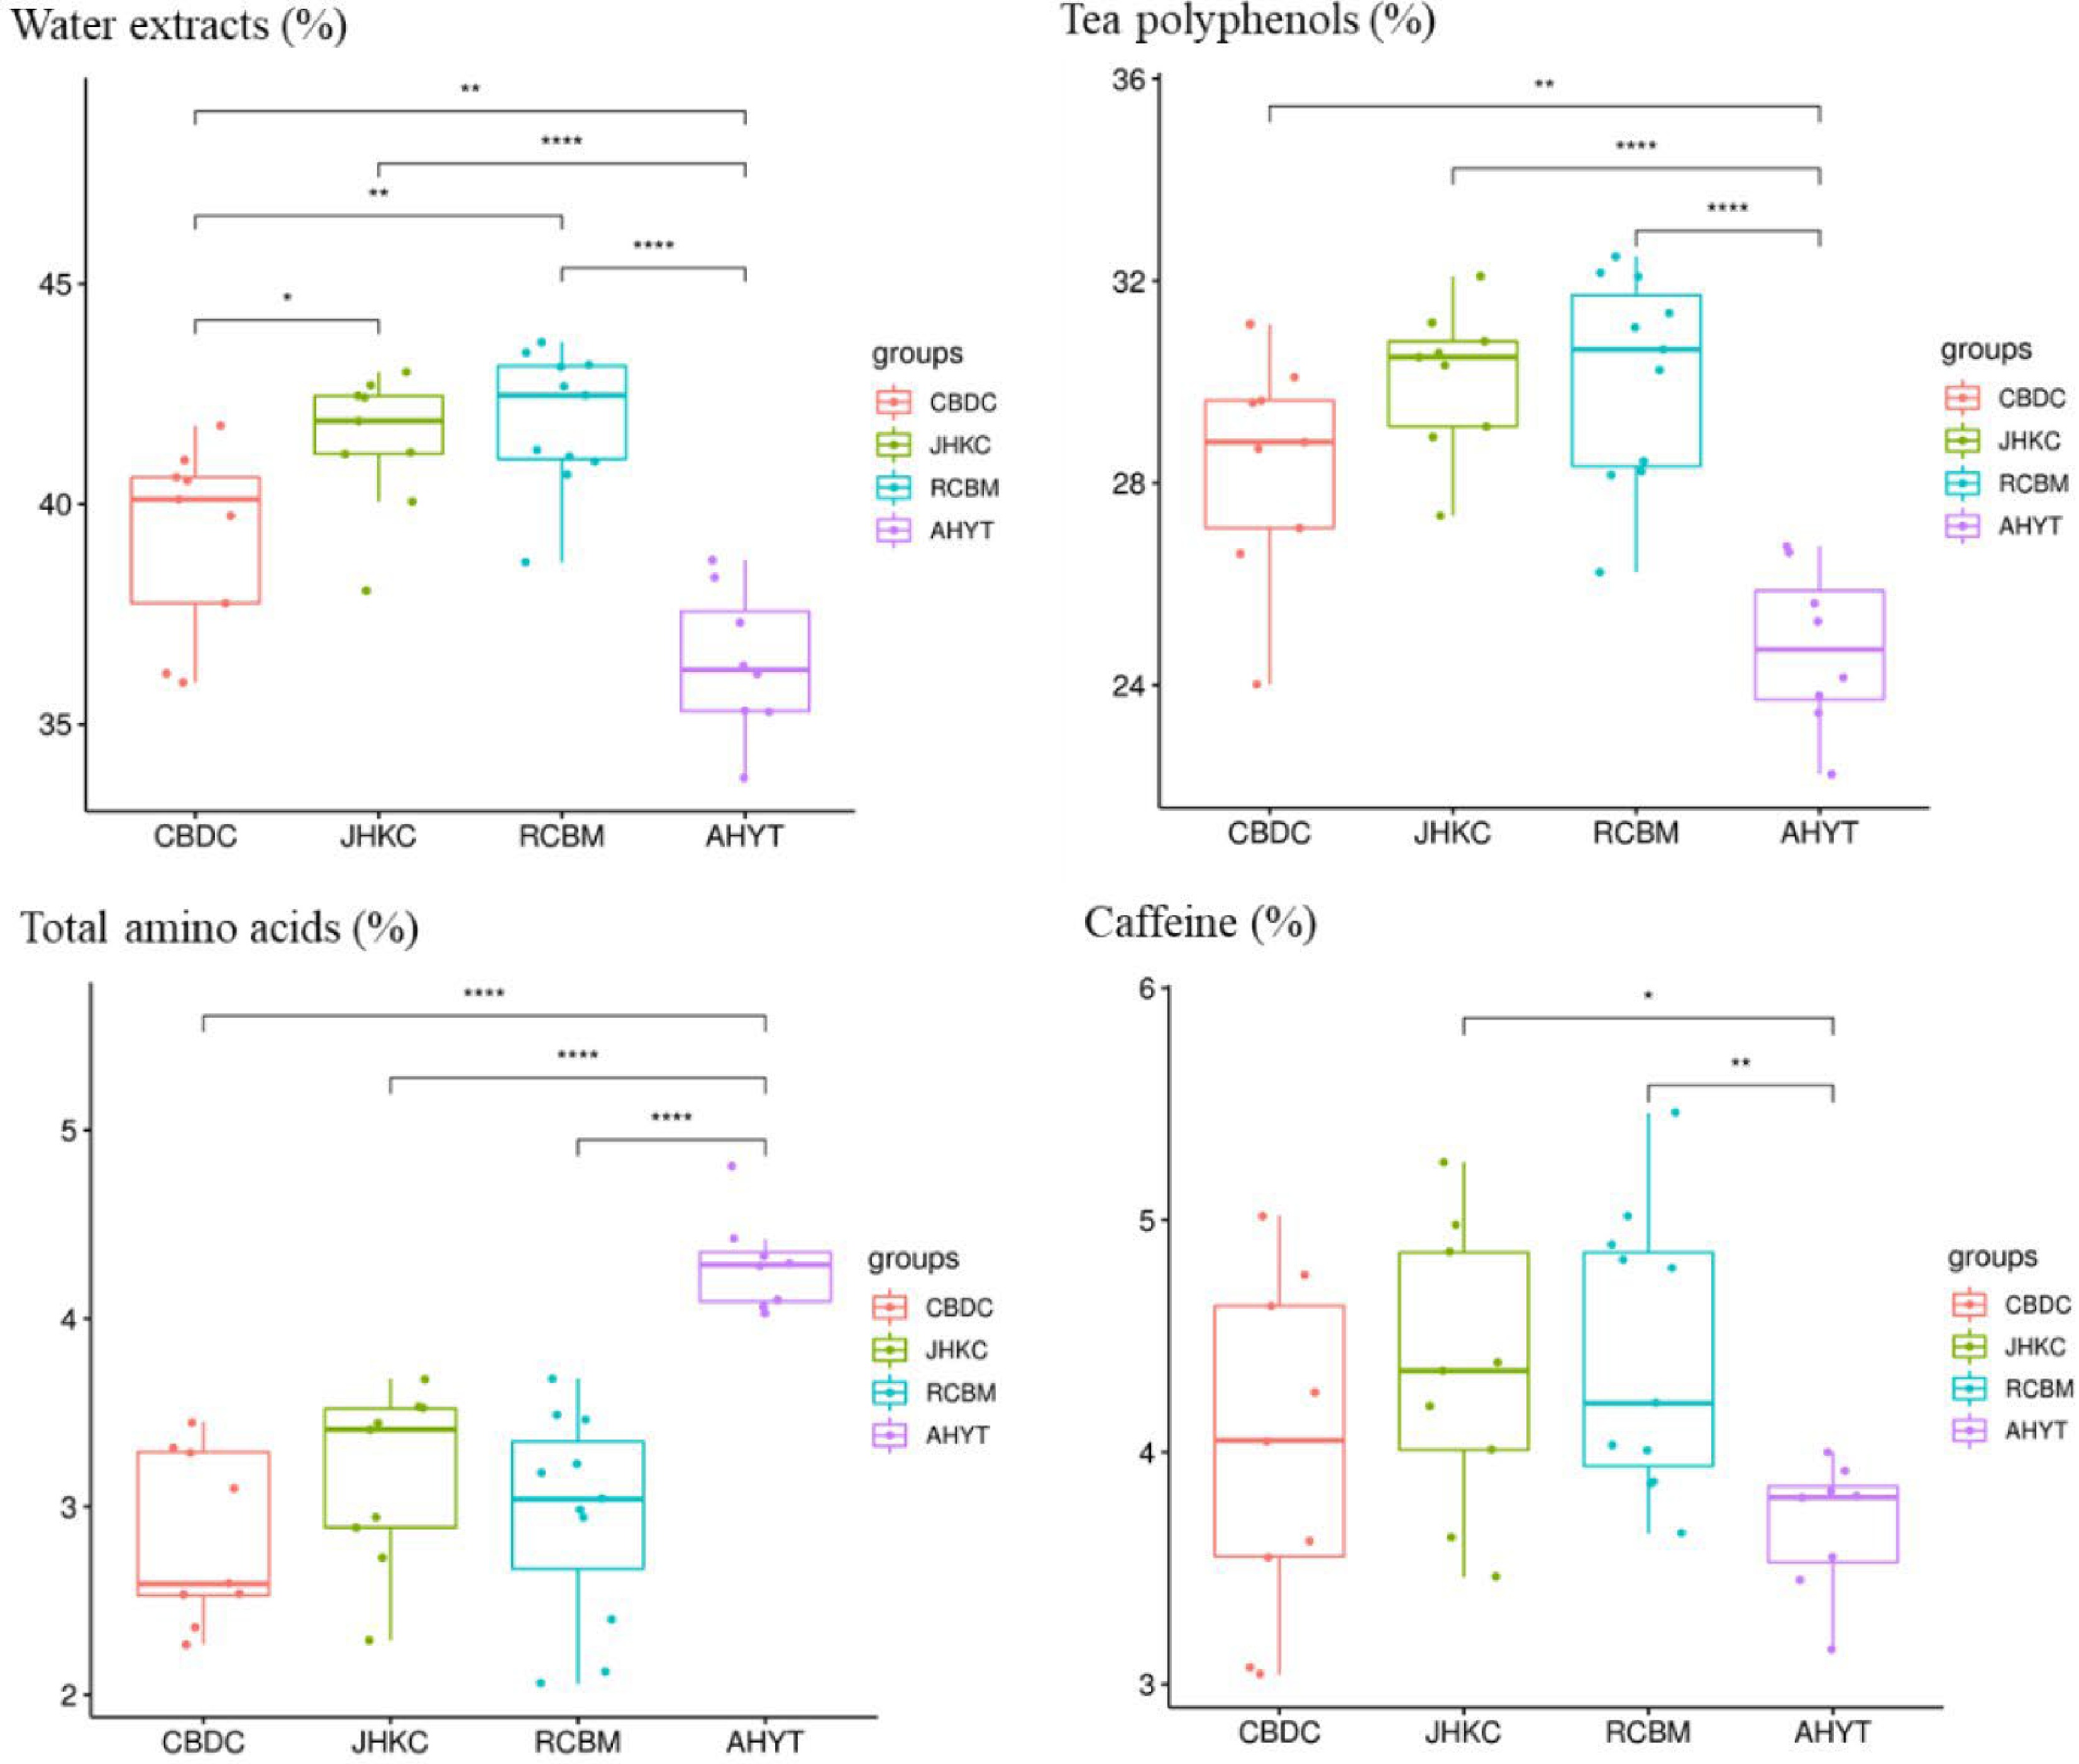
Figure 5.
Biochemical composition of four tea landraces. *, p < 0.05; **, p < 0.01; ***, p < 0.001.
According to the SNPs in our study, CBDC showed the highest number of SNPs and INDELs, respectively. This result is consistent with the θπ of four populations: CBDC had the highest genetic diversity. CBDC belong to the intermediate resource type in the transition process of tea genetic evolution. They are categorized as genotypes suited to mixed areas of trees and shrubs due to long-term introduction, domestication, and natural hybridization[36]. The combination of these factors resulted in the formation of rich genetic diversity in CBDC, which is consistent with Wang et al.[30]. Meanwhile, the cultivated population resource resulted in low genetic diversity, likely due to long-term artificial selection and tea breeding in AHYT. In general, the genetic diversity in wild types is higher than that in cultivated populations. Among the four populations, RCBM had the lowest θπ and LD decay, corresponding to its lower genetic diversity. This may be due to the poor adaptability and low yield of RCBM, which is mainly distributed in Rucheng County of Hunan Province and Renhua County of Guangdong Province[37]. Because RCBM may have experienced reproductive isolation, it might have undergone less genetic exchange with other varieties, leading to low genetic diversity.
Although many studies have shown RCBM teas to possess strong industrialization prospects because of their special botanical characteristics and tea processing quality, the low yield and low survival rate after propagation and planting have restricted its applications[37, 38]. In this study our results show that CsCAD3 was the only selective gene identified between RCBM and AHYT population that has been previously reported in tea plants. CsCAD3 may be related to lignin synthesis in tea plants and may affect the yield of RCBM[39]. Except for the genes related to the synthesis of caffeine (CsTCS2) were identified between CBDC the AHYT population, the selection genes analysis of CBDC and JHKC were chiefly related to cold stress, stress tolerance, and bud break. These results are consistent with the conclusion that the cold resistance, adaptability and yield were the main advantages in AHYT compared with other three populations[31, 37].
-
The authors declare that they have no conflict of interest.
- Supplemental Table S1 Sampling information of 36 accessions.
- Supplemental Table S2 SNPs and INDELs information of four populations.
- Supplemental Table S3 Information of 62 downloaded tea germplasms on NCBI.
- Supplemental Table S4 Selective candidate genes among CBDC and AHYT in the top 5% of both FST and Log2Ratioθπ scores.
- Supplemental Table S5 Selective candidate genes among JHKC and AHYT in the top 5% of both FST and Log2Ratioθπ scores.
- Supplemental Table S6 Selective candidate genes among RCBM and AHYT in the top 5% of both FST and Log2Ratioθπ scores.
- Copyright: © 2023 by the author(s). Published by Maximum Academic Press, Fayetteville, GA. This article is an open access article distributed under Creative Commons Attribution License (CC BY 4.0), visit https://creativecommons.org/licenses/by/4.0/.
-
About this article
Cite this article
Liu Z, Zhao Y, Yang P, Cheng Y, Huang F, et al. 2023. Population whole-genome resequencing reveals the phylogenetic relationships and population structure of four Hunan typical tea landraces. Beverage Plant Research 3:9 doi: 10.48130/BPR-2023-0009 

Population whole-genome resequencing reveals the phylogenetic relationships and population structure of four Hunan typical tea landraces
- Received: 22 February 2023
- Revised: 04 March 2023
- Accepted: 06 March 2023
- Published online: 13 April 2023
Abstract: Hunan is located at the evolutionary transitional zone edge of the Yunnan-Guizhou plateau, where tea germplasms are abundant. At present, although morphological, enzymological and molecular markers have been used to study the genetic relationship of these tea germplasms. However, due to the complexity of the genetic background of tea germplasm resources, the evolution history and taxonomy of Hunan tea germplasm is still unclear. In this study, four Hunan tea landraces from the evolutionary transitional zone were collected, including nine 'Chengbu Dongcha' (CBDC), eight 'Jianghua Kucha' (JHKC), 11 'Rucheng Baimao' (RCBM) and eight 'Anhua Yuntai' (AHYT). We used whole-genome re-sequencing to identify genetic variation, phylogenetic placement, and population structure among the four tea landraces and then scanned the genome for regions related to population potential selective. Across the samples, we identified an average of 1.38 million (M) SNPs and 6.82 × 10³ INDELs. Based on the high-quality SNPs, we performed neighbor-joining phylogenetic tree, population structure, and principal component analysis, all of which supported that the 36 tea germplasms could been divided into two groups, CBDC and AHYT were clustered into a group, and RCBM and JHKC were clustered into another group. With CBDC, JHKC, and RCBM as control, 407, 380, and 147 selected genes were identified in AHYT, respectively, were in the top 5% of FST and Log2Ratioθπ scores. The identified genes are mainly involved in stress tolerance, biosynthesis of important secondary metabolites, adaptability, and yield. These results will be helpful in the classification of tea germplasms and investigating selection–related genes.