


-
Biomass is fundamental to circular agricultural systems. The November 2021 'Glasgow Leaders' Declaration on Forests and Land Use'[1] emphasized the 'critical and interdependent roles of forests of all types, biodiversity and sustainable land use in enabling the world to meet its sustainable development goals' and committed to conserve and restore 'forests and other terrestrial ecosystems'. It avoided the complex issues of operationally defining forests, trees outside forests and (un)sustainable landuse, but was clearly inclusive in its intentions and its aim at jointly addressing mitigation and adaptation agenda's. Nearly one-third of the worlds' three billion trees[2] grow outside the world's four billion hectares of closed-canopy forests[3], and these 'trees outside forests' may well have a functional importance for modifying microclimates, cooling landscapes and increasing hydrological cycles that exceeds their relative biomass[4−6]. Part of the trees outside forests grow in urban and peri-urban environments, but the majority in agriculture and rangelands, and in agroforestry type systems. Within current IPCC reporting methods such trees outside forests can be recognized and included in overall land use change accounts but land uses such as agroforestry, that straddle the agriculture-forest divide, are still at risk of being invisible or double-counted and better data is urgently needed[7]. The recent IPCC WGIII 'Climate Change 2022'[8] report on mitigation noted a discrepancy, equating to 5.5 GtCO2 yr−1, between alternative methods of accounting for anthropogenic land CO2 fluxes, due to different representations of anthropogenic change to forests, between national GHG inventories and global modelling studies. Better representation of trees outside forests will have to be part of efforts to close this gap. Agroforestry is now ranked as one of the top three Agriculture, Forestry and Land Use (AFOLU) mitigation pathways, together with afforestation/reforestation and soil carbon sequestration in croplands and grasslands, with substantially higher potential than peatland and coastal wetland restoration, improved forest management and biochar. Complementing the increasing number of national and regional studies[9−11], we report progress here on global datasets.
The rapid onset of climate change impacts and the growing recognition of the importance of the landuse sector within proposed global adaptation and mitigation efforts[12,13] has brought agroforestry systems and the role of trees to the forefront of discussions in various international forums, notably starting with the Kyoto REDD+ agreement, and more currently emphasized in the UNFCCC Paris Treaty commitments, the Convention on Biological Diversity, the Convention to Combat Desertification, the UN Sustainable Development Goals (SDG), as well as by the FAO and the World Bank[9]. An emerging awareness of the relevance of agroforestry and increased tree cover on agricultural land to the climate change agenda[8,11,14−16] is evident within the recent IPCC WGIII report[8] and earlier landuse report[17,18], explicitly including for the first-time, default data for a range of agroforestry land uses[17,19], as well as the increasingly abundant references to agroforestry found in National Adaptation Plans and Nationally Determined Contributions[9−11,20]. As a result of the significant impact of the agricultural sector on the biosphere[13,21], with associated climate[22] and biodiversity implications[23], there is now a global recognition of the need for transformative change in land management and food production systems[24−26]. Agroforestry and increased tree cover on agricultural land are widely seen as pathways to improved agricultural production systems[12,24] that reduce carbon emissions, sequester additional carbon, and minimize the environmental impact of agricultural production[27], with multiple environmental, ecological, and socio-economic benefits, while potentially contributing to at least nine of the 17 SDGs[28].
Zomer et al.[29] made an initial attempt to geospatially model and quantify the above- and below-ground biomass carbon on agricultural land using MODIS remote sensing data and IPCC Tier 1 carbon density estimates based on the Ruesch and Gibbs 'IPCC Tier-1 Global Biomass Carbon Map for the Year 2000'[30]. It was shown that agricultural land globally stored significant amounts of above- and below-ground biomass carbon, 75% of which was in the tree component and not accounted for in the Ruesch and Gibbs dataset. The recently available Spawn and Gibbs 'Global Aboveground and Belowground Biomass Carbon Density Maps for the Year 2010'[31] noted this discrepancy and accounted for it, arriving at a 'remarkably similar estimate' for overlooked biomass carbon on agricultural land. This updated and improved global carbon density data is based upon a set of harmonized land-specific remote sensing datasets, and uses a completely different methodology (i.e., not relying on Tier 1 estimates) to arrive at carbon density based upon previously validated datasets and results.
In this paper, we compare and update the results of our previous analysis based on IPCC Tier 1 default estimates with the Spawn and Gibbs[32,33] carbon density maps, providing an updated global, regional, and country-level analysis of biomass carbon on agricultural land. We then expand that analysis, based on the updated baseline and the previously used Tier 1 methodology, to look at the potential mitigation benefit of increasing tree cover within agricultural systems, in terms of above- and below-ground biomass carbon, under two landuse scenarios:
(1) The first scenario is an incremental change from current practices, i.e., increasing tree cover within the existing or a slightly modified agricultural system. For example, adding trees on the border of fields, along roadways and canals, or within conservation easements. These interventions increase tree cover within the agricultural landscape while not significantly changing existing agricultural practices.
(2) The second scenario evaluates the benefits associated with a more substantial shift to agroforestry systems and approaches which incorporate trees as a core component of the agricultural production system, either at the field level, or within agricultural landscapes more generally.
In each case, scenarios are developed based on the existing distribution of tree cover on agricultural land within bioclimatic strata.
-
The analysis and results reported here are based upon and compared to the results of Zomer et al.[29], which provided both a geospatially articulated baseline and a decadal trend for the period of 2000 to 2010. These previous results showed that existing tree cover makes a major contribution to the carbon pool on agricultural lands, nationally, regionally, and globally. The total biomass on agricultural land globally was estimated at 47.37 PgC in 2010, showing an increase of 2.07 PgC, or 4.6% over the previous decade, with trees contributing > 75% (36.29 PgC) to this global total. A comparison with the recently released dataset 'Global Aboveground and Belowground Biomass Carbon Density Maps for the Year 2010' (subsequently referred to as Spawn and Gibbs Map)[32,33] using the same landcover and landcover classifications gives a surprisingly similar 48.45 PgC, barely more than a 2% difference (Table 1). This new Spawn and Gibbs global dataset is based upon a harmonized set of available remote sensing and other land-specific datasets, with ancillary data and predictive modelling. It is thus derived from a completely different methodology and represents an important update and improvement to the widely used Ruesch and Gibbs[31] IPCC Tier 1 dataset used in our previous analysis.
Table 1. Comparison of IPCC Tier 1 based estimates of above- and below-ground biomass on agricultural land in 2010 by Zomer et al.[29] with the Harmonized Carbon Density Map of Spawn & Gibbs[32,33].
Region Biomass Carbon (PgC) Agricultural area
(km2)IPCC Tier 1 Harmonized Carbon Density Map Difference Total biomass Above-ground Below-ground Total biomass Total biomass Percentage Asia Pacific 2.28 1.32 0.50 1.82 0.47 25.6 790,658 Central America 1.52 0.79 0.22 1.02 0.50 49.0 269,235 Central Asia 0.47 0.20 0.25 0.45 0.02 5.4 830,949 East Asia 2.53 1.52 0.61 2.13 0.40 18.6 1,795,893 Eastern and Southern Africa 2.30 2.48 2.09 4.57 −2.27 −49.7 1,573,527 Europe 2.15 3.18 1.19 4.36 −2.21 −50.7 2,299,766 North Africa 0.11 0.13 0.08 0.22 −0.10 −46.8 155,948 North America 3.40 2.83 1.16 3.99 −0.59 −14.9 2,073,033 Russia 1.07 1.37 0.73 2.10 −1.04 −49.3 1,669,166 South America 12.13 7.87 3.50 11.37 0.76 6.7 3,888,792 South Asia 2.48 1.08 0.35 1.43 1.05 73.2 1,827,025 SouthEast Asia 10.69 6.68 1.76 8.44 2.24 26.5 1,648,268 West and Central Africa 5.45 3.99 1.91 5.91 −0.45 −7.7 2,390,980 Western Asia 0.79 0.43 0.20 0.63 0.15 24.4 955,689 Global 47.37 33.88 14.57 48.45 −1.08 −2.22 22,168,929 In general, the updated 2010 data gives a significantly lower value for overall global carbon when aggregated across all landuses, including forests, indicating previous over-estimation by the Tier 1 map of above-ground carbon across the pantropical regions and some southern temperate zones. This becomes more apparent at the regional level, where there are significant levels of both over- and under-estimation (Table 1) in the Tier 1 maps. Since our estimation of increased biomass with increased tree cover is based upon the Tier 1 methodology described in Zomer et al.[29], this comparison can serve to identify and describe both the potential magnitude and trend of location-specific systematic modelling errors in the scenario analysis (Supplemental Fig. S1). Updated above- and below-ground biomass carbon values for agricultural land extracted from the Spawn and Gibbs Map[32,33] have been calculated for all countries and are provided in the Supplemental Materials (Supplemental Table S1). These updated estimates have been used as the 2010 baseline for the scenario analyses.
Increasing tree cover: incremental change
-
This first scenario proposes an incremental change from current practices, i.e., increasing tree cover by no more than 10% in areas that are currently below median tree cover (Fig. 1) for their respective bioclimatic or ecological zone. These limits ensure that change is limited to areas where it is ecologically, and perhaps, by extension, socio-economically reasonable to plant trees. This change could be achieved by, for example, adding trees on the border of fields, along roadways and canals, or within conservation easements while not significantly changing existing agricultural practices. Potential carbon benefit of this incremental change is evaluated based upon the median tree cover found within each of 124 ecofloristic zones, further stratified by five aridity zones, i.e., the median tree cover within each of 495 bioclimatic strata delineated globally. Carbon biomass was calculated based upon 'carbon zone' values as described in the methods section[29,31].
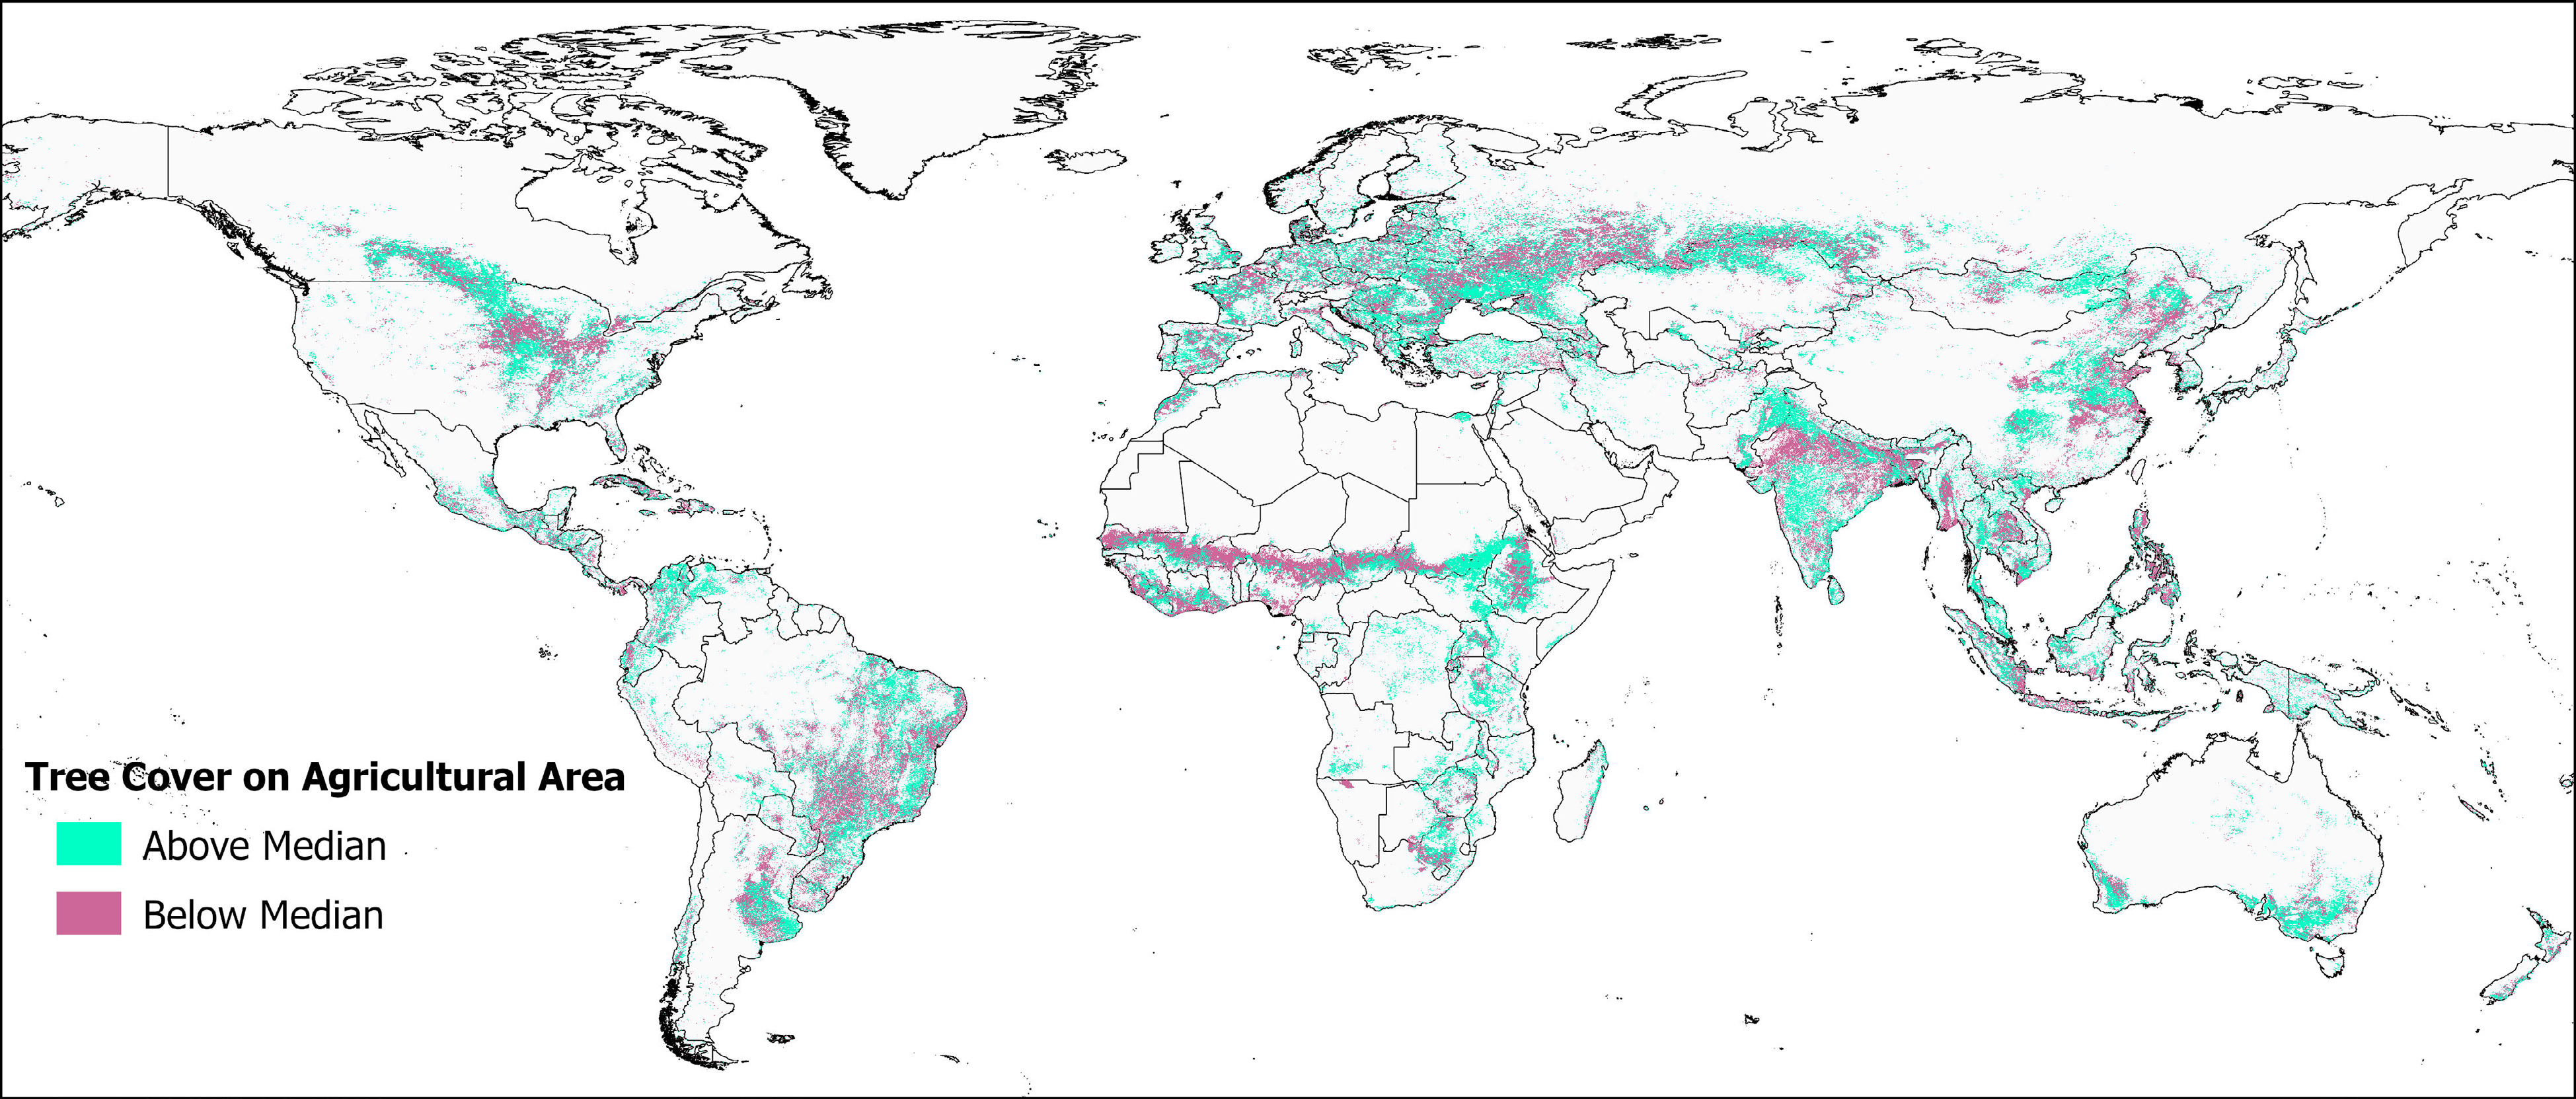
Figure 1.
Agricultural area with tree cover above and below the median tree cover value, within each grid cell's respective bioclimatic strata, i.e., carbon and aridity zone combination (n = 495 strata).
Globally, nearly 45% of all agricultural land would be affected by this scenario (Fig. 2; Supplemental Table S1), postulating an increase in tree cover by 10% only on areas currently below the median tree cover value of the respective stratified carbon zone. Areas less than 10% below the median tree cover increase only up to the median value. All areas with median or higher tree cover have no change. Increasing tree cover by this relatively small amount, increased global above- and below-ground biomass on agricultural land by 4.60 PgC[35,36] bringing the global total to 53.05 PgC, more than 9.5% over the 2010 baseline (based on the updated data from the Spawn and Gibbs map[32,33]).
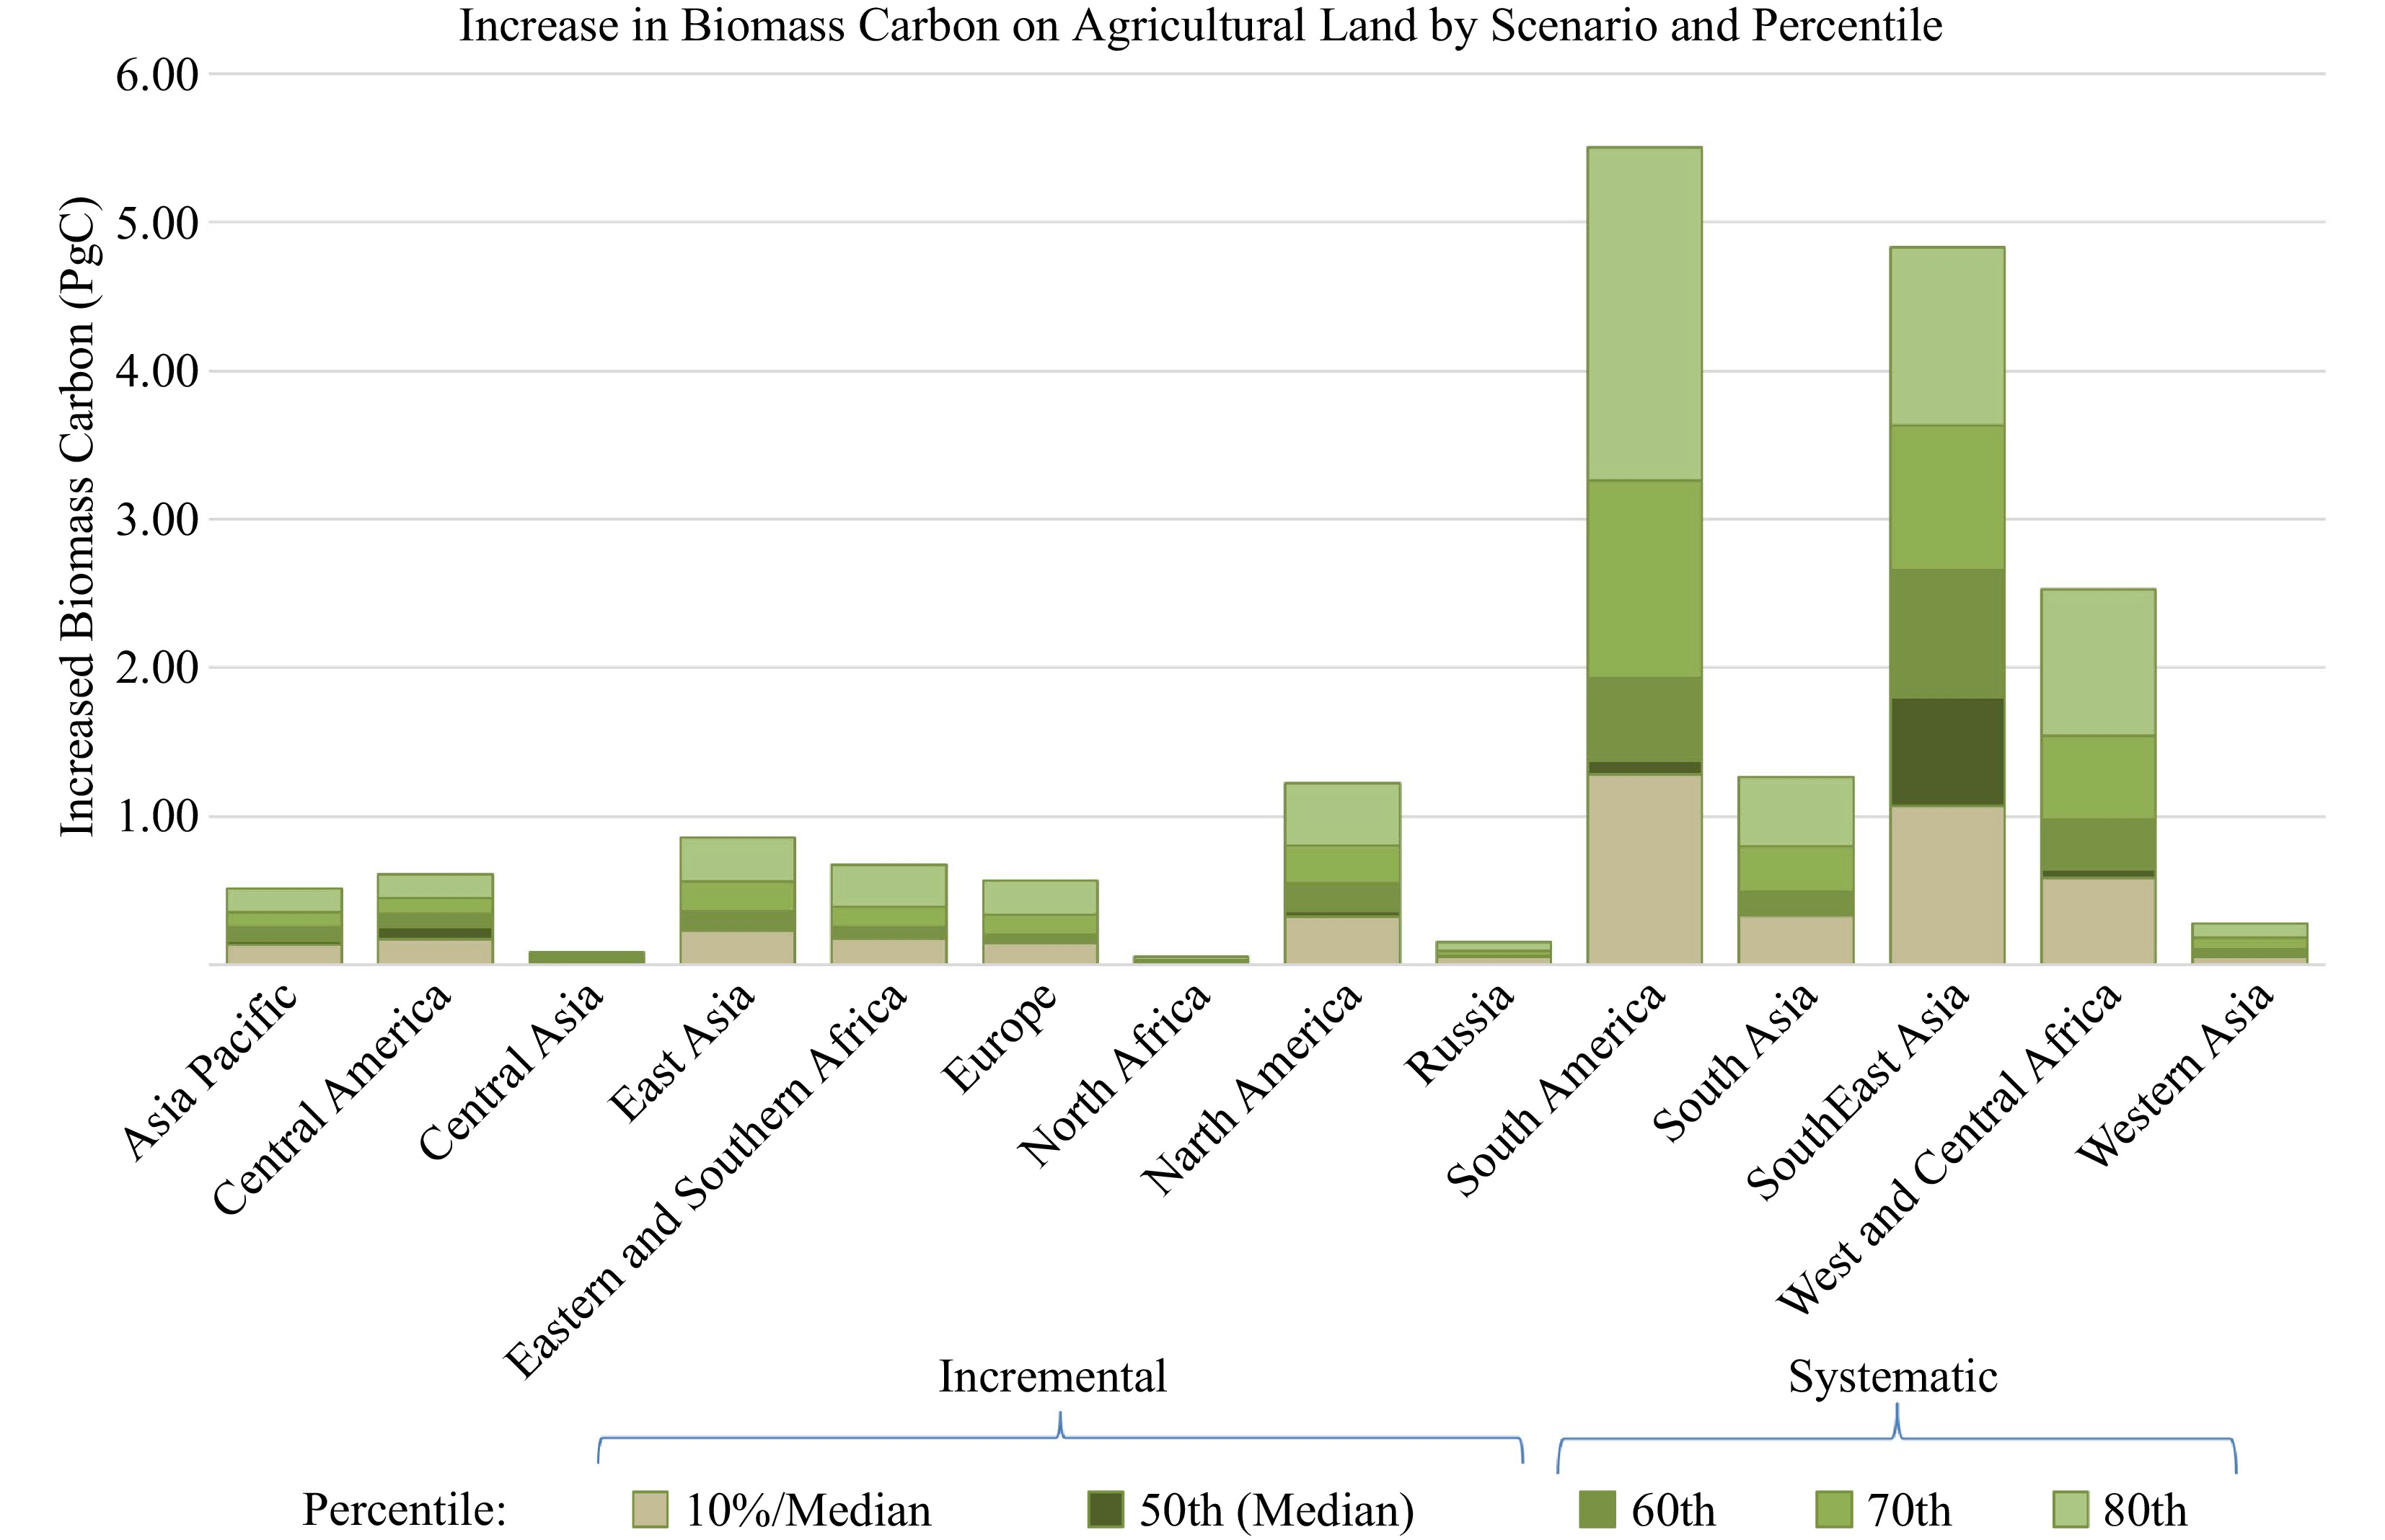
Figure 2.
Increase in above- and below-ground biomass carbon, across the range of adoption scenarios and percentile levels explored in the geospatial modeling of potential carbon sequestration from increased tree cover on agricultural land. Percentiles are calculated based upon the existing tree cover 2010, within each respective carbon/aridity zone combination (n = 495 strata).
Extending an incremental approach to all agricultural land, including the 55% that already has tree cover above the median for its bioclimatic zone, shows that, globally, every 1% increase in tree cover would increase biomass carbon on agricultural land by 1.83 PgC. For example, a global tree cover increase of 10%, potentially easily achievable within a span of 10 years, would increase biomass carbon by 18.27 PgC (Table 2). Biomass carbon increases vary substantially by region, influenced heavily by bioclimatic conditions (Fig. 3a). Large potential increases in biomass carbon with a 1% increase in tree cover globally are found in South America (0.51 PgC), Southeast Asia (0.27 PgC), and West and Central Africa (0.27 PgC), reflecting their relatively large land areas of tropical or humid bioclimatic conditions conducive to plant growth. In contrast, high latitude and short season regions such as Russia (0.02 PgC), arid regions such as North Africa (0.01 PgC) or Western Asia (0.06 PgC), and/or land limited regions such as Central America (0.04 PgC) had relatively low biomass increase potential. North America (0.12 PgC), Eastern and Southern Asia (0.13 PgC), and South Asia (0.15) all had good potential to increase biomass on agricultural land through increasing tree cover. Among countries (Fig. 3b), Brazil (0.34 PgC) shows by far the greatest biomass increase potential (Table 2), along with Indonesia (0.14 PgC) and India (0.13 PgC), again reflecting large areas of land within conducive bioclimatic zones.
Table 2. Increase in above and below-ground biomass carbon with an increase of tree cover by 1%, 5%, and 10% on all agricultural land, regionally, and showing the top 15 countries with the highest potential increase.
Increased biomass Carbon (PgC) by percent increase on all agricultural land Region 1% 5% 10% Country 1% 5% 10% PgC PgC Asia Pacific 0.09 0.46 0.91 Brazil 0.339 1.696 3.391 Central America 0.04 0.19 0.39 Indonesia 0.136 0.662 1.319 Central Asia 0.01 0.07 0.14 India 0.133 0.662 1.323 East Asia 0.09 0.43 0.86 China 0.081 0.407 0.814 Eastern and Southern Africa 0.13 0.63 1.25 United States 0.072 0.359 0.719 Europe 0.08 0.39 0.79 Argentina 0.060 0.299 0.597 North Africa 0.01 0.06 0.12 Australia 0.056 0.282 0.563 North America 0.12 0.60 1.20 Nigeria 0.050 0.248 0.495 Russia 0.02 0.09 0.18 Philippines 0.043 0.197 0.388 South America 0.51 2.55 5.10 Colombia 0.040 0.197 0.394 South Asia 0.15 0.77 1.53 Mexico 0.034 0.169 0.337 SouthEast Asia 0.27 1.34 2.67 Thailand 0.029 0.143 0.286 West and Central Africa 0.26 1.28 2.55 Ethiopia 0.029 0.145 0.289 Western Asia 0.06 0.29 0.58 Côte d'Ivoire 0.028 0.143 0.286 Sudan 0.024 0.119 0.237 Global 1.83 9.13 18.27 Table 3. Increase in above- and below-ground biomass carbon on agricultural land, across the range of adoption scenarios and percentile levels explored in the geospatial modeling of potential carbon sequestration from increased tree cover on agricultural land. Percentiles are calculated based upon the existing tree cover 2010 with each respective carbon/aridity zone combination n = 495 global strata.
Region Biomass Carbon Increase in biomass Carbon by scenario and percentile Incremental Systematic 2000 2010 10% / Median Median (50th) 60th 70th 80th PgC PgC PgC Asia Pacific 1.42 1.52 0.14 0.16 0.26 0.36 0.52 Central America 0.48 0.47 0.17 0.25 0.34 0.45 0.61 Central Asia 2.37 2.53 0.02 0.02 0.06 0.07 0.09 East Asia 2.31 2.30 0.23 0.23 0.36 0.56 0.86 Eastern and Southern Africa 2.13 2.15 0.18 0.19 0.25 0.39 0.68 Europe 0.11 0.11 0.15 0.15 0.20 0.34 0.57 North Africa 3.31 3.40 0.01 0.01 0.01 0.03 0.05 North America 2.11 2.28 0.33 0.36 0.55 0.81 1.22 Russia 1.07 1.07 0.06 0.06 0.06 0.10 0.16 South America 11.34 12.13 1.28 1.38 1.93 3.26 5.50 South Asia 2.30 2.48 0.33 0.35 0.49 0.80 1.27 SouthEast Asia 10.03 10.69 1.07 1.80 2.66 3.63 4.83 West and Central Africa 5.57 5.45 0.58 0.64 0.98 1.54 2.53 Western Asia 0.75 0.79 0.06 0.07 0.11 0.18 0.28 Global 45.30 47.37 4.60 5.29 8.27 12.51 19.15 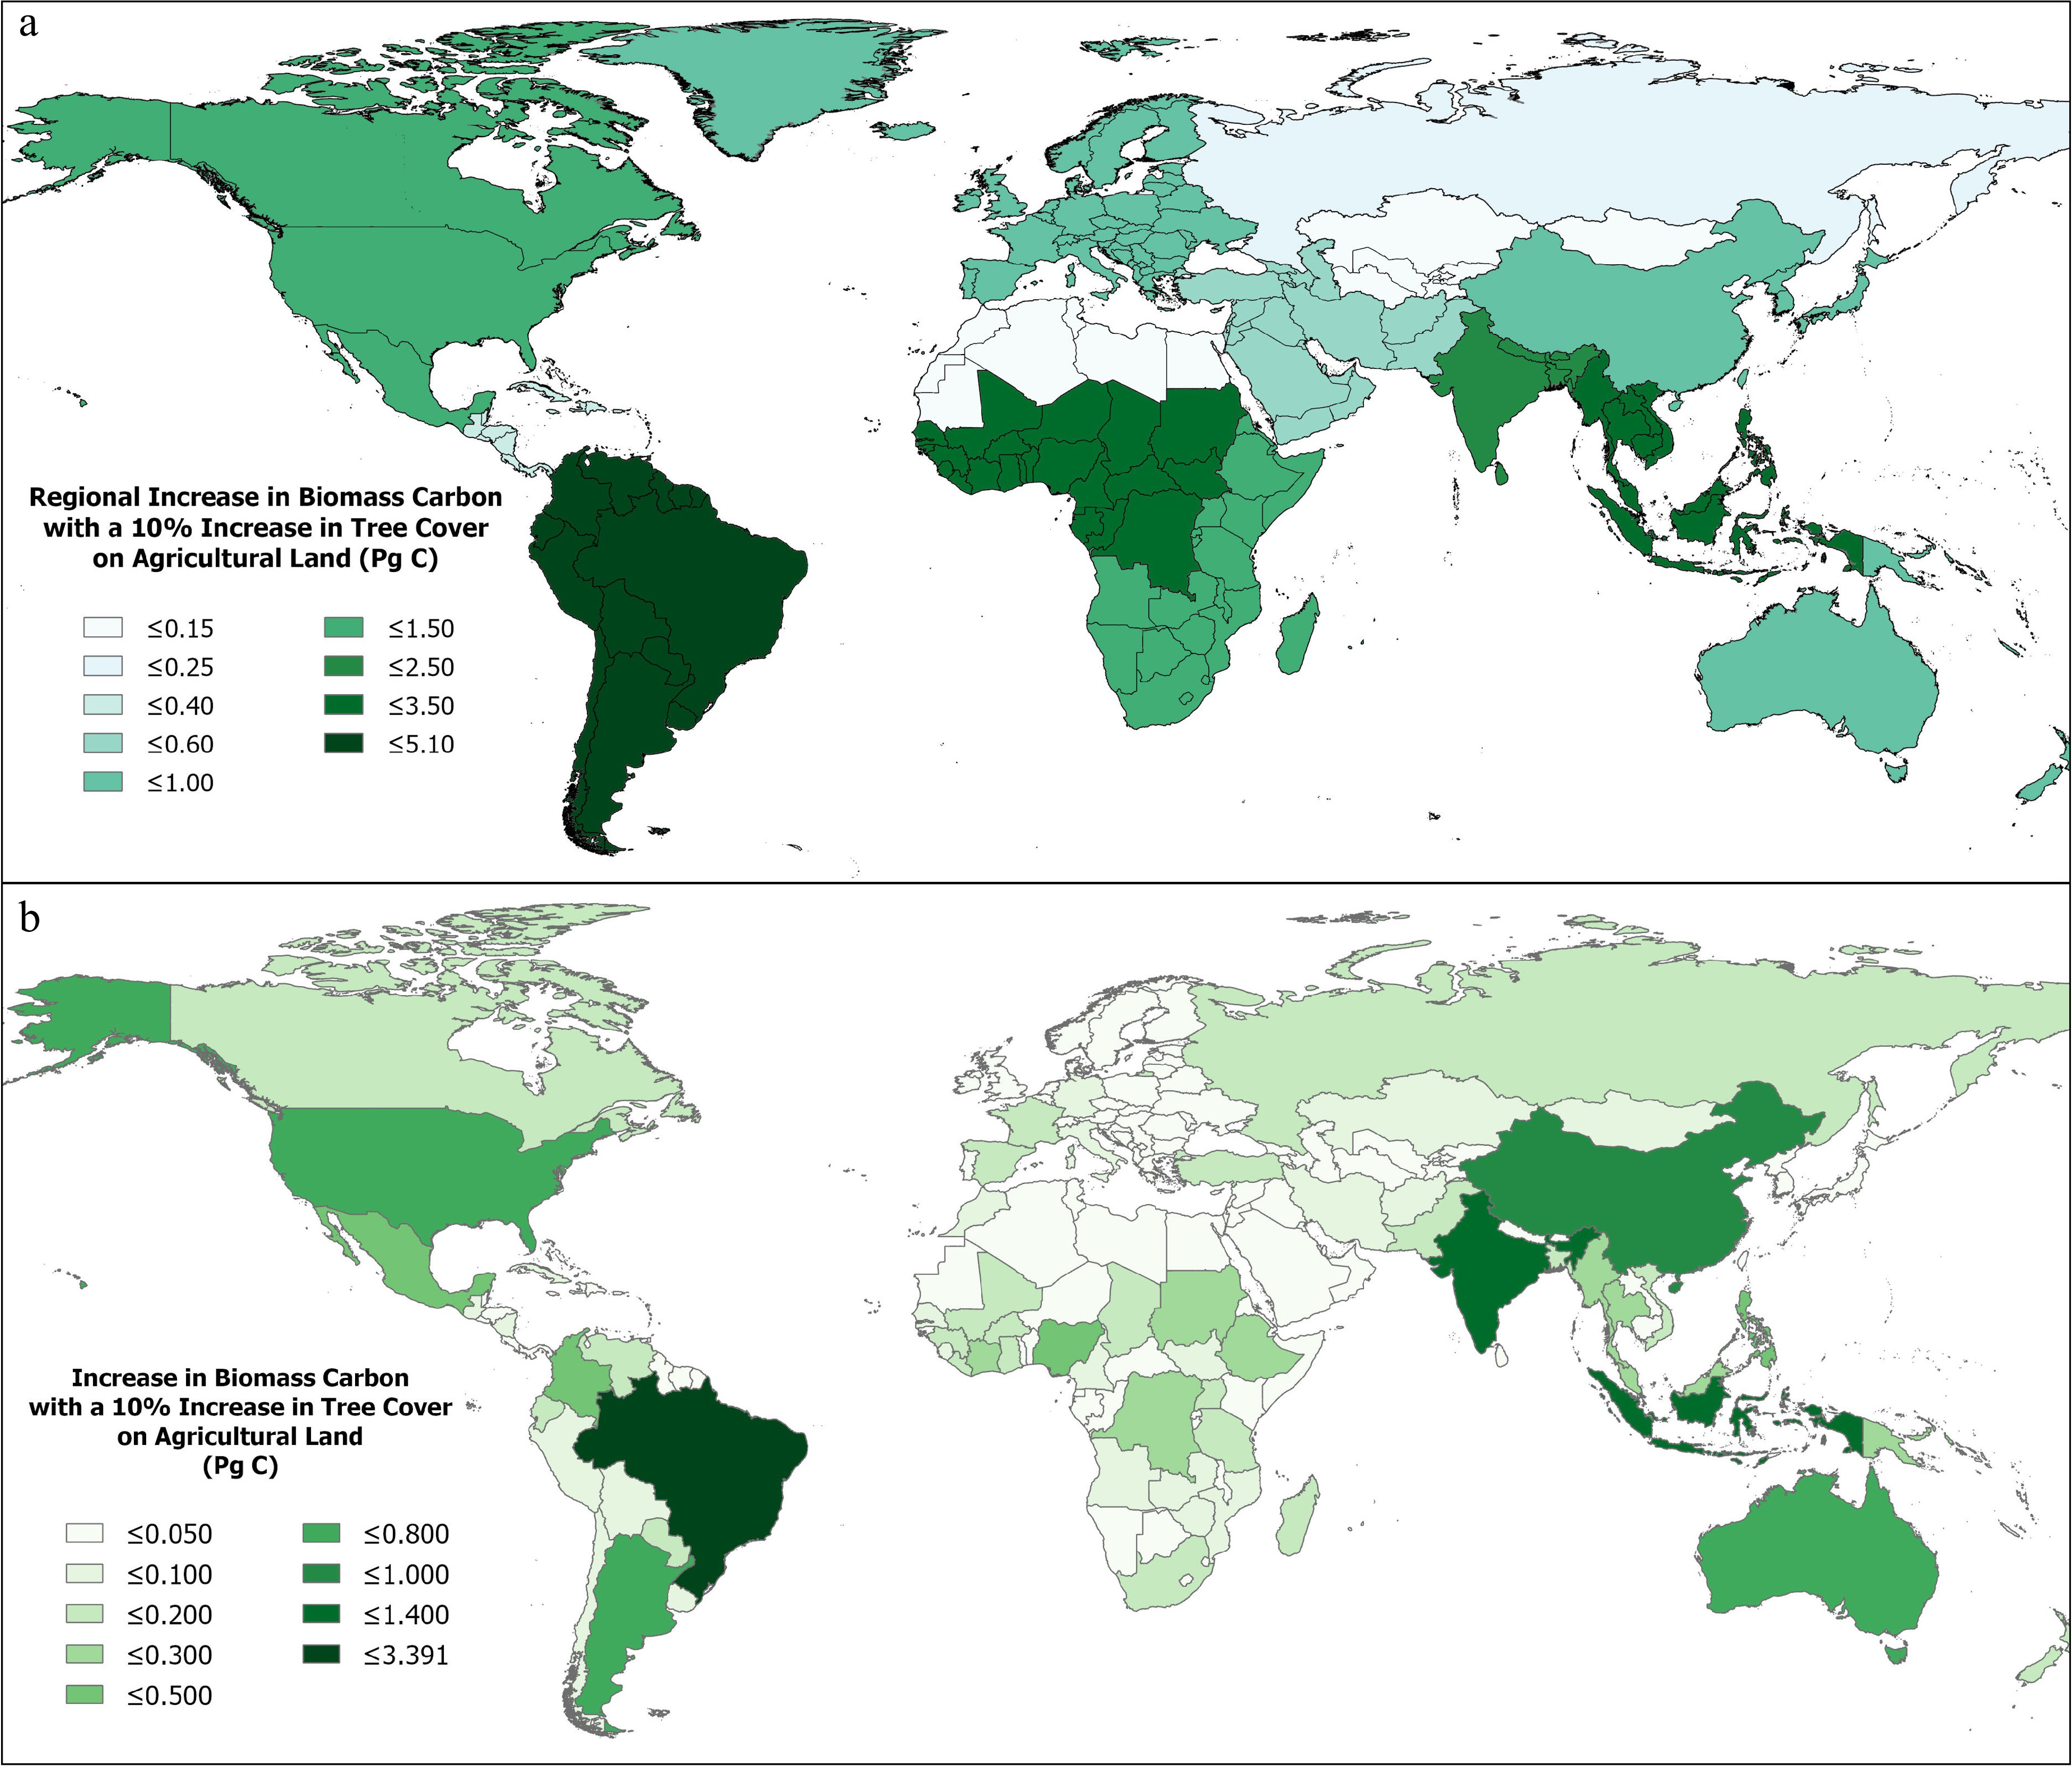
Figure 3.
Increase in above- and below-ground biomass carbon with a 10% increase in tree cover on all agricultural land (a) regionally, (b) by country.
Increasing tree cover: production system change
-
The second set of scenarios explores the opportunity for increasing above- and below-ground biomass carbon associated with production system change and modifications in landscape management such as the wide-scale adoption of agroforestry or other practices which systematically incorporate increased tree cover for habitat management, riparian restoration, or erosion control. An estimate of 'potential tree cover' was found by assuming that for a given carbon/aridity zone combination (n = 495), the 2010 distribution of tree cover in agricultural land represents feasible or viable systems. While the maximum tree cover that occurs in those conditions could be taken as a maximum technical potential, this maximum probably occurs in a very small area and represents some unusual sets of circumstances. Therefore, we look across the range of the distribution (by percentiles) of tree cover within the respective stratum as presenting potential values that can be attained under the prevalent biophysical conditions[34] (Fig. 2). For example, if the 70th percentile is chosen as the potential tree cover, only 30% of the agricultural area within each respective carbon/aridity zone exceeds this tree cover value, i.e., already has 'above potential' tree cover. This paper makes the assumption that this is within an attainable range of tree cover levels, consistent with the production change scenario, i.e., with widespread adoption of agroforestry type practices. However, we examined a range of outcomes at various percentile levels to illustrate results of various adoption and tree cover increase scenarios. In this paper we show only a limited set of results, from the 50th percentile (i.e., the median) to the 80th percentile, to maintain realistic and ecologically feasible expectations, but to also illustrate the potential range under higher levels of adoption.
As an example, if global tree cover were to increase to the 'tree cover potential' at the 70th percentile (Fig. 1), globally, tree cover on agricultural land would increase 4.8 percentage points, from a baseline of 14.4% in 2010 to 19.2% (Fig. 2; Supplemental Figs. S2−S8 - Regional Maps). Across the range of scenarios, an increase in tree cover merely to the 50th percentile would still increase global tree cover nearly 1.9 percentage points to 16.3%, while widespread adoption of agroforestry practices leading to attainment of a more ambitious 80th percentile would increase global tree cover by nearly 8 percentage points. Southeast Asia and Central America have the highest tree cover percent threshold for achieving the 'potential tree cover' at the 70th percentile, both over 44%, reflecting the distribution of high tree cover already within those regions[29]. Likewise, both show the largest percentage increase from attaining that level, with both increasing over 11%. By contrast, drier and less conducive regions, such as North Africa, Central Asia, and Western Asia have very low thresholds to attain these levels of tree cover. Less than two percentage points increase in tree cover for these regions would bring them up to the defined 70th percentile. Notably, South America, with 19% tree cover in 2010, has a moderately high threshold of over 6 percentage points, along with North America, East Asia, and South Asia, which all have thresholds of over 4 percentage points increase in tree cover to attain the 70th percentile in their respective regions. Increasing global tree cover just up to the 50th percentile (i.e., the median) would increase sequestered biomass almost 5.3 PgC in above- and below-ground biomass (Fig. 2). The increase of 4.8% in global tree cover required to reach the 70th percentile would sequester over 12.5 PgC. At the more ambitious 80th percentile level, more than19 PgC would be sequestered within the tree component of agricultural landscapes.
Southeast Asia and South America show the largest increases in biomass carbon on agricultural land through the widespread adoption of agroforestry practices across the range of adoption levels under this production system change scenario. This reflects both the large land areas associated with these regions, and the conducive conditions for growth available there. For example, at the 70th percentile threshold, Southeast Asia and South America increase sequestered biomass carbon by 3.2 and 3.6 PgC respectively. Central Asia, Western Asia, and North Africa show the smallest increase, consistent with their generally lower tree cover and drier conditions. However, West and Central Africa shows a relatively high potential with an increase of 1.5 PgC, while South Asia and North America each reach 0.8 PgC. A spatially articulated mapping of these geospatial results (Fig. 4; Supplemental Figs. S2−S8) clearly illustrates the distribution within regions with areas of above- and below-potential tree cover (at the 70th percentile). Brazil and Indonesia exhibit the largest projected increases in biomass carbon by increasing national tree cover to the 70th percentile (2.39 and 2.08 PgC respectively). Philippines, India, United States, and China all show potential for significant mitigation by increasing tree cover on agricultural land with increases in excess of 0.50 PgC (Supplemental Table S2).
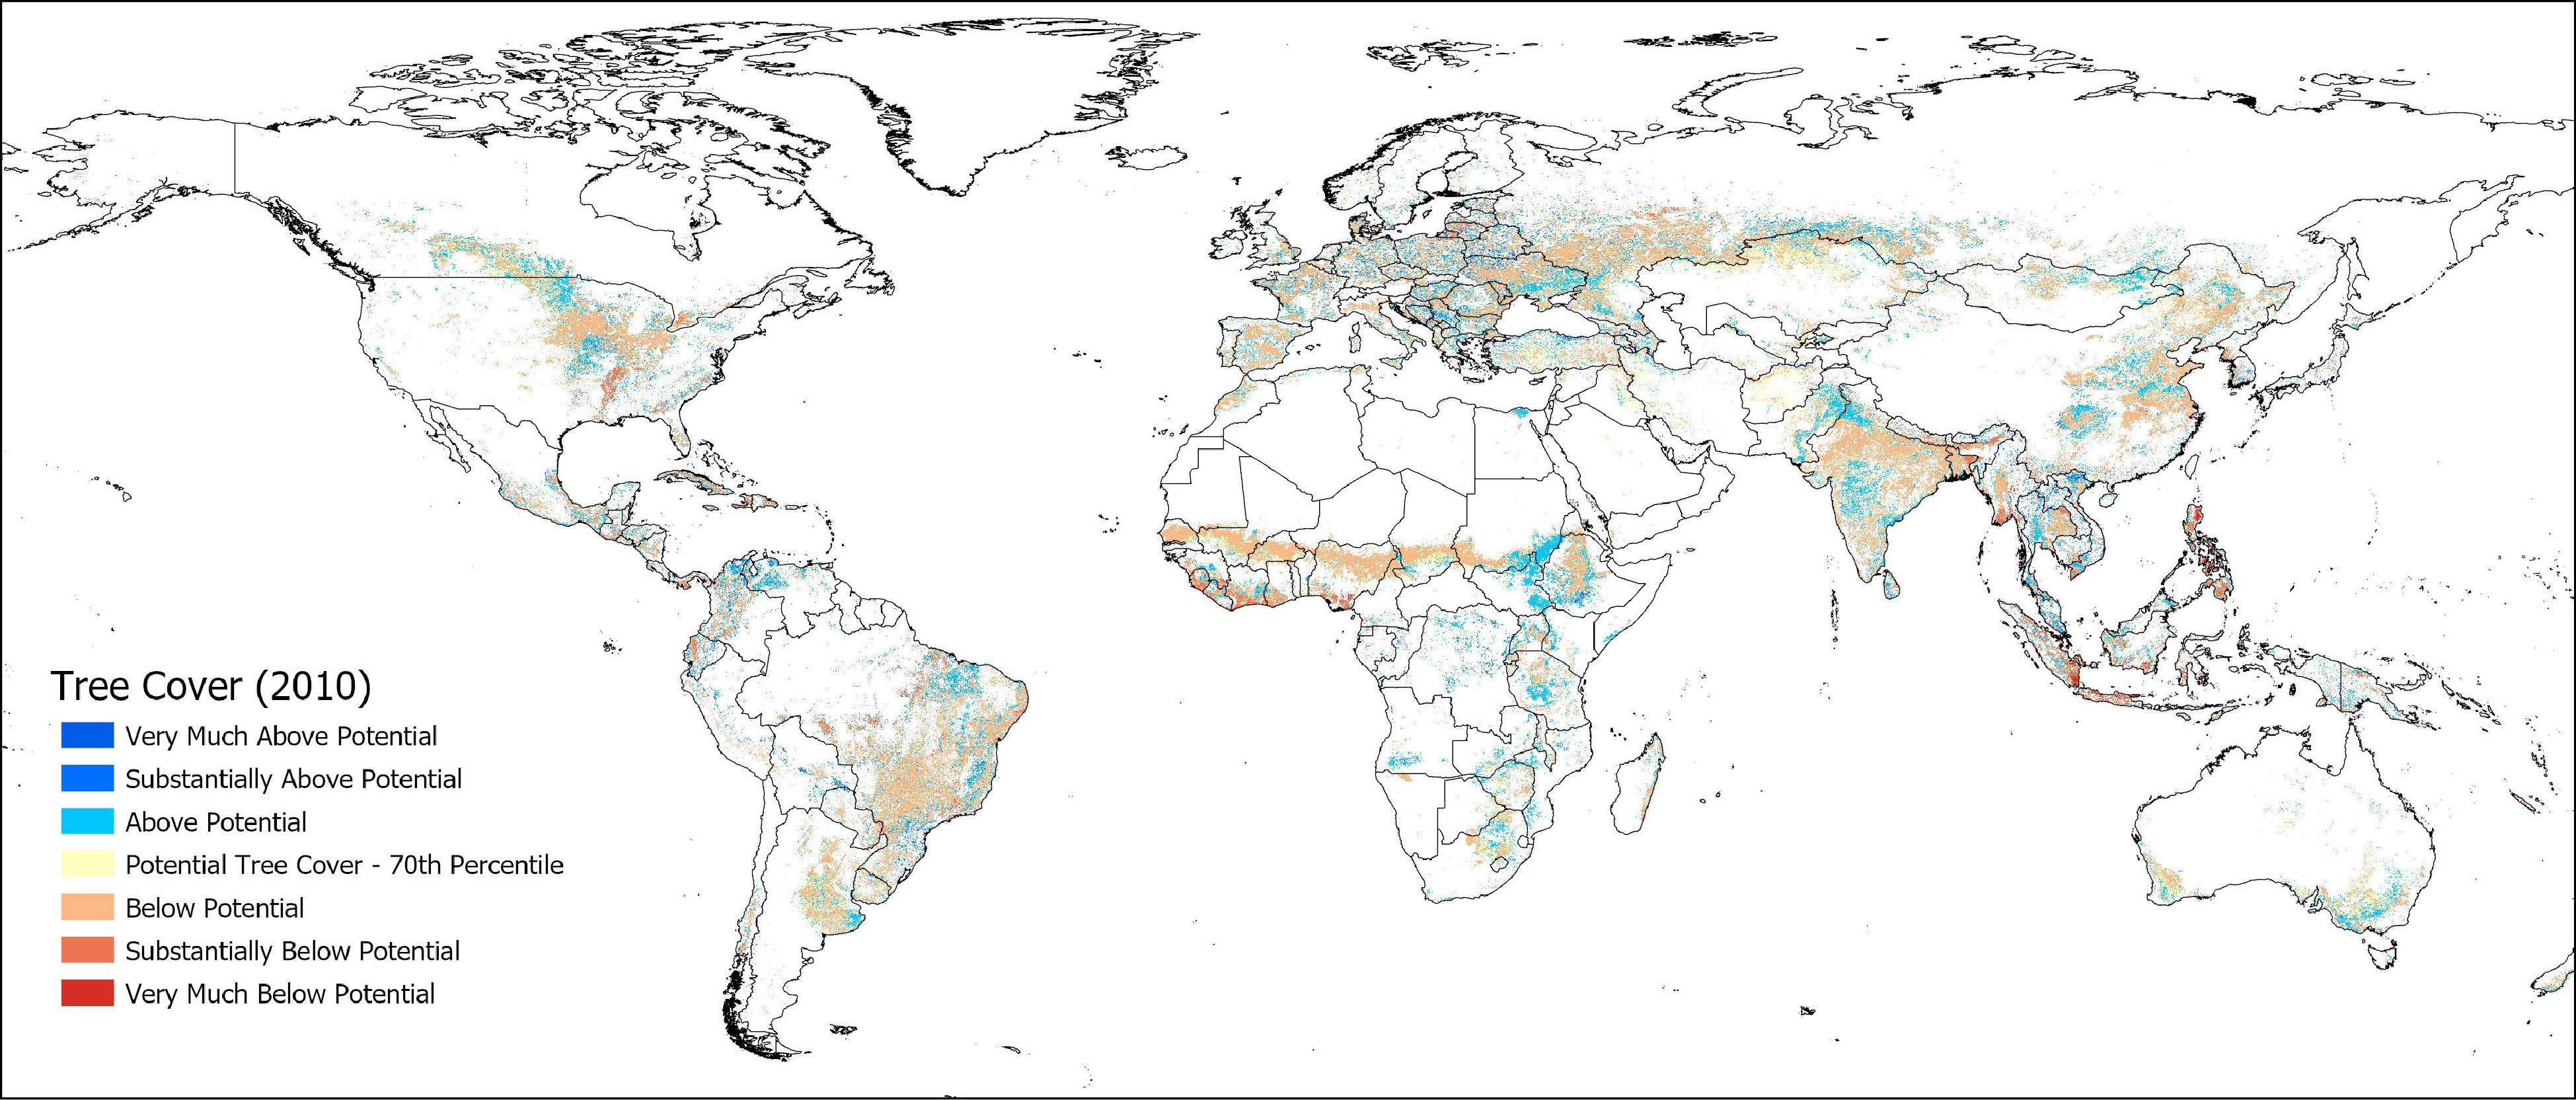
Figure 4.
Tree cover on agricultural land 2010 compared to potential tree cover with systemic change to agroforestry-type agricultural systems estimated at the 70th percentile for adoption.
-
As the need for transformative change in agricultural systems becomes more apparent, urgent, and generally recognized[24,26,27,35,36], gaining a better understanding of the potential mitigation benefits of various agroforestry and tree-based systems has become an essential component of international land sector mitigation efforts[9,10,15,37] and national carbon accounting[9,10,20]. The comparison of the IPCC Tier 1 estimation by Zomer et al.[29] with the updated and better validated Spawn and Gibbs[33] harmonized map has shown that these initial estimates published in 2016 were robust and at appropriate magnitude, especially accurate at the global level, but showing considerably more variability at the regional to country level. Results imply the validity of the IPCC default Tier 1 methodology used was sufficient to base our further estimation of the projected potential for increasing biomass carbon on agricultural land.
The benefits of agroforestry and increased tree cover on agricultural land, especially in terms of adaptation and resilience, both biophysically and socio-economically, are well described[11,38−41]. Trees on agricultural land have direct impacts on the livelihoods of hundreds of millions of small farmers around the globe[34,42] and can have significant co-benefits for biodiversity, ecosystems, and ecosystems services[40]. Given the large amount of land potentially suitable for higher tree cover densities, sequestering carbon via increases in the tree component on agricultural land is an achievable and relatively fast route to increasing CO2 sequestration[43] and global restoration efforts (as per this UN Decade of Restoration). Out of a list of 100 substantive solutions to reduce emissions and atmospheric carbon identified by 'Project Drawdown'[44,45], 11 highlighted agroforestry type approaches, including multi-strata agroforestry, tree intercropping, biomass production, silvopasture, tropical staple tree, intercropping, bamboo, and indigenous tree–based land management[28,44]. Our results show that even incremental change to existing agricultural production systems and agricultural landscape management by marginally increasing tree cover increased biomass carbon from 4–6 PgC, with up to 12–19 PgC for systematic change to tree-based systems. Increasing tree cover on agricultural land by just 10% globally, that is, by 1% per year for the next 10 years, would sequester more than 18 PgC, or 1.83 PgC yr–1. By comparison, above-ground losses due to tropical land use conversion[43] have been estimated at 0.6–1.2 Pg yr–1, with net emissions from land use, land-use change, and forestry for the year 2020[22] estimated to be 1.6 ± 0.7 PgC yr−1.
Nevertheless, the potential for accumulating carbon in biomass on agricultural land is small relative to the amount of carbon in yearly emissions[13] and in known coal, oil and gas reserves[43,46], and should not be considered a substitute for protection of 'irrecoverable carbon' in natural ecosystems including forests, peatlands, and mangroves[47,48]. Thus although certainly not the solution to climate change, absorption of carbon by trees on agricultural land, may provide some measure of near-term respite to carbon accumulation in the atmosphere[43,49]. Given that on-farm tree cover will reach saturation limits at some point, perhaps 5 to 15 years, or substantially longer depending on the agroforestry system and tree species[20,50], carbon sequestration rates will taper off, so that this is not a permanent or long-term solution, even though that carbon will remain sequestered. Presumably, the major portion of this added sequestered carbon would remain in the landscape indefinitely, that is, with some degree of permanence, as it would be maintained as an integral component by the production system.
As articulated by the '4 per 1000 Initiative'[51,52] launched by the French government at COP21 in Paris in 2015, synergistic effects of tree cover and other regenerative agricultural management approaches on soil health, through addition of organic matter, microclimate enhancement, and improved water relations may significantly increase soil organic matter and sequestration while improving soil fertility and water holding capacity[40] and should be seen a major additive mitigation co-benefit of increased tree cover where appropriate. Likewise, various agroforestry type systems are widely touted as effective approaches to restore vast areas of degraded and abandoned agricultural land[53], as well as halting serious soil and soil carbon losses through erosion and poor management with tree plantings to restore fertility and soil health[54]. Like several recent assessments[9,24,55], our results indicate that the addition of trees in agricultural landscapes can help many countries, both tropical and temperate, to meet a large proportion of their NDC's, while contributing substantially to adaptation efforts[56].
Uptake and adoption of agroforestry practices on a wide scale addresses the need for fundamental transformation of the global food system in particular the impacts of monocultural and industrialized agricultural practices. It is widely recognized now that such a transformation is urgently required[27]. However, incremental changes to existing agricultural land in the short-term can start this process, with significant mitigation outcomes, and provide a pathway to transformative change. This will require enhanced policy environments and significant active policy (and financial) support, from global to national and local levels, to promote widespread implementation and adoption, and to face a formidable array of challenges[9,56], not the least of which is the need for appropriate agroforestry technologies that can be implemented at scales from small farms to large industrial agricultural production systems and landscapes, along with global, regional, and national monitoring systems[7] for verified carbon accounting.
-
We used the dataset and methodology produced and described in detail by Zomer et al.[29] to geospatially model biomass carbon increases on agricultural land associated with landuse system changes described by two change scenarios. In that previous analysis, a method was derived to combine a remote-sensing based analysis of tree cover on agricultural land[34,42,57] with IPCC Tier 1 default estimates for above- and below-ground carbon stocks articulated for a variety of land cover types across a range of eco-floristic zones[31,58,59]. Results provided a global Tier-1 spatial mapping and tabulation, globally, and by global region and countries, of biomass carbon on agricultural land for the year 2000 and 2010 at a resolution of 1 km2. The 2010 results are here compared and updated with biomass carbon values extracted from the recently released improved 'Global Aboveground and Belowground Biomass Carbon Density Maps for the Year 2010' produced by Spawn and Gibbs[32,33].
The primary geospatial datasets used in both the previous global analysis of biomass carbon on agricultural land, and this current study, were:
• MOD44B MODIS Vegetation Continuous Field - Collection 5 (2000–2010): Percent Tree Cover[57]
• Global Land Cover 2000 (GLC 2000) Database[60]
• New IPCC Tier-1 Global Biomass Carbon Map for the Year 2000[31]
• Global Aboveground and Belowground Biomass Carbon Density Maps for the Year 2010[32,33]
• GADM Global Administrative Areas Database, v. 3.4[61]
• Aridity Index and Potential Evapotranspiration (ET0) Database[62–64]
Assessment of Global Tree Cover on Agricultural Land:
-
A publicly available global analysis of tree cover which used a MODIS 250 m resolution satellite remote sensing dataset from 2000 to 2010[57] was combined with the GLC 2000 database[60] to extract values from only specified agricultural landuse classes. Detailed methods and results for this analysis are available online in two working paper reports[34,42], as is the geospatial dataset of global tree cover on agricultural land, and biomass carbon:
www.worldagroforestry.org/global-tree-cover/index.html. Three agricultural land use types from the Global Land Cover 2000 database were included in our 'Agricultural Land' class:
• Cultivated and Managed Areas (agriculture — intensive),
• Cropland/Other Natural Vegetation (non-trees: mosaic agriculture/degraded vegetation)
• Cropland/Tree Cover Mosaic (agriculture/degraded forest)
Global IPCC Tier 1 Biomass Carbon Estimates:
-
Tier 1 global estimates of biomass carbon were extracted from the 'New IPCC Tier-1 Global Biomass Carbon Map for the Year 2000'[31], available from the Carbon Dioxide Information Analysis Center (CDIAC) Oakridge National Laboratory and created using the IPCC Good Practice Guidance[58,59] for reporting national greenhouse gas inventories. This map is stratified into 124 'carbon zones' based on FAO eco-floristic zones and which continent that zone is found. The carbon value calculated for each GLC_2000 land use class in each of those zones was used to model our estimates of above- and below-ground biomass.
Deriving the Global Tier 1 Estimates of Biomass Carbon on Agricultural Land:
-
Following the guidelines of the IPCC for National Greenhouse Gas Inventories[58,59], Ruesch & Gibbs identified a relatively low value (5 tC ha−1) for agricultural land, which was applied uniformly and globally for Tier 1 estimates within the 'Global Biomass Carbon Map for the Year 2000' dataset[31]. To account for the added contribution of tree cover on agricultural land, Zomer et al.[29] used the default Tier 1 biomass carbon value for agricultural land (5 tC ha−1) as the baseline value, i.e., at 0% tree cover the biomass carbon is 5 tC ha−1 (in all carbon zones). The biomass carbon value of the GLC_2000 Mixed Forest class (or similar class in case this class is not present) in that same carbon zone was used as a surrogate biomass carbon value where there is full tree cover on agricultural land (i.e., tree cover percentage = 100). A linear increase in biomass carbon from 0 to 100 percent tree cover is assumed where, within a specific grid cell in a specific carbon zone:
• Biomass carbon is equal to the default Tier 1 value for agricultural land (5 tC ha−1) when there are no trees on that land, i.e., tree cover = 0%.
• There is an incremental linear increase of tC ha−1 proportionally as tree cover increases from the baseline (5 tC ha−1 at 0% tree cover) up to the maximum value for Mixed Forest in that specific carbon zone, i.e., biomass carbon values on agricultural land with 100% tree cover are equal to the related Mixed Forest class. However, no grid cells exceeded 86% tree cover.
Results were tabulated and mapped globally, by global region, and by country. A ccomparison of the 2010 results with the updated[32,33] was performed using the same agricultural land classifications and GLC dataset as Zomer et al.[29] to extract comparable carbon values from the Spawn and Gibbs dataset. The analysis was done at the original 300 m resolution to maintain accounting accuracy. Final maps were resampled to 1 km2 resolution for graphical purposes only.
Scenario Modelling:
-
Two landuse systems change scenarios were modelled and explored in several different ways.
(1) The first scenario describes an incremental change from current practices on agricultural land, increasing tree cover within the existing or a slightly modified agricultural system. For example, adding trees on the border of fields, along roadways and canals, or within conservation easements but not fundamentally altering the agricultural system through the introduction of a tree component.
Two hypothetical subsets of the first scenario were evaluated:
a) An increase in tree cover by 10% on all area below the median tree cover value. Areas less than 10% below the median tree cover increase up to the median value.
b) An increase of tree cover to the median value on all area below the median tree cover value. All areas less than median tree cover increase up to the median value, and all other tree cover values remain the same.
To evaluate the median and percentile of tree cover on agricultural land within regionally relevant and ecologically feasible bioclimatic and ecofloristic conditions, the carbon zones described above, based upon the 124 FAO ecofloristic zones, were further stratified by five aridity index zones[62,63], giving a total of 495 unique strata globally. Above- and below-ground carbon values were then calculated, as described above based upon a prescribed increase in tree cover, using the scenario-based tree cover percentage values for each of the 495 unique carbon/aridity zones, geospatially articulated for all global terrestrial regions.
(2) The second scenario proposes a more substantial shift to an agroforestry landuse system, or agroforestry approaches which incorporate trees as a core component of the agricultural production system. To describe the potential range of above- and below-ground biomass carbon increase with a shift to more agroforestry-type production practices, two approaches were used:
a) The increase in biomass carbon was evaluated along a range of increased tree cover percentages, i.e., a specified percentage over the current existing tree cover (2010) on that land, up to 10%, for all agricultural area, and calculated based upon carbon zone parameters particular to the geospatial location of that respective land area.
b) The increase in biomass carbon was evaluated along a range of tree cover percentiles, as calculated within the respective carbon zone stratified by the aridity zones of the respective land area.
Results were tabulated and mapped globally, by global region, and by country.
Supported by NSFC-CGIAR Project "Characterization of roots and their associated rhizosphere microbes in agroforestry systems: ecological restoration in high-phosphorus environment", Grant No. 31861143002. Additional support from: the Yunnan Provincial Science and Technology Department, Key Project (Grant No. 202101AS070045), the National Key Basic Research Program of China (Grant No. 2014CB954100), National Science Foundation China (Grant No. 31270524), and the CGIAR Research Programs on Forests, Trees and Agroforestry and Climate Change, Agriculture, and Food Security. We also express our gratitude to the Carbon Dioxide Information Analysis Center (CDIAC), Oakridge National Laboratory and the authors of the 'New IPCC Tier 1 Global Biomass Carbon Map' and the 'Global Aboveground and Belowground Biomass Carbon Density Maps for the Year 2010' for providing the valuable online data used in this analysis.
-
The authors declare that they have no conflict of interest.
- Supplemental Table S1 Total above- and below-ground biomass carbon in millions of tons carbon tC*106. and in tons per hectare tC/ha. by country. Source: Harmonized Carbon Density Map[32].
- Supplemental Table S2 Increase in biomass carbon by “potential tree cover” threshold percentile – top 25 countries.
- Supplemental Fig. S1 Comparison of IPCC Tier 1 based estimates Zomer et al, 2016. vs Harmonized Carbon Density Map Spawn and Gibbs, 2020., a.) showing differences in tC/ha and b.) in percent , with negative values signifying and underestimation by the IPCC Tier 1 based estimates, and positive values an overestimation.
- Supplemental Fig. S2 Regional map of tree cover on agricultural land in 2010 compared to potential tree cover at the 70th percentile.
- Supplemental Fig. S3 Regional map of tree cover on agricultural land in 2010 compared to potential tree cover at the 70th percentile.
- Supplemental Fig. S4 Regional map of tree cover on agricultural land in 2010 compared to potential tree cover at the 70th percentile.
- Supplemental Fig. S5 Regional map of tree cover on agricultural land in 2010 compared to potential tree cover at the 70th percentile.
- Supplemental Fig. S6 Regional map of tree cover on agricultural land in 2010 compared to potential tree cover at the 70th percentile.
- Supplemental Fig. S7 Regional map of tree cover on agricultural land in 2010 compared to potential tree cover at the 70th percentile.
- Supplemental Fig. S8 Regional map of tree cover on agricultural land in 2010 compared to potential tree cover at the 70th percentile.
- Copyright: © 2022 by the author(s). Published by Maximum Academic Press, Fayetteville, GA. This article is an open access article distributed under Creative Commons Attribution License (CC BY 4.0), visithttps://creativecommons.org/licenses/by/4.0/.
-
About this article
Cite this article
Zomer RJ, Bossio DA, Trabucco A, Noordwijk M, Xu J. 2022. Global carbon sequestration potential of agroforestry and increased tree cover on agricultural land. Circular Agricultural Systems 2:3 doi: 10.48130/CAS-2022-0003 

Global carbon sequestration potential of agroforestry and increased tree cover on agricultural land
- Received: 31 January 2022
- Accepted: 21 April 2022
- Published online: 18 May 2022
Abstract: Biomass is fundamental to circular agricultural systems. Estimates of above- and below-ground biomass on agricultural land based upon IPCC Tier 1 estimates are compared with an updated carbon density map based on remote sensing, with results indicating the methodology and initial estimations are robust. Two scenarios are evaluated to estimate carbon sequestration potential of increasing tree cover on agricultural land: 1) incremental change and 2) a systemic change to agroforestry. Estimates of above- and below ground biomass carbon were combined with a tree cover analysis to estimate the increase in biomass. Global increases (4−6 PgC for incremental change; 12−19 PgC for systemic change) highlight substantial mitigation potential. Increasing global tree cover on agricultural land by 10% would sequester more than 18 PgC. South America has the highest potential, followed by Southeast Asia, West and Central Africa, and North America. Brazil, Indonesia, Philippines, India, the United States and China are among the top countries with the highest carbon sequestration potential on agricultural land with increased tree cover.
-
Key words:
- Agroforestry /
- Climate change /
- Mitigation /
- Trees Outside Forests /
- Carbon Sequestration