


-
Compared with fossil fuel energy, renewable energy offers many promising advantages, such as improved economic efficiency and reduced pollutant emission, and therefore has drawn much attention in a wide range of applications. Existing studies have shown that renewable energy sources will be the main supply in future development processes[1−2]. Biomass is one of the most commonly used renewable energy resources, and comprehensive knowledge of pyrolysis reaction mechanisms and kinetics is extremely important to promote the development of biomass pyrolysis technologies. Determination of the unknown kinetic parameters for a specific type of biomass is crucial for accurately describing the pyrolysis process. By contrast to the time-consuming and difficult manual determination of parameters[3], heuristic algorithms[4−5] are more effective in solving the problem and are therefore widely used.
The most extensively used heuristic optimization algorithms include Genetic Algorithm (GA)[6], Hill Climbing algorithm (HC)[7], Particle Swarm Optimization (PSO)[8], Shuffled Complex Evolution (SCE)[9], etc. Li et al.[10] extracted kinetics of MDF (medium density fiberboard) pyrolysis using GA. Abdelouahed et al.[11] discussed the calculation method of kinetic parameters of biomass pyrolysis based on GA and concluded that the Kissinger method was the best method to determine kinetics. Ferreiro et al.[6] studied the effect of biomass type on pyrolysis-related behaviors under different heating conditions using GA. Gong et al.[7] developed a numerical model for pyrolysis of oriented strand board (OSB) using HC. Xu et al.[12] extracted kinetics of lignocellulose, wood and rape straw using PSO. Aghbashlo et al.[13] combined PSO with an adaptive network-based fuzzy inference system (ANFIS) to correlate the prediction of the kinetic constant of lignocellulose pyrolysis. Ding et al.[14] compared various biomass models using SCE and concluded that a three-component parallel reaction scheme was more appropriate. Purnomo et al.[15] compared the efficiency and accuracy of five different optimization algorithms in calculating biomass kinetics and showed that SCE was the most accurate. Different optimization algorithms have their own advantages and limitations and are useful in solving different types of problems. When applying these algorithms, rational selection according to the specific problems and appropriate parameter settings are crucial for obtaining reliable outcomes.
GA[11] is an optimization algorithm based on Darwinian survival of the fittest theory. By simulating the natural evolutionary process, it transforms the problem to be solved into multiple individuals, and each individual encompasses a set of parameters that need to be solved. Through genetic, crossover and mutation operations, new individuals are created, evaluated and selected to gradually approach the optimal solution. GA[6] has powerful parallel processing capability and is suitable for solving complex, nonlinear, multi-peaked and difficult problems. In addition, it's easy to implement with simple parameter settings. PSO[8] transforms the encountered problem into a minimization problem by simulating the behavior of a flock of birds when searching for food. The algorithm first initializes random groups of particles that can be considered as possible solutions. By adjusting the position and speed of each particle, the swarm approaches the optimal solution. PSO has a global search capability with the influence of local optimal solutions. However, it should be noted that the search accuracy of PSO depends on the initial state and parameter setting of the population[16], so reasonable initialization and parameter tuning are required. Additionally, the algorithm may converge prematurely, resulting in the search of only the local optimal solution but not the global optimal solution. SCE[9,15] combines the concept of complexity science and the ideas of biological evolution. In each iteration, the algorithm updates the current optimal solution by randomly swapping parameters in multiple small systems contained in complex systems. SCE uses the idea of random swapping and can effectively deal with high-dimensional optimization problems with multiple local minima[17]. However, the parameter setting of this algorithm is relatively complicated and requires reasonable parameter adjustment. In addition, the computational complexity of SCE is high, requiring a large amount of computational and storage resources.
Although all these three prevailing algorithms have been widely used in determining kinetics of biomass pyrolysis, few studies have compared their optimization capabilities, such as computation efficiency and accuracy. To challenge this issue and fill the research gap of existing studies, we launch a comparative study of these three algorithms by extracting kinetics of wood, a representative biomass material. Based on the originally obtained thermogravimetric experimental data, the contribution of each sub-reaction in the pyrolysis process is firstly identified by Gauss multi-peak fitting method, followed by the estimation of kinetics of each separated reaction using several model-free methods. Subsequently, the average values of the multiple sets of solutions are served as the initial solution to determine the search ranges of the three optimization algorithms. Then, the efficiency and accuracy of each algorithm are discussed in detail based on the optimization results.
-
Nitrogen atmosphere was selected to conduct the pyrolysis tests of beech wood using a NETZSCH STA449F3 thermal analyzer. Three different heating rates of 5, 10 and 20 K/min were used to heat the 5−7 mg wood powders from 290 to 1,070 K. Heating rate plays an important role in collecting proper experimental data. Very slow heating rate, such as 1 K/min, allows the reactions to come closer to equilibrium and there is less thermal lag in the sample and apparatus. Contrarily, high heating rates give faster experiments, which are more representative of the heating rates in fires, but deviate more from equilibrium and result in greater thermal lag. Larger heating rates are suitable for finding a wide range of decomposition, while smaller heating rates show better performance in the separation of individual events. Heating rates used in tests should preferably be in the range of 1−20 K/min as recommended by ICTAC (International Confederation for Thermal Analysis and Calorimetry) Kinetics Committee[18]. Consequently, these three representative heating rates, 5, 10 and 20 K/min, were used in this study. A ceramic crucible was employed and a small hole was set in the center of the crucible lid to allow the release of volatiles during pyrolysis. All samples were dried in an oven for at least 72 h before tests to minimize the impact of moisture. Given that thermogravimetric experiments are highly reproducible, only three replicate experiments were performed at each heating rate to estimate the experimental uncertainty.
Model-free methods
-
Utilization of a suitable kinetic parameter calculation method allows a rough estimate of the search range for the subsequent optimization. Model-free methods, including the Kissinger method and isoconversional methods, are introduced in this section and will be utilized to calculate the kinetics of wood. Previous studies showed that the kinetic parameters calculated by the Kissinger method are very close to other isoconversional methods, such as KAS, Tang, DAEM methods.
In a single-step pyrolysis reaction, the degree of conversion of the solid, α, can be expressed as:
$ \alpha = \displaystyle\frac{{\left( {{m_0} - m} \right)}}{{\left( {{m_0} - {m_\infty }} \right)}} $ (1) where
$m$ ${m_0}$ ${m_\infty }$ $ \displaystyle\frac{{d\alpha }}{{dt}} = \lambda \left( T \right)f\left( \alpha \right) $ (2) where
$t$ $f\left( \alpha \right)$ $\lambda $ $\lambda $ $ \lambda = Aexp\left( { - \displaystyle\frac{{{E_a}}}{{RT}}} \right) $ (3) where
$A$ ${E_a}$ $R$ $\beta = dT/dt$ $ \displaystyle\frac{{d\alpha }}{{dT}} = \displaystyle\frac{A}{\beta }exp\left( { - \displaystyle\frac{{{E_a}}}{{RT}}} \right)f\left( \alpha \right) $ (4) The integral function of the conversion rate,
$g\left( \alpha \right)$ $ g\left( \alpha \right) = \mathop \int \nolimits_0^\alpha \displaystyle\frac{{d\alpha }}{{f\left( \alpha \right)}} = \displaystyle\frac{A}{\beta }\mathop \int \nolimits_{{T_0}}^T exp\left( { - \displaystyle\frac{{{E_a}}}{{RT}}} \right)dT $ (5) where
${T_0}$ Kissinger method
-
The Kissinger[19] method uses the peak temperature of the reaction peak for plotting, and the equation can be expressed as:
$ ln\left( {\displaystyle\frac{{{\beta _n}}}{{{T_{p,n}}^2}}} \right) = ln\left( { - \displaystyle\frac{{AR}}{{{E_a}}}f'\left( {{\alpha _p}} \right)} \right) - \displaystyle\frac{{{E_a}}}{{R{T_{p,n}}}} $ (6) where the subscript
$n$ $p$ $f'\left( {{\alpha _p}} \right)$ $ ln\left( {\displaystyle\frac{{{\beta _n}}}{{{T_{p,n}^2}}}} \right) = ln\left( {\displaystyle\frac{{AR}}{{{E_a}}}} \right) - \displaystyle\frac{{{E_a}}}{{R{T_{p,n}}}} $ (7) A straight line can be obtained by plotting
$ln\left( {{\beta _n}/{T_{p,n}^2}} \right)$ $1/{T_{p,n}}$ ${E_a}$ KAS method
-
The formula for the KAS[20] method is expressed as:
$ ln\left( {\displaystyle\frac{\beta }{{{T^2}}}} \right) = ln \displaystyle\frac{{AR}}{{{E_a}g\left( \alpha \right)}} - \displaystyle\frac{{{E_a}}}{{RT}} $ (8) Using this formula, a straight line can be made by plotting
$ln\left( {\beta /{T^2}} \right)$ $1/T$ ${E_a}$ $f\left( \alpha \right) = 1 - \alpha $ $g\left( \alpha \right) = - ln\left( {1 - \alpha } \right)$ $ ln\left( {\displaystyle\frac{\beta }{{{T^2}}}} \right) = ln\left( {\displaystyle\frac{{AR}}{{ - {E_a}ln\left( {1 - \alpha } \right)}}} \right) - \displaystyle\frac{{{E_a}}}{{RT}} $ (9) Tang method
-
Tang et al.[21] proposed the Arrhenius temperature integral approximation for Eq. (5):
$ - lnP\left( x \right) = 0.377739 + 1.894661ln\left( x \right) + 1.00145x $ (10) $ x = \displaystyle\frac{{{E_a}}}{{RT}} $ (11) $ P(x) = \displaystyle\frac{{g(\alpha )\beta R}}{{A{E_a}}} $ (12) Substituting the approximation into Eq. (5) and taking logarithms on both sides, the expression of the Tang method is obtained:
$ \begin{split} ln\left( {\frac{\beta }{{{T^{1.894661}}}}} \right) =& ln\left( {\frac{{A{E_a}}}{{Rg\left( \alpha \right)}}} \right) + 3.635041 -\\& 1.894661ln{E_a} - 1.001450\frac{{{E_a}}}{{RT}}\end{split} $ (13) At different heating rates and arbitrary conversion rate, plotting
$ln\left( {\beta /{T^{1.894661}}} \right)$ $1/T$ ${E_a}$ $\begin{split} ln\left( {\frac{\beta }{{{T^{1.894661}}}}} \right) =\;& ln\left( {\frac{{A{E_a}}}{{ - Rln\left( {1 - \alpha } \right)}}} \right) + 3.635041- \\& 1.894661ln{E_a} - 1.001450\frac{{{E_a}}}{{RT}}\end{split} $ (14) The pre-exponential factor,
$A$ DAEM method
-
DAEM[22] is an effective method to study the reaction behavior of complex systems including an infinite number of parallel first order reactions. The simplified DAEM model can be expressed as:
$ ln\left( {\displaystyle\frac{\beta }{{{T^2}}}} \right) = - \displaystyle\frac{E}{{RT}} + ln\left( {\displaystyle\frac{{AR}}{E}} \right) + 0.6075 $ (15) Similarly,
${E_a}$ $A$ $ln ( {\beta /{T^2}} )$ $1/T$ -
To simulate the measured mass and mass loss rate (MLR) of sample in the thermogravimetric analysis experiments, a 0D numerical model for the pyrolysis of a thermally thin solid is developed. The 0D model implies the temperature gradient inside the condensed phase is neglected compared to the traditional 1D heat transfer model. The general forms of pyrolysis reaction and reaction rate are:
$ {\theta _1}Com{p_1} + {\theta _2}Com{p_2} \to {\theta _3}Com{p_3} + {\theta _4}Com{p_4} $ (16) $ {w}_{j}=-{c}_{Com{p}_{1}}^{{n}_{j,1}}{c}_{Com{p}_{2}}^{{n}_{j,2}}{A}_{j}exp\left(-\displaystyle\frac{{E}_{a,j}}{RT}\right)\text{ }\left(j=1,2,3\cdots \right) $ (17) where
$Comp$ $\theta $ $w$ $n$ $c$ $j$ $ \frac{{d{c_i}}}{{dt}} = \mathop \sum \limits_{j = 1}^{{N_j}} {\theta _{j,i}}{w_j} $ (18) where the subscript i denotes i-th component,
${N_j}$ ${\theta _{j,i}}$ $ m = \mathop \sum \limits_{s = 1}^{{N_s}} {c_s};\quad MLR = \mathop \sum \limits_{g = 1}^{{N_g}} \mathop \sum \limits_{j = 1}^{{N_j}} {V_{j,g}}{w_j} $ (19) where
${N_s}$ ${N_g}$ Optimization algorithms
-
Three most frequently utilized optimization algorithms, GA, PSO, and SCE, are used to compare their performance by determining kinetics of wood combining the numerical model and experimental results. Detailed information of the three algorithms was introduced in our recent publications[23,24]. A four-component reaction scheme is applied to describe the pyrolysis of wood, namely the evaporation of water, pyrolysis of cellulose, hemicellulose and lignin. Each reaction includes four unknown parameters, namely
${E_a}$ $A$ GA (Genetic algorithm)
-
GA simulates the process of population evolution, adopting a series of genetic operations such as selection, crossover and mutation for the current population to create a new generation and gradually progress the population to a state close to the optimal solution. In GA, each set of unknown parameters is referred to as an individual, and a combination of tens to thousands of individuals is defined as a population. Offspring, namely all potential solutions, are continuously produced by the overall population through genetic, crossover and mutation operations. An objective function, also known as fitness function, is essential for the assessment process. The objective function utilized in current study takes both m and MLR into account, as recommended by ICTAC Kinetics Committee[25]:
$ {R^2} = \displaystyle\mathop \sum \limits_{l = 1}^{{N_m}} \displaystyle\frac{{\left( {{m_{l,exp}} - {m_{l,num}}} \right)}}{{{m_{l,exp}} - {{\bar m}_{l,exp}}}} + \mathop \sum \limits_{l = 1}^{{N_{MLR}}} \displaystyle\frac{{\left( {ML{R_{l,exp}} - ML{R_{l,num}}} \right)}}{{ML{R_{l,exp}} - {{\overline {MLR} }_{l,exp}}}} $ (20) where
${N_m}$ ${N_{MLR}}$ $\bar m$ $\overline {MLR} $ PSO (particle swarm optimization) algorithm
-
Inspired by the behaviors of bird populations, PSO is developed as an alternative optimization algorithm. PSO algorithm includes velocity and position models, where the velocities of particles are used to update the positions of the particles, and the positions represent the potential solutions in the search ranges. The velocity and position updating processes require each particle to keep in mind the previous optimal position as well as the global optimal position searched by all particles. At the beginning of iteration, the velocities and positions of the particles are randomly assigned according to a specified range. Then they are updated according to the following relationship:
$ v_{ij}^{k + 1} = v_{ij}^k + {q_1}(x_{ij}^{pb} - x_{ij}^k) + {q_2}(x_{ij}^{gb} - x_{ij}^k) $ (21) $ x_{ij}^{k + 1} = x_{ij}^k + v_{ij}^{k + 1} $ (22) where
$i$ $j$ $ x $ $ v $ $ {x^{pb}} $ $ {x^{gb}} $ SCE (shuffled complex evolution) algorithm
-
SCE is an efficient optimization algorithm due to its excellent global search performance and convergence speed, and it is suitable for solving high-dimensional complex nonlinear problems. The main principle of SCE is that each parameter has its own specific search range, within which the fitting value is calculated for each randomly generated individual as well as the ranking. The probability that an individual is selected is:
$ f\left( {{x_k}} \right) = n + 1 - k \quad (k = 1,2,3 \cdots ,n) $ (23) $ p\left( {{x_k}} \right) = \displaystyle\frac{{f\left( {{x_k}} \right)}}{{\displaystyle\mathop \sum \nolimits_{k = 1}^n f\left( {{x_k}} \right)}} = \displaystyle\frac{{2\left( {n + k - 1} \right)}}{{n\left( {n + 1} \right)}} $ (24) where
${x_k}$ $n$ $f\left( {{x_k}} \right)$ $p\left( {{x_k}} \right)$ -
In this section, we analyze the kinetics of wood pyrolysis based on thermogravimetric experimental data obtained at the three different heating rates (5, 10 and 20 K/min), followed by an analytical discussion of the performance of the three algorithms, GA, PSO and SCE, in terms of both efficiency and accuracy in optimizing the kinetic parameters.
Analyses of thermogravimetric results
-
Figure 1 shows the measured mass and MLR curves during wood pyrolysis at different heating rates. Both mass and MLR data are normalized by the initial mass
${m_0}$ 
Figure 1.
Dependencies of (a) mass and (b) MLR of beech wood on temperature at different heating rates.
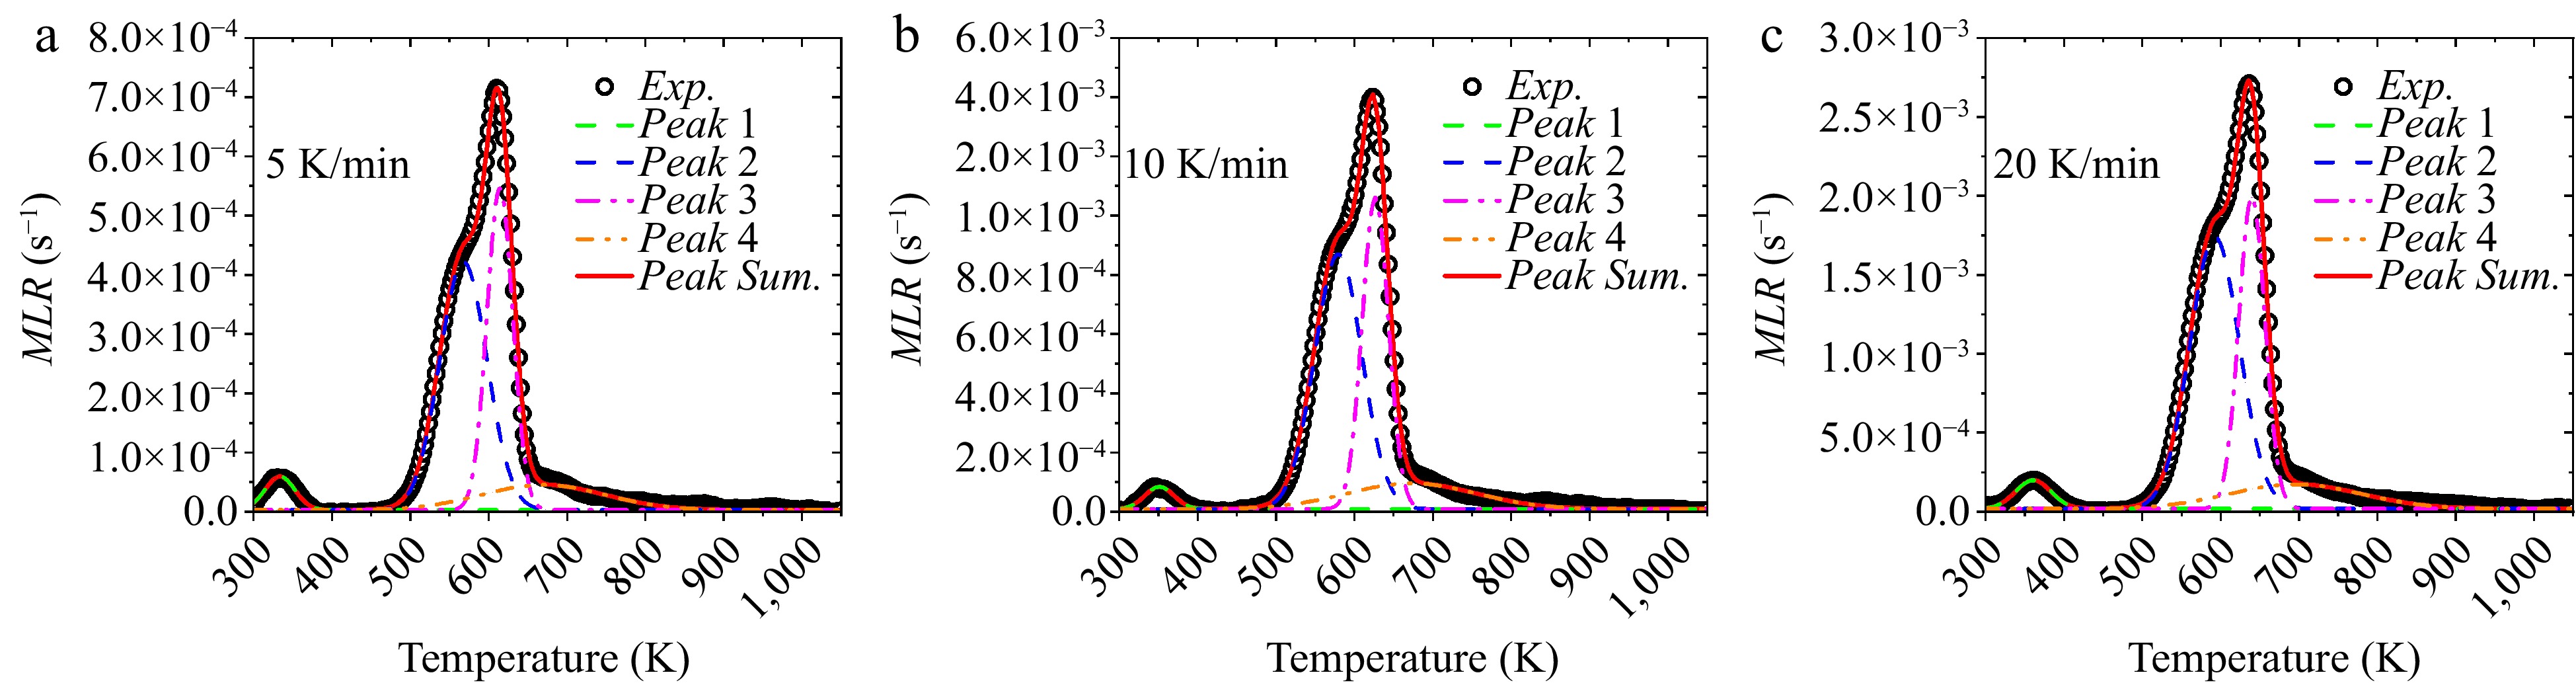
Figure 2.
Separated MLR curves using Gauss multi-peak fitting method at different heating rates.
Kinetic analyses
-
Pyrolysis reaction scheme of beech wood, including four elemental reactions, is listed in Table 1. Based on previous studies[24], the reaction of water, hemicellulose and cellulose can be described by first order reactions, while lignin is a high-order reaction. Consequently, there are totally 12 parameters, excluding the stoichiometric coefficient of water evaporation, in each optimization run. Therefore, in this section the kinetic analyses are implemented for these four components using the methods introduced previously.
Table 1. Reaction mechanism of beech wood.
# Reaction 1 Water → Vapor 2 Hemicellulose → θ1 Char + (1−θ1) Gas_H 3 Cellulose → θ2 Char + (1−θ2) Gas_C 4 −Lignin → θ3 Char + (1-θ3) Gas_L Based on the separated curves in Fig. 2, the Kissinger method is first used to estimated kinetics of each reaction. Plotting
${\text{ln}}( {\beta /{T_p^2}} )$ $1/{T_p}$ $A$ ${E_a}$ $A$ ${E_a}$ ${\text{ln}} ( {\beta /{T^2}} )$ $1/T$ $\ln ( {\beta /{T^{1.894661}}} )$ $1/T$ ${\text{ln}}( {\beta /{T^2}} )$ $1/T$ ${E_a}$ 
Figure 3.
Linear fittings of ${\text{ln}}( {\beta /{T_p}^2} )$ vs $1/{T_p}$ in the Kissinger method.
Table 2. Estimated $A$ (s−1) and ${E_a}$ (kJ/mol) of wood pyrolysis by the Kissinger, KAS, Tang, and DAEM methods.
Component Kissinger KAS Tang DAEM Average A Ea A Ea A Ea A Ea A Ea Water 1.49 × 10³ 44.8 1.01 × 10³ 42.6 2.61 × 10³ 42.9 1.53 × 10³ 42.6 1.72 × 10³ 42.7 Hemicellulose 1.12 × 10¹² 147.8 1.30 × 10¹³ 144.7 3.06 × 10¹³ 154.9 9.31 × 10¹² 144.7 1.77 × 10¹³ 148.1 Cellulose 4.09 × 10¹² 166.3 4.70 × 10¹² 174.8 4.84 × 10¹² 169.7 4.12 × 10¹² 174.8 4.55 × 10¹² 173.1 Lignin 2.34 × 10¹¹ 180.5 6.40 × 10¹¹ 170.7 1.46 × 10¹² 171.2 7.96 × 10¹¹ 170.7 9.66 × 10¹¹ 170.9 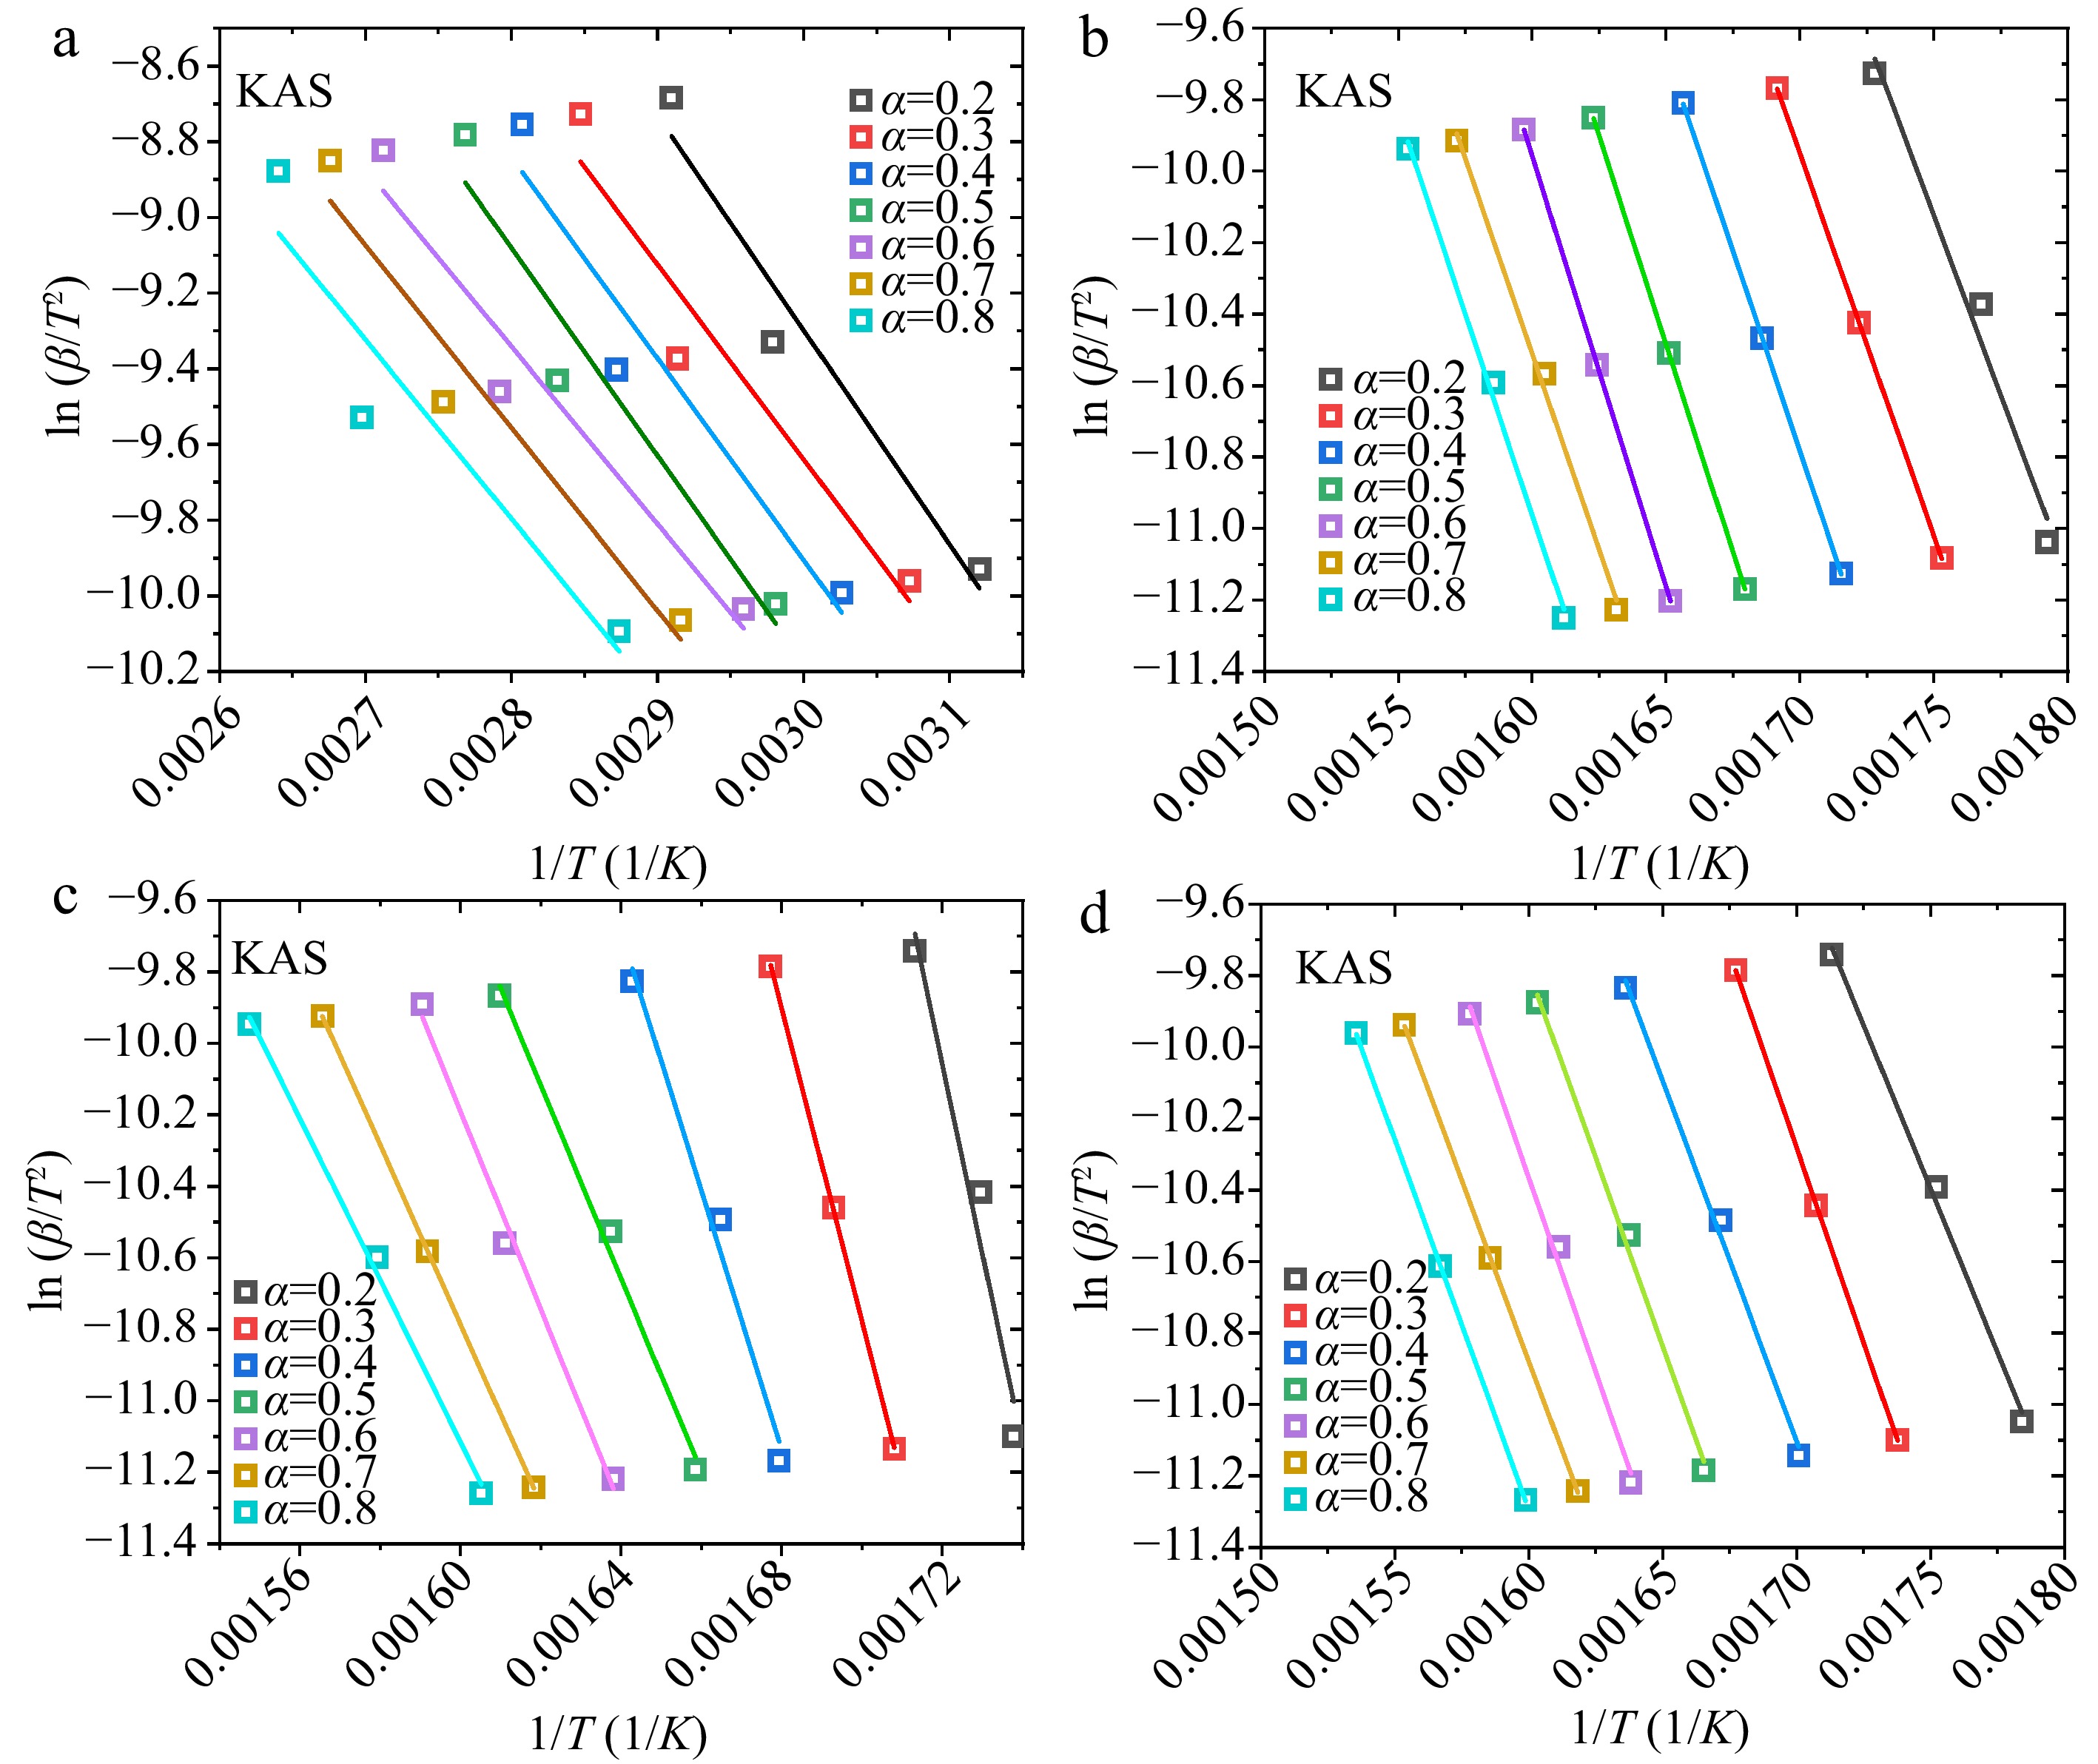
Figure 4.
Linear fittings of ${\text{ln}}( {\beta /{T^2}} )$ vs $1/T$ plots in the KAS method: (a) water, (b) hemicellulose, (c) cellulose, (d) lignin.
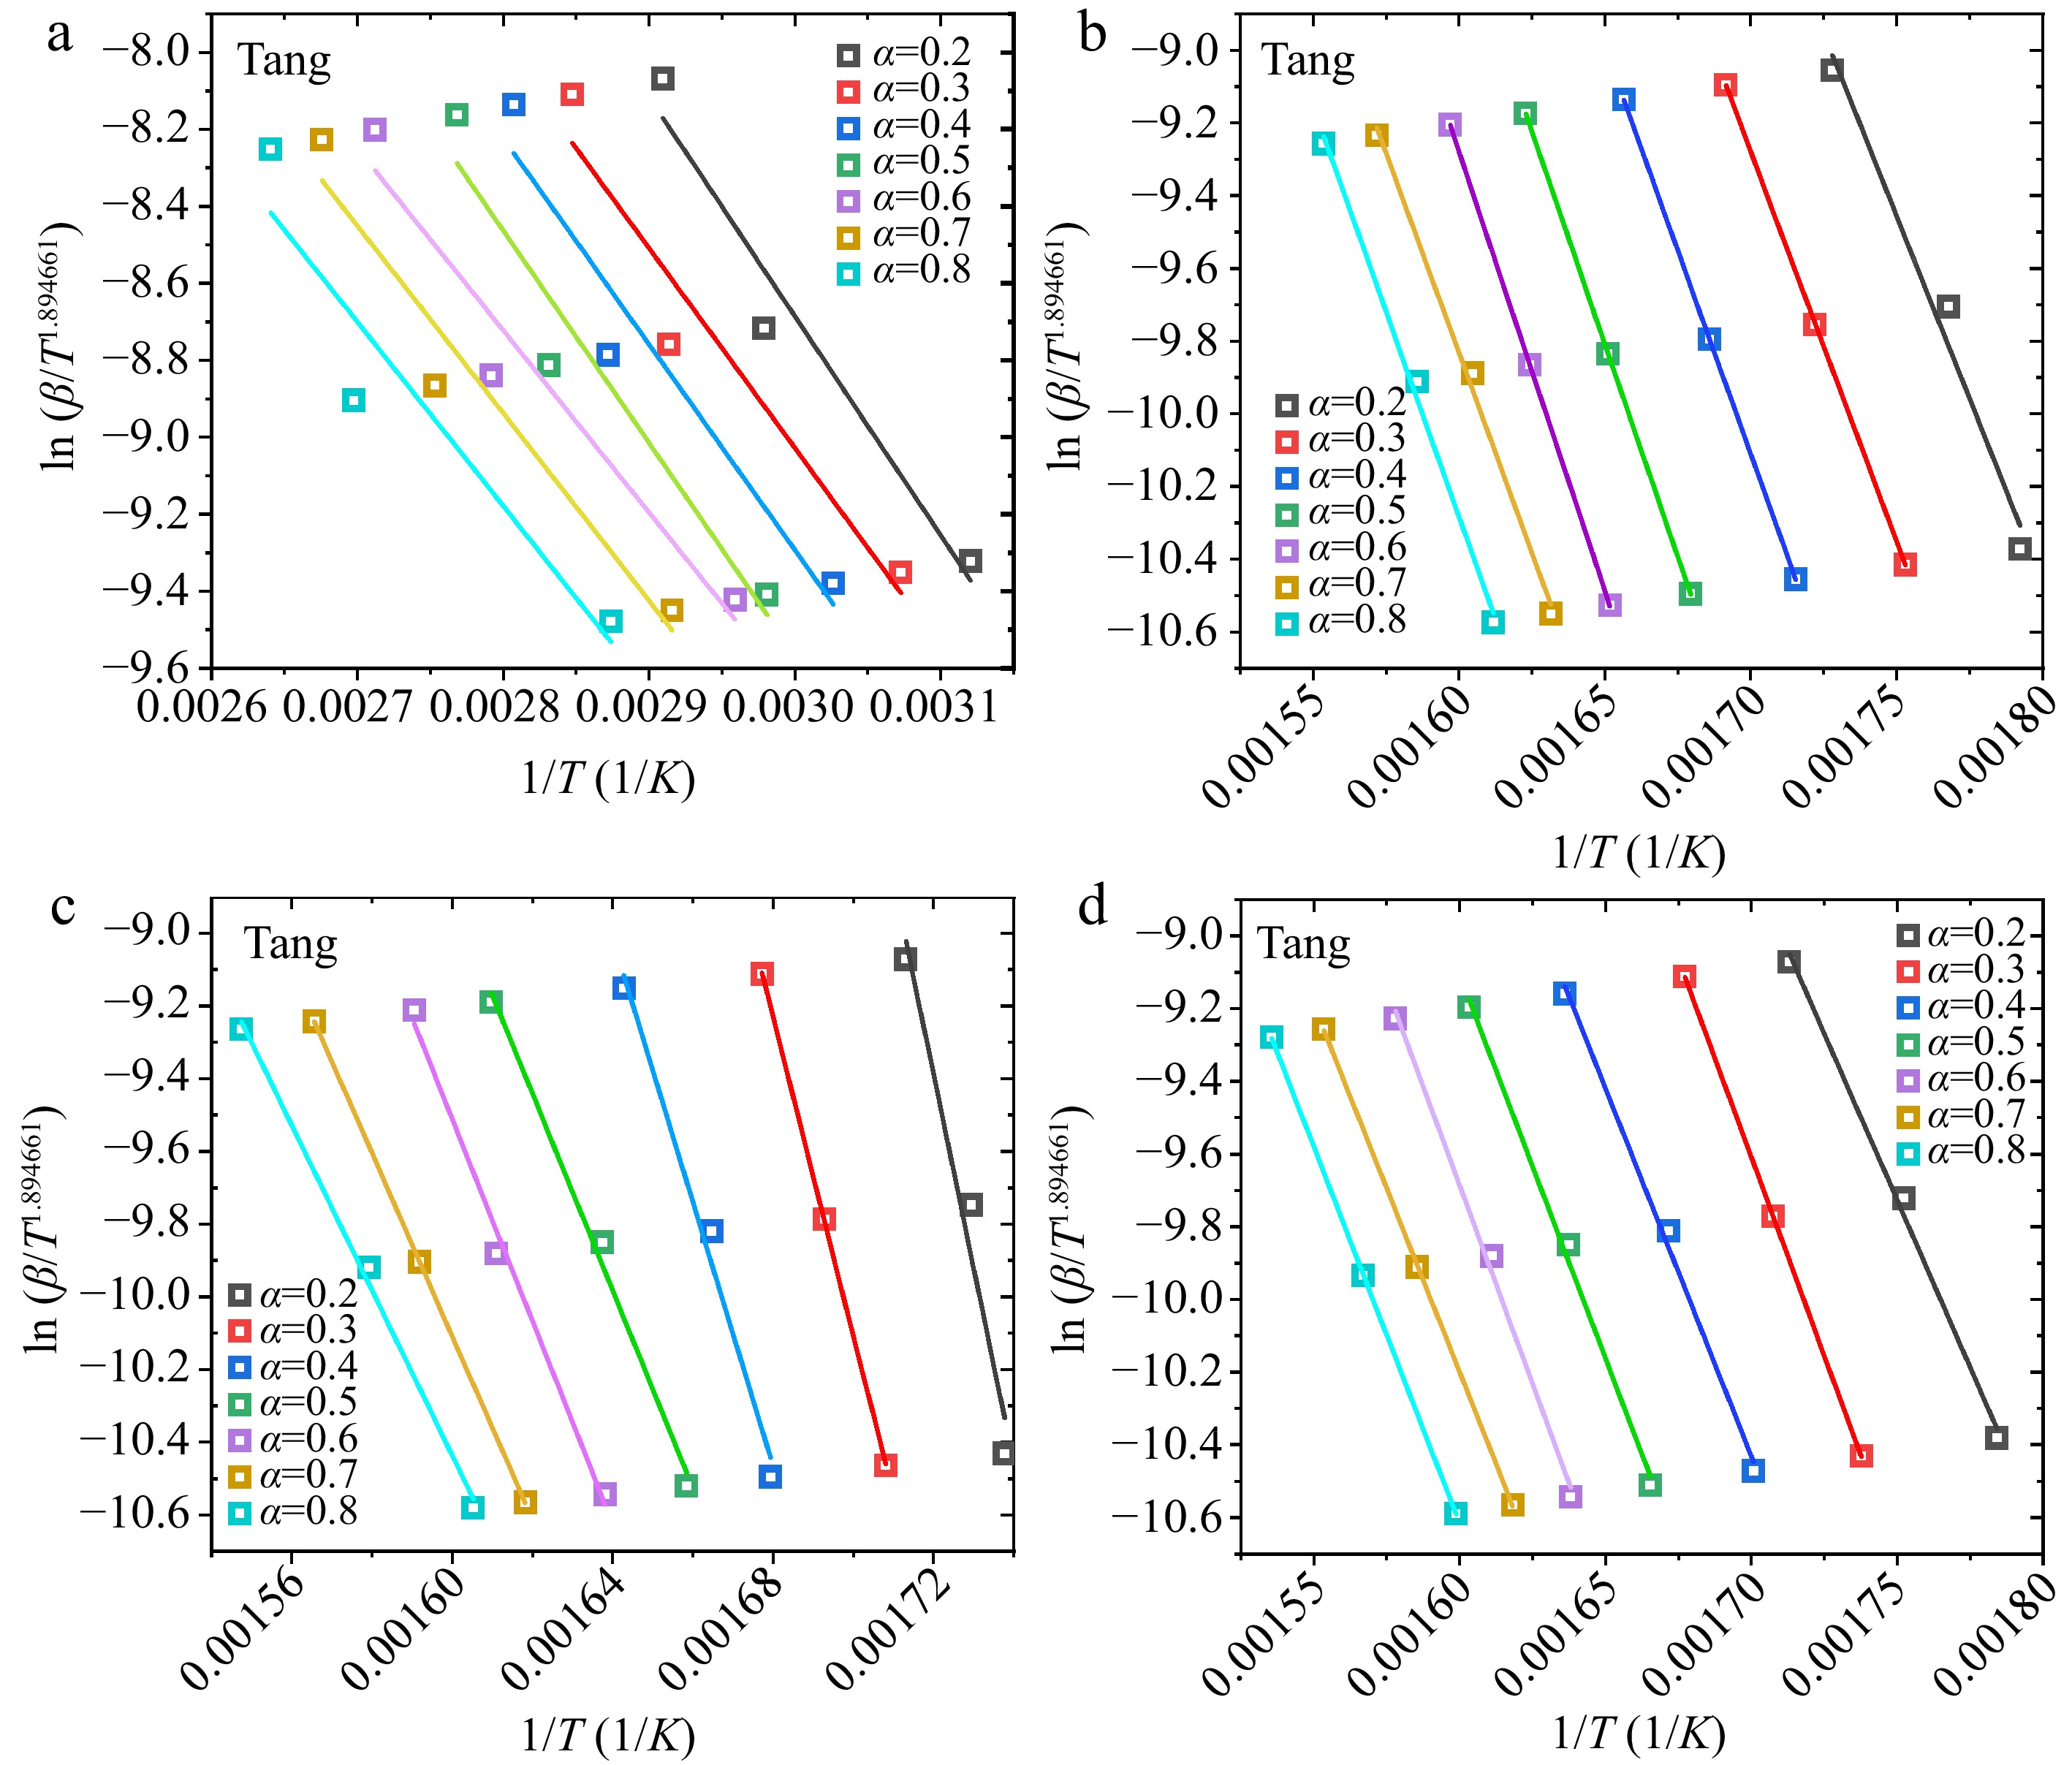
Figure 5.
Linear fittings of $\ln ( {\beta /{T^{1.894661}}} )$ vs $1/T$ plots in the Tang method: (a) water, (b) hemicellulose, (c) cellulose, (d) lignin.
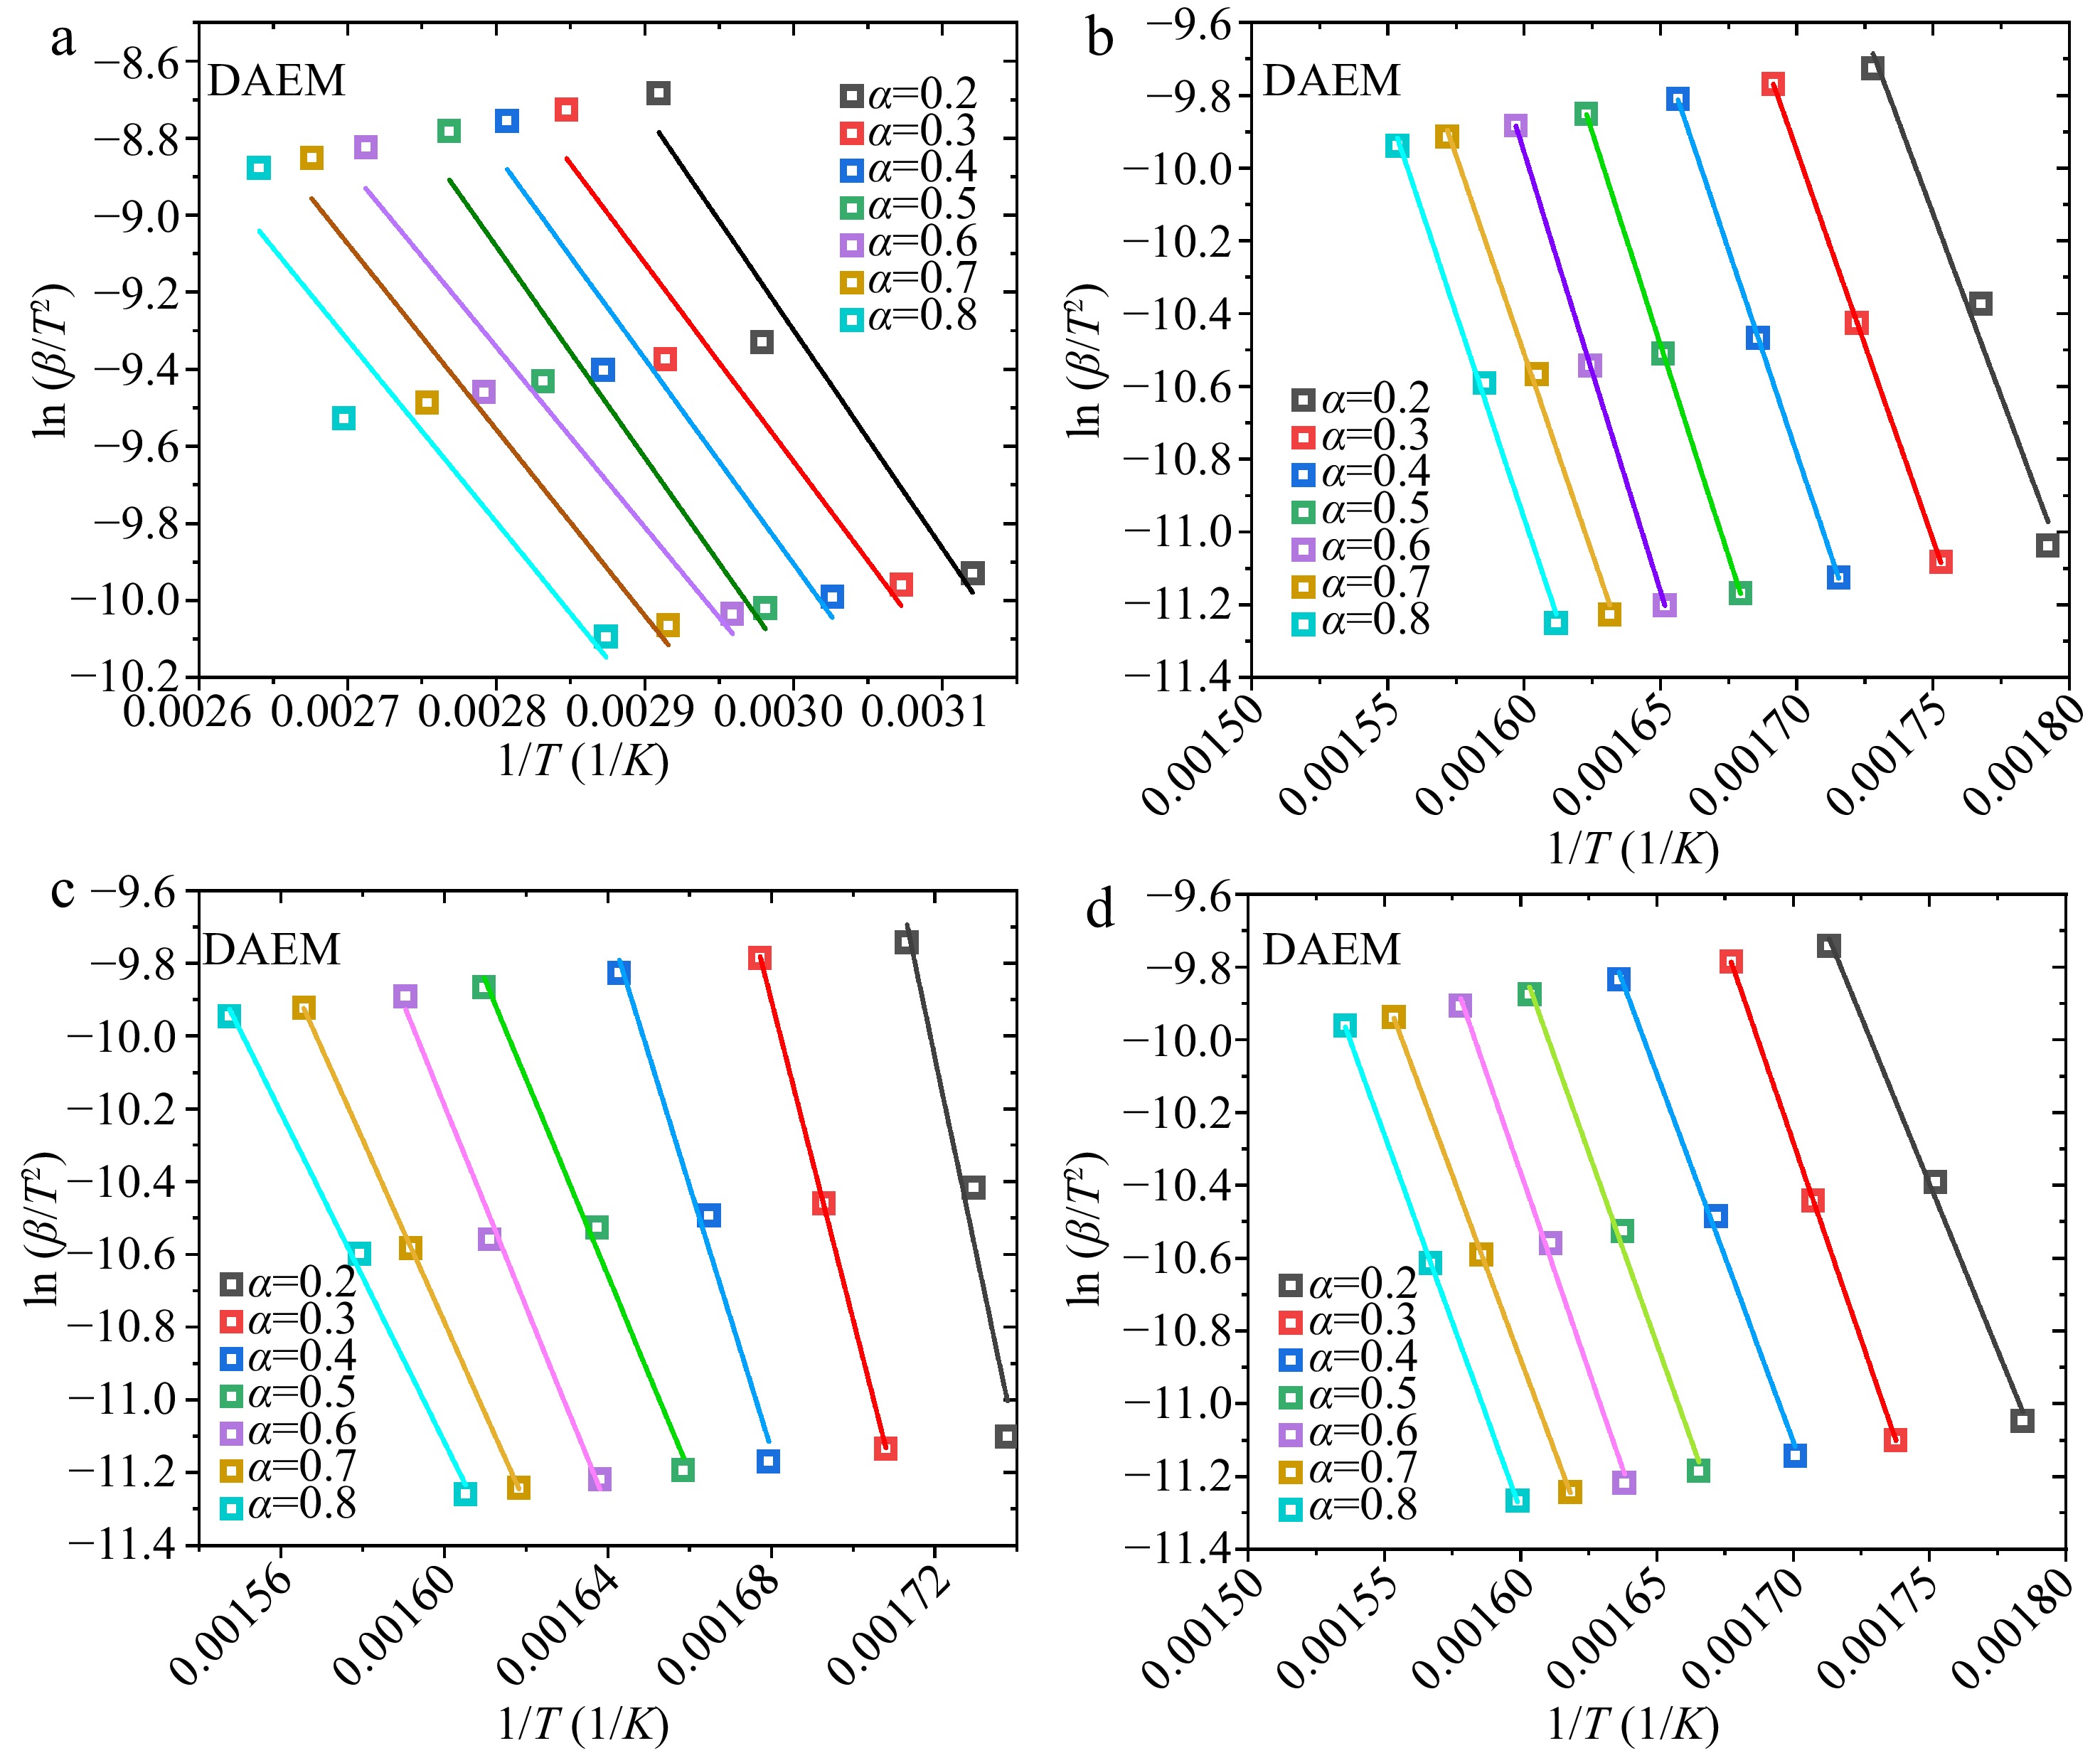
Figure 6.
Linear fittings of ${\text{ln}}( {\beta /{T^2}} )$ vs $1/T$ plots in the DAEM method: (a) water, (b) hemicellulose, (c) cellulose, (d) lignin.
The calculated A and
${E_a}$ ${E_a}$ ${\text{ln}}( {\beta /{T^2}} )$ $1/T$ ${E_a}$ ${E_a}$ $\left( {{E_{a,max}} - {E_{a,min}}} \right)/{E_{a,ave}}$ 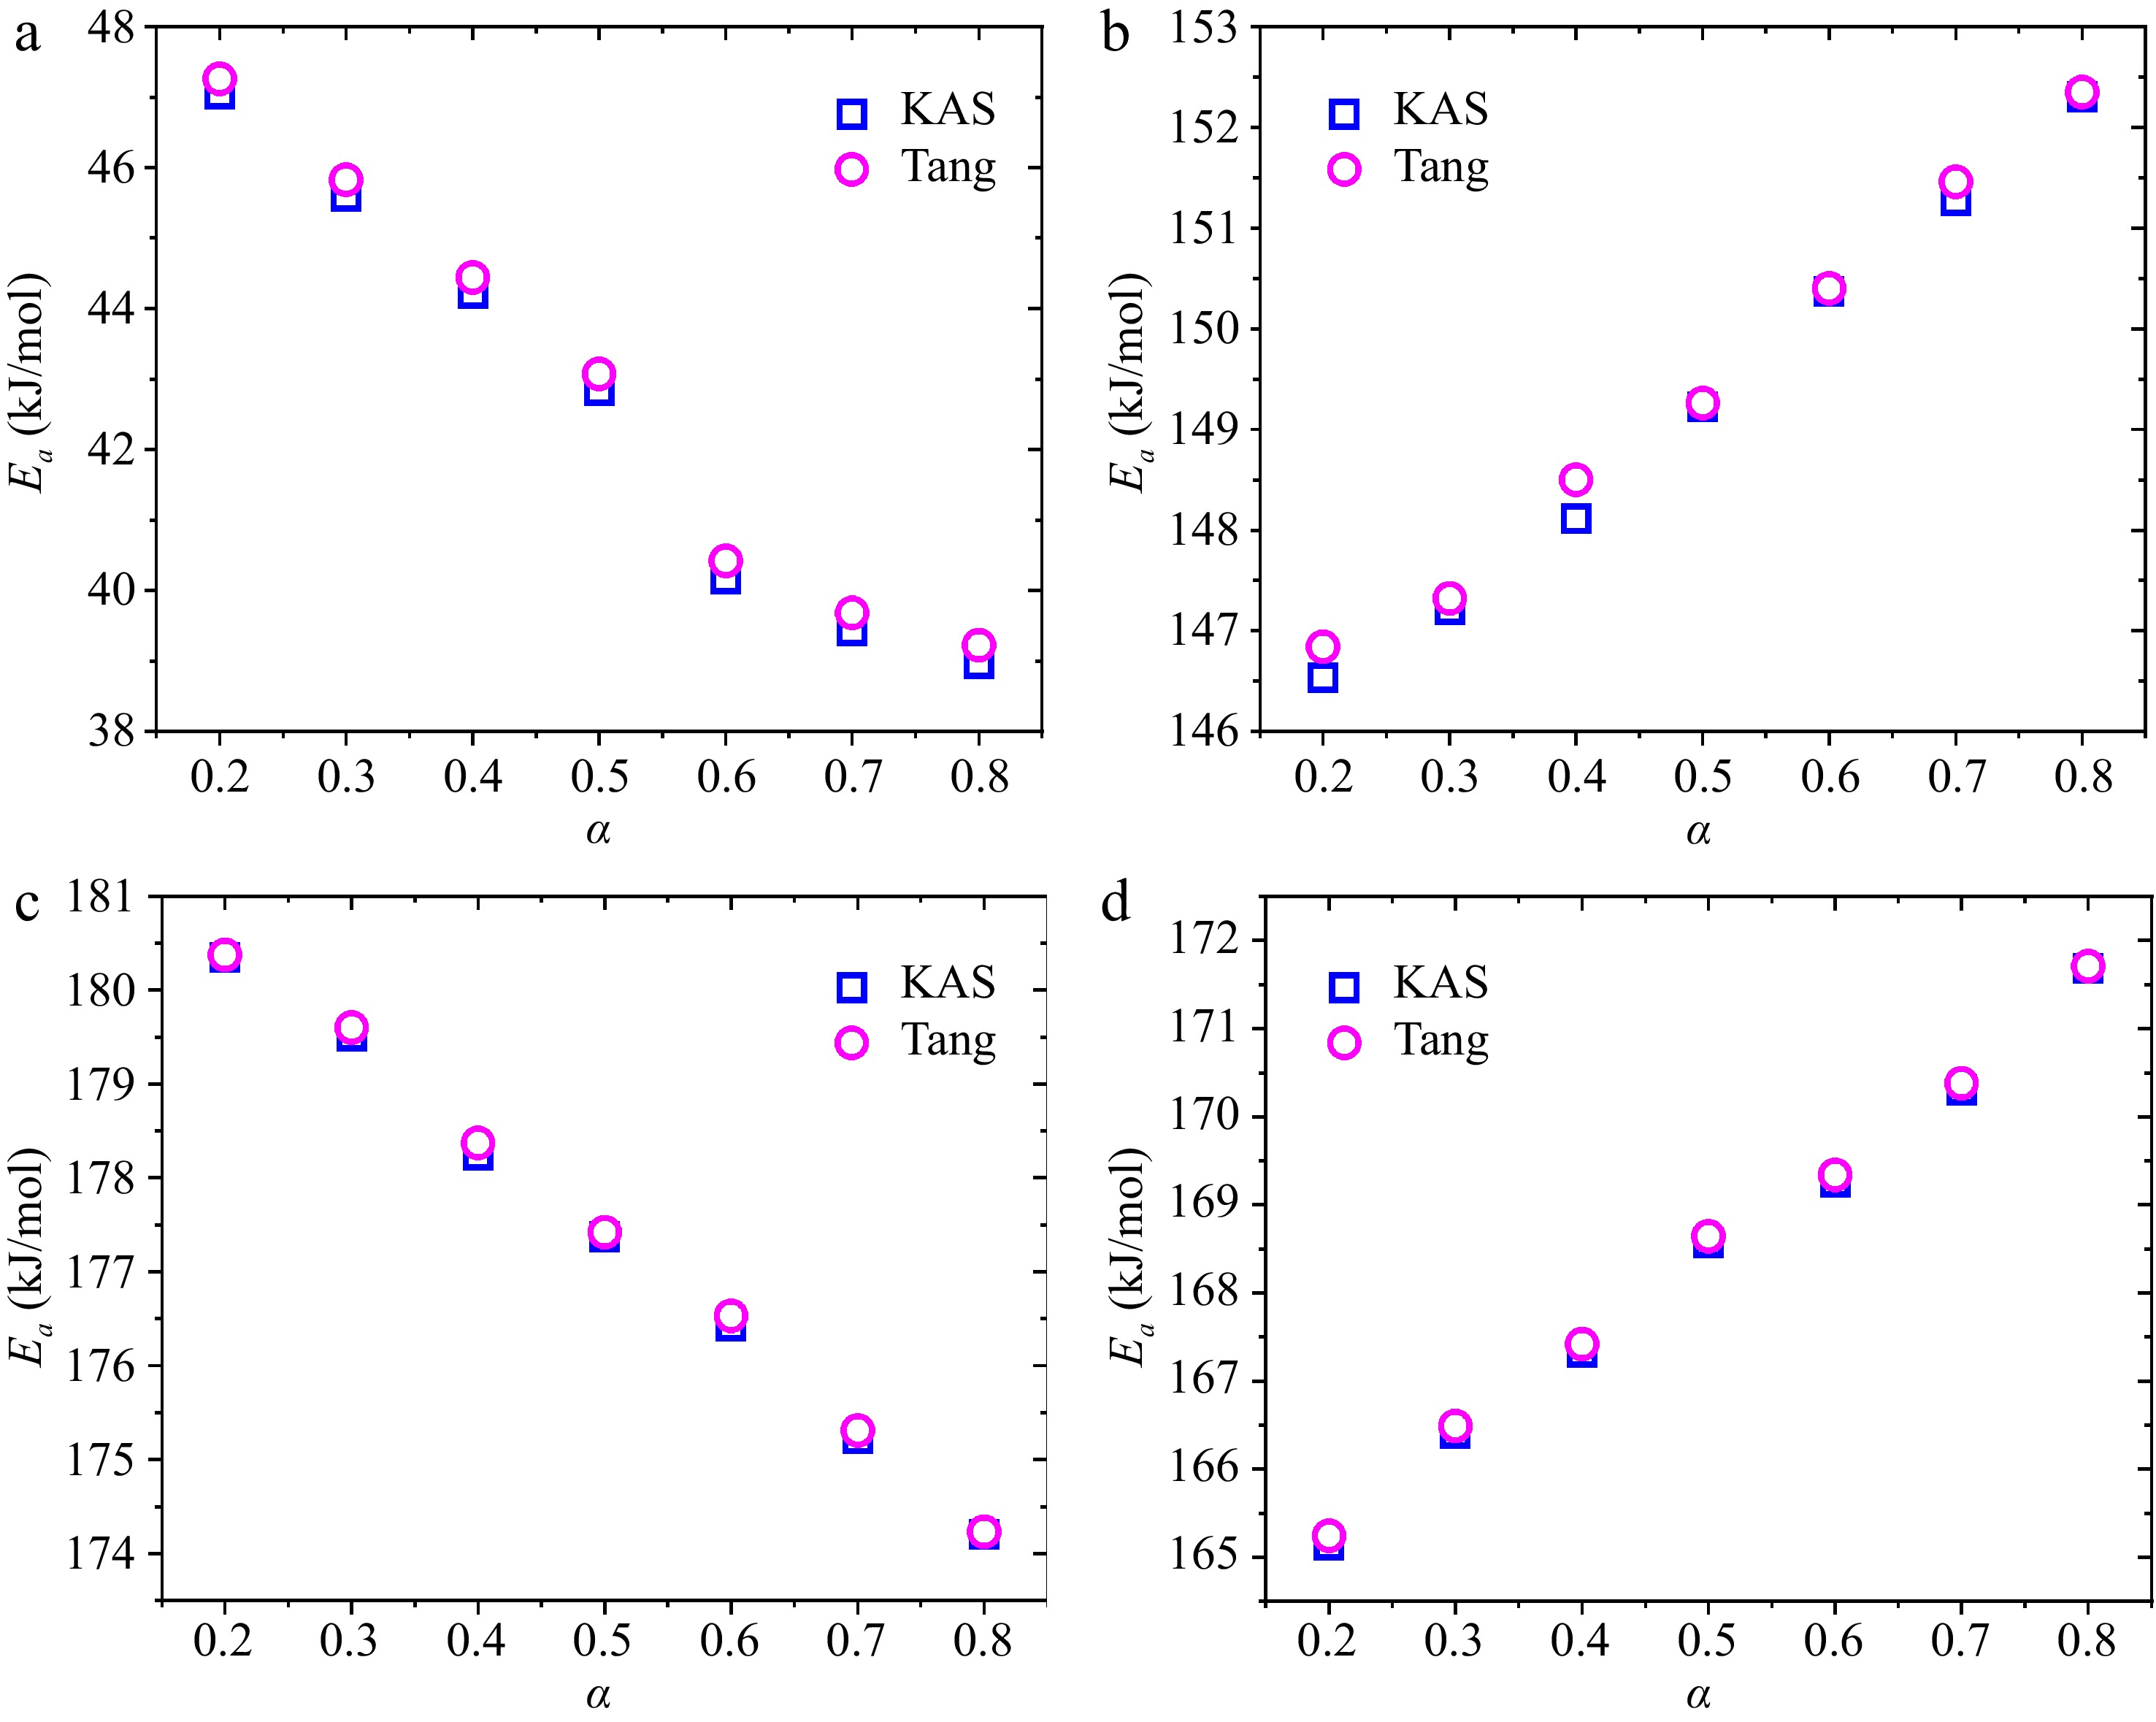
Figure 7.
Dependencies of calculated ${E_a}$ on α using the KAS and Tang methods: (a) water, (b) hemicellulose, (c) cellulose, (d) lignin.
Comparison of accuracy of GA, PSO and SCE
-
To compare the optimization performance of the three focused algorithms, the same optimization settings are used for each algorithm. The average values of the four analytical methods in Table 2 are used in determining the search ranges. More specifically, these average values are employed as the mean values of the search ranges during optimization. The lower bounds of search ranges are set to be 0.1 times of the mean values, while the upper bounds are selected to ensure these mean values are the average values of the search ranges. Figure 8 shows the values of objective function (R2) and computation times (tcom) of the optimization runs using the three algorithms with 200-3000 population sizes and fixed iteration number of 200. R2 of GA changes irregularly as the population size is smaller than 1000, but it declines with further increase of population size. This phenomenon indicates the accuracy of GA strongly depends on population size. R2 of PSO descents quickly for population size smaller than 800 and increase slightly beyond this range. While the R2 of SCE are always very low and changes slightly with varying population size, suggesting the accuracy of SCE is very high and is barely affected by population size. In Fig. 8b, tcom of the three algorithms all increase with population size. The difference is that both tcom and its increasing rate of SCE are much larger than those of GA and PSO, implying the computation efficiencies of GA and PSO are approximately identical to each other and both are higher than that of SCE. As introduced in by Shi et al.[24], each iteration of SCE involves multiple complex systems, and therefore the computational complexity is higher than the other two algorithms, requiring a larger amount of computational and storage resources. Meanwhile, Table 3 lists tcom and R2 of the three algorithms with varying population sizes. Distinctly, the computation efficiencies of the three algorithms are ranked as GA ≈ PSO > SCE, while the accuracies are ranked as SCE > PSO > GA.
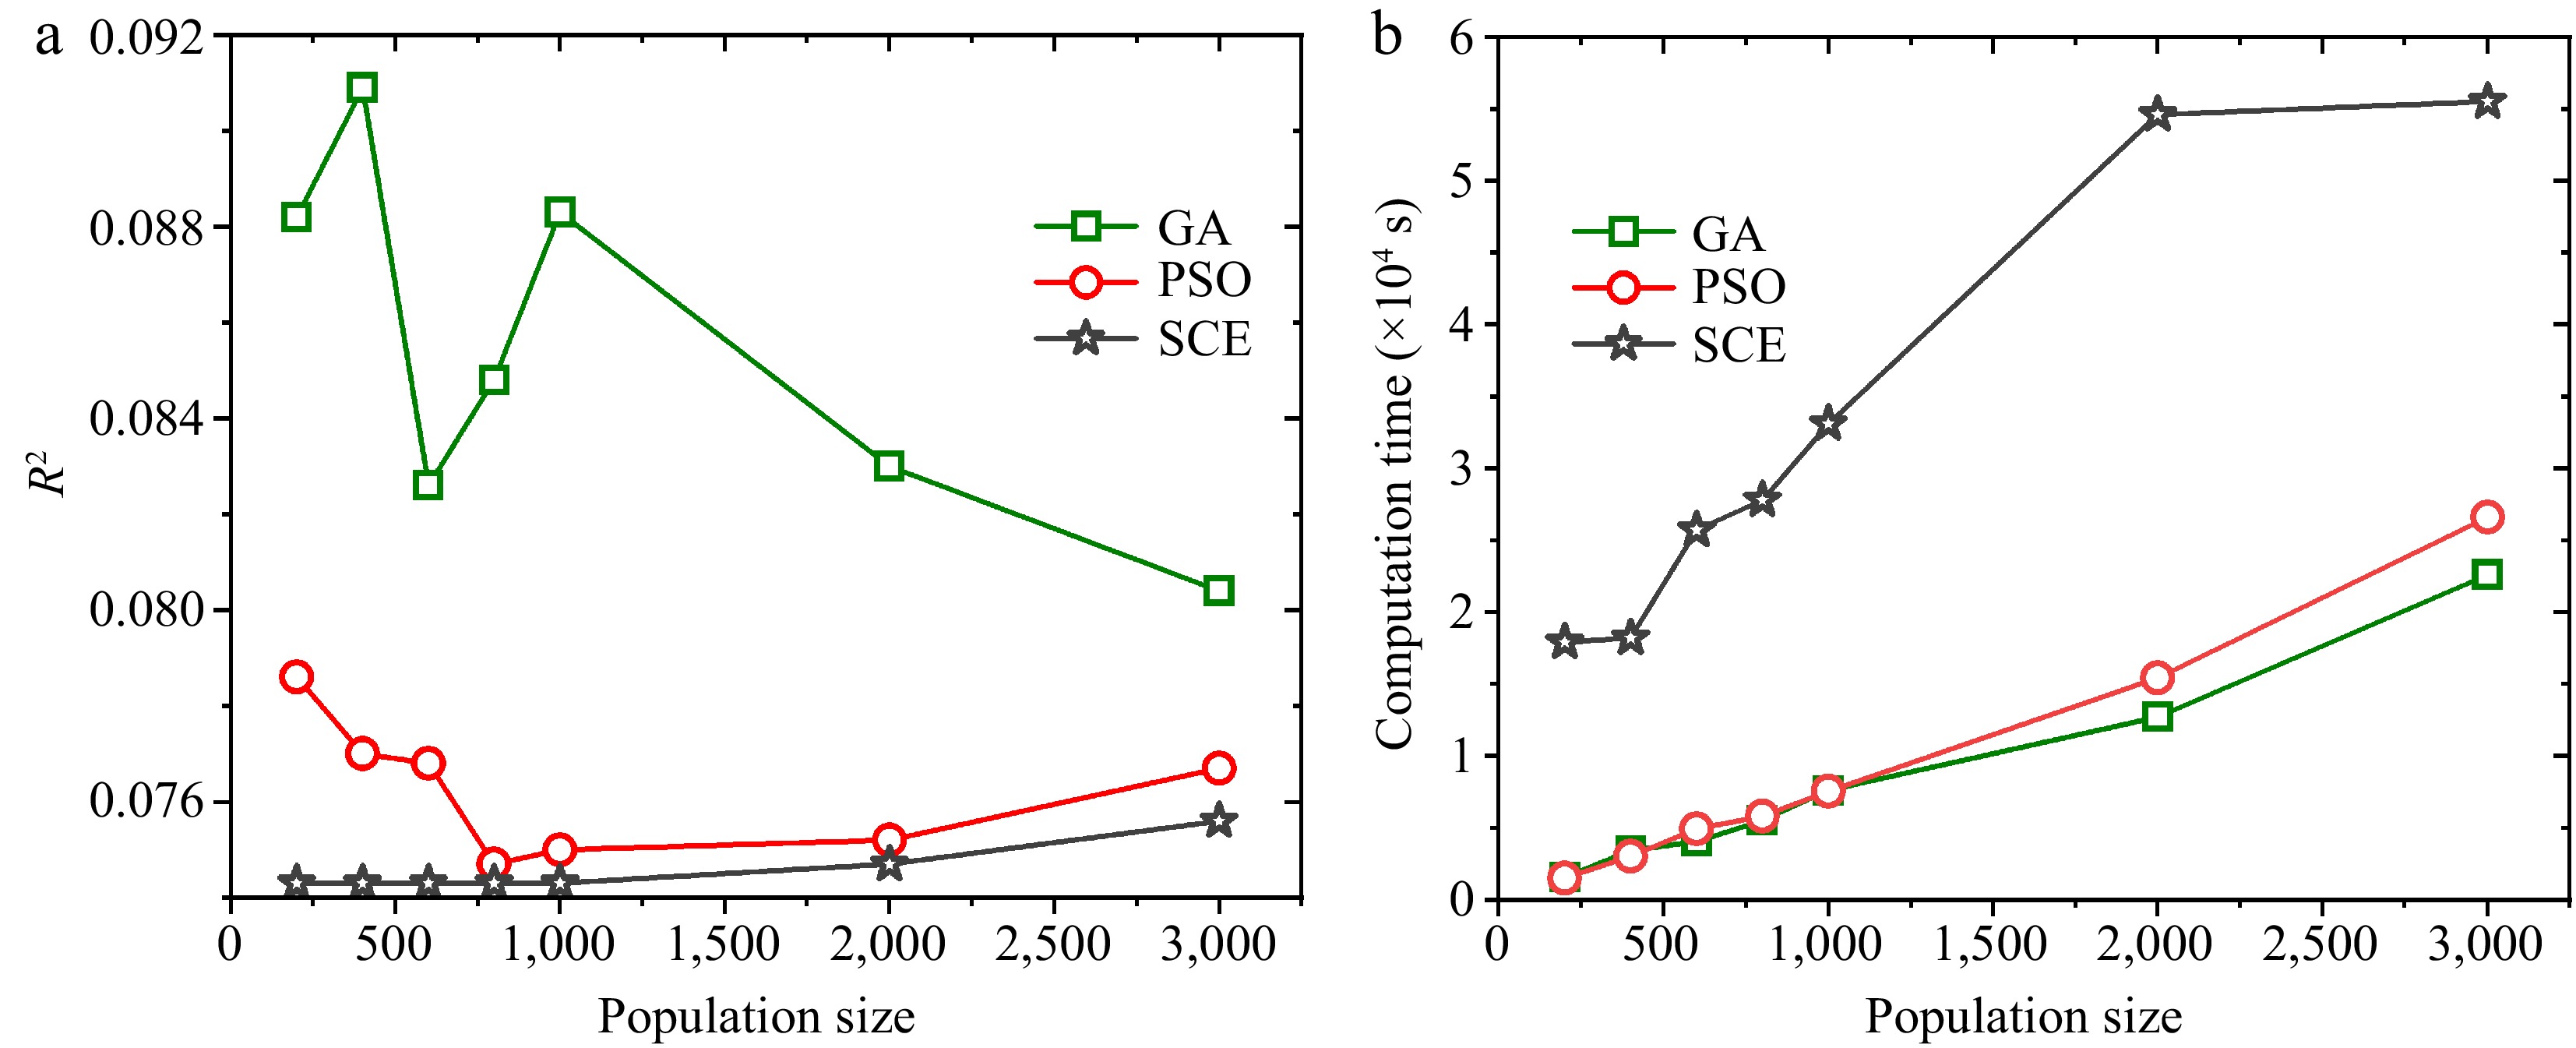
Figure 8.
Objective function values and the computation times of the three algorithms when optimizing kinetics of wood pyrolysis with 200-3000 population sizes and 200 iterations.
Table 3. Computation times and ${R^2}$ of GA, PSO and SCE optimizations.
Population size GA PSO SCE tcom × 104 (s) R2 × 10−2 tcom × 104 (s) R2 × 10−2 tcom × 104 (s) R2 × 10−2 200 0.16 8.82 0.15 7.86 1.79 7.43 400 0.34 9.09 0.30 7.70 1.82 7.43 600 0.40 8.26 0.49 7.68 2.57 7.43 800 0.55 8.48 0.58 7.47 2.78 7.43 1,000 0.76 8.83 0.75 7.50 3.31 7.43 2,000 1.27 8.30 1.54 7.52 5.46 7.47 3,000 2.26 8.44 2.66 7.67 5.55 7.56 Comparison of efficiency of GA, PSO and SCE
-
Similarly, the convergence efficiencies of the three algorithms are compared using fixed population size of 3000 and 6000 iterations, and the evolutions of R2 are portrayed in Fig. 9. GA, PSO, and SCE converge at 1000, 500, and 800 iterations, respectively. Meanwhile, the decreasing rate of R2 of PSO is higher than the two others. Consequently, it can be reasonably concluded that the convergence efficiencies of three algorithms can be ranked as PSO > SCE > GA. However, in Fig. 8b, the computation efficiencies are ranked as GA ≈ PSO > SCE. In Fig. 8b and Table 3, SCE consumes much more time than GA and PSO, up to approximately 12 times. Apparently, each algorithm has its inherent merits and limits. Overall, PSO is a more favorable algorithm featuring high accuracy, computation efficiency and convergence efficiency. Nevertheless, particular care should be taken when applying it since it may fall into local optimal solution.

Figure 9.
Objective function value evolutions of the three algorithms when optimizing kinetics of wood pyrolysis with 3,000 population size and 6,000 iterations.
Parameter validation
-
In all the optimization runs in above, the minimum values of R2 for GA, PSO, and SCE are 0.0826, 0.0747, and 0.0743, respectively. These optimizations are conducted at 10 K/min heating rate and the corresponding results are listed in Table 4. Apparently, with identical optimization setting, only minor deviations exit among different algorithms. In order verify the reliability of the optimized parameters, the experimental results of 5 and 20 K/min heating rates are predicted using the numerical model and the kinetics listed in Table 4, as exhibited in Figs 10−12 corresponding to GA, PSO, and SCE, respectively. Existing studies[23] revealed that hemicellulose pyrolysis is mainly responsible for the asymmetric shoulder of the MLR curve, cellulose decomposition is related to the main peak, and lignin decomposition is located at a higher temperature range. In Figs 10 & 11, corresponding to GA and PSO algorithms, the numerical curves fit the experimental data well and the relative locations of the subpeaks agree with the literature. Nevertheless, in Fig. 12 the peak temperature of lignin is lower than that of cellulose despite the overall good agreement, conflicting with the existing conclusion. This divergence is presumably caused by the compensation effect among A,
${E_a}$ Table 4. Best optimized kinetics of wood pyrolysis by GA, PSO and SCE.
Component Parameter Search range GA PSO SCE Water A (s−1) 1.72 × 10²−1.72 × 10⁴ 1.47 × 10⁴ 1.49 × 10⁴ 1.49 × 10⁴ Ea (kJ/mol) 4.28 × 10⁴−4.48 × 10⁴ 4.4 × 10⁴ 4.4 × 10⁴ 4.4 × 10⁴ Hemicellulose A (s−1) 9.41 × 10¹¹−9.41 × 10¹³ 5.53 × 10¹² 4.49 × 10¹² 4.18 × 10¹² Ea (kJ/mol) 1.38 × 10⁵−1.58 × 10⁵ 1.4 × 10⁵ 1.38 × 10⁵ 1.38 × 10⁵ θ 0−0.5 0.28 0.38 0.37 Cellulose A (s−1) 4.32 × 10¹¹−4.32 × 10¹³ 4.09 × 10¹² 3.95 × 10¹² 4.09 × 10¹² Ea (kJ/mol) 1.6 × 10⁵−1.8 × 10⁵ 1.63 × 10⁵ 1.63 × 10⁵ 1.64 × 10⁵ θ 0−0.5 0.13 0.12 0.12 Lignin A (s−1) 6.0 × 10¹⁰−6.0 × 10¹² 2.22 × 10¹¹ 1.96 × 10¹¹ 1.15 × 10¹¹ Ea (kJ/mol) 0−3.0 × 10⁵ 1.23 × 10⁵ 1.16 × 10⁵ 1.13 × 10⁵ θ 0−1 0.14 0.01 0.01 n 0−5 4.67 4.99 5 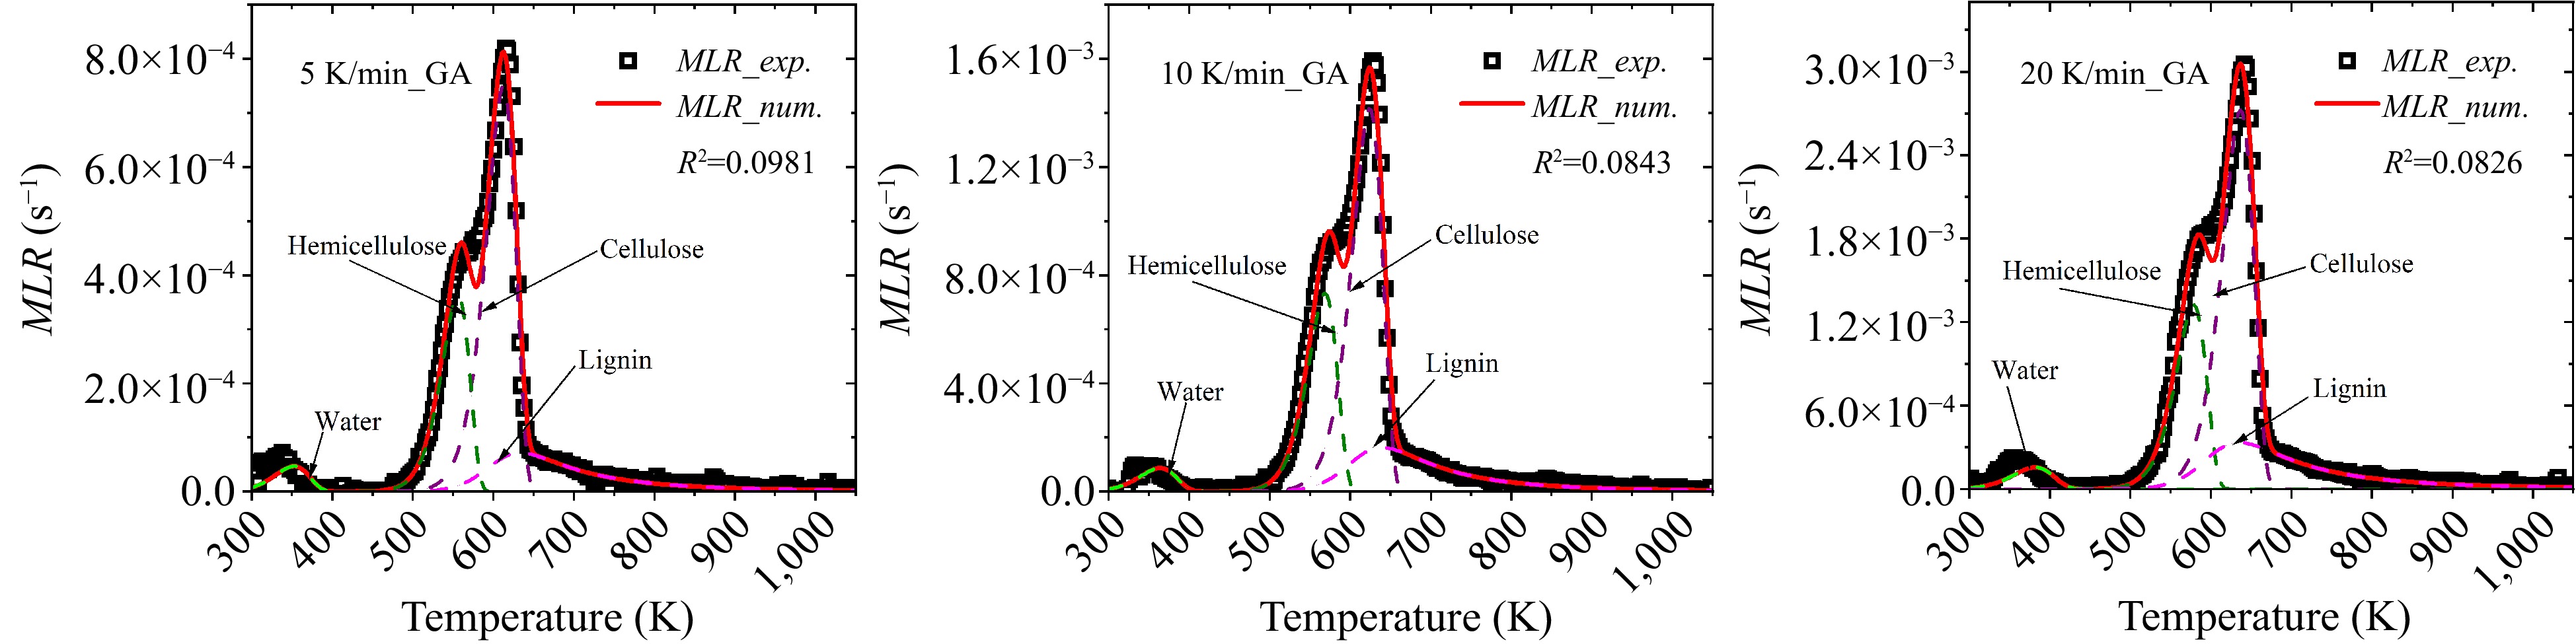
Figure 10.
Comparison between experimental and numerical MLRs using optimized parameters of GA at 5, 10 and 20 K/min heating rates.

Figure 11.
Comparison between experimental and numerical MLRs using optimized parameters of PSO at 5, 10 and 20 K/min heating rates.
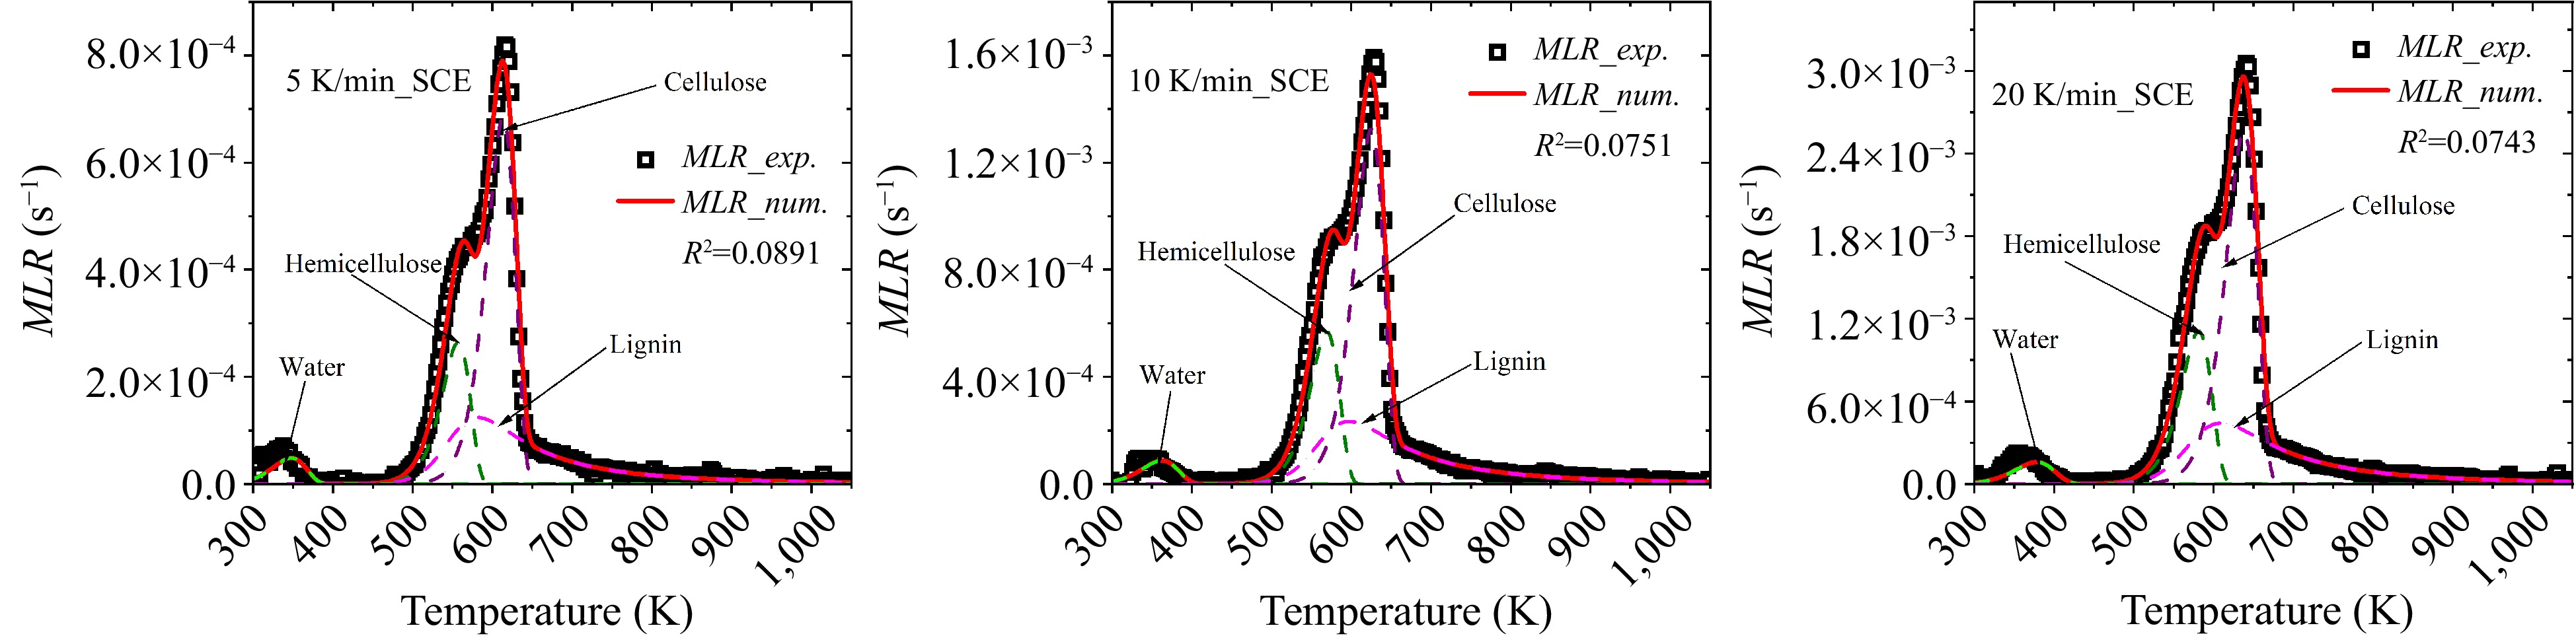
Figure 12.
Comparison between experimental and numerical MLRs using optimized parameters of SCE at 5, 10 and 20 K/min heating rates.
-
Pyrolysis of beech wood was investigated experimentally at three heating rates of 5, 10, and 20 K/min. Based on the measured MLR curves, the overlapping peaks of wood was first separated by Gauss multi-peak fitting method to identify their contributions. Then, four analytical methods were used to determine
${E_a}$ An interesting conclusion attained is that no any single algorithm excels others in all aspects. A potential solution to this issue may be developing more advanced hybrid algorithms which could better balance the accuracy, computation efficiency, convergence efficiency, storage resource, etc. Meanwhile, these heuristic optimization algorithms can also be coupled with some artificial intelligence (AI) algorithms, such as machine learning, deep learning, support vector machines, decision trees, random forest, and metaheuristics. Even though AI has been successfully applied in many engineering applications, few attempts invoking AI have been made to challenge the complex pyrolysis process of biomass. All these need in-depth exploration in future studies.
This work is supported by the National Natural Science Foundation of China (51974164), Natural Science Foundation of Jiangsu Province of China (BK20221311), University Natural Science Research Project in Jiangsu Province (21KJA620002). The authors gratefully appreciate the support.
-
The authors declare that they have no conflict of interest. Junhui Gong is the Editorial Board member of Emergency Management Science and Technology who was blinded from reviewing or making decisions on the manuscript. The article was subject to the journal's standard procedures, with peer-review handled independently of this Editorial Board member and his research groups.
- Copyright: © 2023 by the author(s). Published by Maximum Academic Press on behalf of Nanjing Tech University. This article is an open access article distributed under Creative Commons Attribution License (CC BY 4.0), visit https://creativecommons.org/licenses/by/4.0/.
-
About this article
Cite this article
Wang H, Gong J. 2023. A comparative study of GA, PSO and SCE algorithms for estimating kinetics of biomass pyrolysis. Emergency Management Science and Technology 3:9 doi: 10.48130/EMST-2023-0009 

A comparative study of GA, PSO and SCE algorithms for estimating kinetics of biomass pyrolysis
- Received: 13 June 2023
- Accepted: 21 August 2023
- Published online: 08 September 2023
Abstract: Optimization performances of three most frequently utilized optimization algorithms, GA (Genetic Algorithm), PSO (Particle Swarm Optimization), and SCE (Shuffled Complex Evolution), are compared to examine their accuracy, computation efficiency, and convergence efficiency. Micro scale TGA (thermogravimetric analysis) experiments of wood were conducted at three heating rates to collect the necessary data for analysis. Gauss multi-peak fitting method was first applied to identify the contribution of each component of wood to the mass loss rate (MLR) curves. Then the Kissinger method and three isoconversional methods, including KAS, Tang, and DAEM methods, were employed to extract kinetics of wood pyrolysis. The average values of the four sets of solutions were adopted to determine the search range in the following optimizations. A thermally thin numerical model was developed to inversely model the collected experimental data combining the three algorithms. The results showed that wood pyrolysis can be described by a four-component parallel reaction scheme. The four sets of kinetic parameters derived using different analytical methods are very close to each other. When extracting kinetics from experimental data using numerical model and optimization algorithms, the accuracies of the three algorithms are ranked as SCE > PSO > GA. While the computation efficiencies and convergency efficiencies are ranked as GA ≈ PSO > SCE and PSO > SCE > GA, indicating each algorithm has its inherent advantages and limits. In most optimization applications, PSO is more favorable considering its better overall performance.