


-
Peach [Prunus persica (L.) Batsch], belongs to the Prunus genus and Rosaceae family and is the third most produced temperate tree fruit species behind apple and pear[1] with an estimated worldwide production of over 25 million metric tons[2].
Peach breeders are constantly developing cultivars with high horticultural and fruit quality traits along with improved disease resistance[3,4]. However, like in other woody perennial crops, breeding of peach is not an easy task. Due to the long juvenile stage and large plant size, peach breeding requires significant time and labor input[5]. Developing peach cultivars with disease resistance is particularly challenging. Sources of disease resistance are often present in exotic germplasm (landraces, wild relatives, and unadapted material) with unfavorable horticultural traits. Thus, introgression of resistance alleles to elite cultivars can take many generations, especially for those disease resistance traits that are polygenic in nature and controlled by many genes with small effect[3,4,6−8]. The use of predictive DNA information provides tools to make precise selection in different breeding stages (pre-breeding, parental and seedling selection, and advanced selection), which can accelerate genetic improvement and increase breeding efficiency[7,9].
DNA-informed breeding is becoming conventional for peach and other Rosaceae crops[7]. Using trait associated markers or tagging genes, breeders can select desirable individuals early in the development stage, and this strategy is called marker-assisted selection (MAS)[10,11]. In peach, markers associated with fruit quality traits[12] and disease resistance[13] have been identified and applied in breeding. However, MAS is suitable only for monogenic traits or simple quantitative traits which are controlled by small numbers of genes with relatively large effects[14]. Many complex traits[6,8] are controlled by multiple QTLs with relatively small effects and are highly sensitive to environmental conditions. Although the combined effects of those QTLs could be significant, the individual effects are difficult to capture, thus under this scenario, MAS would not be effective[14]. To overcome the limitation of MAS, genomic selection (GS) was proposed as an alternative approach. Instead of using only the markers with large effect, GS accounts for effects of whole genome markers simultaneously to predict genomic estimated breeding value (GEBV) for each individual, and can potentially explain more genetic variance than MAS, therefore is more appropriate for handling complicated traits with low heritability[5,14]. In Rosaceae crops, genomic prediction models have been successfully applied to different traits, for example, fruit texture[15], fruit firmness, soluble solids concentration and weighted cortical intensity[16] in apple; harvest time, fruit weight, flesh firmness, sugar content and heart rot in pear[17]; fruit weight, yield and soluble solids content in strawberry[18]; and fruit weight, sugar content and titratable acidity in peach[19].
A number of genomic prediction (GP) models have been developed as tools to facilitate GS. Different statistical methods have been implemented to solve the problem of limited number of phenotypic data and large number of genotypic data[20]. These models differ in their assumptions of the underlying genetic models. GBLUP[21,22] and rrBLUP[23] assume all markers have equal variances, thus shrinkage is performed equally to all marker effects. Bayesian models including BayesA, BayesB, BayesC[23,24], Bayesian Ridge Regression (BRR), and Bayesian Lasso (BL)[25] differ by applying different priors on marker variances[26]. Compared to GBLUP and rrBLUP, Bayesian models are more flexible with respect to genetic architecture, and better suited for traits controlled by QTLs with major effects[27].
Peach breeding germplasm has very narrow genetic background as the same group of cultivars can be found in the pedigrees of most of the accessions/cultivars 5-6 generations back[28,29]. Presently, Brazilian landrace cultivar Bolinha and peach cultivar Contender[30], released by North Carolina State University's peach breeding program, are the only confirmed sources of tolerance or resistance to brown rot in peach. In addition to the 'Bolinha'[31], University of California Davis' peach breeding program is also using almond as a source of brown rot resistance[32,33]. Previous studies have shown that brown rot resistance in peach is a complex polygenic trait with low heritability, and limited phenotypic variance explained by the detected QTLs/significant SNPs[6,30,33,34]. Under this scenario, GS is suggested as a more promising approach in comparison to MAS. The objective of this study was to evaluate the potential of applying GS for brown rot resistance in peach. The focus of this study was to evaluate different GP models using materials with different sources of resistance. To obtain reliable results, different cross validation schemes were applied to the analysis, as well as empirical cross validation using unphenotyped material. To our knowledge, this is the first GP study of brown rot resistance in peach, and the results presented here provide an important foundation for applying GS in peach.
-
A total of 326 pedigree-related accessions (Supplemental Fig. S1) from the Clemson University's peach breeding program were evaluated for fruit response to Monilinia fructicola infection. Parallel inoculation to non-wounded (NW) and wounded (W) fruits was applied to investigate skin and flesh resistance to brown rot, respectively. Brown rot disease severity index (DSI) in NW and W peach fruit, analyzed in six seasons (2015 to 2020) (Supplemental Table S1), ranged from 0−27.67 and 0.25−42.54 respectively, with the highest mean DSI observed in 2017 (5.92 for NW and 31.64 for W) (Supplemental Table S2).
NW and W DSI exhibited low (0.261) to moderate correlation (0.648) (p < 0.01) within the same year, except for 2019 (Supplemental Table S3), with the highest correlation observed in 2016 (r = 0.648). Considering the same treatment across different seasons, significant correlations (p < 0.01) for NW DSI were observed between 2015 and 2016 (r = 0.349), as well as 2019 and 2020 (r = 0.474); while W DSI had significant correlations (p < 0.05) between 2015 and 2016 (r = 0.507); 2015 and 2020 (r = 0.481); 2018 and 2019 (r = 0.397); 2019 and 2020 (r = 0.674).
Three different datasets were generated based on the source of resistance: the Bolinha dataset including 122 F1 progeny from nine breeding families with 'Bolinha' contributing the source of resistance (mainly phenotyped in 2015, 2016 and 2019); the Contender dataset including 81 F1 progeny from 14 breeding families with 'Contender' contributing the source of resistance (mainly phenotyped in 2017 and 2018); and the Combined dataset including all accessions in the testing panel. In order to eliminate the year effect and deal with missing data, best linear unbiased predictions (BLUPs) of NW and W DSI for each accession across all seasons were estimated and used as phenotype variables in the subsequent analysis of GWAS and GP. BLUPs varied from 0.26−9.04 and 20.38−30.69 for NW (mean = 2.38) and W (mean = 25.93) DSI, respectively (Supplemental Table S2). As expected, BLUPs were significantly (p < 0.05) associated with observed DSI in each year (Supplemental Table S3) and were used in the subsequent GWAS and GP analyses.
NW DSI BLUPs exhibited non-normal distribution (Shapiro-Wilk test p < 0.001) skewed to low DSI for all datasets. In contrast, W DSI BLUPs showed normal distribution in all three datasets (Bolinha, p = 0.325; Contender, p = 0.806; Combined, p = 0.776) (Fig. 1). Estimated broad-sense heritability (H2) of the datasets ranged from 0.09 (Contender NW DSI) to 0.47 (Bolinha W DSI) (Supplemental Table S4). Overall, the Contender dataset had the lowest and the Bolinha dataset had the highest estimates of H2 for both NW and W DSI. The Combined dataset had similar but lower estimates of H2 than the Bolinha dataset.
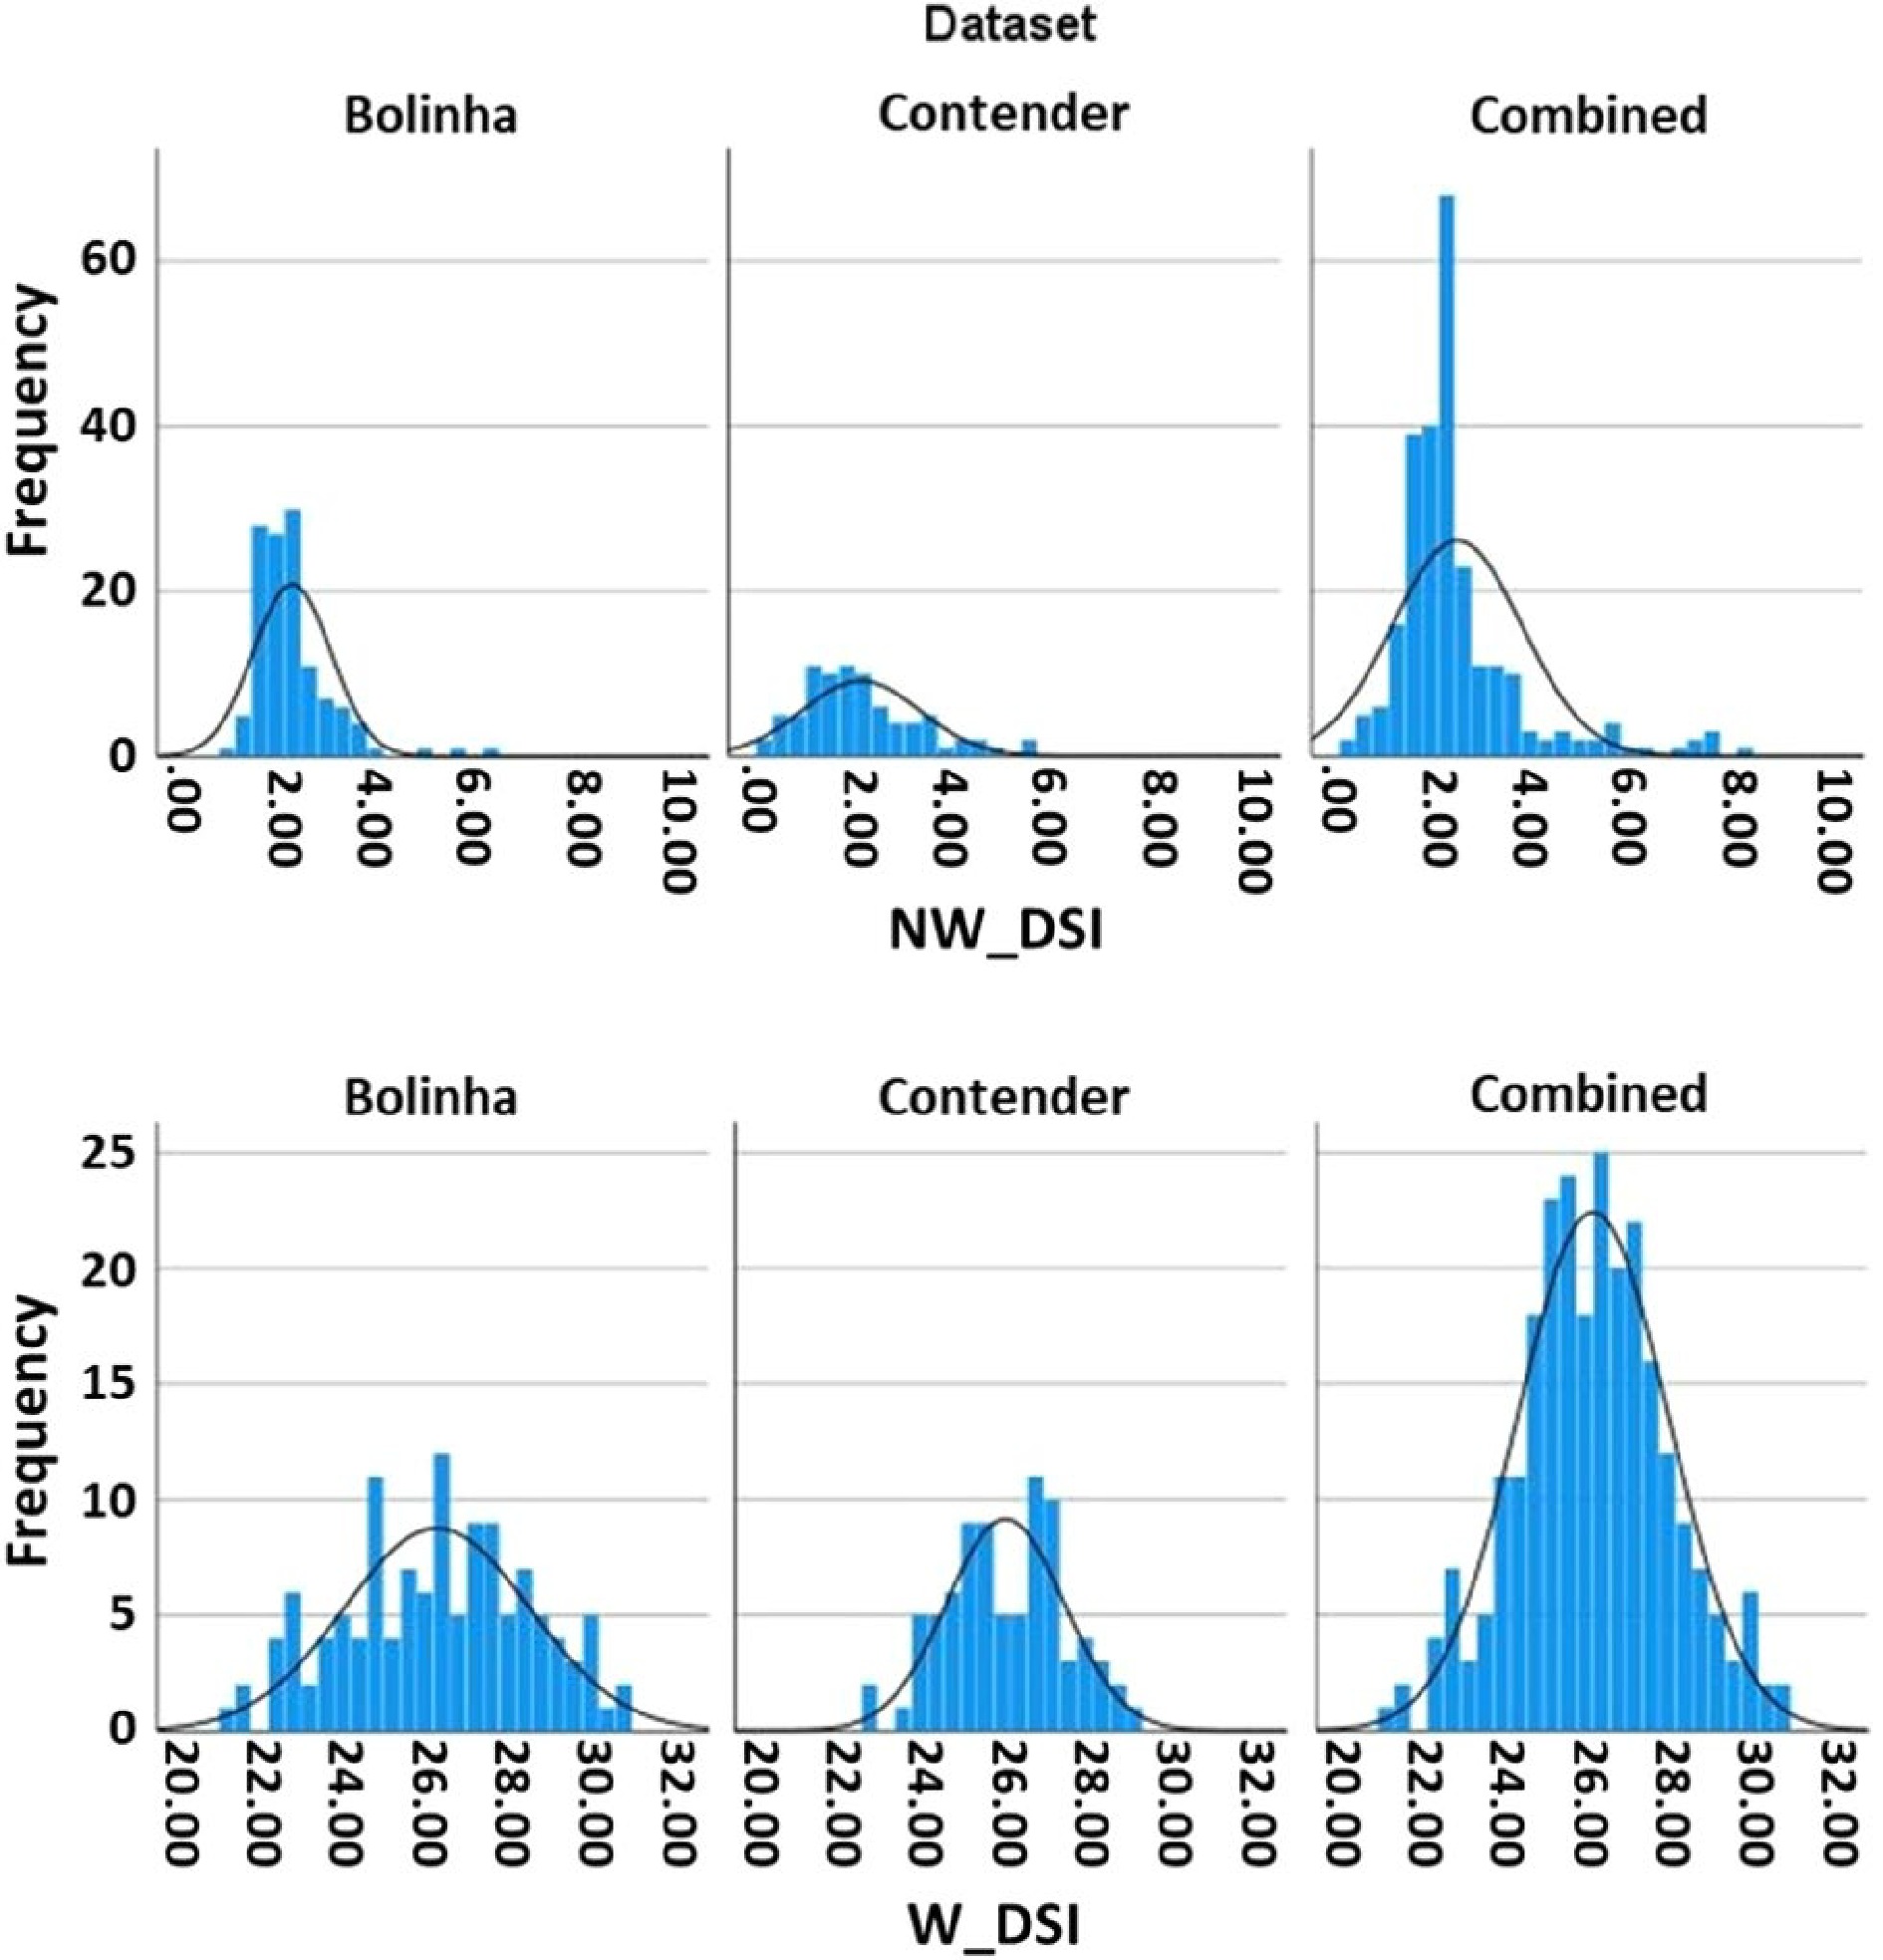
Figure 1. Disease severity index (DSI) distribution in the three datasets (Bolinha, Contender, Combined).
Genetic relationship and population structure in the testing panel
-
A total of 256 accessions, with genotyping rate > 90%, were included in the testing panel and used in GWAS and GP analyses (Supplemental Table S1). Out of 16,038 SNPs, 9,067 were polymorphic in the testing panel. SNP quality control was performed separately for each dataset, and SNPs with > 10% missing genotype and MAF < 0.05 were excluded from the subsequent analyses. The final number of SNPs included in Bolinha, Contender and Combined datasets were 8,014, 8,014 and 8,442, respectively, with 7,314 SNPs shared between all three datasets (Fig. 2).
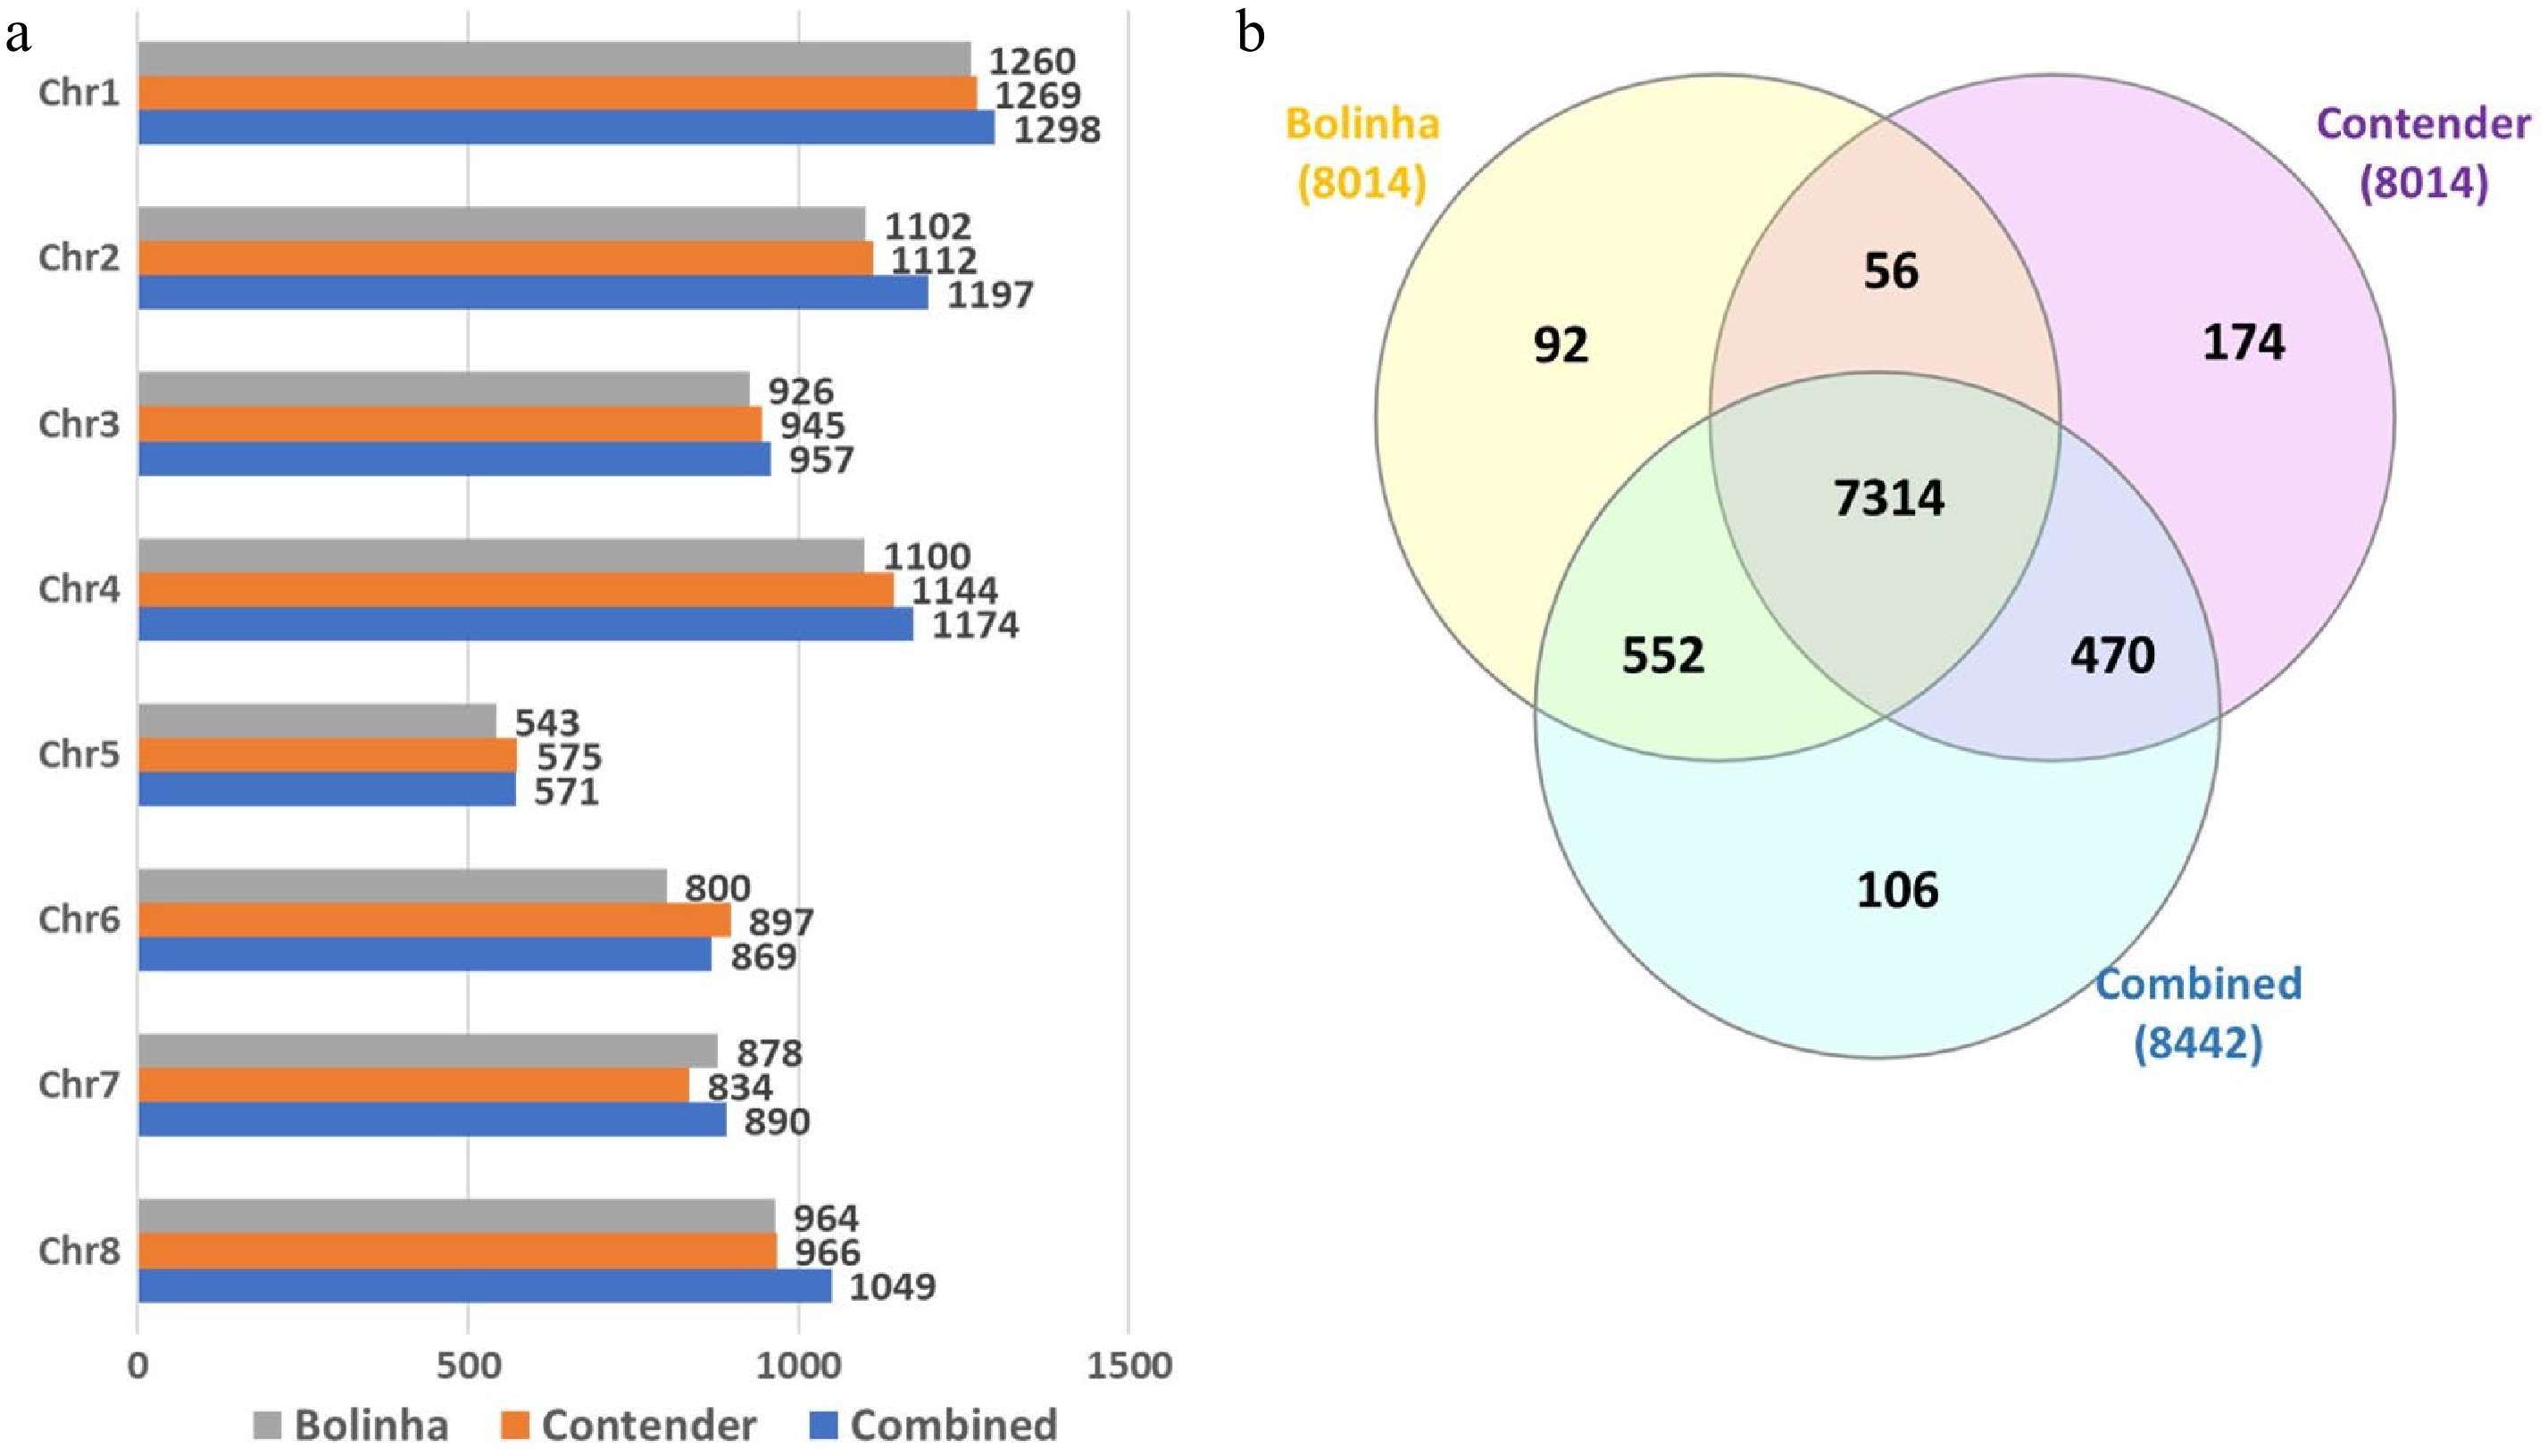
Figure 2. Number of SNPs included in genome wide association study and genomic prediction analysis for the three datasets (Bolinha, Contender and Combined). (a) Number of SNPs per chromosome. (b) Venn diagram for SNPs shared by all three datasets.
Kinship matrix suggested two main clusters in the testing panel, with breeding families derived from only the 'Contender' source of resistance grouping in one and individuals with the 'Bolinha' sources of resistance grouping in another cluster (Fig. 3a). The principal component analysis (PCA) also resulted in two clusters, separating individuals based on their sources of resistance (Supplemental Fig. S2).
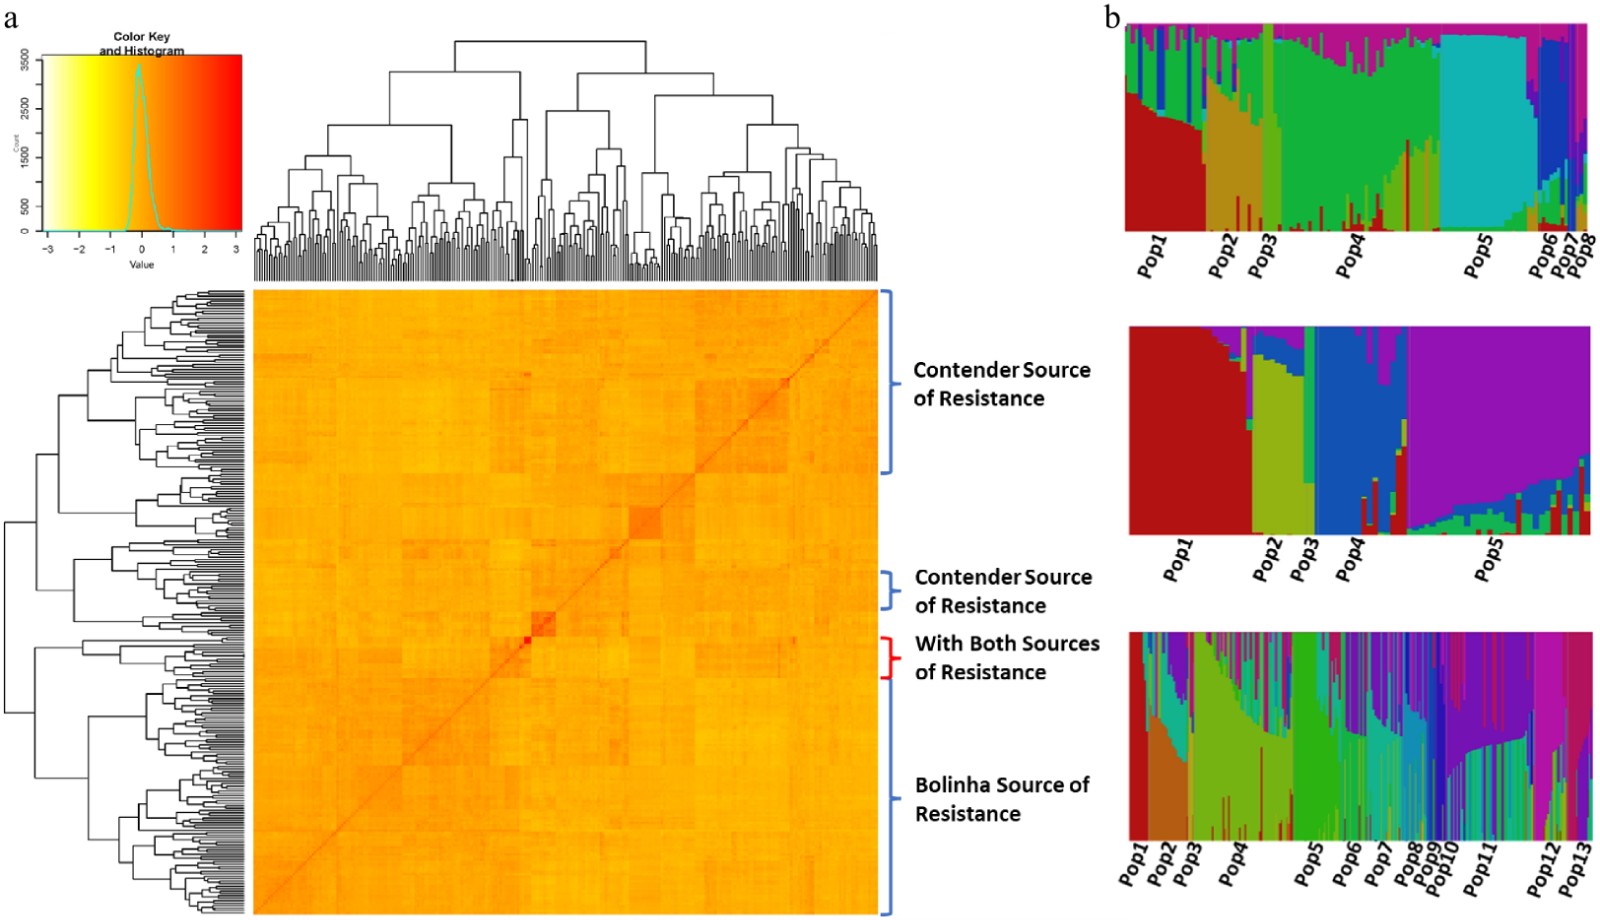
Figure 3. (a) Heat map of kinship matrix of the testing panel and, (b) population structure of the three datasets (Bolinha, Contender and Combined).
Population structure analysis of each dataset, using Bayesian clustering, suggested number of populations (K) of 8 for the Bolinha dataset, 5 for the Contender dataset and 13 for the Combined dataset (Fig. 3b; Supplemental Fig. S3). Q matrices obtained from population structure analysis were used in subsequent GWAS analyses.
Genome wide association study
-
GWAS was carried out separately for M. fructicola infection responses in peach flesh (W) and skin (NW) in the three datasets (Bolinha, Contender and Combined) (Supplemental Table S5). Fixed and random model Circulating Probability Unification (FarmCPU) analysis revealed a total of 11 significant (p < 0.01 with Bonferroni correction) marker-trait associations for skin (6) and flesh (5) resistance to brown rot, spanning all chromosomes (Chr) except Chr 1 (Supplemental Table S5; Supplemental Fig. S4). Phenotypic variance explained (R2) by the detected markers ranged from 0.34% to 15.8%. Due to Bonferroni correction often being too conservative for detecting important loci, we considered also an exploratory less stringent significance threshold of p < 0.0001. An additional list of 24 markers on all chromosomes were identified, with 13 of them associated with NW DSI, while 11 of them were associated with W DSI. For NW DSI, the markers detected with lowest p-value were Peach_AO_0422949 (p = 8.04E-10, R2 = 7.64%), SNP_IGA_261410 (p = 1.57E-06, R2 = 15.80%) and Pp05_12552668 (p = 8.19E-07, R2 = 4.28%), detected in the Bolinha, Contender and Combined datasets, respectively. Markers SNP_IGA_249273 (p = 1.40E-06, R2 = 4.93%), Peach_AO_0771463 (p = 1.31E-09, R2 = 12.7%) and Peach_AO_0692414 (p = 2.97E-07, R2 = 3.27%) were most significantly associated with W DSI, in the Bolinha, Contender and Combined dataset, respectively. One marker on Chr 4 (Peach_AO_0446589) was associated with both W and NW DSI in the Bolinha dataset. No common significant SNPs were detected among the three datasets. However, a region on Chr 4, spanning 10,582,092 to 11,108,143 bp, containing four markers detected in the three datasets was observed; with one marker (Peach_AO_0446589,) associated with both skin (R2 = 6.63%) and flesh (R2 = 4.14%) resistance in the Bolinha dataset, and one (SNP_IGA_409901, R2 = 11.37%) and two markers (Peach_AO_0446892, R2 = 3.82%; SNP_IGA_434655, R2 = 3.54%) associated with skin or flesh resistance in the Contender and the Combined datasets, respectively. All markers detected under the exploratory threshold were included in the further analysis of fitting marker-assisted selection (MAS) model.
Genomic prediction
-
Predictive accuracy (PA) of GP and MAS models, estimated by five-fold cross validation for each dataset, were low to moderate for GP models, and low for MAS model. In most of the cases, PA of GP models had significantly higher PA than MAS model according to ANOVA and Tukey test (p < 0.05) (Fig. 4; Supplemental Table S6). When predicting NW DSI, the highest average performance was achieved in the Bolinha dataset (BayesB, 0.295 ± 0.059), and the lowest was in the Contender dataset (GBLUP, 0.129 ± 0.065). Similarly, the highest PA for W DSI was also observed in the Bolinha dataset (RKHS, 0.457 ± 0.033), and the lowest in the Contender dataset (rrBLUP, –0.089 ± 0.081). The overall mean PA of all GP models among the datasets corresponded to the ranking of H2 estimated in each dataset (Spearman's rank correlation, p < 0.01). For both NW and W DSI, PA exhibited high stability in both the Bolinha and Combined datasets, with Combined dataset having the narrowest range (0.138–0.168 in NW_DSI and 0.122–0.200 in W_DSI). The PA obtained in the Contender dataset was less stable exhibiting wide range (NW_DSI, 0.271–0.450; W_DSI, 0.348–0.550). Comparison of the PA of different GP models for the same treatment and dataset revealed significant differences, except for NW DSI in the Combined dataset. Overall, the Bayesian models showed similar or higher PA than GBLUP and rrBLUP in all datasets. Among the Bayesian models, BL showed lower PA than other models. For both NW and W DSI, BayesB and RKHS models showed superior or same PA to other GP models tested. Moreover, GBLUP and rrBLUP showed similar performance in all datasets, and were among the best performed models for W DSI in the Bolinha dataset and NW DSI in the Combined dataset. However, negative PA was observed for W DSI in the Contender dataset with both GBLUP and rrBLUP models (Fig. 4). The MAS model revealed significantly lower PA compared to all GP models in all datasets (Fig. 4), thus, it was excluded from the following analyses.

Figure 4. Predictive accuracy for five-fold cross validation of several genomic prediction models and marker-assisted selection (MAS) model in three datasets (Bolinha, Contender and Combined) for wounded (W) and non-wounded (NW) disease severity index (DSI).
To further evaluate GP models performance, we applied leave-one-family-out (LOF) cross validation for the Bolinha and Contender datasets. Due the significantly lower PA observed in the MAS model in the five-fold cross validation, the LOF validation strategy was not applied in this model. Low PA obtained from LOF ranged from −0.167 (Contender, GBLUP, W DSI) to 0.344 (Bolinha, RKHS, W DSI) (Fig. 5). The LOF cross validation strategy was not applied in the Combined dataset, because it contains the breeding families from Bolinha and Contender datasets as well as a group of cultivars/advanced selections and breeding families with almond background. Considering the same GP model in different datasets, the GP models were better fitted when applied to the Bolinha dataset for W DSI, however, when predicting NW DSI GP models showed higher PA in the Contender dataset than the Bolinha dataset.
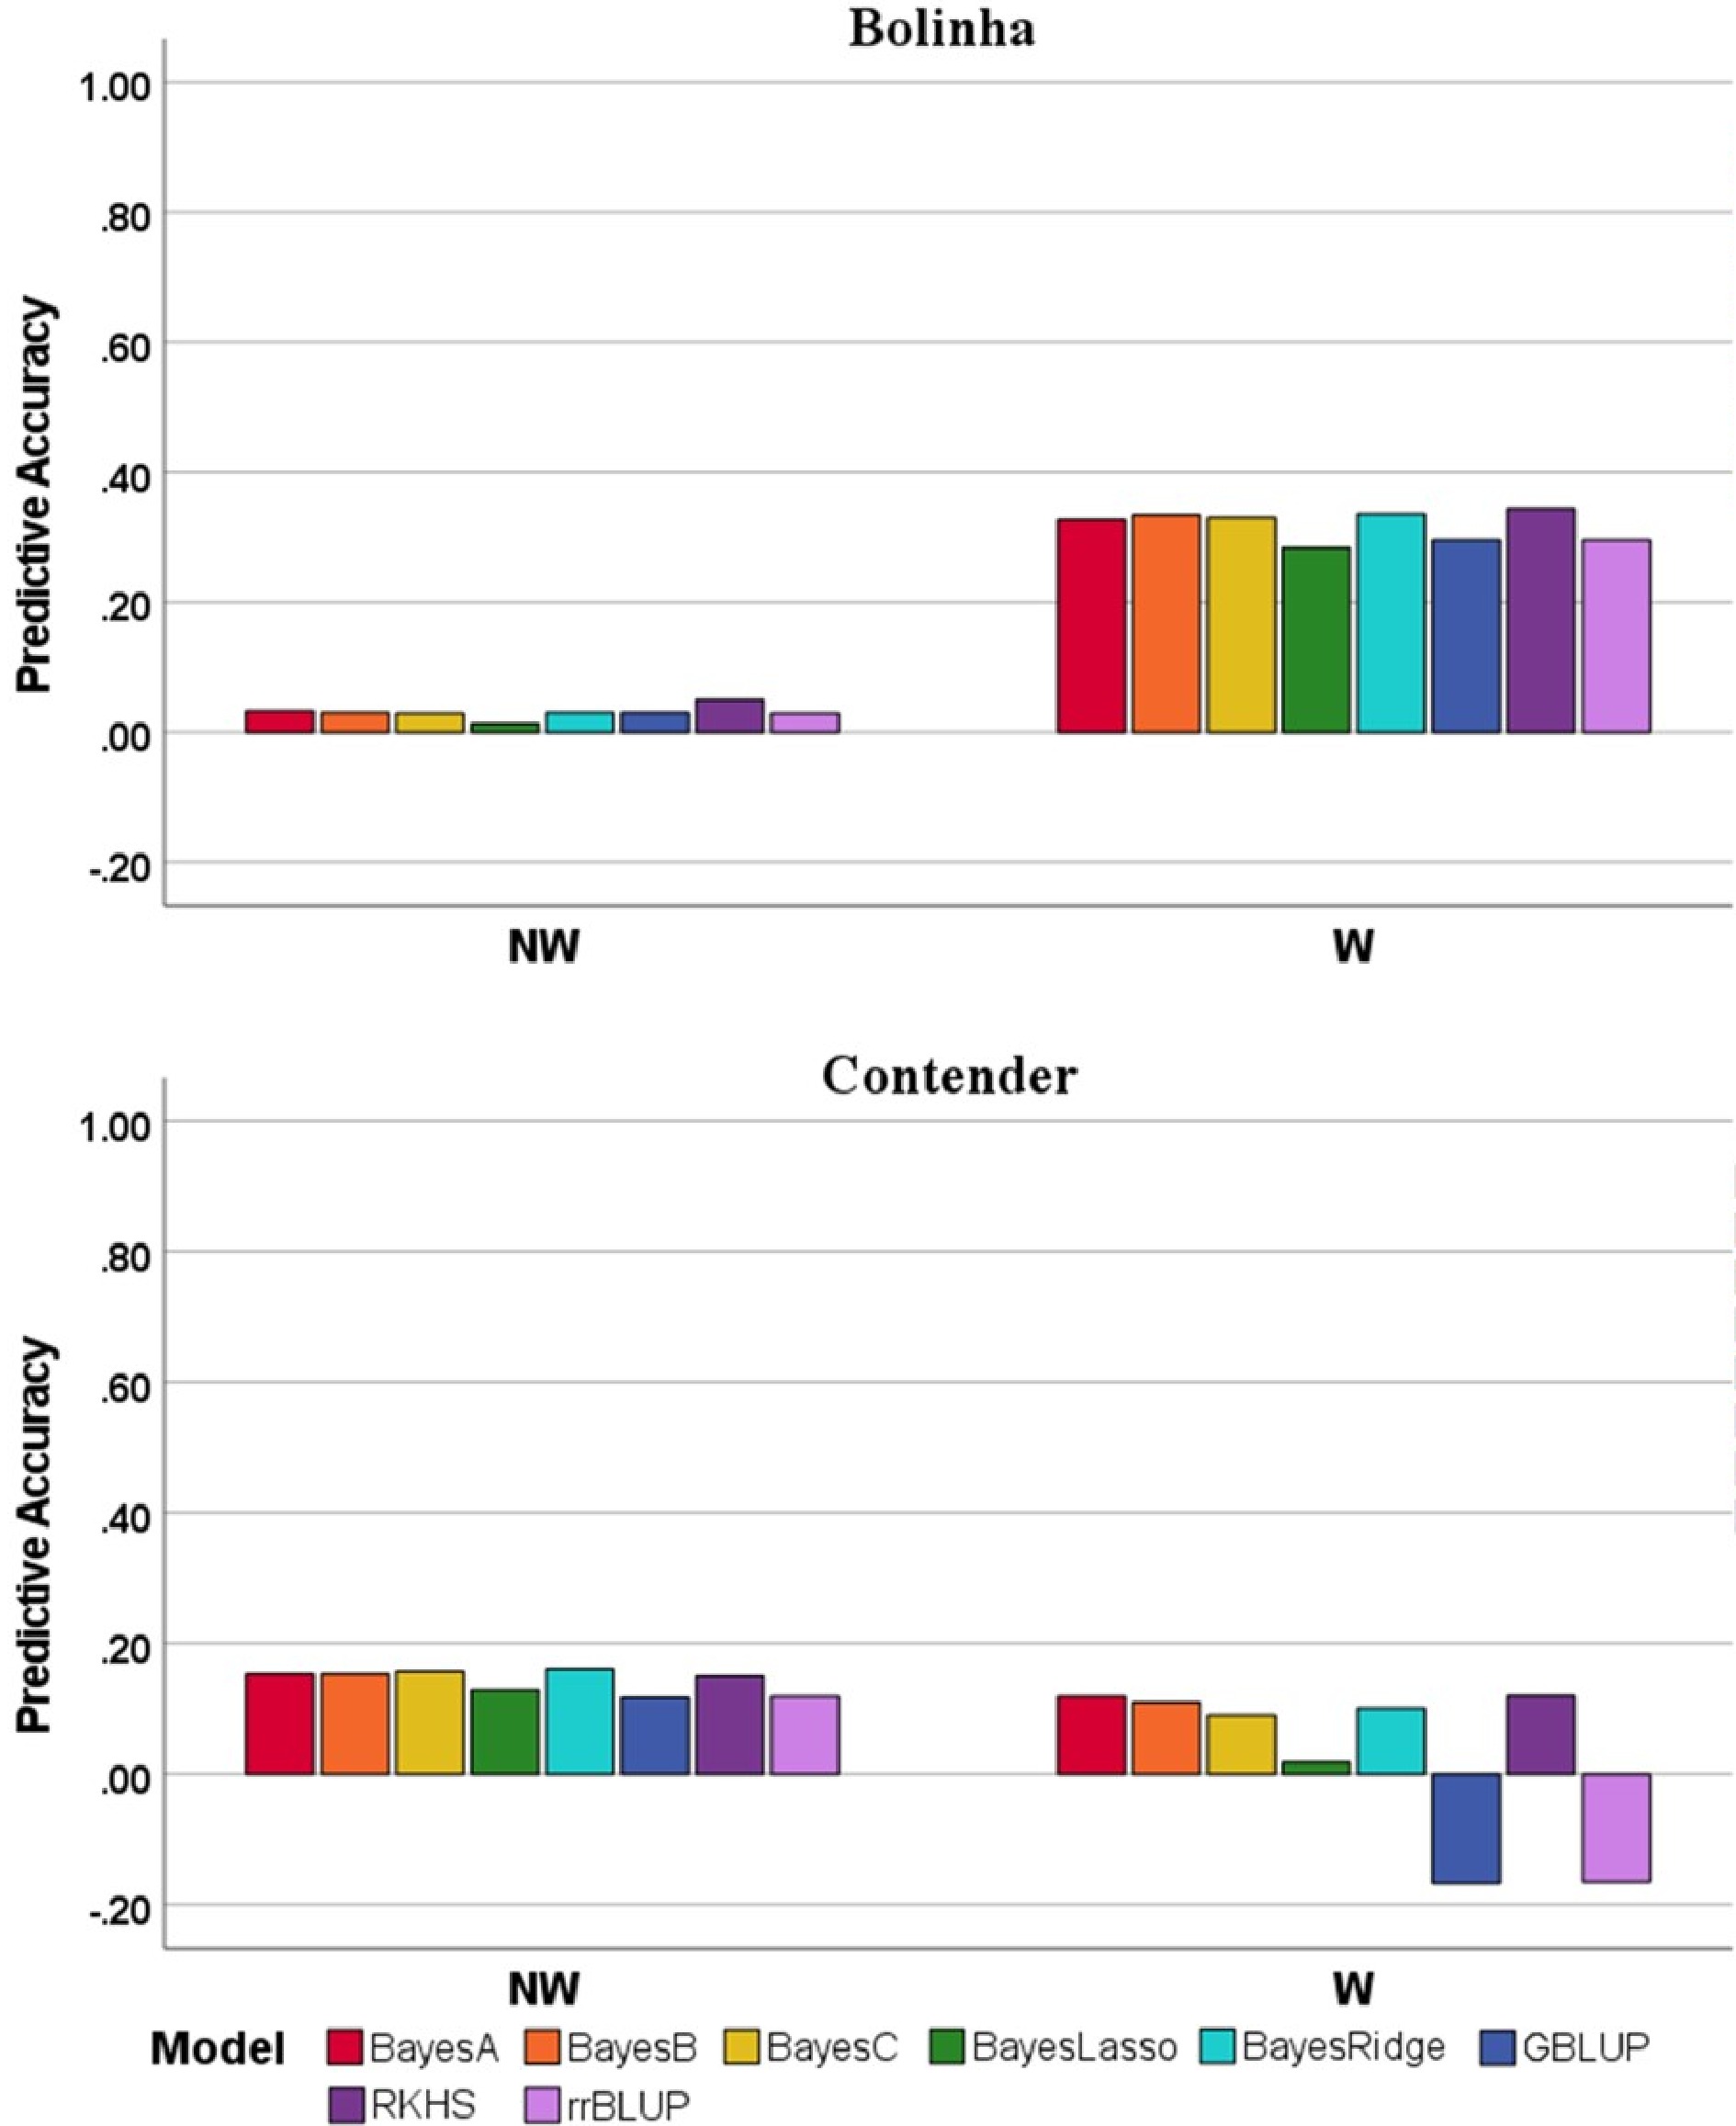
Figure 5. Predictive accuracy for leave-one-family-out cross-validation of several genomic prediction models in the Bolinha and Contender datasets for wounded (W) and non-wounded (NW) disease severity index (DSI).
In addition to LOF cross validation, we tested the performance of GP models using an across-population cross validation strategy, in which individuals with only Bolinha or Contender sources of resistance were used as a training population to predict the rest of the accessions in the testing panel. For NW DSI, when using the 'Bolinha' derived population as the training population, the observed PAs were higher than when using the 'Contender' derived population as the training population. Overall, PAs achieved by predicting W DSI were low in both datasets, and when the 'Contender' derived population was used as the training dataset, negative PAs were observed for all GP models (Table 1).
Table 1. Predictive accuracy of genomic prediction models for wounded (W) and non-wounded (NW) disease severity (DSI) traits when using the Bolinha or Contender datasets as the training population.
Trait Training set Validation set Model Predictive accuracy NW DSI Bolinha Contender Bayes A 0.154 Bayes B 0.166 Bayes C 0.147 Bayesian LASSO 0.156 Bayesian Ridge 0.156 GBLUP 0.158 RKHS 0.128 rrBLUP 0.154 Other Bayes A 0.279 Bayes B 0.292 Bayes C 0.307 Bayesian LASSO 0.279 Bayesian Ridge 0.289 GBLUP 0.293 RKHS 0.301 rrBLUP 0.293 Contender Bolinha Bayes A 0.06 Bayes B 0.057 Bayes C 0.057 Bayesian LASSO 0.079 Bayesian Ridge 0.066 GBLUP 0.063 RKHS 0.052 rrBLUP 0.06 Other Bayes A −0.129 Bayes B −0.139 Bayes C −0.107 Bayesian LASSO 0.012 Bayesian Ridge −0.117 GBLUP −0.095 RKHS −0.132 rrBLUP −0.095 W DSI Bolinha Contender Bayes A 0.157 Bayes B 0.131 Bayes C 0.125 Bayesian LASSO 0.097 Bayesian Ridge 0.121 GBLUP 0.147 RKHS 0.147 rrBLUP 0.13 Other Bayes A 0.121 Bayes B 0.104 Bayes C 0.105 Bayesian LASSO 0.11 Bayesian Ridge 0.097 GBLUP 0.106 RKHS 0.116 rrBLUP 0.106 Contender Bolinha Bayes A −0.133 Bayes B −0.15 Bayes C −0.133 Bayesian LASSO −0.132 Bayesian Ridge −0.147 GBLUP −0.096 RKHS −0.137 rrBLUP −0.103 Other Bayes A −0.169 Bayes B −0.139 Bayes C −0.177 Bayesian LASSO −0.192 Bayesian Ridge −0.139 GBLUP −0.219 RKHS −0.142 rrBLUP −0.218 Lastly, we tested GP models in a practical cross validation, in which individuals in the testing panel were used as the training population to predict brown rot DSI for the validation panel (Supplemental Table S7). Spearman's rank correlation between the GEBV and field disease incidence (FDI) BLUP was estimated. Since BLUPs for NW FDI in 2019 and 2020 showed low variability, we only included W FDI BLUPs in GP analysis. High correlations (p < 0.01) among GEBVs between different GP models was observed, as well as moderate correlations between GEBVs to W FDI BLUPs (Table 2).
Table 2. Spearman's correlation between BLUP of field observed flesh disease incidence (W_FDI) and genomic estimated breeding value obtained from genomic prediction models.
BLUP rrBLUP GBLUP BayesA BayesB BayesC BayesLasso BayesRidge RKHS FDI_BLUP − rrBLUP 0.550** − GBLUP 0.549** 1.000** − BayesA 0.548** 0.995** 0.995** − BayesB 0.549** 0.998** 0.999** 0.991** − BayesC 0.550** 0.998** 0.998** 0.998** 0.995** − BayesLasso 0.537** 0.994** 0.994** 0.984** 0.997** 0.989** − BayesRidge 0.553** 0.995** 0.994** 0.999** 0.990** 0.998** 0.982** − RKHS 0.552** 0.991** 0.991** 0.994** 0.986** 0.994** 0.978** 0.994** − ** − Correlation detected at the significant level of 0.01. To further validate our results, we selected two groups of individuals in the validating panel: low FDI group with FDI lower than 0.1 in both seasons (2019 and 2020) and high FDI group with FDI higher than 0.7 in both seasons (2019 and 2020). Independent Samples t-Test revealed significant differences (p < 0.002) of the mean GEBVs between low and high FDI groups (Fig. 6).
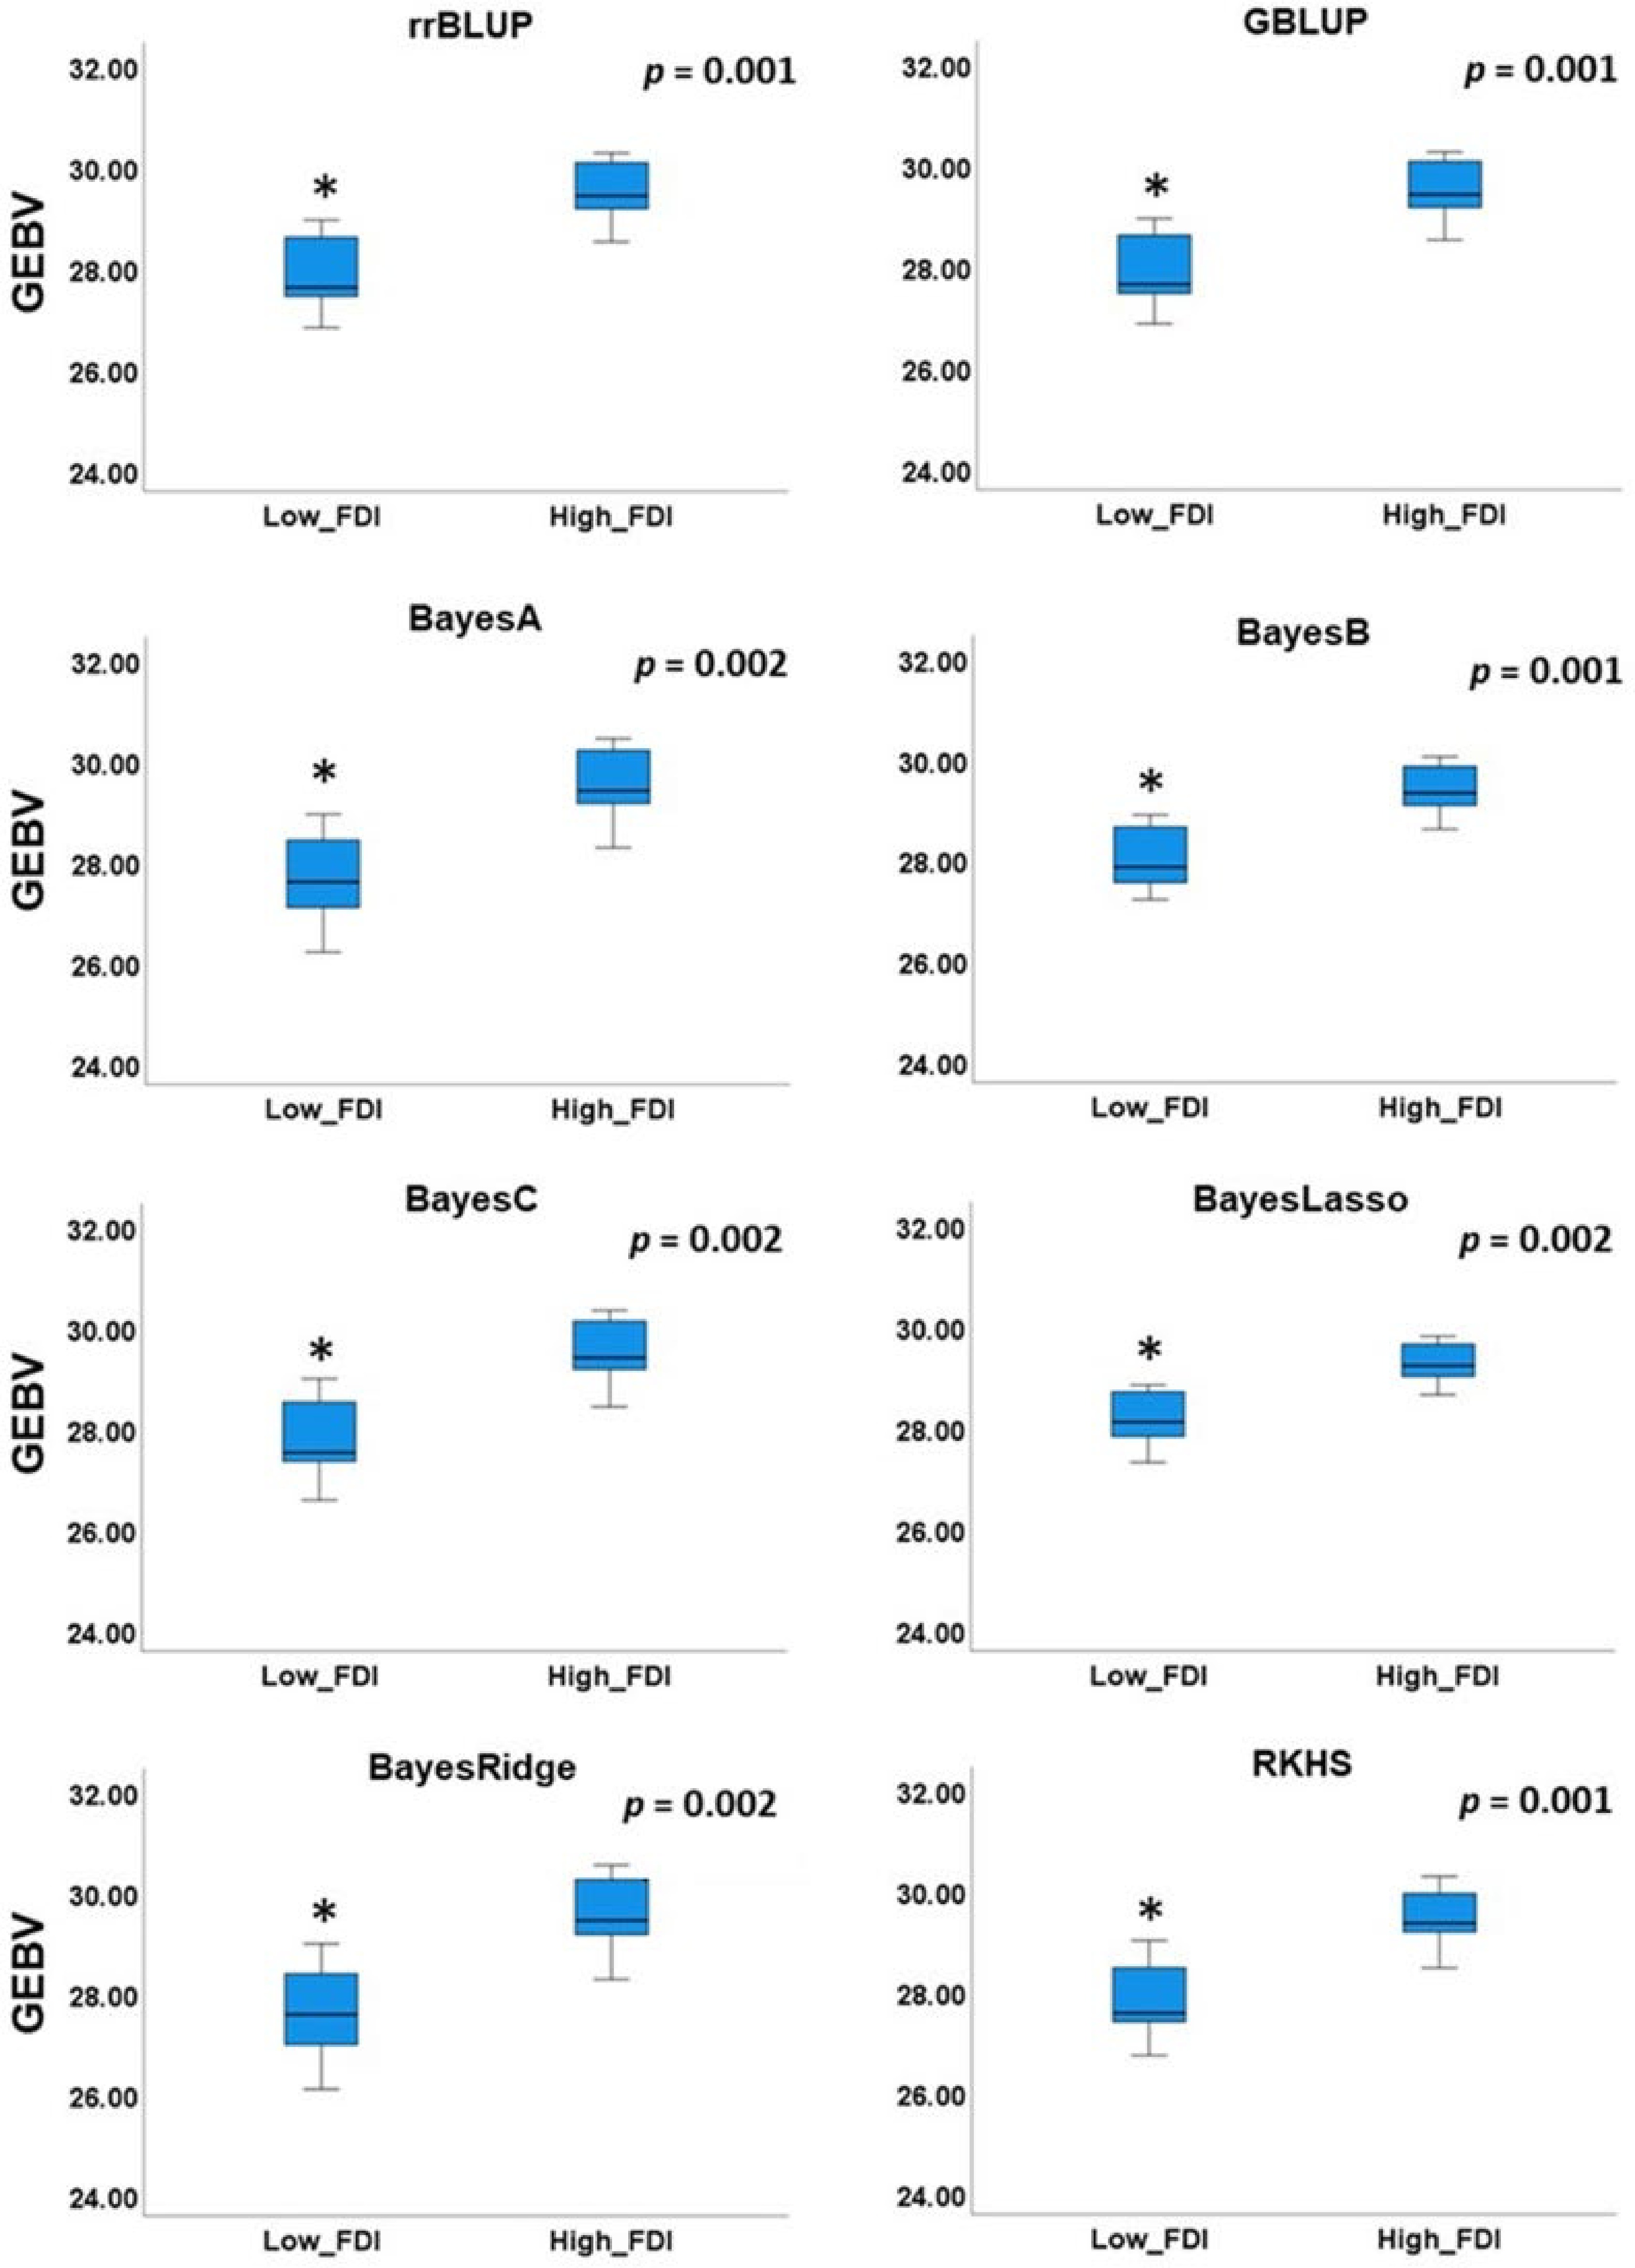
Figure 6. Comparison of mean genomic estimated breeding value (GEBV) between individuals with low and high field observed disease incidence (FDI).
-
Brown rot disease severity exhibited similar seasonal variation. Mean DSI of material with the 'Contender' source of resistance (31.64 for 2017; 30.05 for 2018) was higher than that observed in accessions with the 'Bolinha' source of resistance (19.97 for 2015; 20.37 for 2016; 29.36 for 2019) (Supplemental Table S3), confirming 'Bolinha' as an important brown rot resistance donor[31]. However, NW DSI observed in the 'Bolinha' derived population in 2019 was much less variable, as well as the distribution of W treatment shifted to higher DSI, than those observed in 2015−2016 seasons. Although, significant low to moderate correlations were reported for NW and W DSIs between 2015 and 2016 seasons, no significant correlations were observed between 2019 and the other two datasets (2015 and 2016). A low degree of correlation of brown rot resistance across seasons along with strong seasonal effect on peach skin and flesh responses to brown rot infection were also reported by Baró‐Montel et al.[34] in an interspecific almond × peach population. Given that in our study we applied disease assay in a controlled lab environment with the same fruit ripening stage and inoculum strength, a possible explanation of the observed phenotypic variation might be due to the field environmental influences altering phytochemical compounds and physical structure of peach fruits. Inconsistency of evaluation across years suggested multi-year assays are recommended to gather reliable results[35]. Despite differences in phenotypic response, significant low (0.261, 2018) to moderate (0.648, 2016) correlations were observed between NW and W treatments, except in 2019. Similar correlations between NW and W DSI within the same season were previously reported in peach[6,30], suggesting peach skin and flesh resistance might be under different genetic control.
H2 estimated separately for both treatments and each dataset (Supplemental Table S4), was low for NW DSI in all three datasets. However, H2 observed for W DSI was moderate in the Bolinha and Combined datasets, and low in the Contender dataset. Different levels of H2 between NW and W DSI revealed lower phenotype consistency of NW DSI, suggesting seasonal influence might have a higher effect on skin than flesh resistance. Most of the individuals from the Contender dataset were evaluated only in 2017 and 2018, therefore lack of correlation of the two-year observation affected H2 in this dataset. Moderate H2 observed in Bolinha W DSI (0.57), suggested that the variance of the trait in this dataset was mainly determined by genetic factors. The estimated H2 for W DSI in this study were higher than those reported by Fu et al.[6] but similar to those reported by Pacheco et al.[30] and Dini et al.[36]. The H2 of the trait affects the GS prediction accuracy in simulation studies[37]. Previous studies have also demonstrated that traits with higher heritability have achieved higher PA[38]. However, the selection of the statistical method is an important parameter in the performance of GS for predicting low/moderate/high heritability traits[37,38].
Genome wide association study
-
GWAS revealed significant SNPs (p < 0.01 with Bonferroni correction) associated with skin (NW_DSI; 6) and flesh (W_DSI; 5) resistance to brown rot. Out of the six SNPs associated with skin resistance, only one (Peach_AO_0422949; Chr 4, 4.09 Mbp) detected in the Bolinha dataset was previously reported[6]. Five markers detected under the exploratory threshold (0.0001, with no Bonferroni correction) were located within the same genetic region associated with skin or flesh resistance[6,30]. The SNP on Chr 3 (9.80 Mbp) was identified in the vicinity of brown rot flesh resistance QTL (FL_rd_2020) reported by Pacheco et al.[30]. In addition, four markers detected on Chr 1, 4 and 6 were close to the associated signals detected by Fu et al.[6]. Out of the five significantly associated SNPs (p < 0.01 with Bonferroni correction) with W DSI, one on Chr 6 (30.69 Mbp) was previously reported as reliable QTN in a GWAS panel of 26 cultivars and 138 accessions with 'Bolinha' source of resistance[6]. Furthermore, two SNPs, detected on Chr1 and Chr 6 under the exploratory threshold, were previously associated with flesh resistance to brown rot. The location of the SNP detected on Chr 1 (26.62 Mbp), matched with the position of brown rot resistance QTL (QTL1.2) reported by Martinéz-Garcia et al.[33] using an interspecific F1 progeny derived from a cross between peach cultivar Dr. Davis and an almond × peach F2BC2 introgression line F8,1–42. The SNP detected on Chr 6 (26.62 Mbp), was located within the haploblock (H6_3) associated with peach flesh resistance to brown rot infection reported by Fu et al[6] using material with the 'Bolinha' source of resistance.
Overall, the GWAS results showed low consistency among the datasets. The possible explanation could be different sources of brown rot resistance and different set of markers included in the analysis. Although no common SNPs were detected among the datasets, a group of markers on Chr 4, located in the genomic interval spanned by 10.58–11.11 Mbp, was associated with either NW or W DSI in all datasets suggesting an important role of this genetic region in brown rot resistance.
Genomic prediction
-
The main objective of this study was to test the feasibility of using GP in early selection for brown rot resistance in peach. Performance of MAS model to eight different GP models under five-fold cross validation revealed that the majority of GP models had higher PA than MAS model in all three datasets (Fig. 4). This observation is in agreement with previous studies in crops such as winter rye[39] and citrus[40] in which higher PA was achieved for GP than MAS when predicting traits controlled by genes with small effect. Therefore, the results obtained in this study suggested that GS promises a better outcome in improving brown rot resistance in peach than MAS. Overall, PA of GP models obtained with the Contender dataset were relatively lower than that obtained with the Bolinha and Combined datasets. A possible reason could be the lower H2. In the Contender dataset, estimated H2 of both NW and W DSI was almost half of those observed in the other two datasets. The previous study in maize[38] also suggested increase in PA with an increase in broad-sense heritability. In addition, the relatively small sample size of the Contender dataset could also decrease PA. The influence of sample size within the analyzed dataset has also been observed in GP study of peach fruit quality traits[19], suggesting performance of GP can be improved by increasing sample size. Furthermore, we observed decrease in PA variability with the increased sample size, which agrees with the observation by Biscarini et al.[19] that larger sample size is an important factor in achieving reliable (less variable) estimates of PA. Similar PA for NW DSI was achieved in the Combined and Bolinha datasets. W DSI was best predicted with the Bolinha dataset, indicating that a higher diversity in training population might not be useful for improving predictive accuracy for both W and NW DSI.
Bayes B and RKHS models had constantly superior PA within the same dataset, while BL had lower PA. The same level of PA was observed using either GBLUP and rrBLUP, which agreed with Habier et al.[22] that GBLUP and rrBLUP are fundamentally equivalent. Predictive accuracy of GBLUP and rrBLUP was among the highest when predicting NW and W DSI in both the Bolinha and Combined datasets, however, it was poor in the Contender dataset. PA of both GBLUP and rrBLUP obtained with the Contender dataset was negative and might be explained by the systematic bias[41] when calculating Pearson correlation coefficient. Different performance for GP models can be explained by genetic architecture of the evaluated traits. GBLUP[21] and rrBLUP[23] assume equal variance for the effect of all loci, thus are more suitable for traits influenced by large numbers of genes with minor effects. Both BayesB and BayesC have strong shrinkage towards marker effects and are better suited for traits controlled by a few QTLs with large effect. BayesA has a weaker shrinkage degree than BayesB and BayesC, thus can be widely adaptable[23,24]. RKHS method performs non-linear regression in high-dimensional space and might be able to capture non-additive genetic effects[42] and has shown better results than other GP models[43−45]. Although the performance of GP models using the Bolinha and Contender datasets were statistically different, the observed differences were small. Thus, both GBLUP and rrBLUP would be good choices as they require lower computational time. Overall, five-fold cross validation suggested GP models are feasible for GP for brown rot resistance in peach.
We further evaluated GP models using LOF cross validation and an independent cross validation method using the Bolinha and Contender datasets as a training population separately to predict the rest of accessions in the testing panel. The LOF and independent cross validation are suggested to more realistically resemble how predictions would perform in a breeding program than five-fold cross validation. For LOF cross validation, predictive ability of all GP models decreased compared to five-fold cross validation. Although under this scenario, relatedness between training and testing population was close, we did not observe predictive accuracy improvement as seen in previous studies[15,46]. One possible explanation might be due to less common QTNs shared by the breeding families. The choice of the training populations, with either the 'Bolinha' or 'Contender' resistance, was influenced by the pedigree connections among the germplasm used in the study, and our desire to evaluate feasibility of using material with one source of resistance to predict brown rot DSI in the rest of the germplasm. The source of resistance in our study is either 'Bolihna' or 2nd generation descendant of 'Bolinha', with the cultivar O'Henry in the pedigree, versus 'Contender' and almond source of resistance from UC Davis' breeding program. Individuals from different breeding families were not always half-sibs, for example, in the Bolinha dataset some of the breeding families were direct descendants of 'Bolinha', while others had 'Bolinha' descendant ('BY00P6346U'), two generations removed from 'Bolinha' as a parent. Therefore, although the relatedness within the population is high, there is a chance that unique alleles of effective QTLs are present in each breeding family for which we do not have evidence of the brown rot resistance. Also, the size of our dataset was small, as numbers of individuals from each breeding family varied from 1−29 (Supplemental Table S1), which might have caused bias when predicting the models, and suggests the need to increase the size of the dataset included in this analysis. Independent cross validation using the Bolinha and Contender datasets revealed low predictive accuracy in all tested models. Such decreases in predictive accuracy of GP models has also been observed in wheat[47], and might be explained by the relatively lower genetic relationship between training and testing populations, small training set and/ or G × E interaction. Even though we applied disease assay in lab to minimize the environmental effect, and BLUPs were estimated and used as NW and W DSI in GP, disease incidence data from accessions included in the Bolinha and Contender datasets were collected in different seasons thus environmental effects might be confounded in the BLUP adjusted means.
Lastly, a practical cross validation was applied to all GP models. In this cross validation strategy, all individuals from the testing panel were used as a training population to predict unphenotyped validation panel. High correlation of GEBVs across different GP models was observed, as was previously suggested[48]. Although different phenotyping protocols were used in training and validation panels, we found GEBVs predicted by DSI obtained from lab disease assays to be moderately correlated (p < 0.01) with disease incidences observed in field, indicating ability of lab assays to predict field performance (Table 2). Comparison of GEBV means between low (FDI < 0.1) and high FDI groups (FDI > 0.7), revealed significantly lower GEBVs for accessions in low FDI group (Fig. 6), indicating ability of GP models applied in our study to distinguish between brown rot tolerant and susceptible genotypes.
-
Brown rot resistance in peach is a complex trait controlled by multiple genes with minor effects which complicates breeding. This is the first report supporting GP as a tool in breeding for disease resistance in peach, as GP models outperformed the MAS model. Moderate correlations between GEBVs and observed field disease incidence, reported in this study, are establishing trust in using data obtained in lab assays for predicting field performance. In addition, significant differences among GEBVs between accessions exhibiting low and high brown rot field resistance further support using GP in early selection for brown rot resistance. With the three known sources of resistance included in this study, we have a comprehensive germplasm that can be used as a reference for any peach breeding program in North America and Europe. This research establishes a foundation for using genomic prediction of breeding values to further increase genetic gain in breeding for complex traits such as brown rot resistance in peach.
-
A testing panel comprised of 38 cultivars/advanced selections and 288 F1 individuals from 27 pedigree-related breeding families was included in the study (Supplemental Table S1; Supplemental Fig. S1). Among the 27 F1 breeding families, eight were derived from the 'Bolinha' source of resistance, 13 from the 'Contender' source of resistance, three had both the 'Bolinha' and 'Contender' sources of resistance, and three families had almond background. In addition, an F2 population of 114 individuals from selfing of an advanced selection 'BY00P6346u' ('Bolinha' descendant) was used as a validation panel (Supplemental Table S7). All plant material was maintained at Clemson University Musser Fruit Research Center under standard commercial management practices[6], except the material used in the validating panel was grown with the absence of fungicides.
Phenotypic data collection
-
Fruit responses to M. fructicola infection in the testing panel were evaluated over six years (2015 to 2020). Accessions with the 'Bolinha' source of resistance were mainly evaluated in 2015, 2016 and 2019, accessions with the 'Contender' source of resistance were mainly evaluated in 2017 and 2018. Breeding families with both 'Bolinha' and 'Contender' sources of resistance were evaluated annually from 2015 to 2019. In 2020, accessions with almond source of resistance and 32 accessions with 'Bolinha' and/or 'Contender' source of resistance were evaluated (Supplemental Table S1). Brown rot disease severity index (DSI) for wounded (W) and non-wounded (NW) peach fruit was recorded using the phenotyping strategy described in Fu et al.[6,49]. Descriptive analysis of the phenotypic data was performed with SPSS Statistics v. 27 (IBM®). To eliminate the year effect, mean W and NW DSI were estimated by a mixing linear model (MLM) using R package 'lme4'[50] with year selected as a random effect:
$ {Y}_{ij}=\mu +{g}_{i}+{y}_{j}+{gy}_{ij}+\varepsilon $ in which, Yij is the trait of interest, µ is the overall mean, gi is the genetic effect of ith genotype, yj is the effect of the jth year, and gyij as the interaction effect of ith genotype with jth year, ɛ is the residual of the model. Best linear unbiased predictions (BLUP) obtained from the MLM were used for subsequent analysis in GWAS and genomic prediction analyses. As some accessions were phenotyped in different seasons, we used an ad hoc method proposed by Holland et al.[51] to calculate H2 using the following equation.
$ {H}^{2}=\frac{{\sigma }_{g}^{2}}{{\sigma }_{g}^{2}+\dfrac{{\sigma }_{gy}^{2}}{n}+\dfrac{{\sigma }_{\varepsilon }^{2}}{nr}} $ where
$ {\sigma }_{g}^{2} $ is the genotype variance,$ {\sigma }_{gy}^{2} $ is the measure of variability attribute to accession × year interaction, n is the harmonic mean of years in the experiment and r as the replicates within each year (in our case r = 1).Fruit responses to M. fructicola natural infection in the validating panel were evaluated in 2019 and 2020. For each available accession from the validating panel, at least 20 unblemished fruits were harvested at the commercial ripening stage and incubated in the dark under humid conditions at room temperature (22 ± 1 °C). Brown rot disease incidence (proportion of fruit with symptoms) was recorded after seven days of incubation.
Genotyping
-
All accessions were genotyped with newly developed 9+9K peach SNP array[52], and SNP genotypes quality control was applied following the method described in Fu et al.[6]. For further analysis, SNP genotypes was converted to 1 (AA homozygotes), 0 (AB heterozygotes) and −1 (BB homozygotes).
Population structure and kinship analysis
-
To estimate the genetic structure of the testing panel, a Bayesian clustering method was applied in fastSTRUCTURE[53]. Clusters ranging from 2 to 20 were tested by the default prior, each K was repeated 20 times and the most probable number of K was estimated considering the chooseK.py script and plotting out the average marginal likelihood using StructureSelector[54]. Results of all replicates of each K cluster were aligned and summarized using CLUMPP[55], and the estimated admixture proportions of each genotype were visualized using DISTRUCT plots[56]. Kinship matrix of the testing panel was estimated using the VanRaden method[21] and visualized through a heat map in GAPIT version 3[57]. PCA analysis was performed using Tassel[58], the first three principal components were plotted in R using Scatterplot3D R package[59].
Genome wide association study
-
Genome wide association study (GWAS) was conducted using FarmCPU[58] in R package FarmCPU. Q matrices obtained from fastSTRUCTURE were incorporated as covariates in the association test model. Since the default p-value (0.01) with Bonferroni correction of FarmCPU to select the pseudo-QTNs into the first iteration of the model can be overly restrictive, we set this threshold to 0.05. Marker-trait associations were defined as significant when the p-value was lower than 0.01 with Bonferroni correction. R2 for each significant marker was estimated using a mixed linear model as described in Zhao et al.[60].
Genomic prediction and marker-assisted selection model
-
Eight contrasting methods were assessed to evaluate the performance of GP: GBLUP[21,22], rrBLUP[23], BayesA, BayesB, BayesC[23,24], BRR, BL[25] and RKHS[42].
Both GBLUP and rrBLUP are mixed linear model-based methods. GBLUP uses an estimated additive genomic relationship matrix to estimate the breeding value of the individuals. We used the 'A.mat' function in R package rrBLUP[61] to calculate the additive relationship matrix, inverse of the matrix was generated using 'mat2sparse' function in R package Matrix[62], the later was used for fitting GBLUP model using ASReml-R package[63]. The GBLUP model can be represented as:
$ y=Xb+Za+e $ in which y is the vector of phenotypes; b is the vector of fixed effect to the overall mean; a is the vector of random additive genetic effects following normal distribution
$ N(0,A{\sigma }_{a}^{2}) $ , where A is the estimated additive genomic relationship matrix and$ {\boldsymbol{\sigma }}_{\boldsymbol{a}}^{{\bf{2}}} $ is the variance of a; e is the vector of random residuals with a normal distribution$ N\left(0,I{\sigma }_{e}^{2}\right) $ , where I is the identity matrix and$ {\boldsymbol{\sigma }}_{\boldsymbol{e}}^{{\bf{2}}} $ is the variance of residue; X and Z were incidence matrices linking b and a to y, respectively.For rrBLUP, the model was implemented using the 'mixed.solve' function in R package rrBLUP[61]. Since no missing genotypic data is allowed in rrBLUP, we input the missing genotype with the mean for each marker. The rrBLUP model is fitted using a standard linear regression formula:
$ y= {\rm{\mu}} +Zg+e $ where µ represents the overall mean of phenotype vector y; g is the vector of marker effect with a normal distribution
$ N(0,I{\sigma }_{g}^{2}) $ with variance of$ I{\sigma }_{g}^{2} $ ; e is the vector of random residualsAll Bayesian models were conducted by BGLR package[26] in R with the default parameters. A minimum of 15,000 iterations of sampling followed by a burn-in period of 5,000 iterations was applied for each run. Missing genotypic data are not allowed in the BGLR, thus the same input dataset for rrBLUP were used. The Bayesian models can be represented by the equation:
$ y= {\rm{\mu}} +X\beta +e $ where µ is the overall mean; β is the vector of marker effects corresponding to the columns of marker incidence matrix X; e is the vector of residuals. These methods use different prior densities which induce different conditional distribution of marker effects[24]. BayesA uses scaled-t prior density[26]. BayesB and BayesC implement two finite mixture priors: a point of mass at zero and a scaled-t slab for BayesB and a mixture of a point of mass at zero and a Gaussian slab for BayesC[26]. For BRR, the Gaussian prior shrinks all marker effects to a similar extent, and for BL a double-exponential prior density is used to induce the type of shrinkage based on size-of-effect[64].
A single-kernel RKHS regression model was also implemented by BGLR, using the kinship matrix estimated from GAPIT[57]. In the RKHS method, Reproducing Kernel (RK) provides a linear combination of the basis function. RK maps from pairs of vectors of genotypes,
$ \{{x}_{i},{x}_{{i}^{'}}\} $ , from input set into the real line which must satisfy$ {\sum }_{i}{\sum }_{{i}^{'}}{\alpha }_{i}{\alpha }_{{i}^{'}}K\left({x}_{i}{x}_{{i}^{'}}\right)\ge 0 $ , for any non-null sequence of coefficient$ {\alpha }_{i} $ [26]. RKHS uses a Gaussian prior evaluated by the square Euclidean distance between markers to substitute the observed genetic relationship matrix by the kernel matrix[26,42]. Similar to the implementation of the Bayesian models, RHKS was conducted using 15,000 burns, 5000 burn-in iterations and the smoothing parameter h was set to the default value of 0.5.We also fitted a marker-assisted selection (MAS) model by multilinear regression (MLR). Markers included in the MAS model were selected by the markers detected in GWAS. Considering the Bonferroni correction in GWAS is typically stringent, and important loci associated with small effect can be excluded, we included all markers with an exploratory significant threshold of p < 0.0001 (without Bonferroni correction)[39] in the MAS model. MAS model was fitted in R using the function 'lm( )':
$ y={b}_{0}+\sum \limits_{i=1}^{N}{b}_{i}{x}_{i}+e $ where b0 is the intercept of the regression line; bi is the coefficient of ith marker included in the model; and xi is the genotype of ith marker.
Model evaluation
-
To evaluate the model performance for both MAS and GP models, a five-fold cross-validation scheme was used to estimate the predictive accuracy (PA) for all three datasets (Bolinha, Contender and Combined). All accessions within the dataset were randomly divided into five groups, each group was predicted using four other groups as the training population. PA was calculated as Pearson's correlation between the genomic estimated breeding values (GEBVs) and observed BLUP values for normal distributed datasets and Spearman's rank correlation for skewed datasets (NW DSI). For each model described in the previous section, the five-fold cross-validation was repeated 100 times with different random resampling. PA was calculated after each run. Mean PA of the eight GP models and MAS model were calculated and compared in SPSS Statistics v. 27 (IBM®).
In addition to the five-fold cross-validation, we applied two other cross validation strategies: (1) To study the GP performance of close genetic relationships between training and testing populations, leave-one-family-out (LOF) cross validation was conducted separately to the Bolinha and Contender datasets, in which the phenotypes of one breeding family are masked and predicted by all other breeding families; (2) To study the GP performance when the genetic relationship between training and testing populations is relatively distant, we used the Bolinha and Contender datasets separately as the training population to predict the rest of the individuals in the testing panel.
Lastly, all individuals in the testing panel were used as the training population and fitted to the GP models to predict the DSI in the validating panel. Since the phenotypic data in the testing and validating panel were obtained using different methods (disease assay for testing panel; field evaluation for validating panel) in different seasons (2015−2020 for testing panel; 2019−2020 for validating panel), to account for season effect, GP models were fitted to BLUPs of 2019 and 2020 DSIs. Correlation analysis between GEBVs and brown rot disease incidence of the field collected data was performed using Spearman's rank correlation.
- The authors thank Prof. Guido Schnabel for providing M. fructicola isolate and inoculation protocol, Mr. Ralph Burrell for assisting in data collection, Musser Fruit Research Farm staff for their technical assistance and the Clemson University's Palmetto Cluster for providing an effective platform for computation analysis. This work was supported by USDA's National Institute of Food and Agriculture for the Specialty Crop Research Initiative through the competitive project 'RosBREED: Combining disease resistance with horticultural quality in new rosaceous cultivars' (2014-51181-22378) and by NIFA/USDA, under project number SC-1700530. Technical Contribution No. 6982 of the Clemson University Experiment Station. Any opinions, findings, conclusions or recommendations expressed in this publication are those of the author(s) and do not necessarily reflect the view of the USDA. Funders had no role in the experimental design, data collection and analysis or writing of the manuscript.
- The authors declare that they have no conflict of interest.
- Supplemental Fig. S1 Pedigree of evaluated accessions showing BLUP adjusted mean of wounded disease severity index (DSI) from 2015-2020.
- Supplemental Fig. S2 . Scatter plot of principle component analysis of 256 accessions. Individuals were colored coded based on source of resistance.
- Supplemental Fig. S3 Plot of mean marginal likelihood of each K in different datasets (Bolinha, Contender, Combined).
- Supplemental Fig. S4 GWAS results obtained from FarmCPU in different datasets (Bolinha, Contender, Combined) of wounded (W) and non-wounded (NW) disease severity index (DSI). The solid green line represents the threshold for genome-wide significance (p < 0.01 with Bonferroni correction).
- Supplemental Table S1 List of accessions and phenotypic data in testing panel.
- Supplemental Table S2 Summary statistics (number of individuals (N); mean; minimum (Min); maximum (Max); standard error (SE); standard deviation (SD)) and adjusted mean (BLUP) of wounded (W) and non-wounded (NW) disease severity index (DSI) observed in testing panel over six seasons (2015-2020).
- Supplemental Table S3 Spearman's rank correlation of observed wounded (W) and non-wounded (NW) disease severity index (DSI) across seasons in testing panel. * - Correlation is significant at the 0.05 level. ** - Correlation is significant at the level of 0.01 level.
- Supplemental Table S4 Summary statictics and estimated broad sense heritability (H2) for non-wounded (NW) and wounded (W) disease severity index (DSI) in different datasets (Bolinha, Contender and Combined).
- Supplemental Table S5 List of SNPs significantly associated with skin (NW) and flesh (W) responses to brown rot infection. R2 - phenotypic variance explained by single SNP. Blue- marker-trait associations are significant with Bonferroni correction of p < 0.01. Bolded - markers detected / within same haploblock as previously reported QTL/QTNs. Black - marker-trait associations are significant under the exploratory threshold of 0.0001.
- Supplemental Table S6 Descriptive statistics of predictive ability of genomic prediction and marker-assisted selection (MAS) models in three different datasets (Bolinha, Contender and Combined) for wounded (W) and non-wounded (NW) disease severity index.
- Supplemental Table S7 List of accessions and phenotypic data in validating panel.
- Copyright: © 2022 by the author(s). Exclusive Licensee Maximum Academic Press, Fayetteville, GA. This article is an open access article distributed under Creative Commons Attribution License (CC BY 4.0), visit https://creativecommons.org/licenses/by/4.0/.
-
About this article
Cite this article
Fu W, da Silva Linge C, Lawton JM, Gasic K. 2022. Feasibility of genomic prediction for brown rot (Monilinia spp.) resistance in peach. Fruit Research 2: 2 doi: 10.48130/FruRes-2022-0002

Feasibility of genomic prediction for brown rot (Monilinia spp.) resistance in peach
- Received: 22 May 2021
- Accepted: 16 December 2021
- Published online: 24 January 2022
Abstract: Brown rot, caused by Monilinia spp., is one of the most important postharvest diseases of stone fruits worldwide. Brown rot resistance in peach is a polygenic trait controlled by multiple genes with a small effect. In this study, we assessed the feasibility of genomic prediction (GP) for brown rot resistance in peach using eight contrasting methods (GBLUP, rrBLUP, BayesA, BayesB, BayesC, Bayesian Ridge Regression, Bayesian Lasso and RKHS). A testing panel of 38 cultivars/advanced selections and 288 F1 individuals from 27 pedigree-related breeding families with 'Bolinha' and/or 'Contender' or almond source of resistance was phenotyped over six seasons (2015 to 2020). GP models outperformed MAS models under five-fold cross validation, and low to moderate predictive accuracy (PA) was achieved by fitting GP model for wounded (W) (0.092−0.449) and low PA for non-wounded (NW) disease severity index (0.129−0.295). An alternative cross validation approach using disease severity index recorded in lab to predict field disease incidence (FDI) in unphenotyped accessions revealed moderate correlation (0.548−0.553). Genomic predicted breeding value distinguished accessions with low FDI from those with high FDI. The results presented here demonstrated feasibility of incorporating GP in peach breeding.
-
Key words:
- Genomic selection /
- Disease resistance /
- Breeding /
- Fruit tree