


-
Vaccinium bracteatum Thunb. (known as 'sea bilberry', 'oriental blueberry', or 'Nan zhu' in China) is a wild blueberry, widely distributed in East Asia, especially in China, Japan, and Korea[1]. V. bracteatum is a traditional medicinal plant, recorded in the Compendium of Materia Medica. Many studies have reported the health benefits of extracts from V. bracteatum leaves or fruit[2−4]. In eastern coastal regions of China, the pigment from V. bracteatum leaves is used to dye rice to produce 'Wu Mi Fan', a well-known local traditional food, dating back 1,000 years[4]. Studies have shown that V. bracteatum leaves contain a number of phytochemical compounds, such as flavonoids[4,5], polysaccharides[2], iridoid glycosides[6], vaccinoside[7], free amino acids, and organic acids[1,6,8].
Chromosome-level genome assembly of some vacciniums have been reported such as cranberry[9,10] and bilberry[11]. V. bracteatum can also be used as a rootstock to enhance the adaptation of cultivated blueberry. However, little research has been reported on V. bracteatum due to the lack of genomic information. Here, we report on the sequences of the whole-genome assembly and of the transcriptome of V. bracteatum. Our results provide key insights into the transcriptional regulation of flavonoid biosynthesis genes in V. bracteatum.
-
For V. bracteatum genome sequencing, a total of 26.51 Gb of filtered, high-quality reads was obtained to construct a library with average insert length not exceeding 350 bp, followed by sequencing on the Illumina HiSeq sequencing platform. The total sequencing coverage depth was about 45×. The Q20 and Q30 read outputs of sequenced data were at least 97.64% and 93.49%, respectively (Supplementary Table S1).
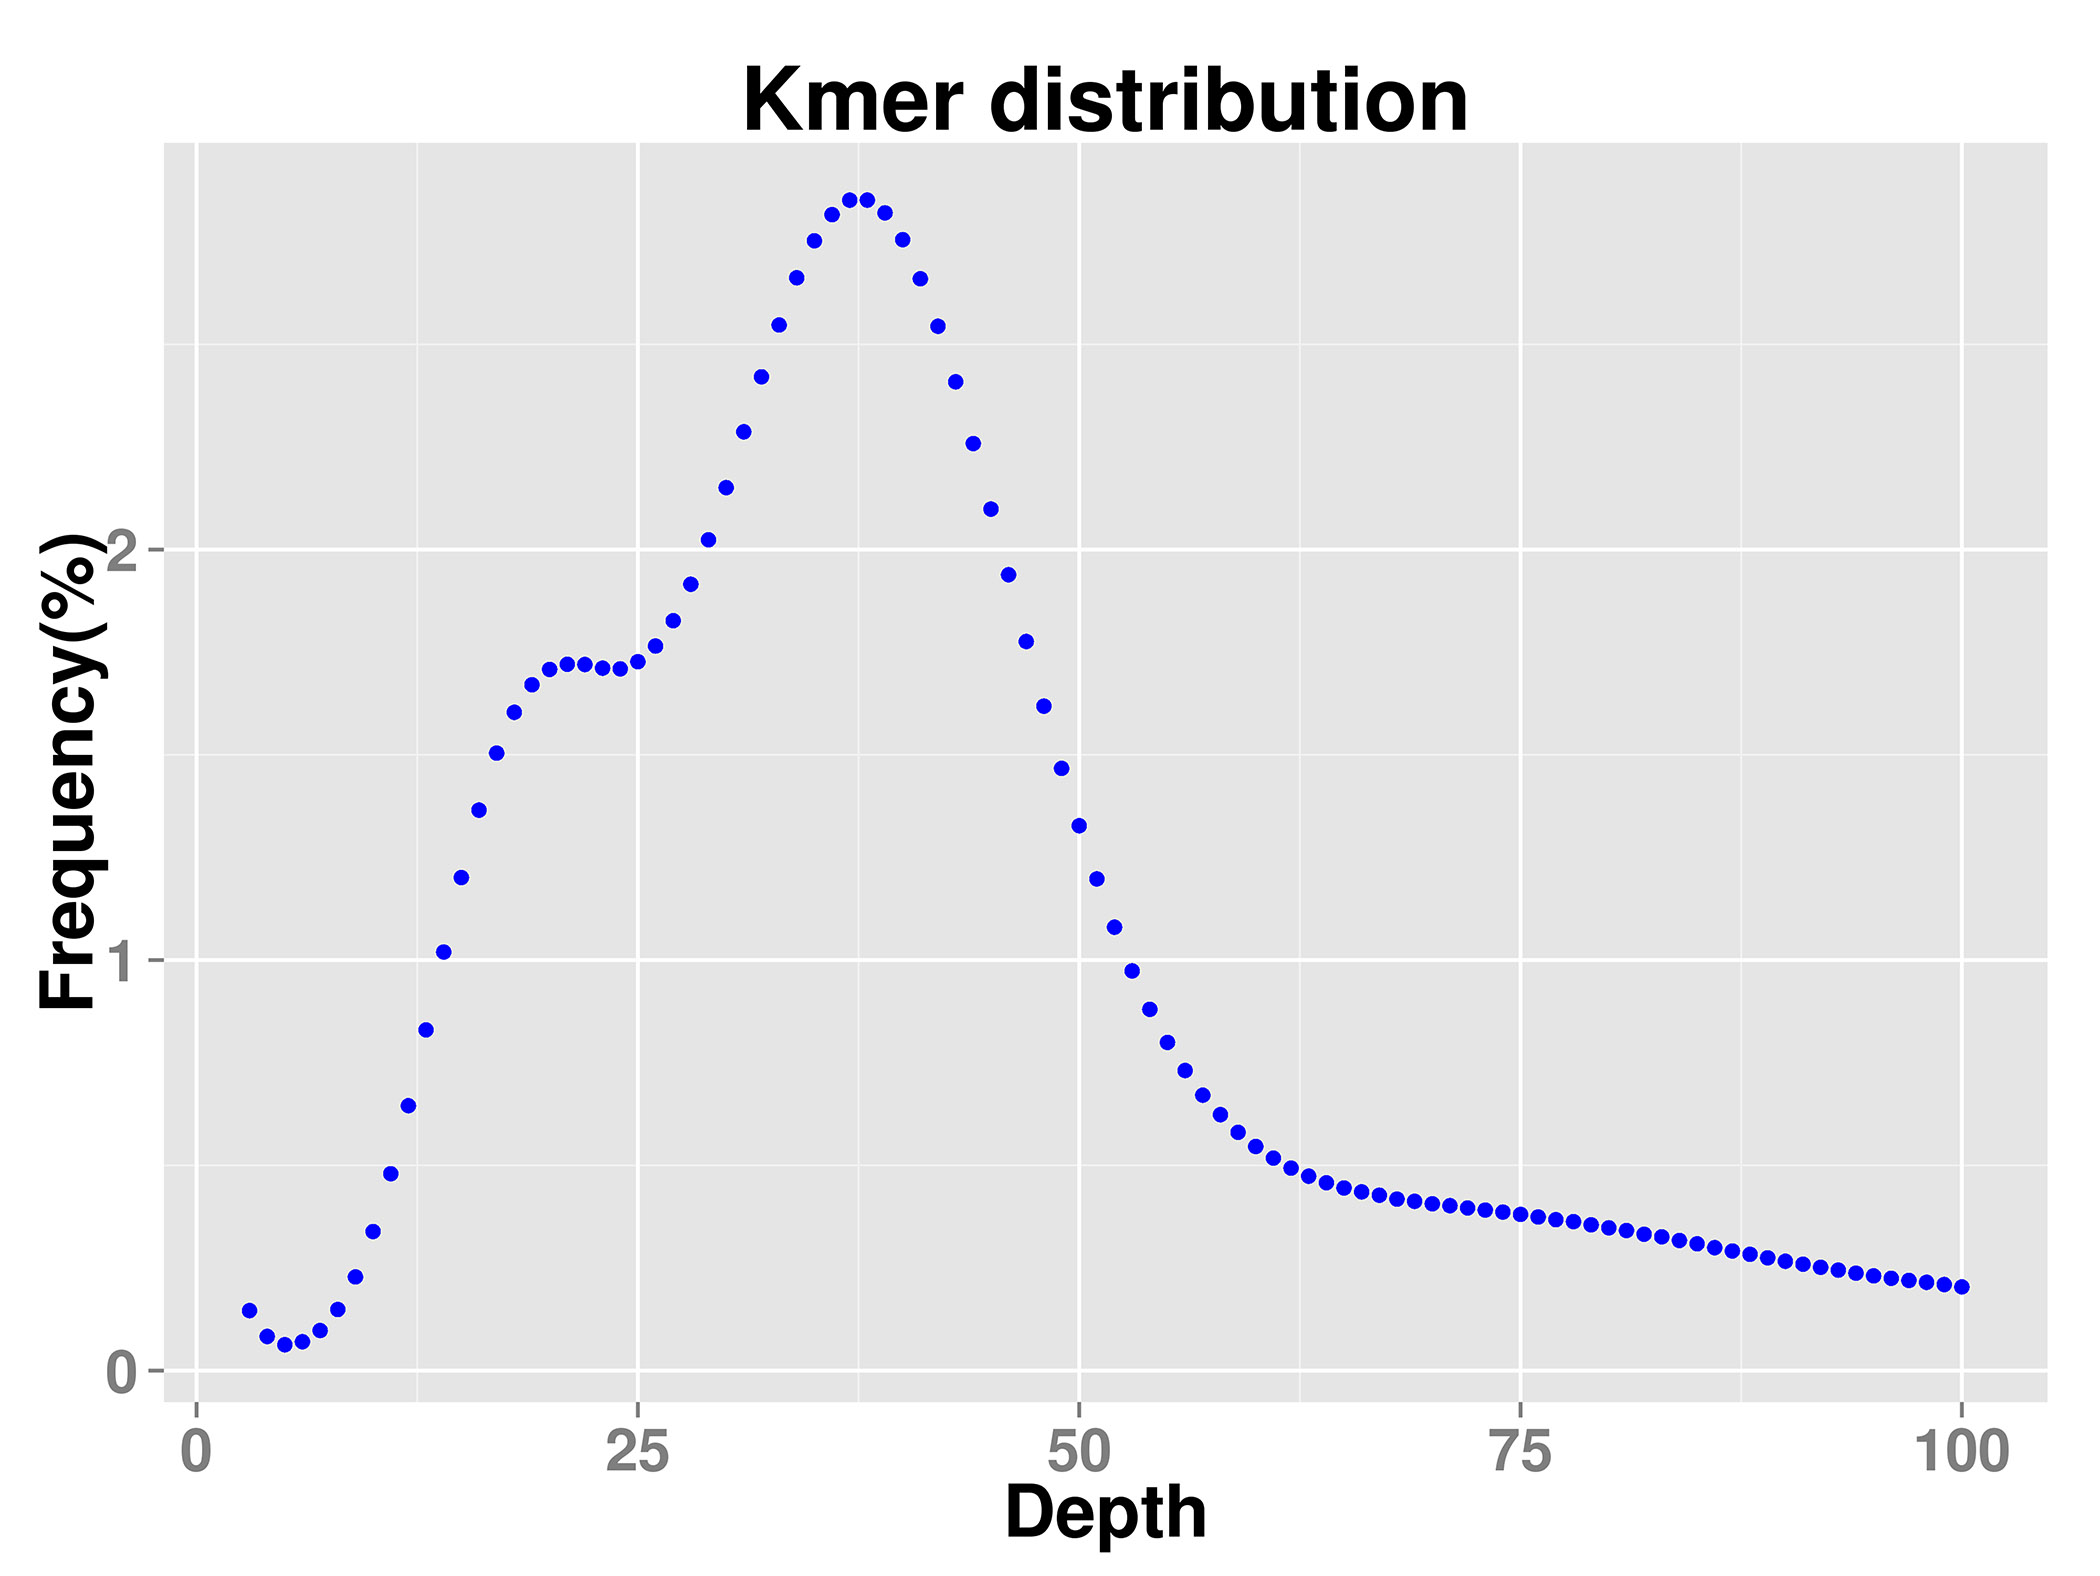
Karyotype analysis confirmed that V. bracteatum had a diploid genome (2n = 2x = 24). After contaminants and extranuclear DNA content were taken into account, the genome size of V. bracteatum, estimated by K-mer analysis, was 579.42 Mb. The repetitive sequence content was ~42.72%, and the estimated heterozygosity was about 1.10%. In addition, the GC content of the genome of this species was 38.63%. Therefore, the genome of V. bracteatum is a heterozygous complex genome (Table 1 & Supplementary Fig. S1).
Table 1. Major indicators of V. bracteatum genome of contig-level and chromosome-scale assembly.
Assembly feature Statistic Contig-level assembly Chromosome-
scale assemblyEstimated genome size (by k-mer analysis) (Mb) 579.42 Repetitive sequence content 42.72% 57.78% GC content (estimation) 38.63% Estimated heterozygosity 1.10% Assembled genome size (Mb) 569.81 Contig number 1,384 1,430 Contig N50 (Mb) 1.98 1.87 Contig N90 (Mb) 0.30 0.26 Contig max (Mb) 9.42 9.42 GC content (Nanopore) 38.32% 38.32% Assembly % of genome 98.33% Scaffold number 973 Scaffold length (Mb) 569.86 Contig length (Mb) 569.81 Scaffold N50 (Mb) 43.77 Scaffold N90 (Mb) 39.17 Scaffold max (Mb) 50.70 Gap total length (Mb) 0.05 Genome sequencing and assembly based on Nanopore and Hi-C data
-
Using a third generation Nanopore platform sequencer with a sequencing depth of 114.60×, a total of 76.41 Gb of raw data was measured, with 65.3 Gb of clean data being obtained after filtering out adapter sequences, short fragments (length < 2,000 bp) and low-quality sequences. The clean data contained a total of 3,651,468 reads, the average read length was 17,882 bp, the N50 read length was 18,829 bp, and the longest read length was 304,639 bp (Supplementary Table S1 & S2). After further trimming, the genome sequence was 569.81 Mb, and the longest contig was 9.42 Mb, with the contig N50 and N90 being 1.98 Mb and 0.30 Mb, respectively. The GC content of the genome was 38.32% (Table 1). In the evaluation of assembly results, the proportions of properly mapped reads, conserved essential genes (CEGs), and complete Benchmarking Universal Single-Copy Orthologs (BUSCOs) were 90.51%, 94.10%, and 90.95%, respectively (Supplementary Table S3). These results indicated that the genome assembly was of high quality and adequate coverage.
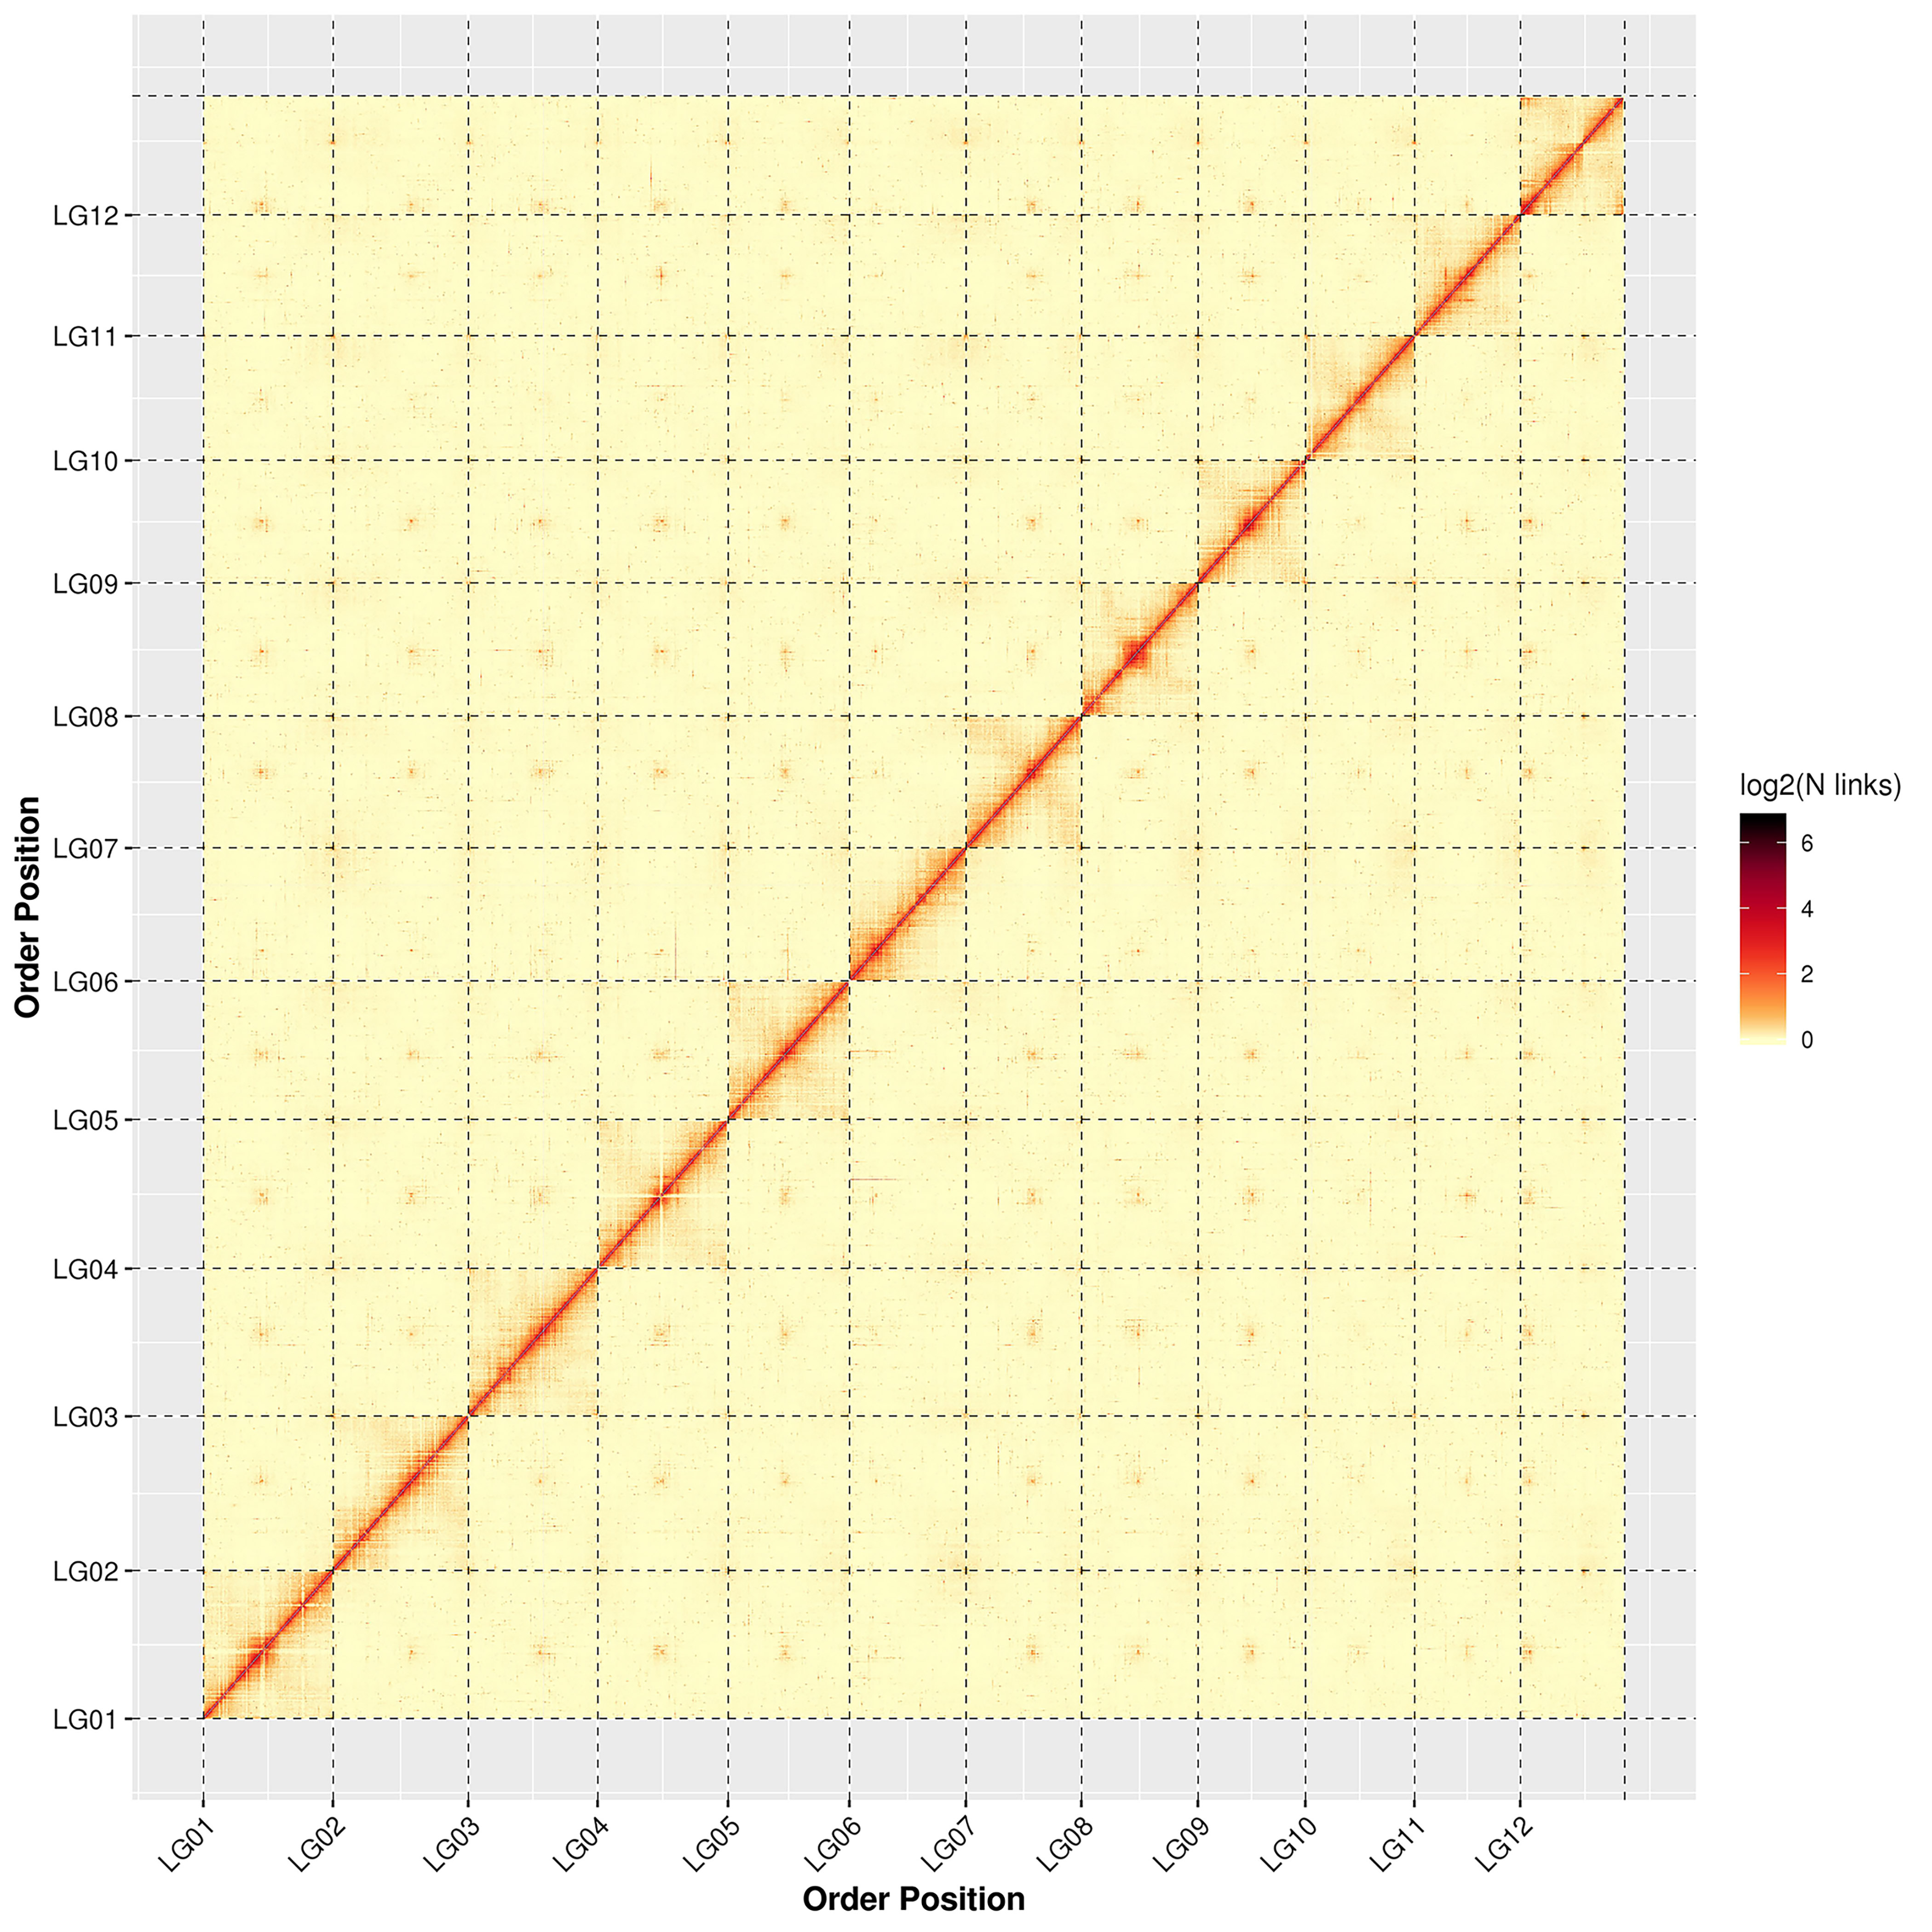
The genome assembly results from the high-throughput chromosome conformation capture technique (Hi-C) showing that a total of 560.32 Mb sequences were associated with 12 chromosomes, accounting for 98.33% of the genome; of the sequences located on the chromosomes, the total length of the sequences determined was 532.95 Mb, accounting for 95.12% of the total length of the chromosomal sequences located (Table 1). The detailed distribution of each chromosome sequence is exhibited in Supplementary Table S4. Based on the statistics of the genome sequences assembled by Hi-C, the contig N50 and scaffold N50 of the final genome were 1.87 Mb and 43.77 Mb, respectively. All of the genome statistics following Hi-C assembly are shown in Table 1.
The results of the chromosome heat map of the Hi-C genome assembly revealed 12 distinct chromosomal groups. Within each group, the interaction intensity at the diagonal position (between adjacent sequences) was higher than that at the non-diagonal position. The results showed that the effect of genome assembly was fine, which is consistent with the principle of Hi-C assisted genome assembly (Supplementary Fig. S2). Summaries of the de novo assembly and sequencing analysis of the V. bracteatum genome can be found in Fig. 1, with the distribution of the GC content, gene density, and number of repeat sequences per Mb being shown in Fig. 1b, c and d, respectively.

Figure 1.
Summary of the de novo genome assembly and sequencing analysis of V. bracteatum. (a) Morphological features of the fruit of V. bracteatum. (b) Circos plot showing GC content, gene density, repeat coverage, collinearity between chromosomes of V. bracteatum. I, chromosome number; II, GC content; III, gene density; IV, numbers of repeat sequences per megabase pair; V, paralogous relationships between chromosomes.
Genome annotation
-
For repeat sequence annotation, a total of 329.23 Mb of sequences were identified, accounting for 57.78% of the genome size (Supplementary Table S5). Of these repeat sequences, 48.28% (275.11 Mb) and 5.26% (29.95 Mb) were predicted as Class I transposons and Class II retrotransposons, respectively. Of the Class I transposons, Sukkula (LARD) and unknown-type transposons were the most and least frequent, accounting for 22.09% (125.89 Mb) and 0.05% (260.81 Kb), respectively. Of the Class II transposons, terminal inverted repeat (TIR) mobile elements were the most abundant, accounting for 4.41% (25.13 Mb). In addition, potential host genes and Simple Sequence Repeats (SSRs) accounted for 1.56% (8.89 Mb) and 0.04% (232.80 Kb), respectively (Supplementary Table S5).
To predict the number of coding genes, three different strategies were adopted, namely ab initio, homology-based, and RNA-Seq prediction (Supplementary Table S6). The statistical results of gene information combined the three prediction methods after EVM integration showed that the number of coding genes was 36,756, of which 19,247 coding genes were shared by the three prediction methods (Supplementary Fig. S3). Among the 36,756 genes, the total gene length and average gene length were 194,291,038 bp and 5,285.97 bp, respectively. The total exon length and the average exon length per gene were 51,917,599 bp and 1,412.49 bp, respectively. The total number of exons and the average number of exons per gene were 187,829 and 5.11, respectively (Supplementary Table S7).
By prediction of non-coding RNAs (ncRNAs), a total of 96 miRNAs, 218 rRNAs, and 376 tRNAs were identified, belonging to 18, 4, and 23 families, respectively. Pseudogenes have sequences similar to functional genes, while losing their original functions due to mutations such as insertion and deletion. Here, pseudogene was obtained using the predicted protein sequence and BlAST alignment to search homologous gene sequence in the genome, and then GeneWise software was employed to find the immature termination codon and frameshift mutation in the gene sequence. Pseudogene prediction results showed that the total number of pseudogenes predicted was 4,218. Total pseudogene length in the genome was 9,251,782 bp, whereas the average pseudogene length was 2,193.40 bp (Supplementary Table S8).
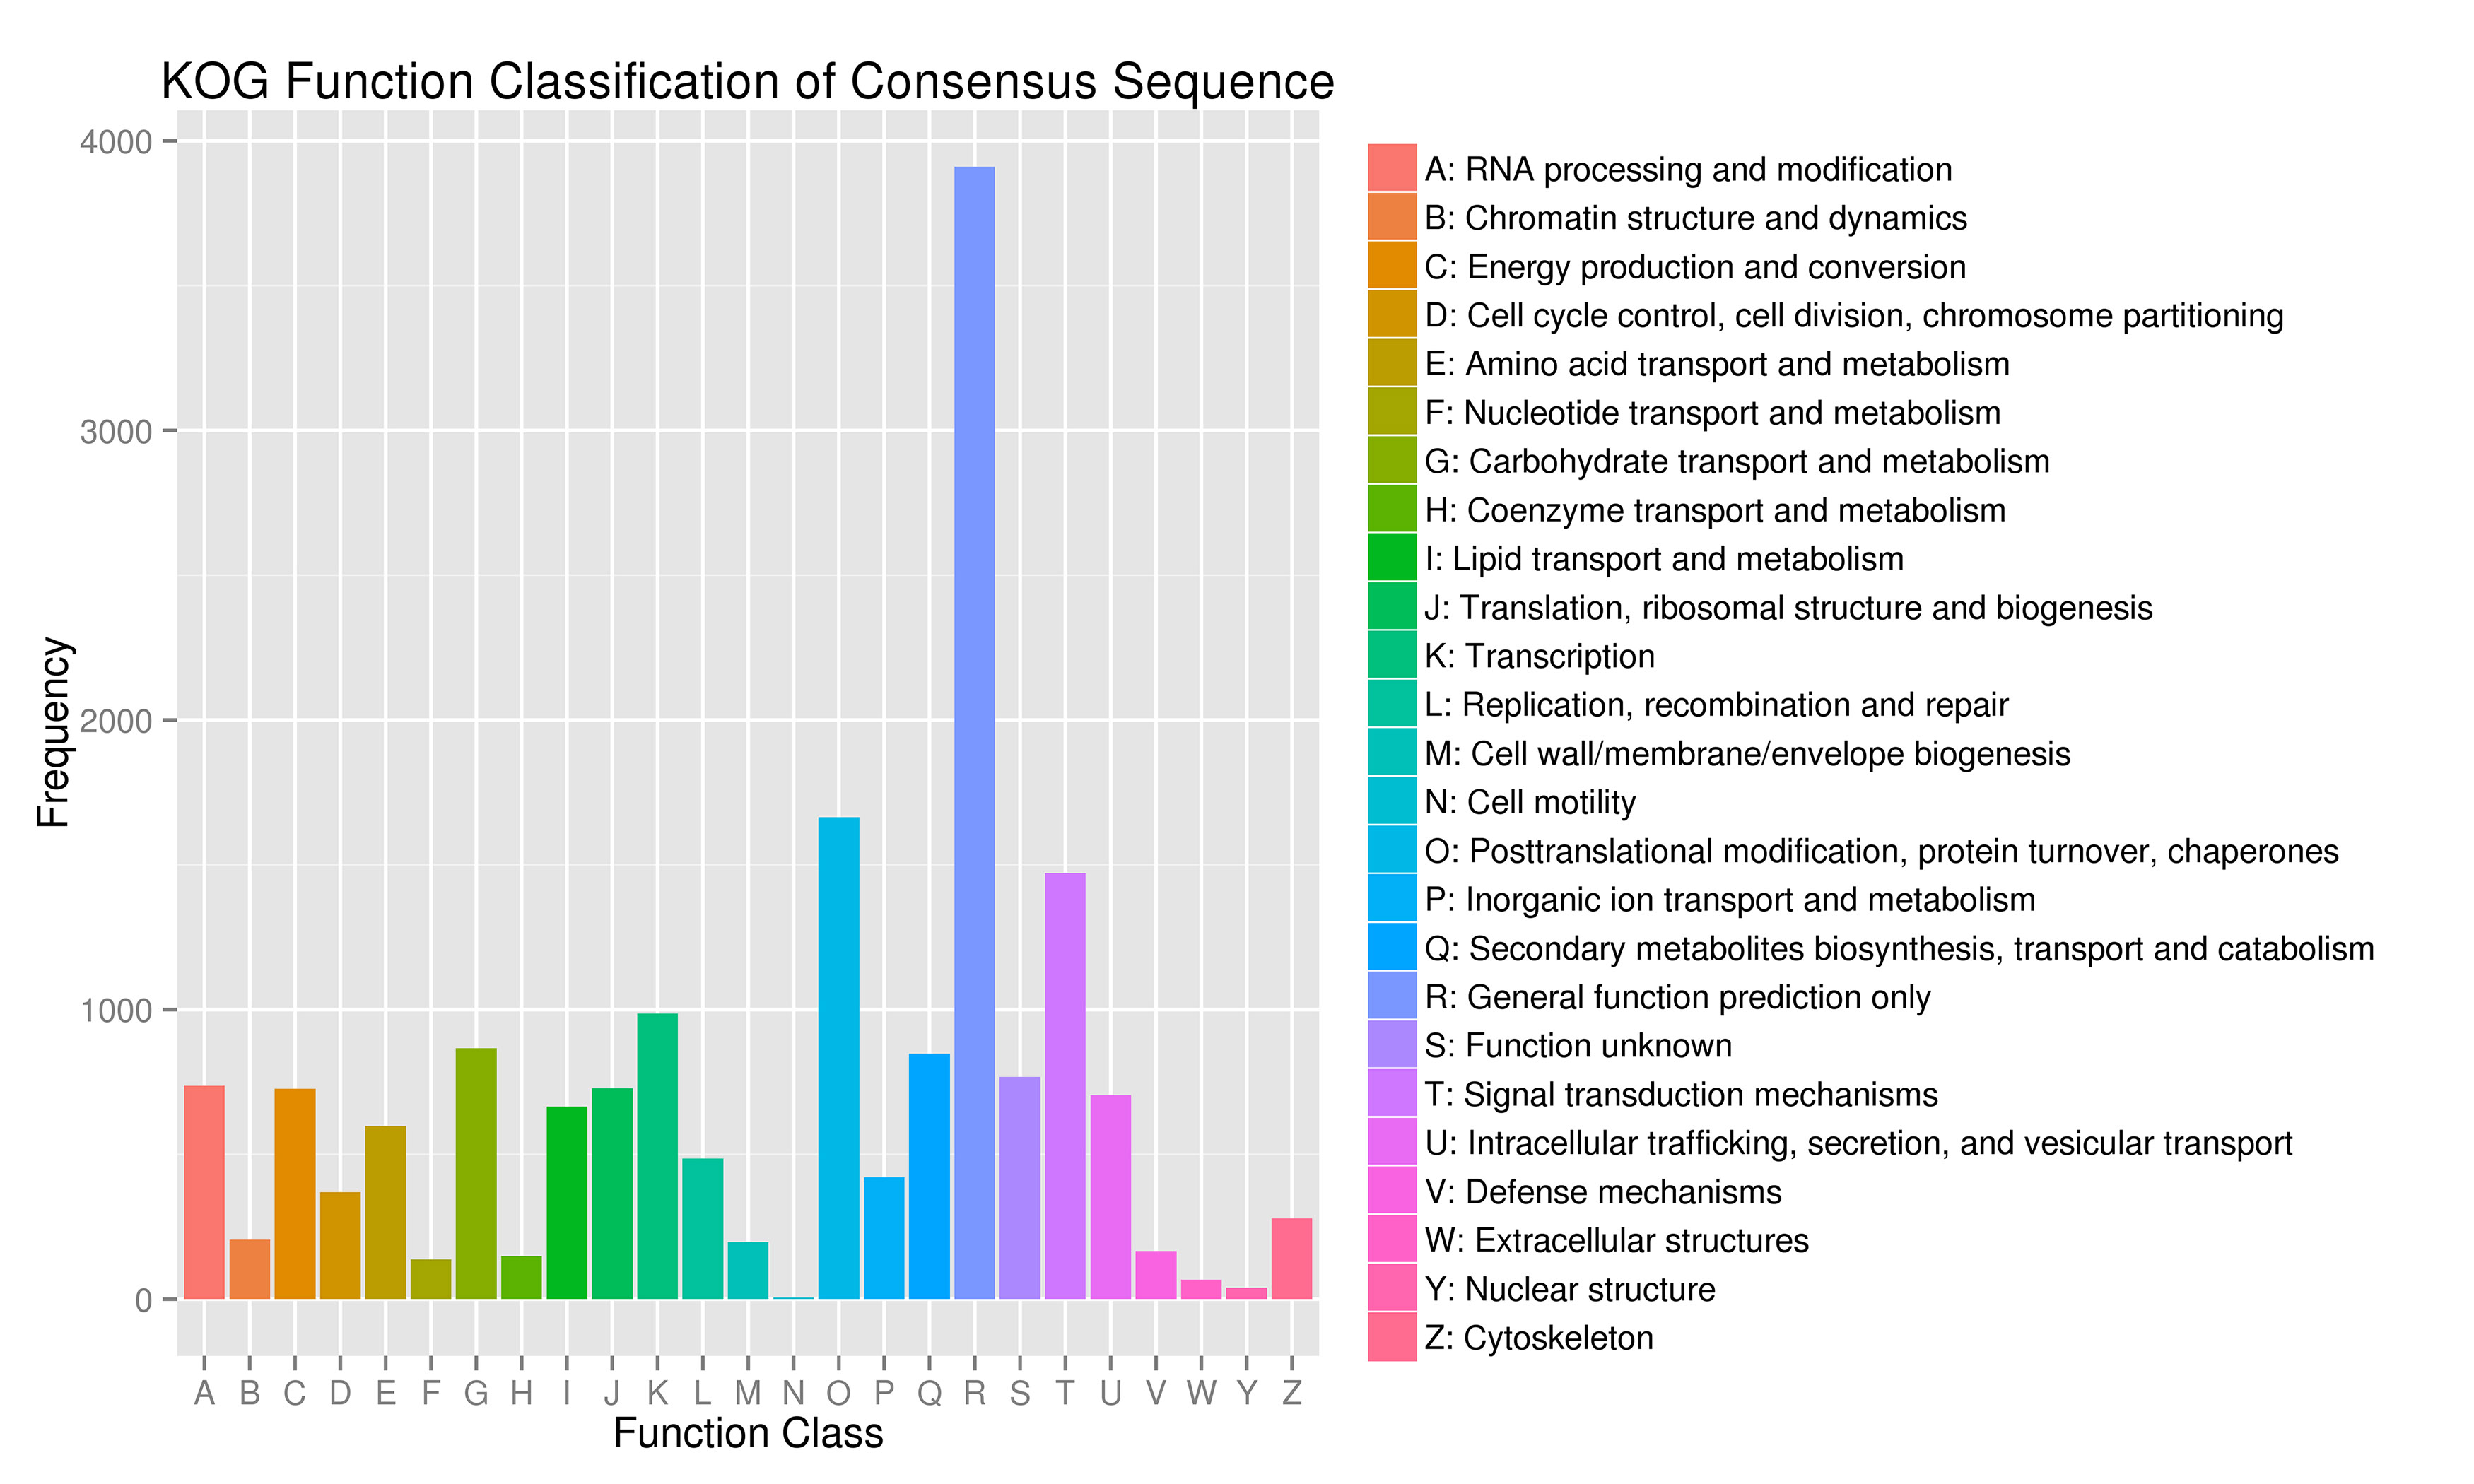
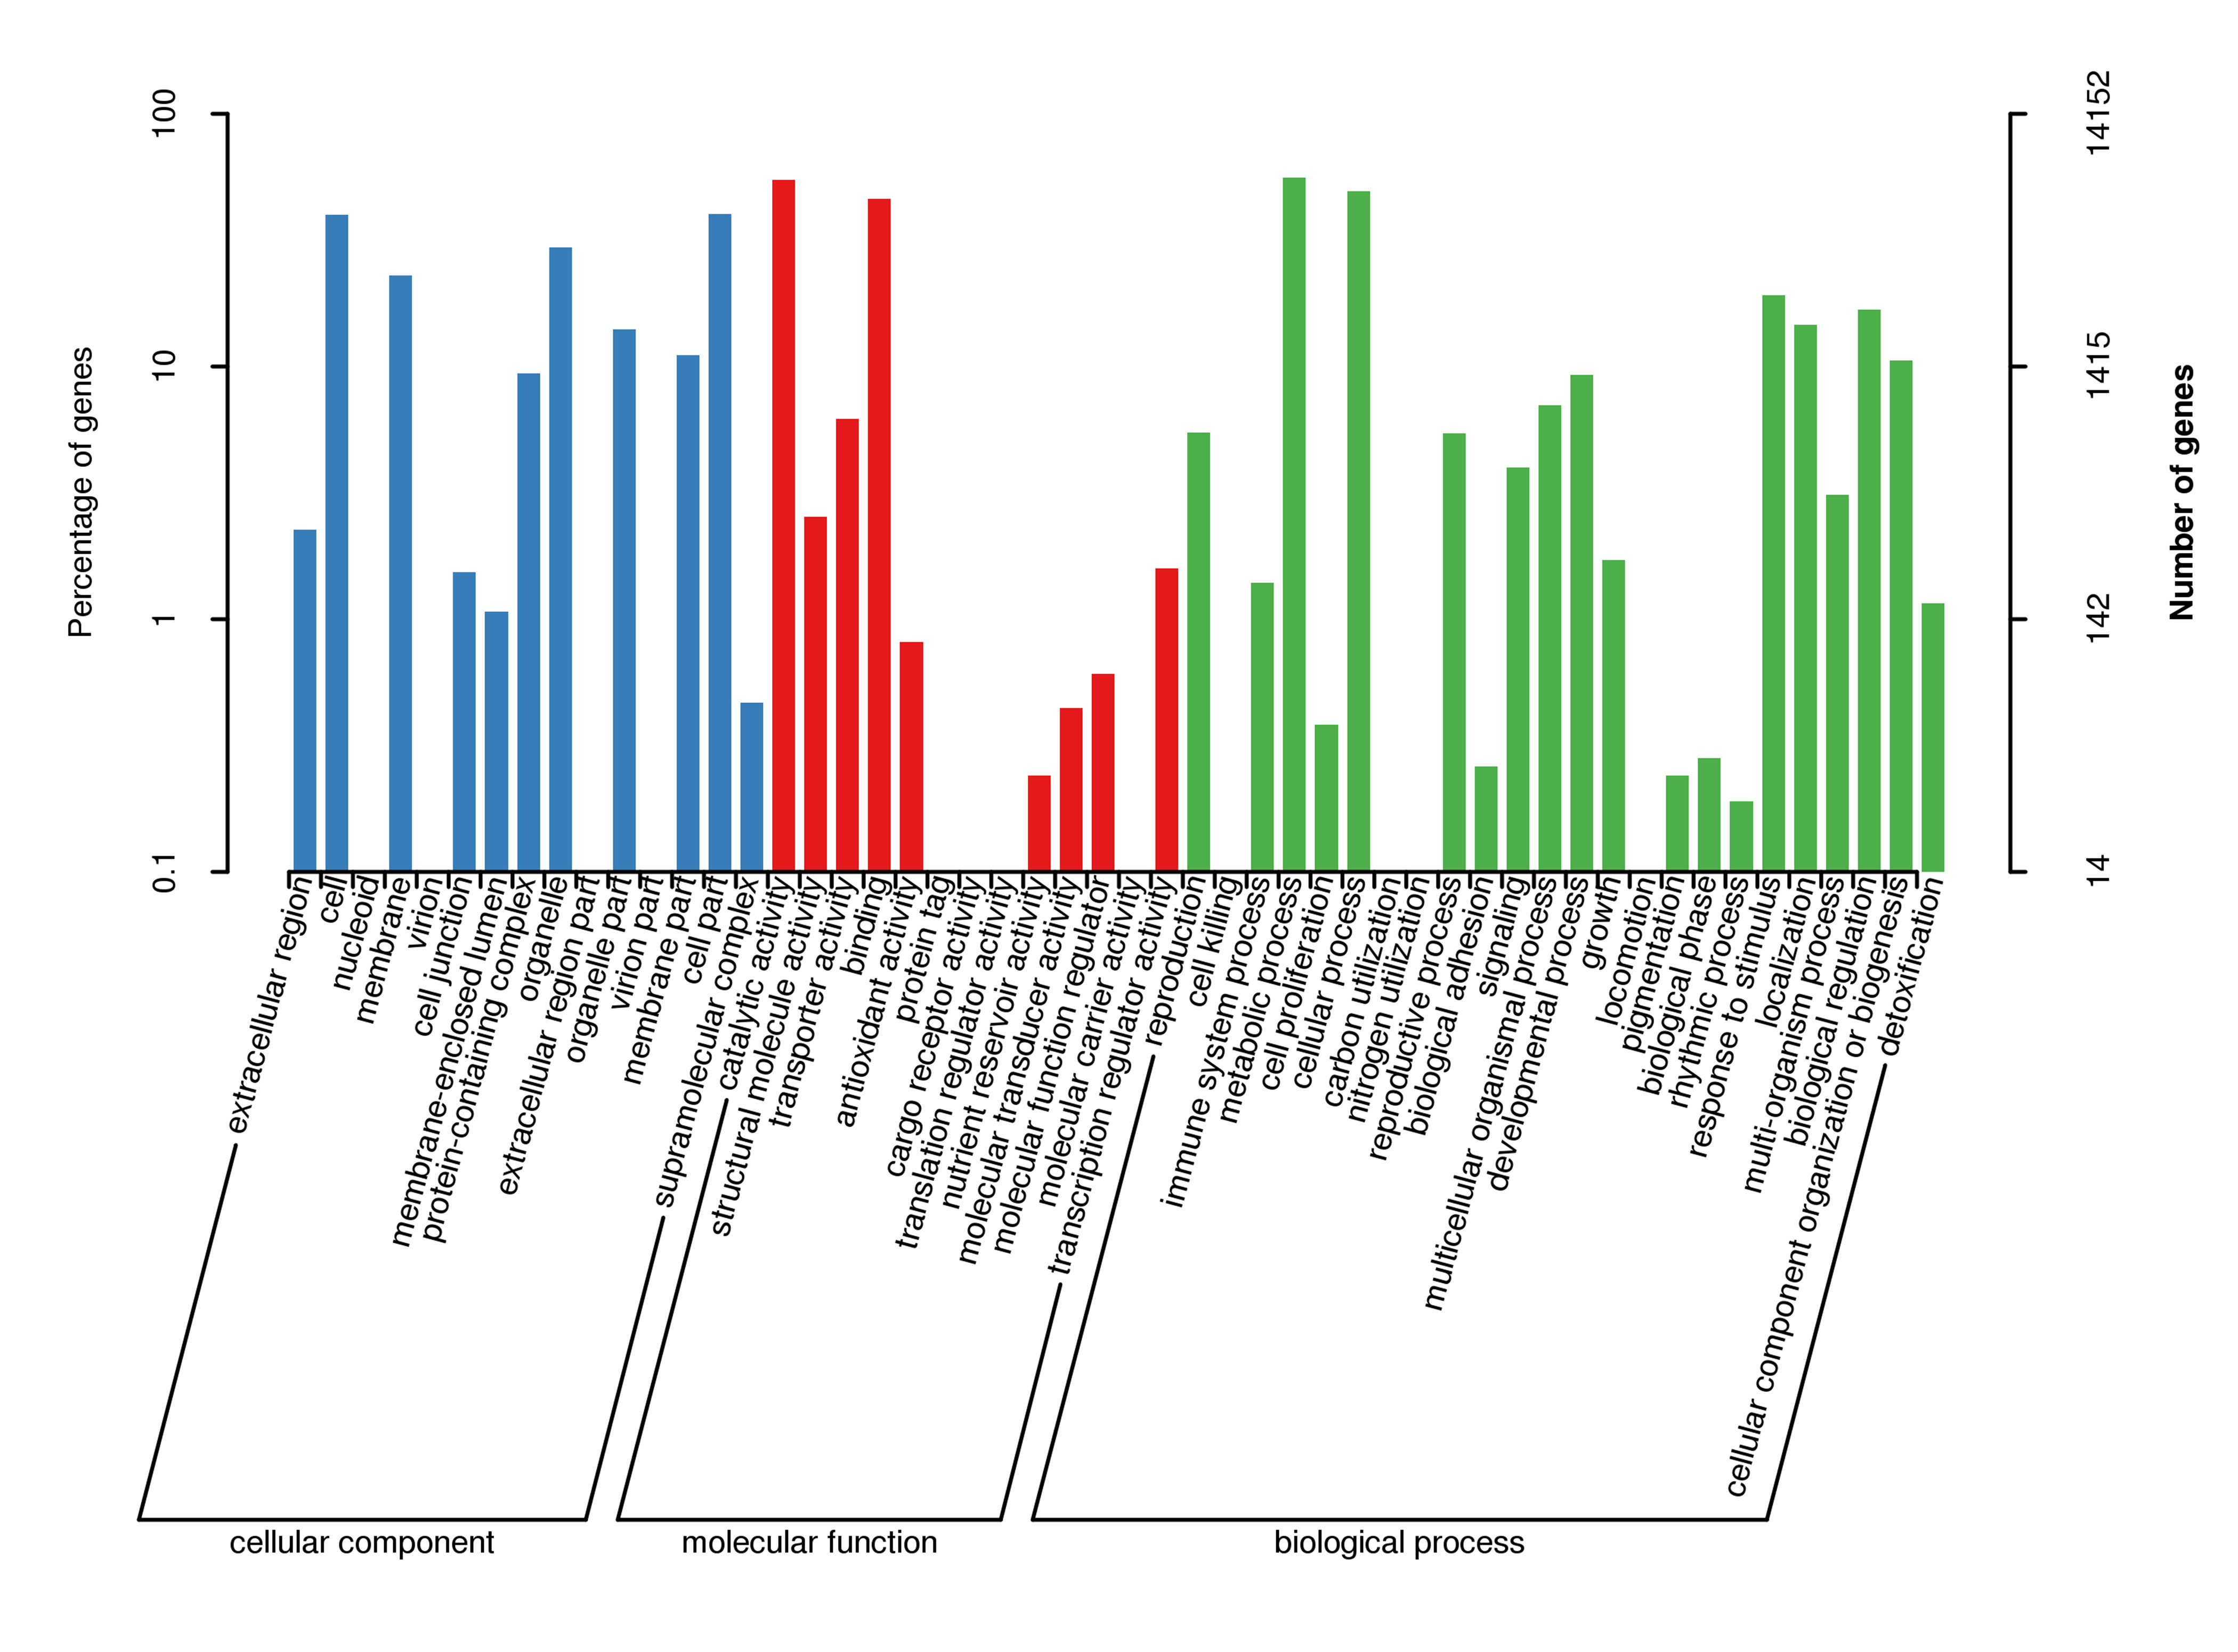
For gene function annotation, the predicted gene sequences were screened against Non-Redundant protein (NR), Eukaryotic Orthologous Groups (KOG), Gene Ontology (GO), Kyoto Encyclopedia of Genes and Genomes (KEGG), Translated EMBL (TrEMBL), and other functional databases by BLAST v2.2.31 (set cutoff as e-value 1e-5). The gene function annotation analyses reported here were carried out using KEGG, KOG, and GO. The results showed that 29,890 genes, accounting for 81.32% of the total gene number, could be functionally annotated from the KOG, KEGG, and GO databases (Supplementary Table S9), and the results of the analyses are shown in Supplementary Figs S4, S5, and S6, respectively.
Gene family analysis
-
To investigate the species-specific and common gene families, conserved putative genes from seven different species (V. bracteatum, Rhododendron occidentalis, Rhododendron williamsianum, Rhododendron delavayi, Fragaria vesca, Vitis vinifera, and Solanum lycopersicum) were used to identify gene family clusters. A total of 30,442 gene families were identified. The seven species shared 5,929 common gene families (Fig. 2a & Supplementary Table S10). Venn diagram analysis of the gene families revealed that 7,831 clusters were observed in V. bracteatum, R. delavayi, R. williamsianum, V. vinifera, and R. occidentalis, and 1,725 appeared to be lineage specific to V. bracteatum, whereas 14,299 were common to V. bracteatum and R. delavayi, 12,492 with R. williamsianum, 11,738 with V. vinifera, and 10,667 with R. occidentalis (Fig. 2b). GO and KEGG enrichment analysis was carried out to analyze gene families in V. bracteatum (Supplementary Table S11). Based on the GO database, most of the genes annotated to the three gene ontology categories, namely molecular function, cellular component, and biological process, were enriched most with respect to cellular process, plastid, and binding, respectively. For KEGG enrichment analysis, phenylpropanoid biosynthesis and protein processing in the endoplasmic reticulum (ER) were the dominant pathway terms which contained the most genes (Supplementary Fig. S7).

Figure 2.
Gene family analysis among the seven plant species. (a) Gene family clustering petal map. The middle circle is the number of gene families common to all species, and the edge is the number of gene families unique to each species. (b) Gene family clustering Venn diagram. The number below the species name is the total number of gene families, and the corresponding number of genes are in parentheses; the number in the Venn diagram is the number of gene families.
Evolution of V. bracteatum
-
The 2,883 single-copy gene sequences were used to construct the phylogenetic tree, using IQ-TREE v1.6.11 software, to show relationships among the aforementioned seven species. The results indicated that V. bracteatum showed a close relationship with the species from the same Ericaceae family, R. williamsianum and R. delavayi (Fig. 3a). To estimate the dates of divergence among these plant species, the RelTime model was used. The results indicated that the time of divergence between R. williamsianum and R. delavayi, which was used as a calibration point, was ~6−10 million years ago (Mya), and the divergence time of V. bracteatum was ~13−85 Mya, whereas V. bracteatum and S. lycopersicum diverged from a common ancestor ~36−119 Mya (Fig. 3a).
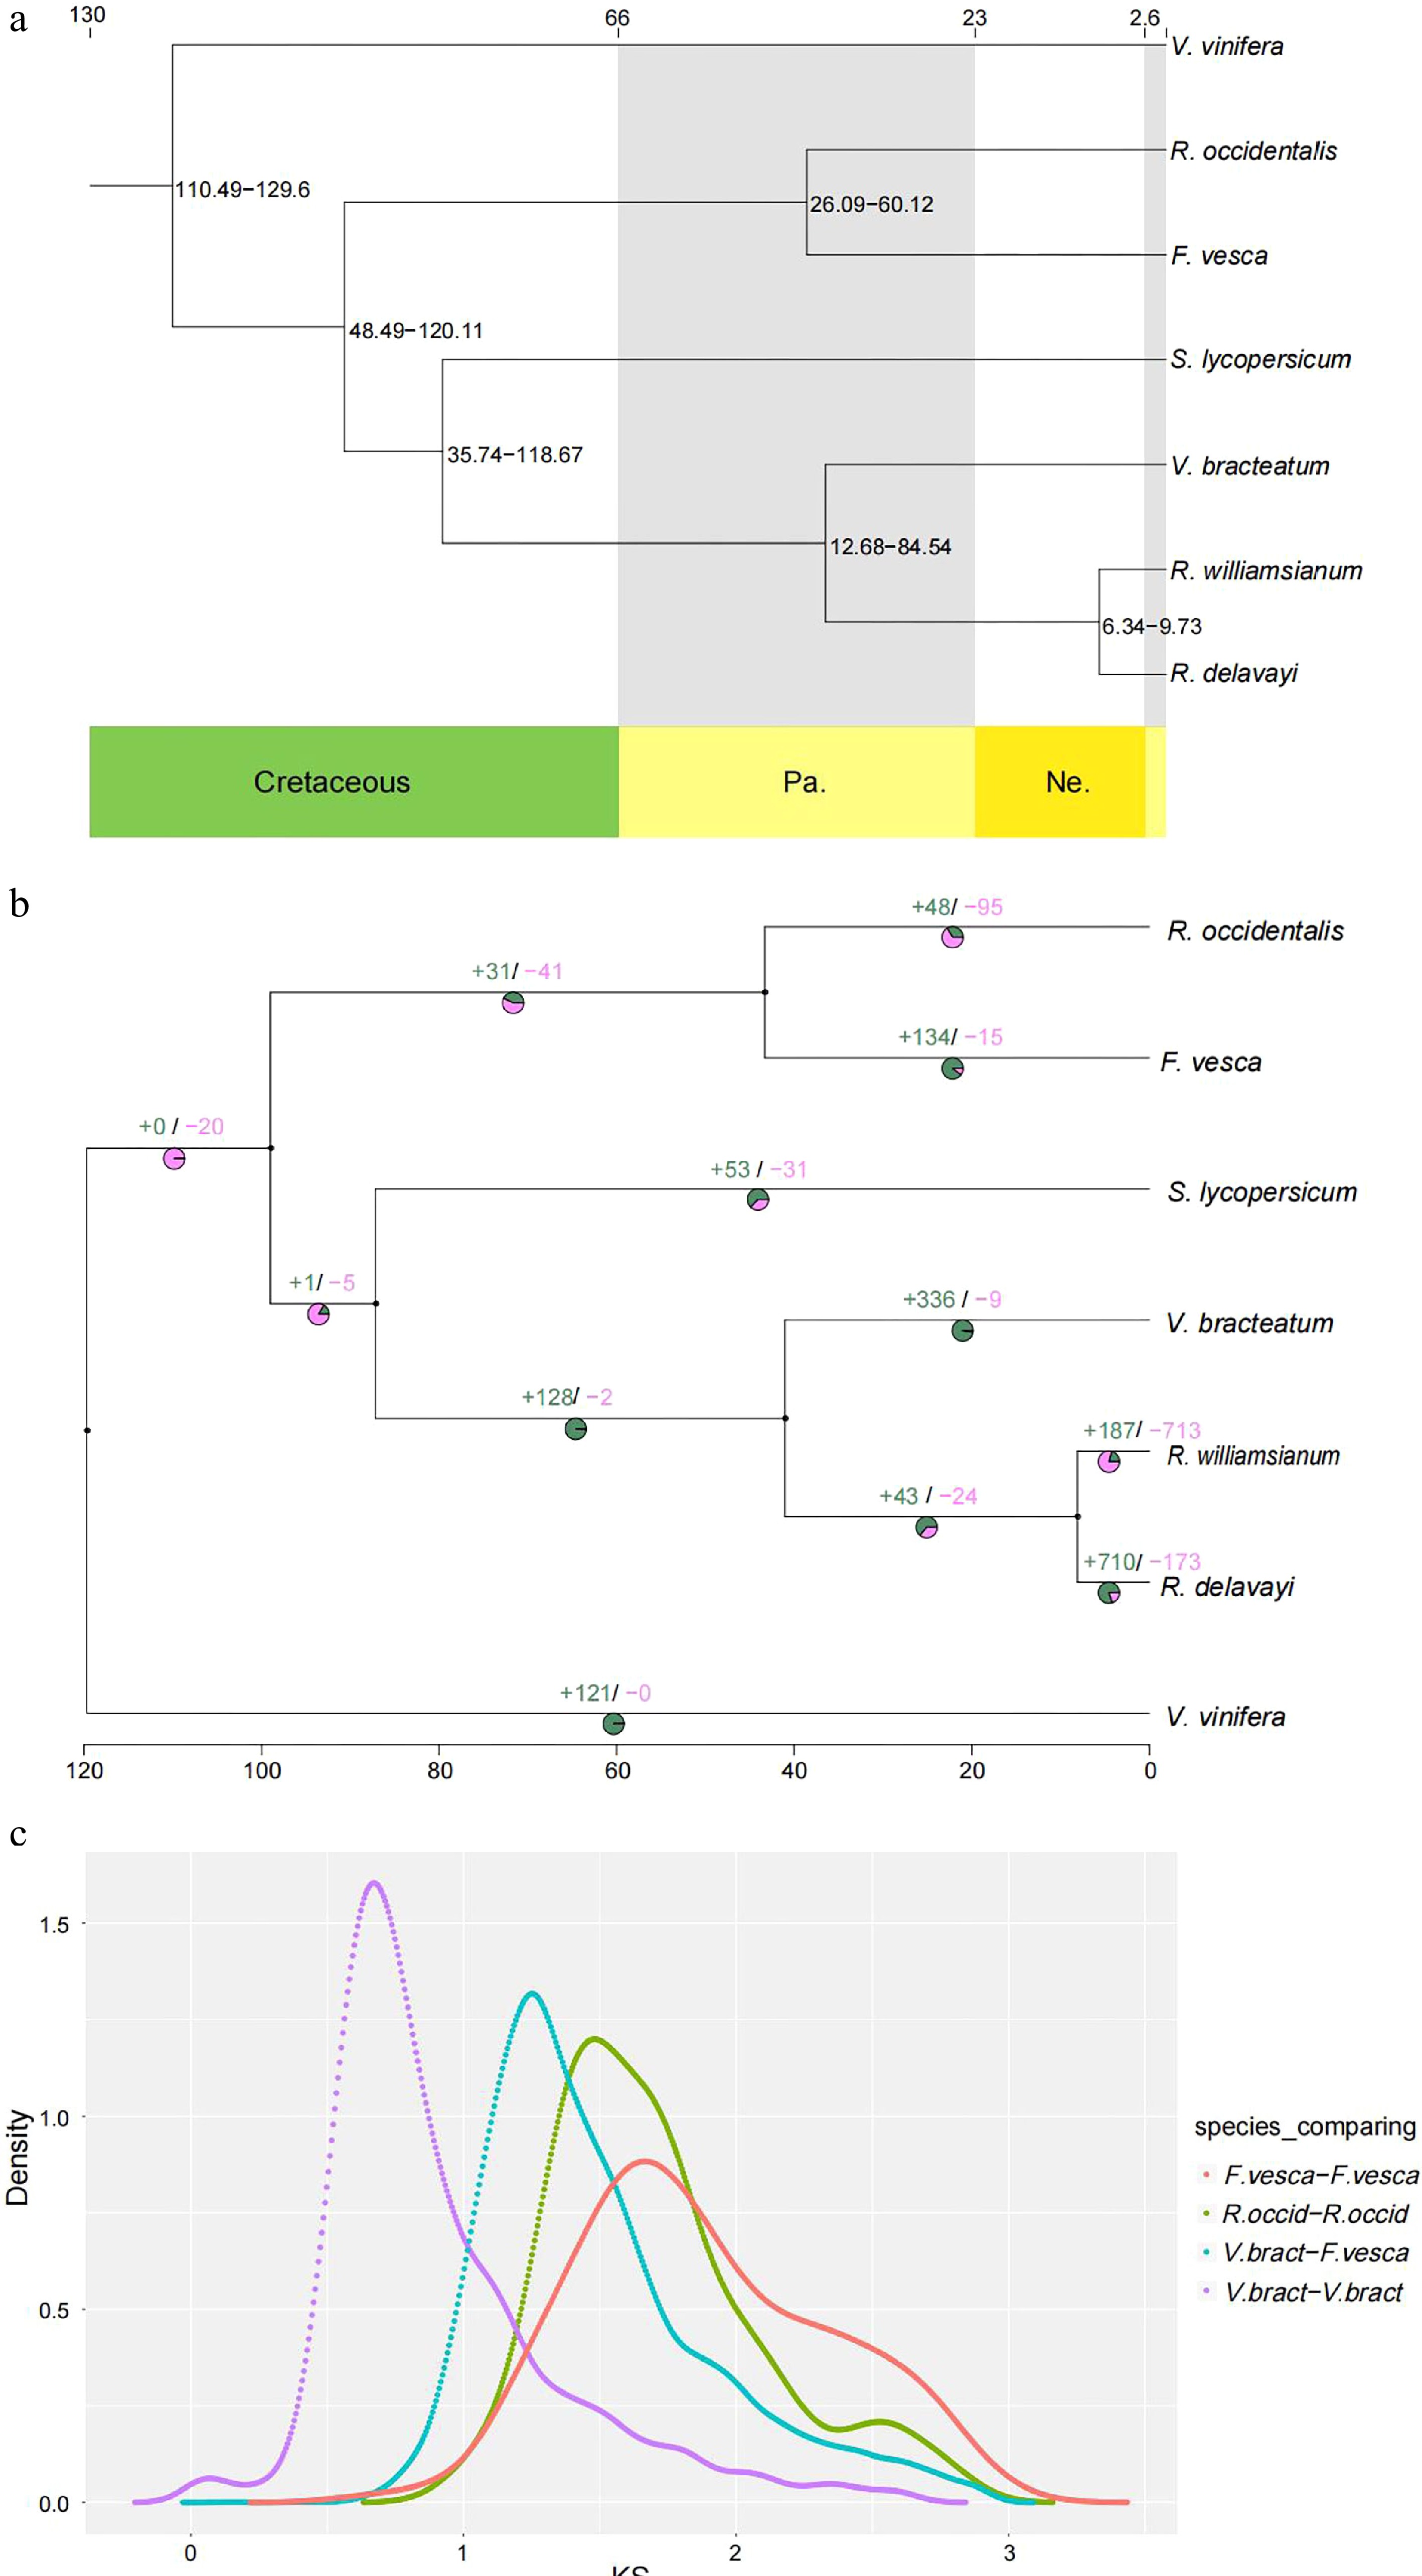
Figure 3.
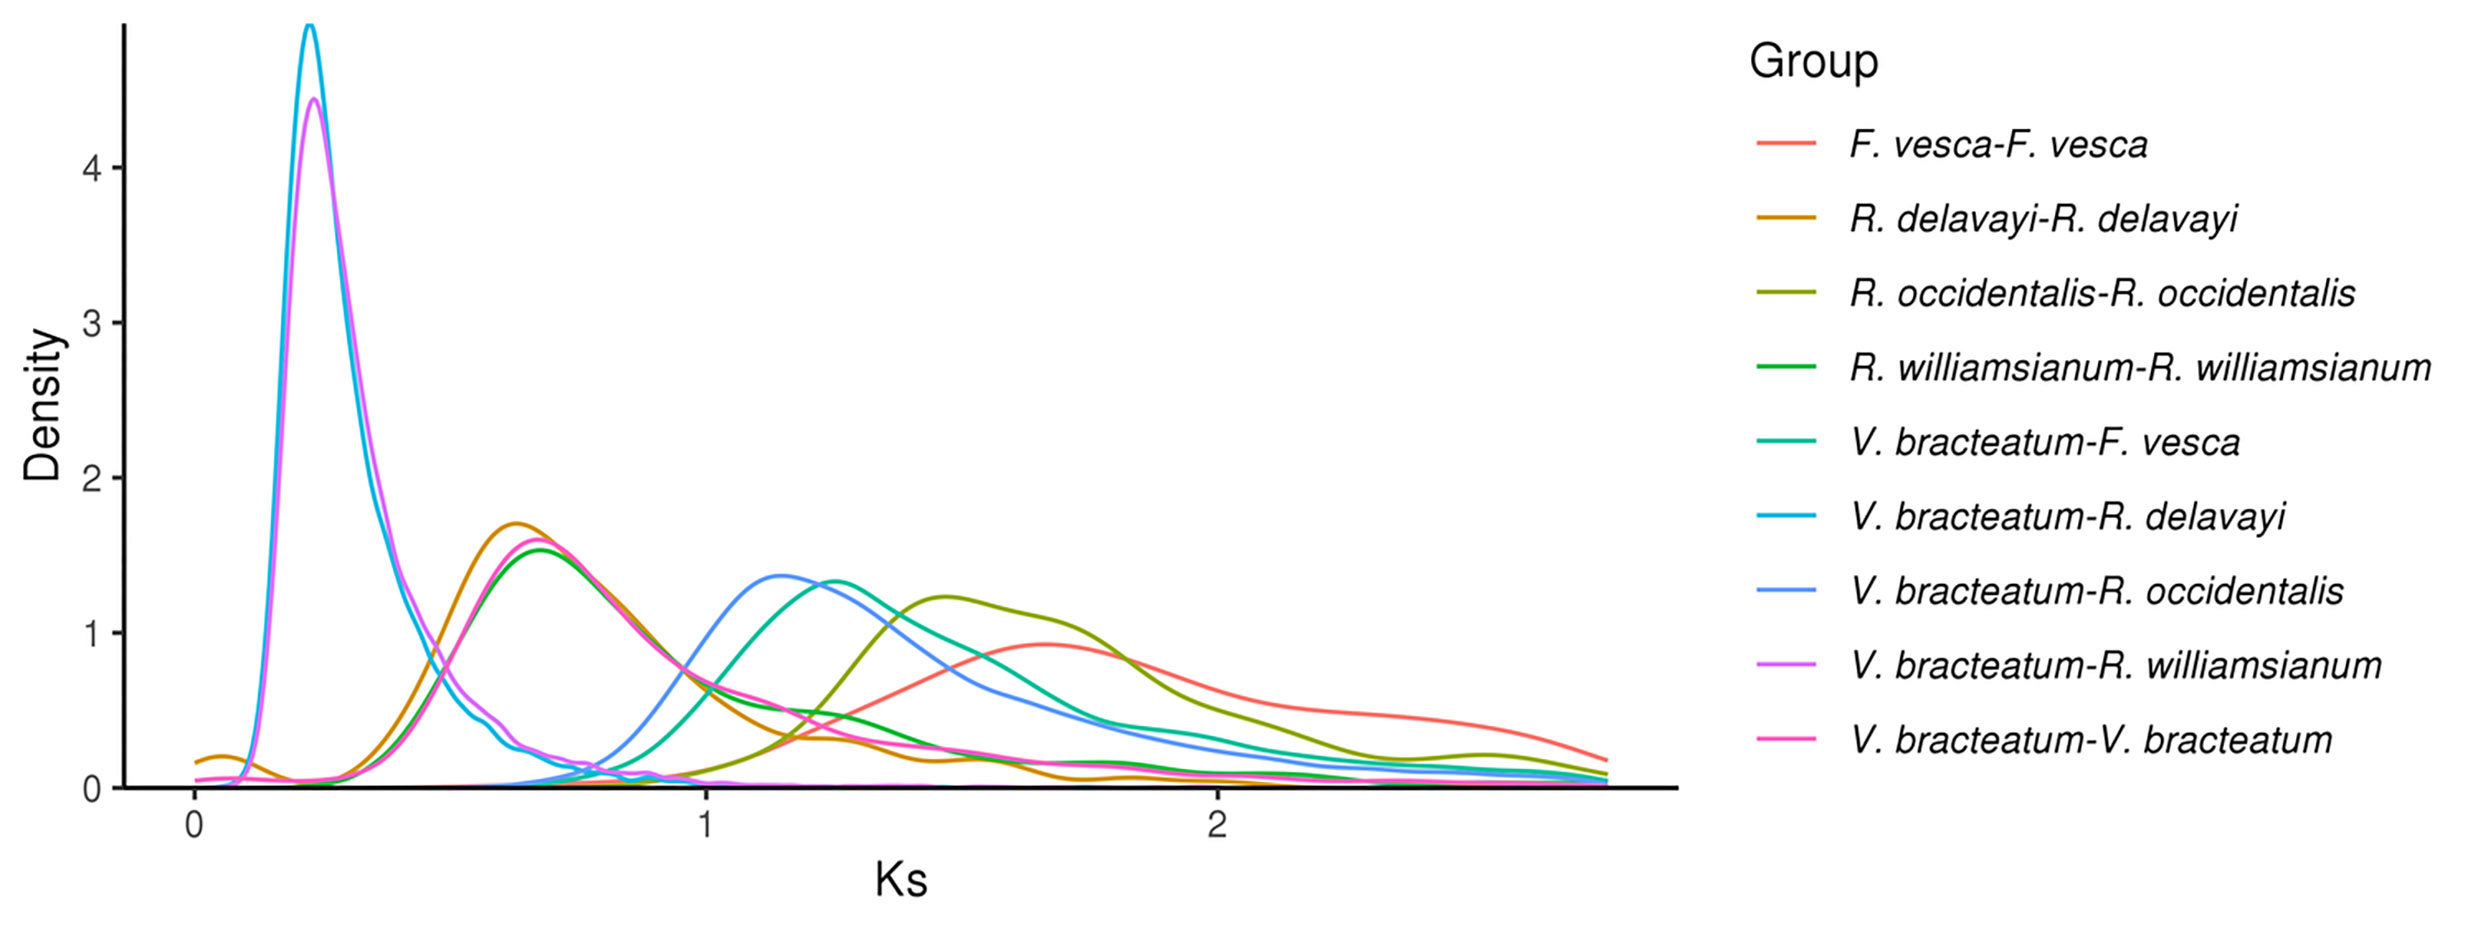
Evolution of V. bracteatum analysis. (a) Constructed phylogenetic tree and divergence time estimation (MYA, millions of years ago). Pa, Paleogene; Ne, Neogene. (b) The contraction and expansion of gene family of above mentioned seven species. +, no. of gene families expanded on the node; −, no. of gene families contracted on the node. The pie charts show the proportion of corresponding branch contraction and expansion gene families. (c) The Ks distribution map within and between species.
Combining the results of the phylogenetic tree with divergence time and gene family clustering, the contraction and expansion of gene families in V. bracteatum, relative to its ancestors, were predicted using CAFE v4.2 software. A total of 336 gene families were shown to have expanded in V. bracteatum, whereas only nine gene families had undergone contraction (Fig. 3b & Supplementary Table S12).
Ks values (number of synonymous substitutions per synonymous site), calculated for homologous gene pairs between two species or within the species itself, can be used to estimate the timing of large-scale duplications. The distribution of Ks values between V. bracteatum paralogous pairs displayed only one peak, at 0.67, which indicated a recent whole-genome duplication (WGD) event in the evolution of V. bracteatum. The distribution of Ks values between V. bracteatum and F. vesca exhibited only one peak, which suggested they shared the same ancient WGT event. Compared with F. vesca and R. occidentalis, the low Ks values found in V. bracteatum suggested that the divergence of V. bracteatum occurred later than with these other species (Fig. 3c & Supplementary Fig. S8). Fossil records were downloaded from the TIMETREE website (
https://www.timetree.org ) and used to calibrate the results. The divergence time of V. bracteatum and F. vesca was set to 121 Mya, with the Ks value of V. bracteatum vs. F. vesca being 1.25. Based on the generally accepted evolutionary rate, the WGD event of V. bracteatum occurred at approximately 64 Mya. The WGD event occurred at 11 Mya base on the divergence time of V. bracteatum and R. williamsianum or R. delavayi.Chromosome synteny analysis
-
Chromosome evolution between the genomes of V. bracteatum and those of the related species R. occidentalis, R. williamsianum, and F. vesca was evaluated using MCScan algorithms. The occurrence of large-scale chromosomal fragment rearrangements was found among V. bracteatum, F. vesca, R. occidentalis and R. williamsianum, including inversions and translocations (Fig. 4a). Also, compared with the groupings of V. bracteatum vs. F. vesca, and V. bracteatum vs. R. occidentalis, there were fewer scattered points in V. bracteatum vs. R. williamsianum, suggesting a closer relationship between V. bracteatum and R. williamsianum (Fig. 4b). Overall, these findings offer new insights into the evolution of V. bracteatum chromosomes.

Figure 4.
The chromosomal collinearity among V. bracteatum, R. williamsianum, R. occidentalis, and F. vesca. (a) The chromosome map in four species. (b) The inter-genomic comparison in point graph form.
Positively selected genes in V. bracteatum
-
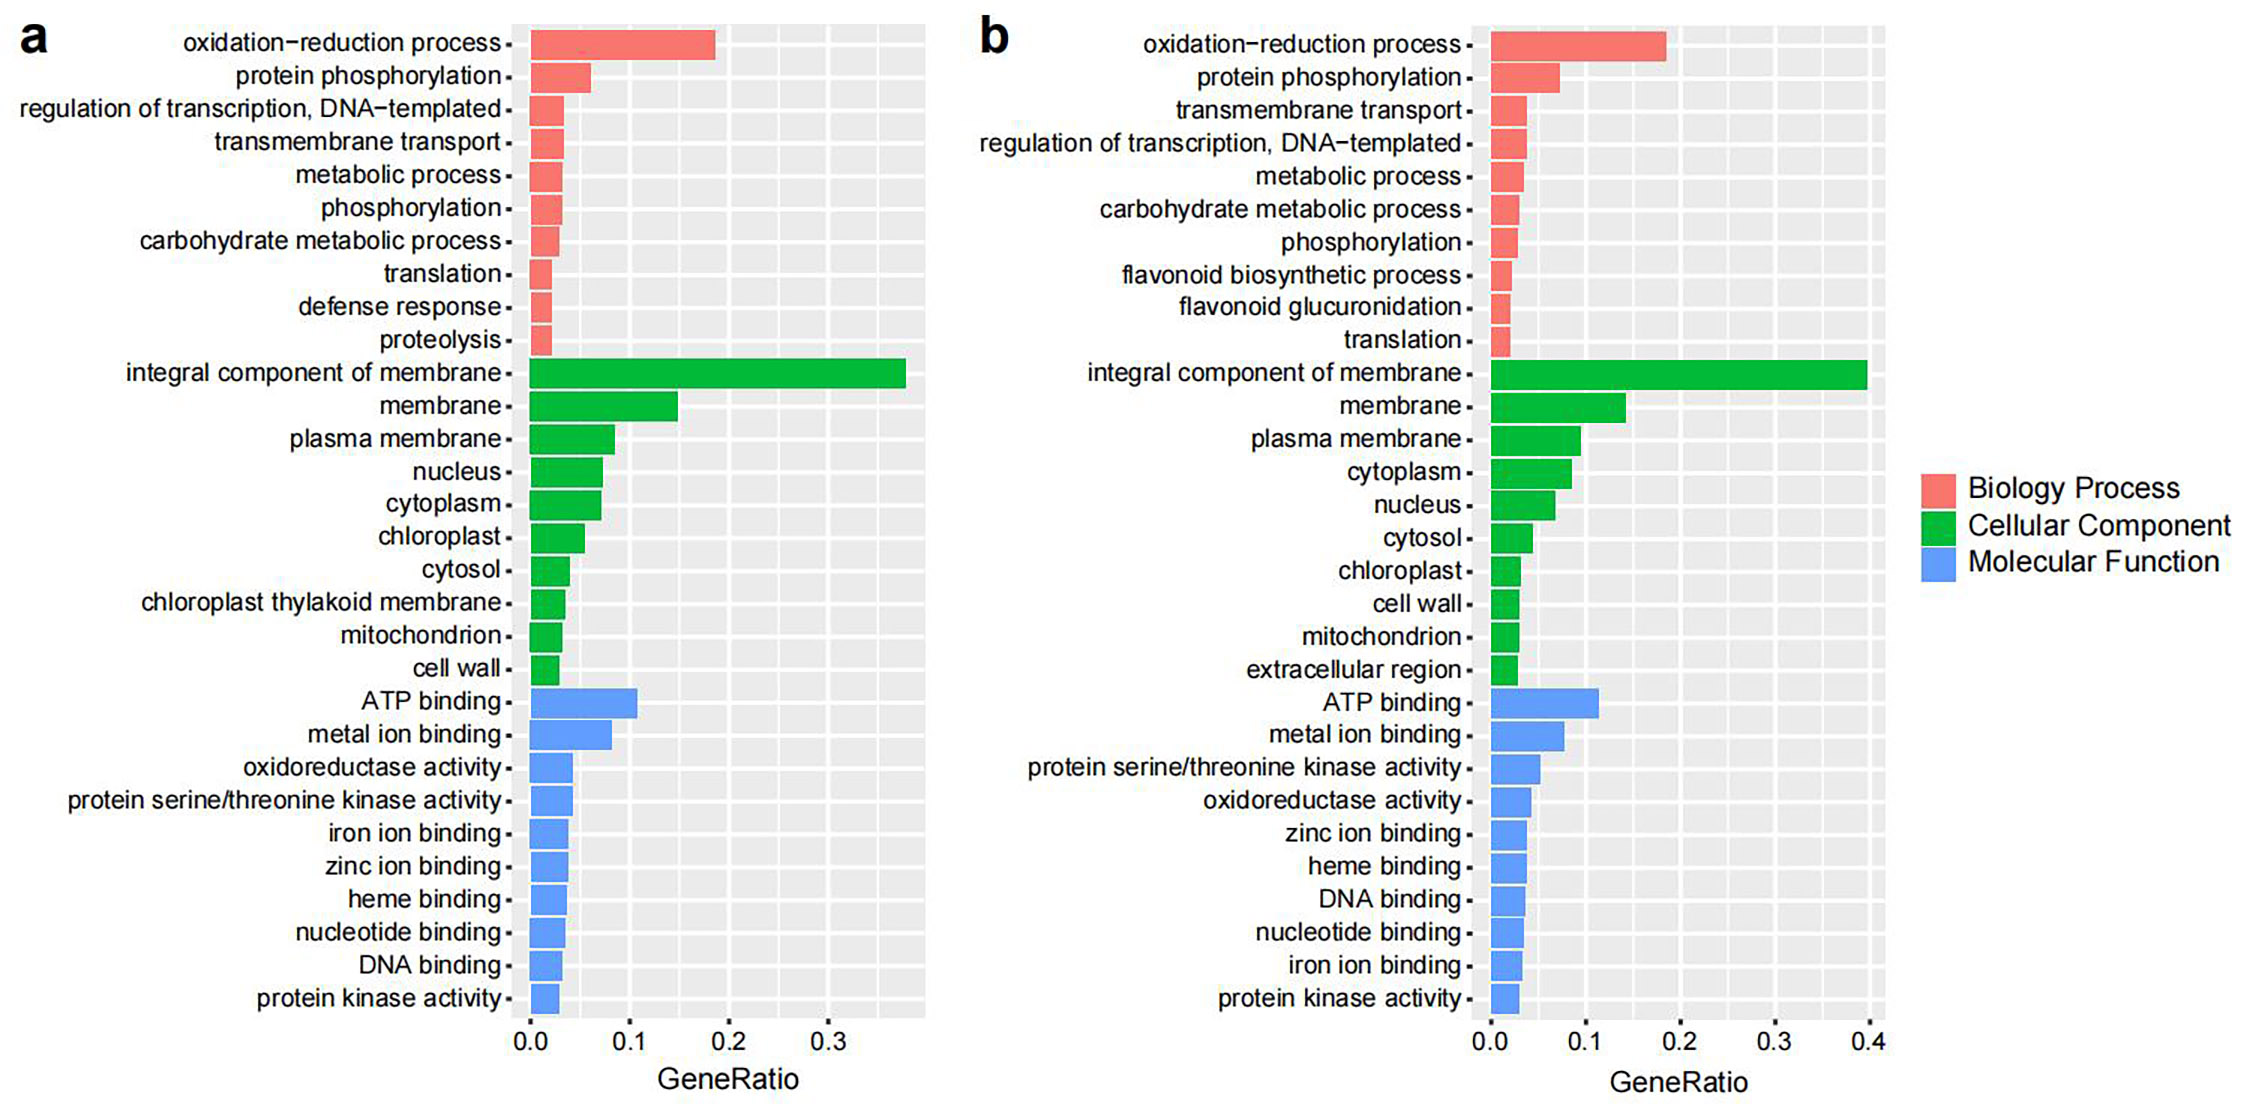
The Ka/Ks ratios of the single-copy V. bracteatum genes were evaluated with those from the other six species (V. vinifera, R. delavayi, R. williamsianum, S. lycopersicum, F. vesca, and R. occidentalis) to identify positively selected genes (Ka/Ks > 1). A total of 298 candidate genes in V. bracteatum exhibited positive selection (Supplementary Table S13), and the annotation of these positively selected genes can be found in Supplementary Table S14. For GO analysis, 179 of the positively selected genes were enriched in three categories namely biological process (the terms of metabolic process, cellular process and response to stimulus account for the top three), molecular function (the terms of cell part, cell and organelle account for the top three), and cellular component (the terms of catalytic activity, binding and transporter activity account for the top three) (Fig. 5a & Supplementary Table S15). For KEGG analysis, most of the enriched genes were associated with pathways dealing with mismatch repair and peroxisome function (Fig. 5b & Supplementary Table S16). For example, EVM0010597 was the positively selected gene related to ABC transporter which may play a role in transmembrane transport of sugars and cell metabolites (Fig. 5b & Supplementary Table S14).
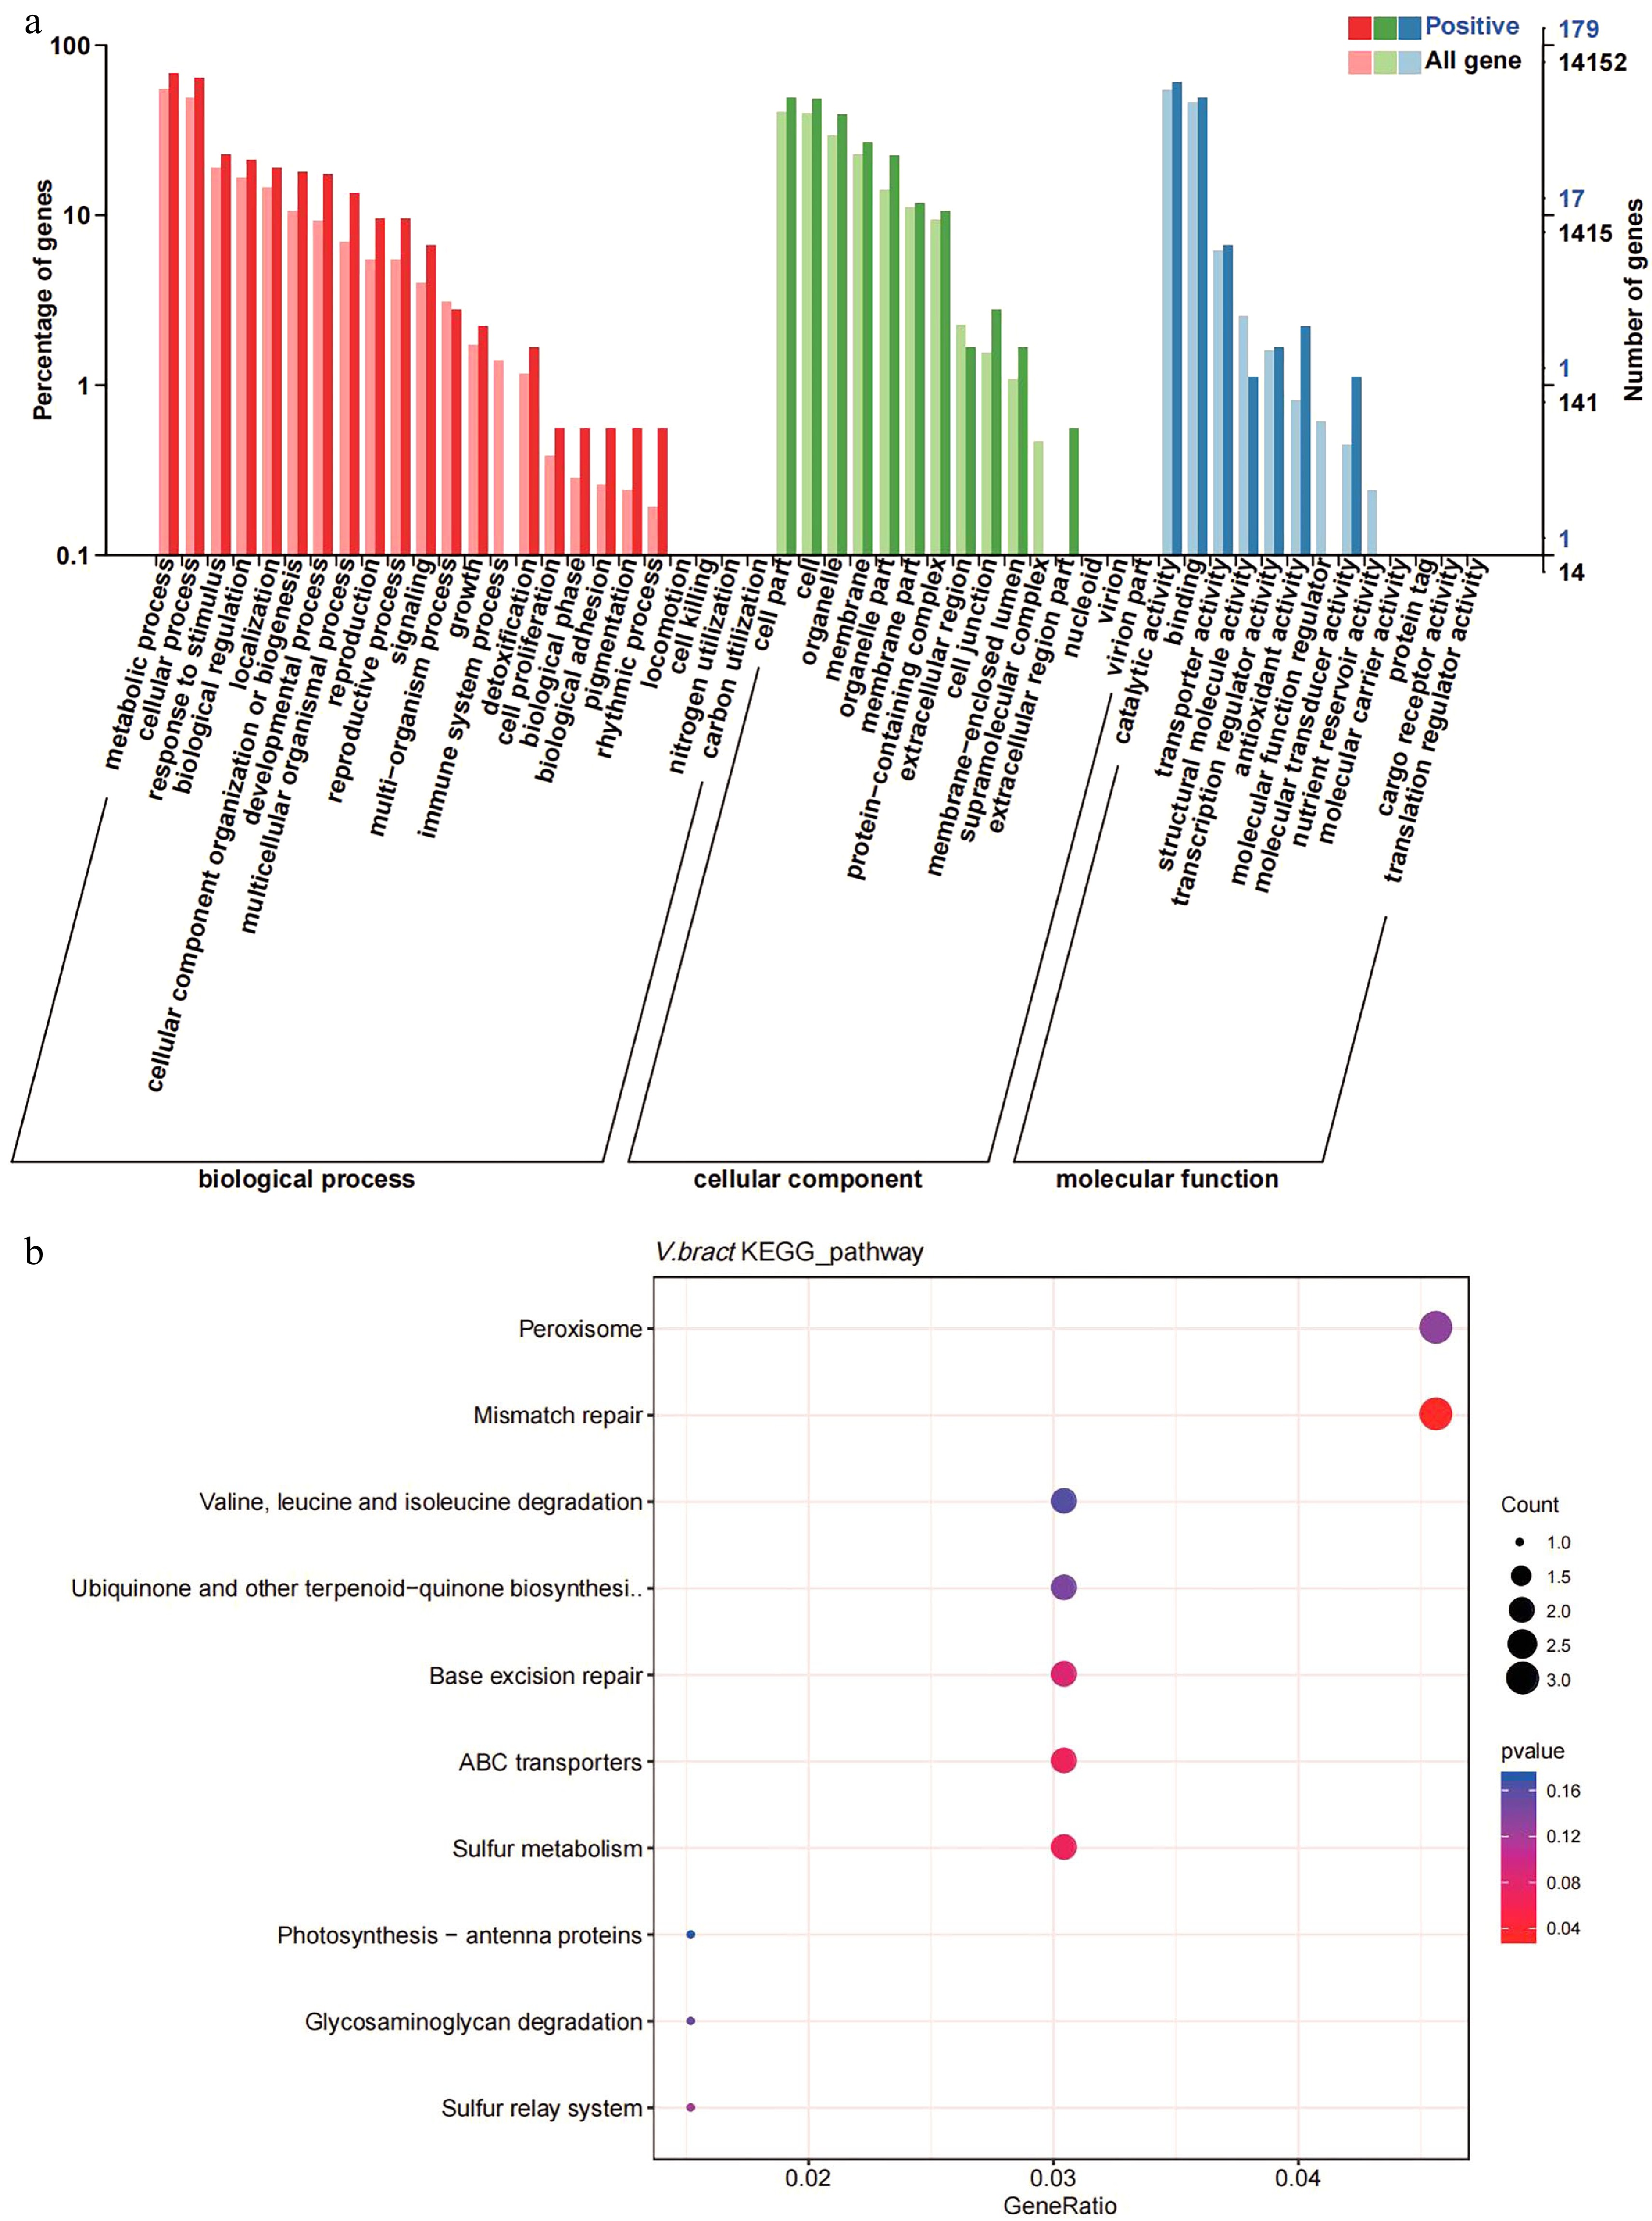
Figure 5.
Gene ontology (GO) and KEGG enrichment analysis of positively selected genes in V. bracteatum by clusterProfile. (a) GO enrichment analysis. The abscissa in the column chart represent the number of genes under the GO term, and the color is the corresponding P value. (b) The KEGG enrichment analysis. The abscissa in the plot represents proportion of the number of positively selected genes under the pathway to the total positively selected genes. The size of the point represents the number of genes enriched on this pathway, and the color is the corresponding P value.
Flavonoid-related genes on chromosomes
-
Compared with the flavonoid-related genes of Arabidopsis, the greatest number of flavonoid -related genes was found in V. bracteatum. The genome assembly allowed us to locate all the structural genes of the anthocyanin biosynthesis pathway. From the genome sequences, a total of 48 genes, mainly encoding these structural genes, were identified by screening. Of these genes, nine were located on chromosome 2, namely two flavonol synthase genes (FLS), four chalcone synthase genes (CHS), one leucoanthocyanidin reductase gene (LAR), one gene encoding a cytochrome P450 enzyme, and one chalcone and stilbene synthase family protein gene (Fig. 6).
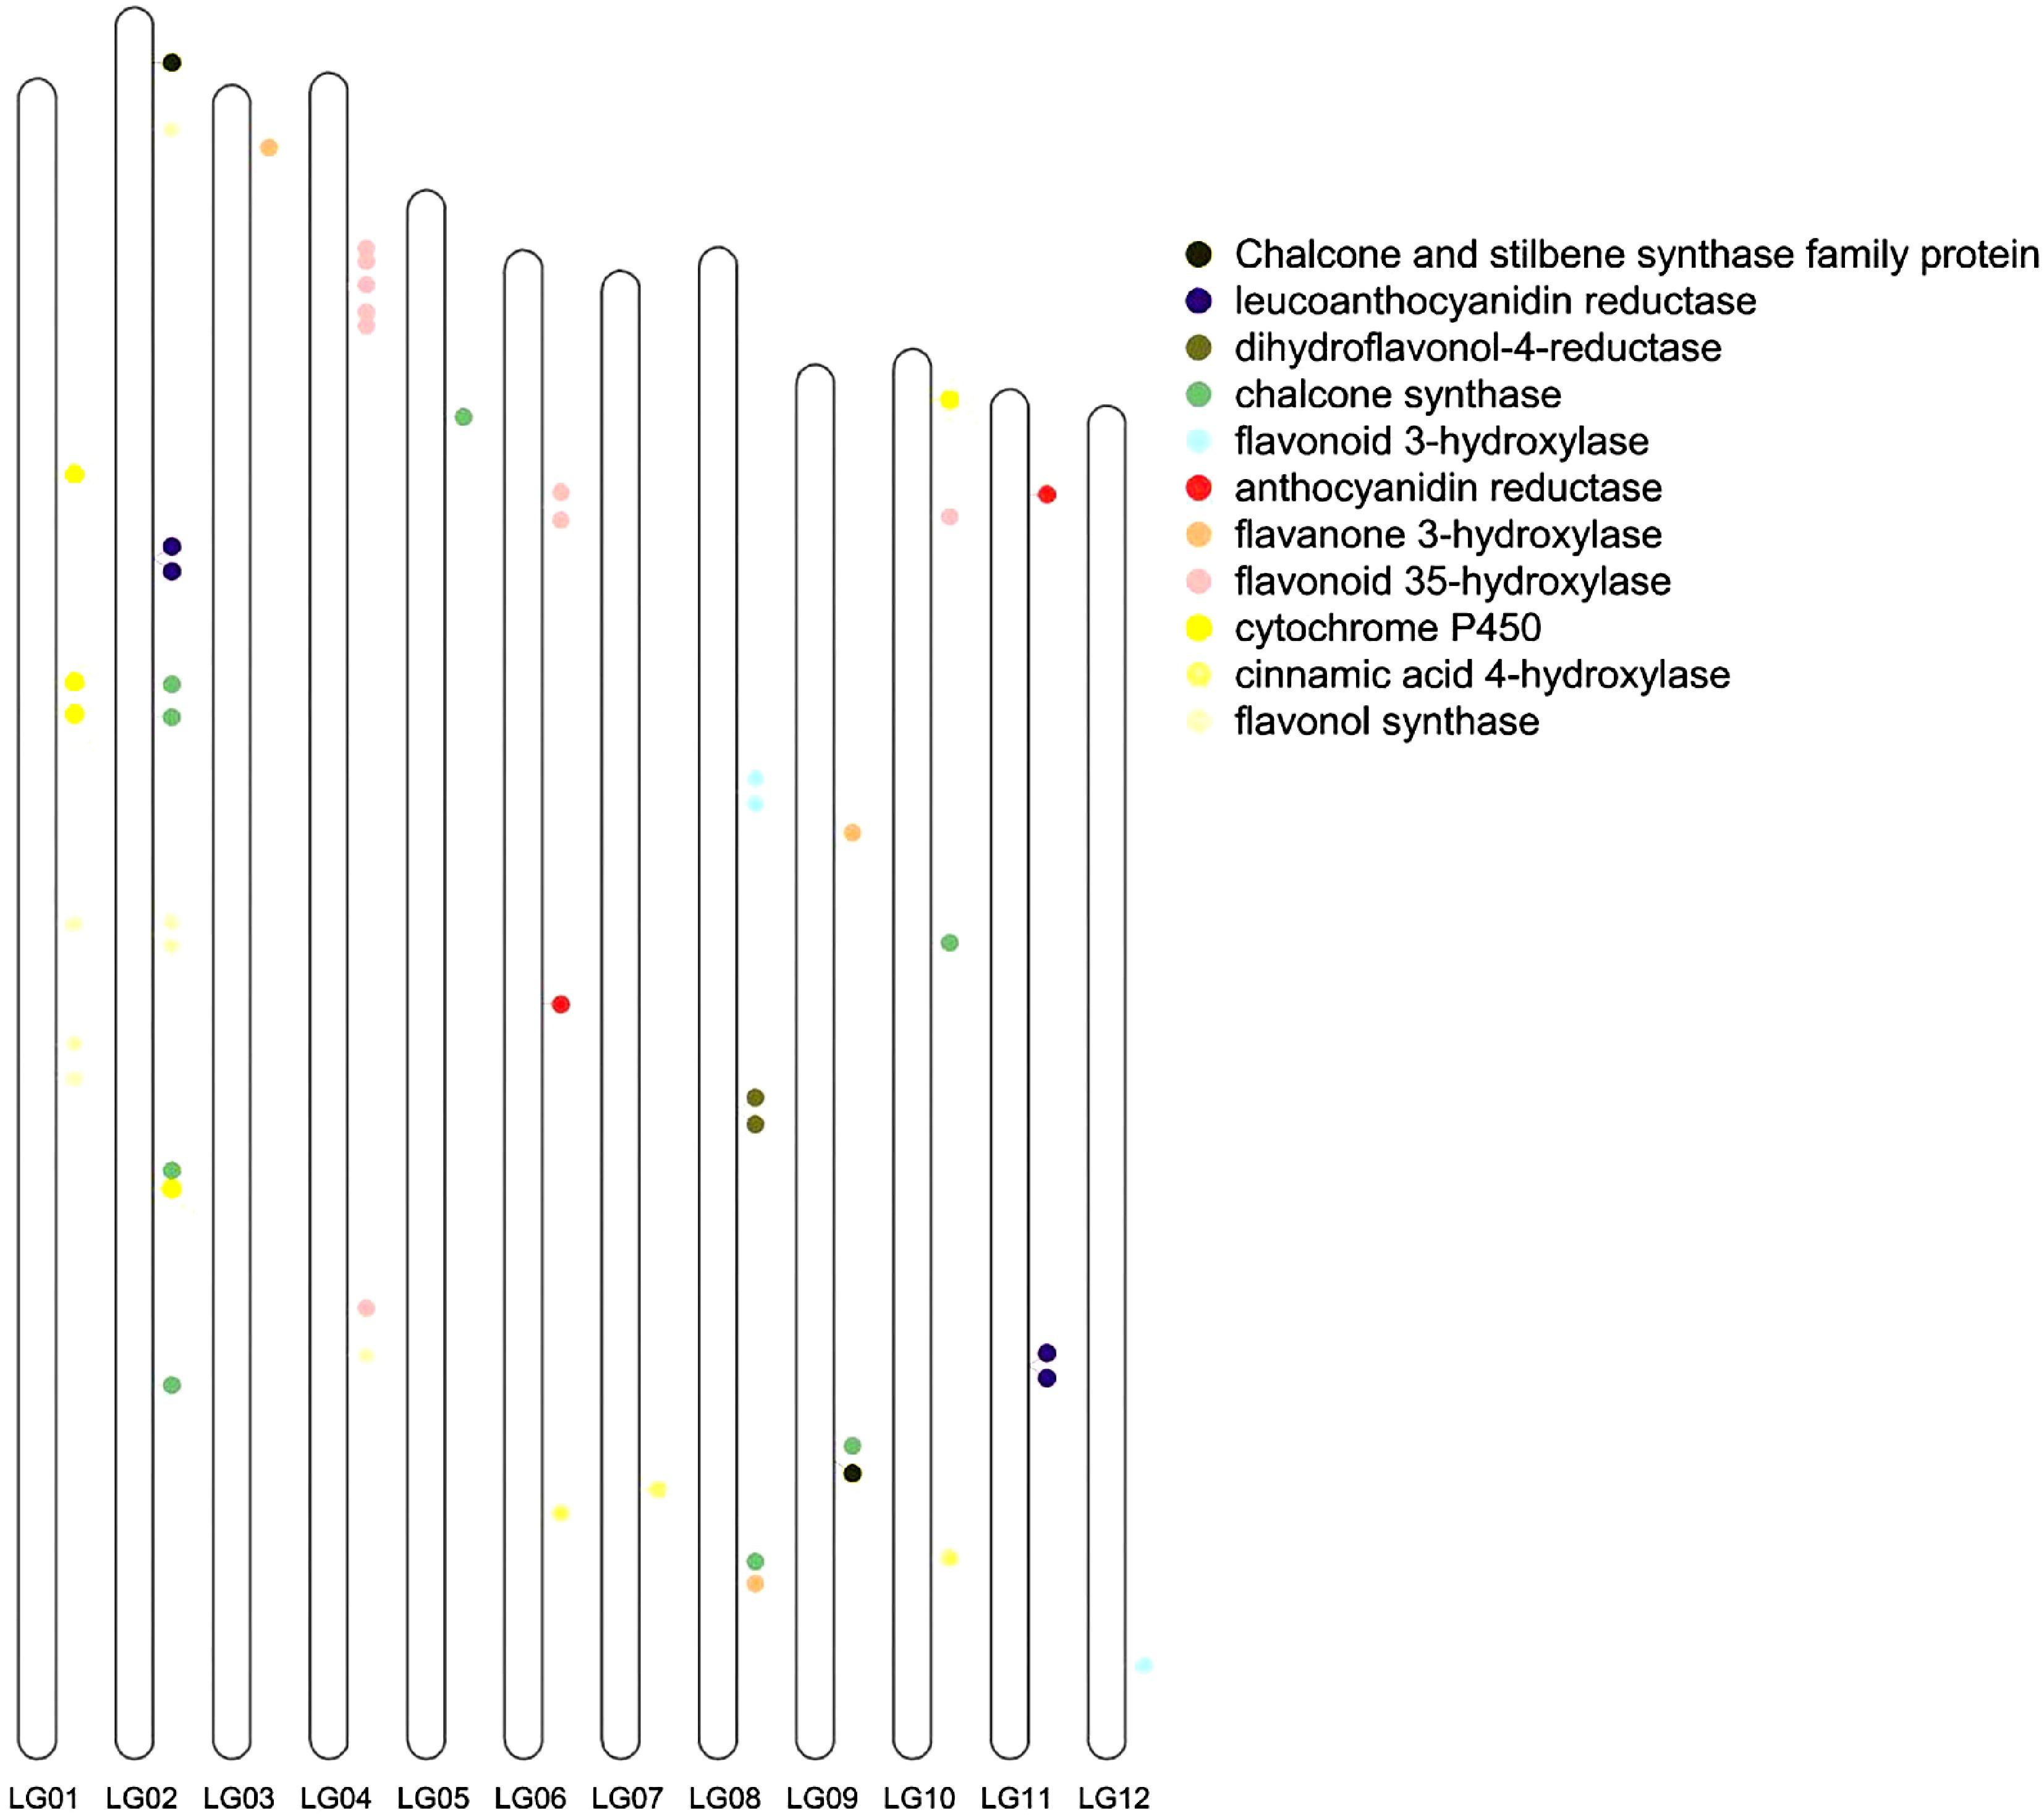
Figure 6.
Flavonoid related genes located on the chromosomes. LG01, LG02, ... and LG12 indicate chromosome 1, 2, ... and 12, respectively.
MYB phylogenetic tree construction and the expression of MYB genes
-
To verify the classification of MYB transcription factors in V. bracteatum, we constructed a phylogenetic tree by aligning the MYB proteins. Fourteen out of 44 MYB genes exhibited significantly different expression during fruit development, which indicated that most MYB-related genes in V. bracteatum may not be related to fruit development, with the exceptions of MYB110_5 and MYB_5 (Fig. 7). Interestingly, no differentially expressed genes (DEGs) were found between green fruit and leaf, which indicated that the MYB family may not contribute to unripe fruit development.

Figure 7.
Phylogenetic tree and heatmap of MYB transcription factor in the V. bracteatum genome.
RNA-Seq data for analysis
-
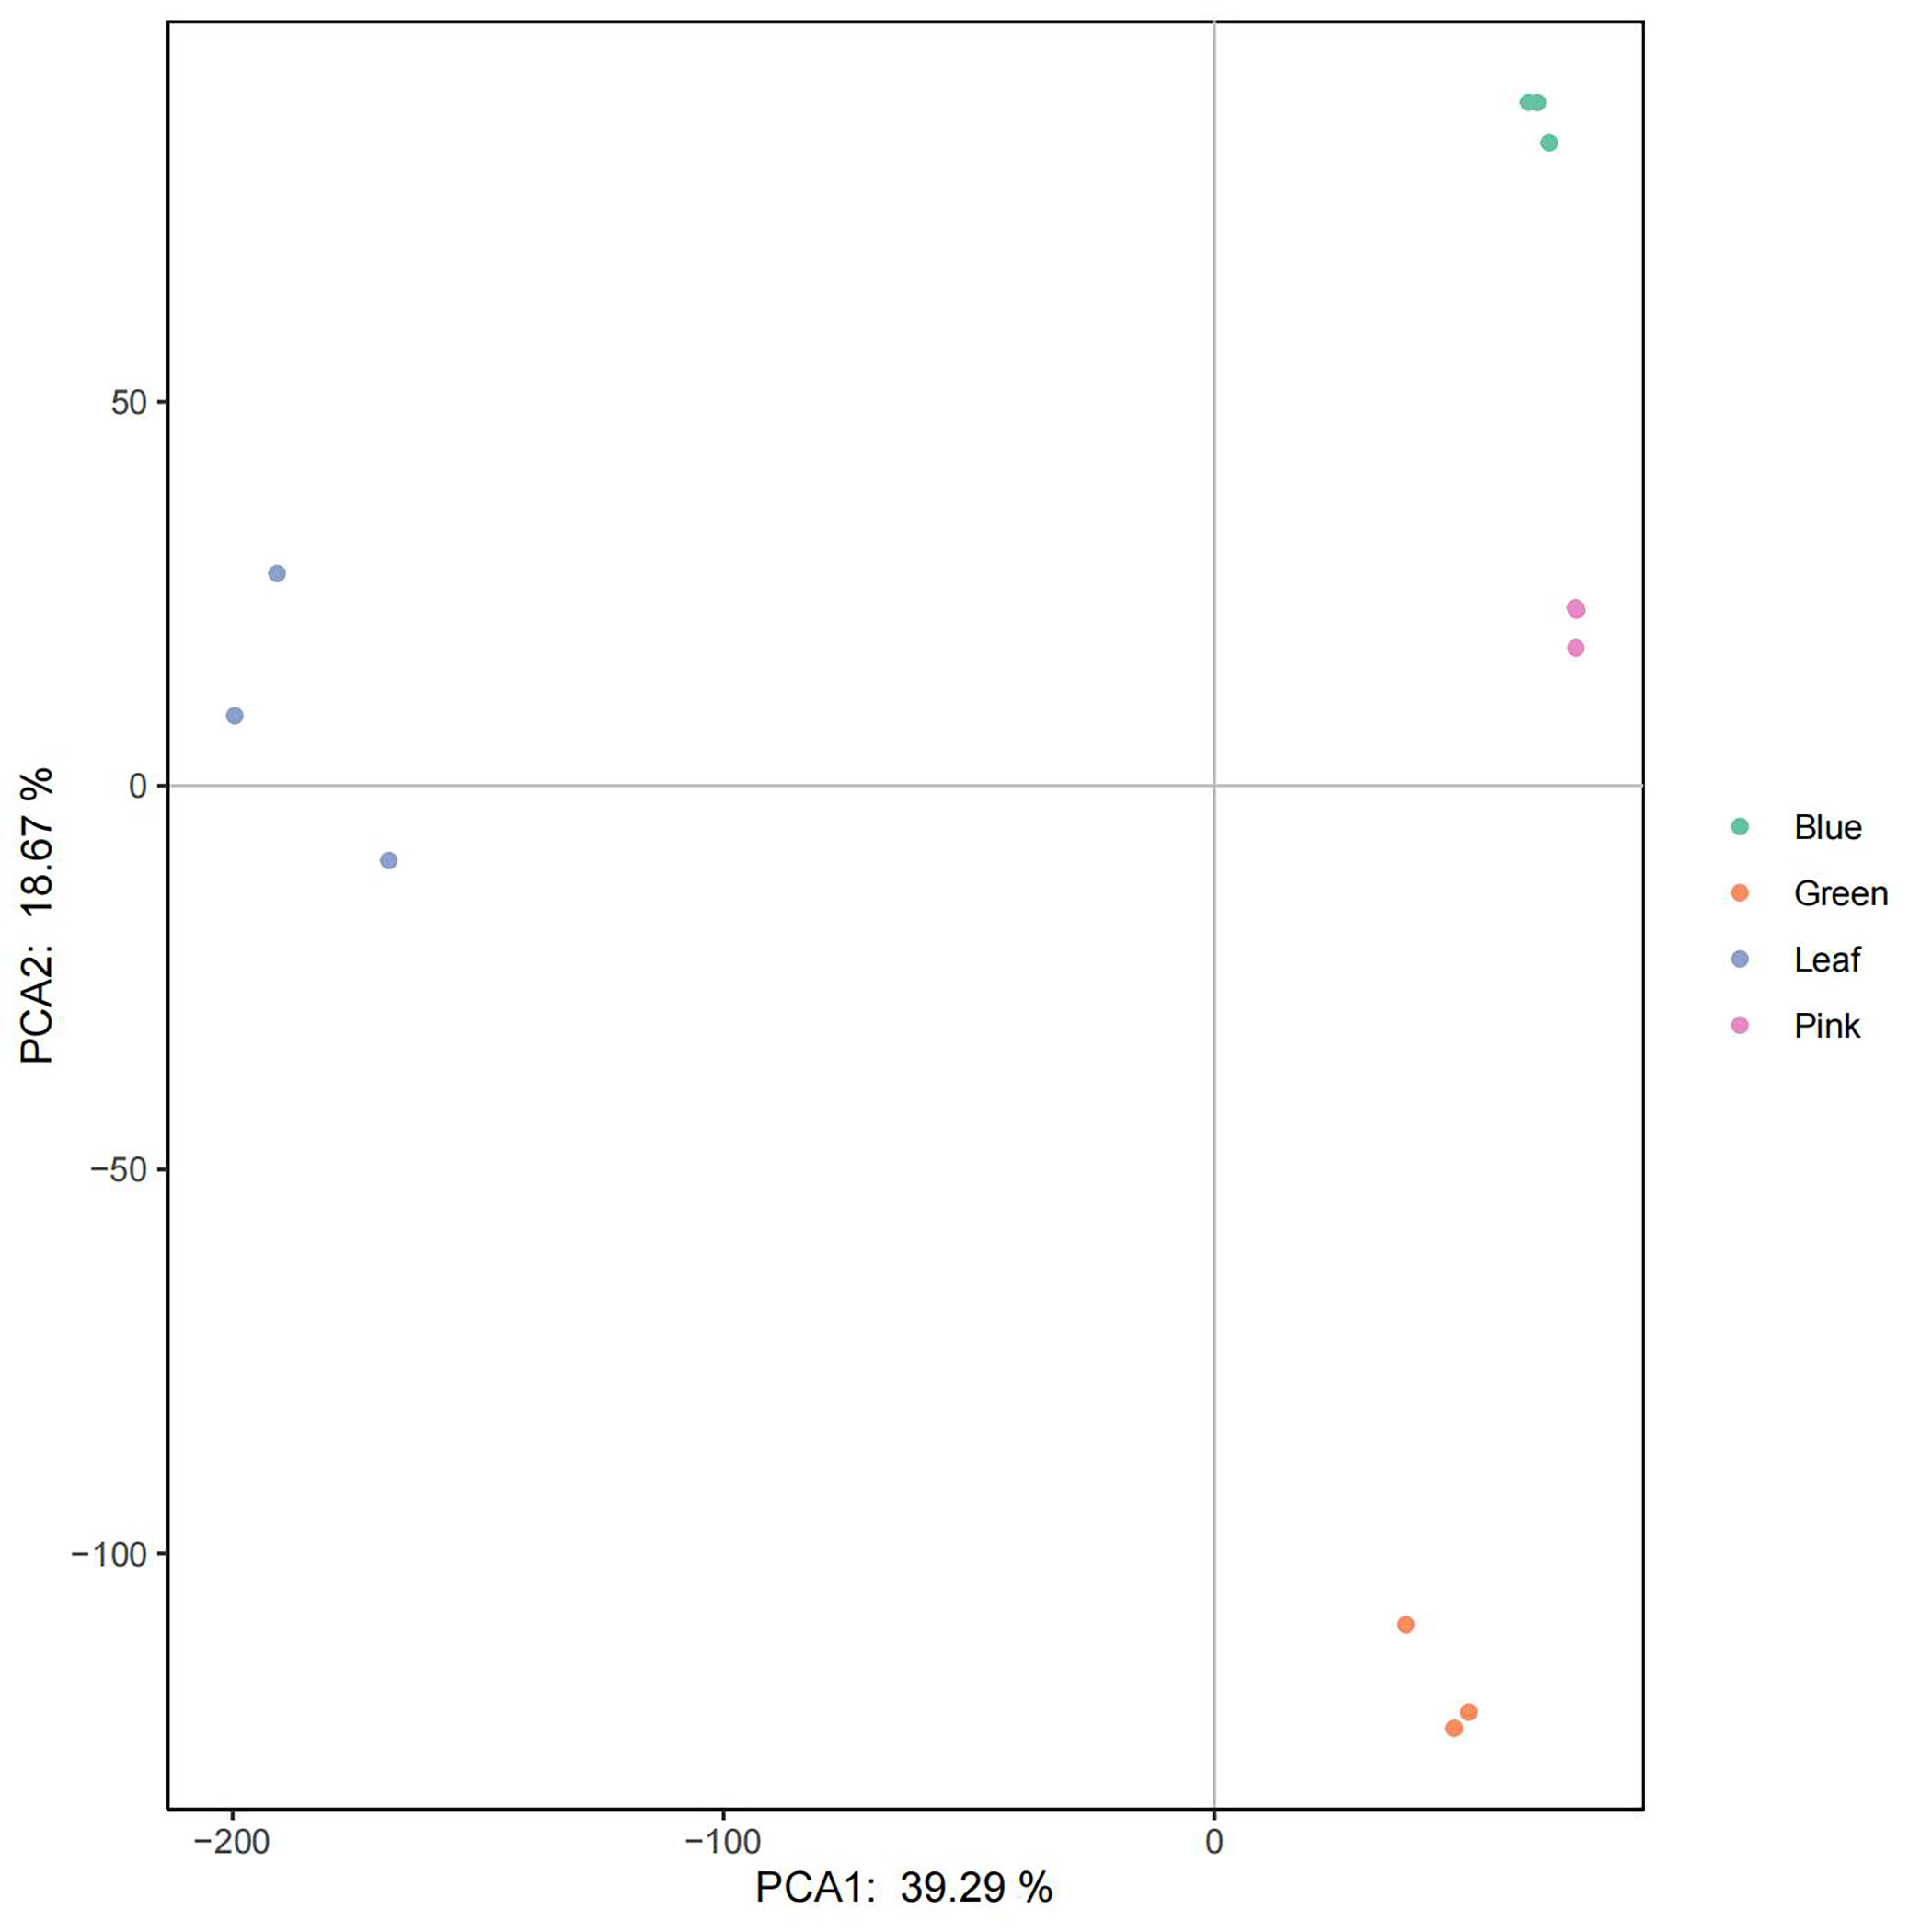
Transcriptomes from different tissues, including leaf, green fruit, pink fruit, and blue fruit, were mapped to the assembled genome. The transcripts among the various tissue samples were studied using principal component analysis (PCA), and expression was based on fragments per kilobase of transcript per million mapped reads (FPKM). Samples were grouped using data for all 39,867 transcripts analyzed by the Cufflinks tool. Our PCA analysis indicated that PCA1 (39.29%) and PCA2 (18.67%) best described the sources of variance among the different samples (Supplementary Fig. S9). Generally, replicate samples belonging to a given developmental stage clustered more closely together than did replicate samples belonging to different developmental stages (Supplementary Fig. S9).
The DEGs were filtered using the cuffdiff tool with a false discovery rate (FDR) < 0.05. Ultimately, we obtained 5,508 DEGs from green fruit to pink fruit consisting of 2,857 down-regulated genes in the pink fruit and 2,651 up-regulated genes. The number of DEGs in the comparison between blue fruit and pink fruit was 4,563, including 2,315 down-regulated in the blue fruit and 2,248 up-regulated genes (Supplementary Fig. S10).
To explore the DEGs between the early stages (from green to pink fruit) and the late stages of fruit development (from pink to blue fruit), GO term enrichment analysis was performed (Supplementary Fig. S11). GO analysis found that many of the DEGs were involved in the 'oxidation-reduction process' in the biological process category. Eleven genes belonged to this term, including the flavonoid biosynthesis genes dihydroflavonol 4-reductase (DFR), flavonoid 3′,5′-hydroxylase (F3'5'H), flavonol synthase (FLS), flavanone 3-hydroxylase (F3H), cinnamic acid 4-hydroxylase (C4H), and anthocyanidin reductase (ANR). Many DEGs detected were involved in the 'integral component of membrane' term in the cellular component category, including DFR, F3'5'H, CHS, flavanone 3′-monooxygenase (F3'H), and C4H. The term 'flavonoid biosynthetic process' was enriched in the late stage, but not in the early stage.
The expression of genes CHS, C4H, and F3'5'H increased from the green fruit stage to the blue fruit stage, whereas that of genes FLS and ANR decreased. Expression of most of the flavonoid biosynthesis-related genes was downregulated in the comparison of green fruit vs. leaf, except for ANR and FLS; the expression of these genes was also higher in pink fruit but lower in blue fruits (Fig. 8).
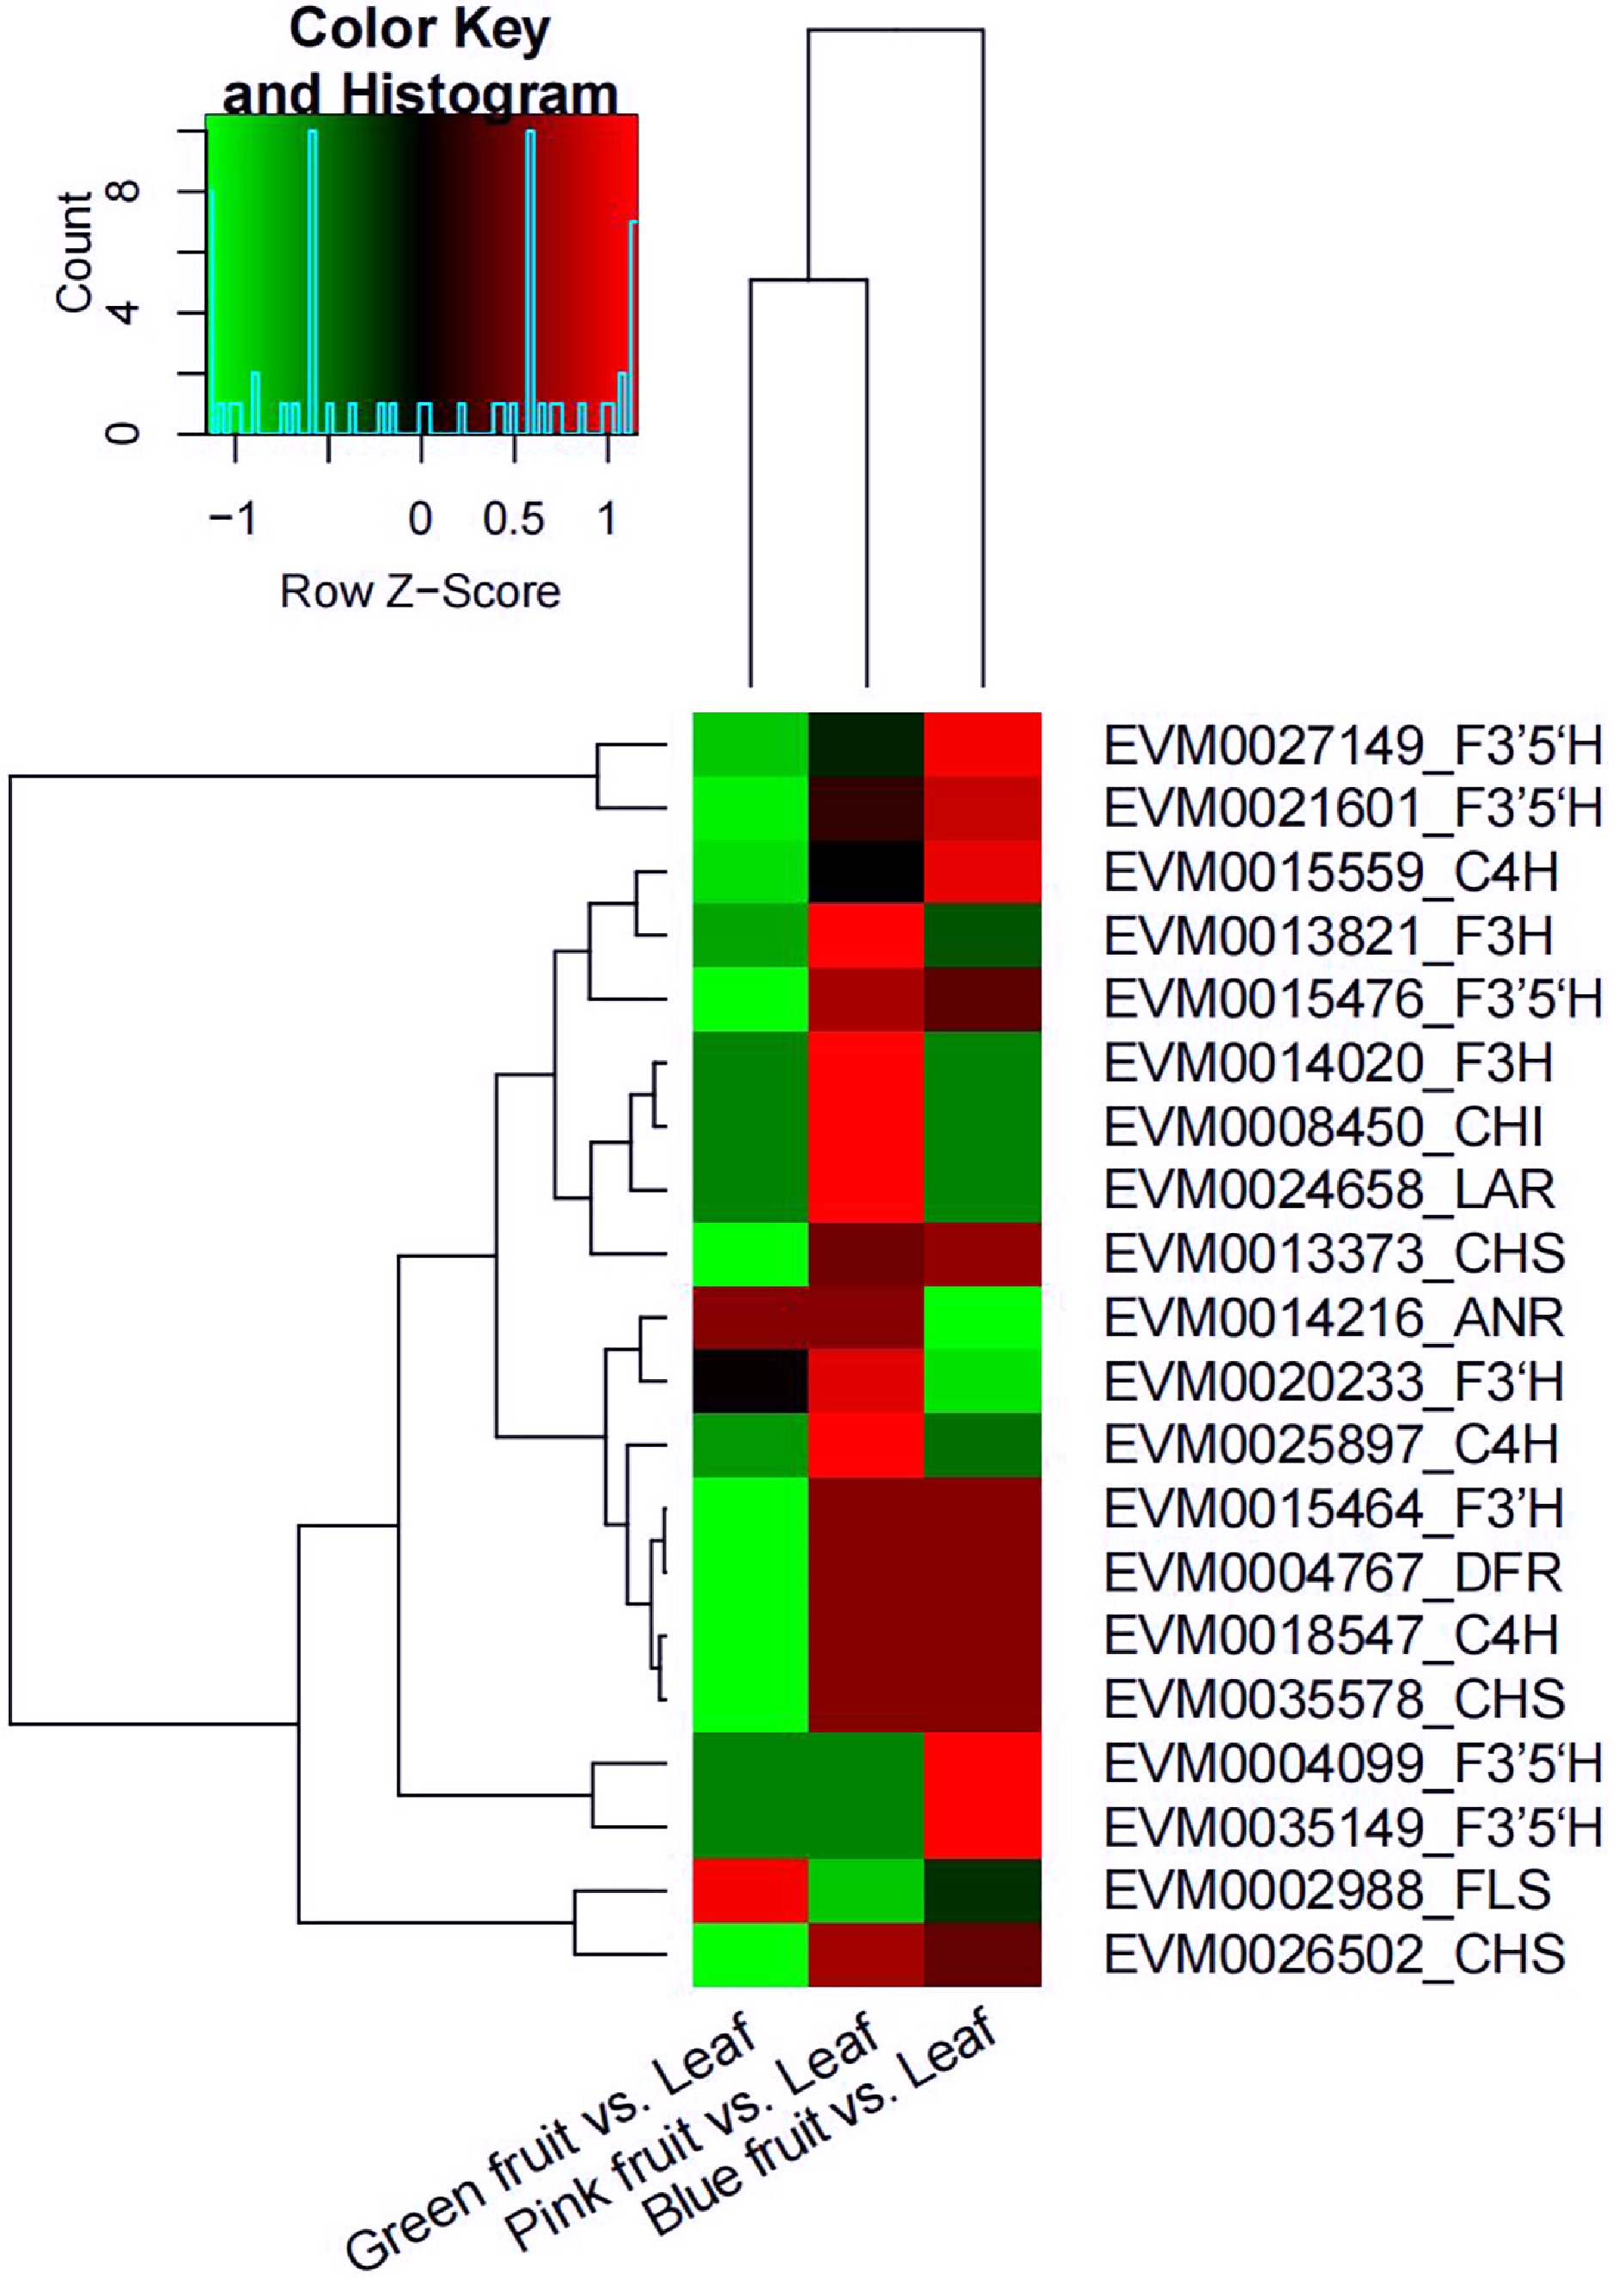
Figure 8.
Heat map diagram of the expression of differently expressed genes (DEGs) related to flavonoid biosynthesis in the comparisons of green fruit vs. leaf, pink fruit vs. leaf, and blue fruit vs. leaf. Green represents downregulated and red represents upregulated. anthocyanidin reductase (ANR); cinnamic acid 4-hydroxylase (C4H); chalcone isomerase (CHI); chalcone synthase (CHS); dihydroflavonol 4-reductase (DFR); flavonoid 3'-hydroxylase (F3’H); flavonoid 3',5’-hydroxylase (F3’5’H); flavanone 3-hydroxylase (F3H); flavonol synthase (FLS); leucoanthocyanidin reductase (LAR).
-
V. bracteatum is a member of the Ericaceae and is a typical diploid plant, with 12 different chromosomes and a very small genome[12]. In the current study, we report the first de novo assembly of the V. bracteatum genome, through a combination of ONT long-read and Illumina HiSeq short-read sequencing technologies. Due to the complexity of the blueberry genetic diversity, there are many difficulties in the study of blueberry biological characteristics, especially its genome[13,14]. For example, a draft genome for a wild diploid species V. corymbosum (2n = 2x =24) of blueberry was previously assembled consisting of a large number of scaffolds (total of 13,757; N50 of ~145 kb), a high percentage of gaps (~27.35%) in a ~393.16 Mb assembly[15]. The first chromosome-scale genome assembly of the tetraploid highbush blueberry (V. corymbosum cv. Draper) (2n = 4x = 48) consisted of 48 pseudomolecules with ~1.68 Gb of assembled sequences[16]. V. darrowii Camp (2n = 2x = 24) of blueberry is scaffolded into 24 chromosomes with ~1.06 Gb[17]. The genome of V. bracteatum is very small and the diploid may be easier to be homozygous when comparing to multiploidy, so that obtaining the whole-genome information for V. bracteatum for molecular biology research could provide guidance and reference for the larger and more complex genome of the cultivated blueberry.
Based on the whole-genome sequencing data, comparative genomic analysis was performed between V. bracteatum and six other related plant species. Similar comparative genomics analysis studies have been reported for other plant species. For example, compared with the ratio of gene expansion to contraction in sweet orange (0.6) and longan (0.4), the ratio in the mango genome was 4.5[18]. The highest ratio (expansion of 336 vs. contraction of 9 gene families) among the seven species studied was in the V. bracteatum genome, reflecting a relatively recent occurrence of the WGD event in the V. bracteatum genome.
PANTHER annotation results showed that the MYB gene family (OG0000036), F-box gene family (OG0000011) and the LRR receptor-like serine/threonine protein kinase gene family (OG0000010) belonged to a large extended gene family (Supplementary Table S12). GO and KEGG analysis of the expanded gene family showed that the gene family associated with oxidoreductase (GO) and flavonoid synthesis-related enzyme (KEGG) activities showed strong gene expansion in V. bracteatum (Supplementary Table S8). These results were in agreement with an earlier investigation in blueberry, where several genes encoding key biosynthetic steps in many antioxidant pathways were enriched with tandem gene duplications, and expanded gene families were involved in the biosynthesis of anthocyanins. Compared with the six other plant species, 298 positively selected genes were identified in the current study in V. bracteatum (Supplementary Table S13). These positively selected, expanded genes offered valuable insights into the formation of phenotypic characteristics and evolution of V. bracteatum.
A previous study had demonstrated that Rhododendron and Vaccinium represent species-rich genera within the Ericaceae, which had diverged from one another ~77 Mya[19]. Compared with R. delavayi and R. williamsianum, collinearity analysis in the present study showed few scattered points in the V. bracteatum/R. williamsianum comparison in a scatter diagram, suggesting a close relationship between these latter two species. The evolutionary analysis suggested that V. bracteatum and the other two species, R. delavayi and R. williamsianum, may have diverged ~13-85 Mya (Figs 3a & 4). Previous evidence had shown that the two shared WGDs represented by similar Ks values in the Rhododendron and Vaccinium genomes represent two ancient shared WGDs, originating from a common ancestor of the Ericaceae, which can be traced back to a common ancestor of the Ericales[20]. In our current study, the low Ks value of 0.67 found in V. bracteatum, compared with F. vesca and R. occidentalis, suggested that the divergence of V. bracteatum occurred later than for the other two species (Fig. 3c). The genomic data from the current study will provide valuable reference material for understanding the expression and regulation of important agronomic traits in V. bracteatum and related species.
Flavonoid-related genes were located on the genome of V. bracteatum. These genes did not cluster together, indicating that V. bracteatum may have undergone several WGD events. Chalcone synthase (CHS) is a key enzyme in the flavonoid biosynthesis pathway, and eight genes encoding CHS were detected in the V. bracteatum genome, more than was reported from any of the other six species. Nine genes encoding F3'5'H were detected in the V. bracteatum genome. FLS is an important enzyme necessary for flavonol biosynthesis, and seven FLS genes were detected in the V. bracteatum genome. The up-regulated expression of many structural genes involved in flavonoid biosynthesis during fruit ripening suggested that flavonoids play an important role during fruit development.
Compared with unripe, green fruit, some MYB transcription factor genes exhibited greater transcript abundance in developing pink and blue fruits, indicating that these genes may be involved in controlling pathways of flavonoid biosynthesis during V. bracteatum fruit maturation. MYB110, MYB108, and MYB44 were particularly highly expressed during fruit development, which indicated that these genes may play an important role in regulating flavonoid biosynthesis during fruit maturation. In kiwifruit[21], the lack of MYB110 expression is responsible for the total absence of anthocyanins in the fruits, as MYB110 promotes the transcription of the F3'H and F3'5'H genes. MYB108 is involved in regulating various biosynthetic pathways in different plant species. In Rosa multiflora, MYB108 expression was induced by chilling stress[22], and MYB108 expression was required for jasmonic acid-mediated stamen and pollen maturation in Arabidopsis[23], while overexpression of MYB108 in Arabidopsis thaliana conferred improved tolerance to the Verticillium dahlia infection[24]. On the other hand, MYB44 acts as a repressor of anthocyanin biosynthesis in sweet potato[25], suggesting that MYB44 may have multiple functions in plants. MYB10 and MYB_3 were downregulated in V. bracteatum during fruit development, which indicated that these genes may inhibit the biosynthesis of anthocyanins. On the other hand, MYB10 expression increased during the biosynthesis of anthocyanidins in apple[26].
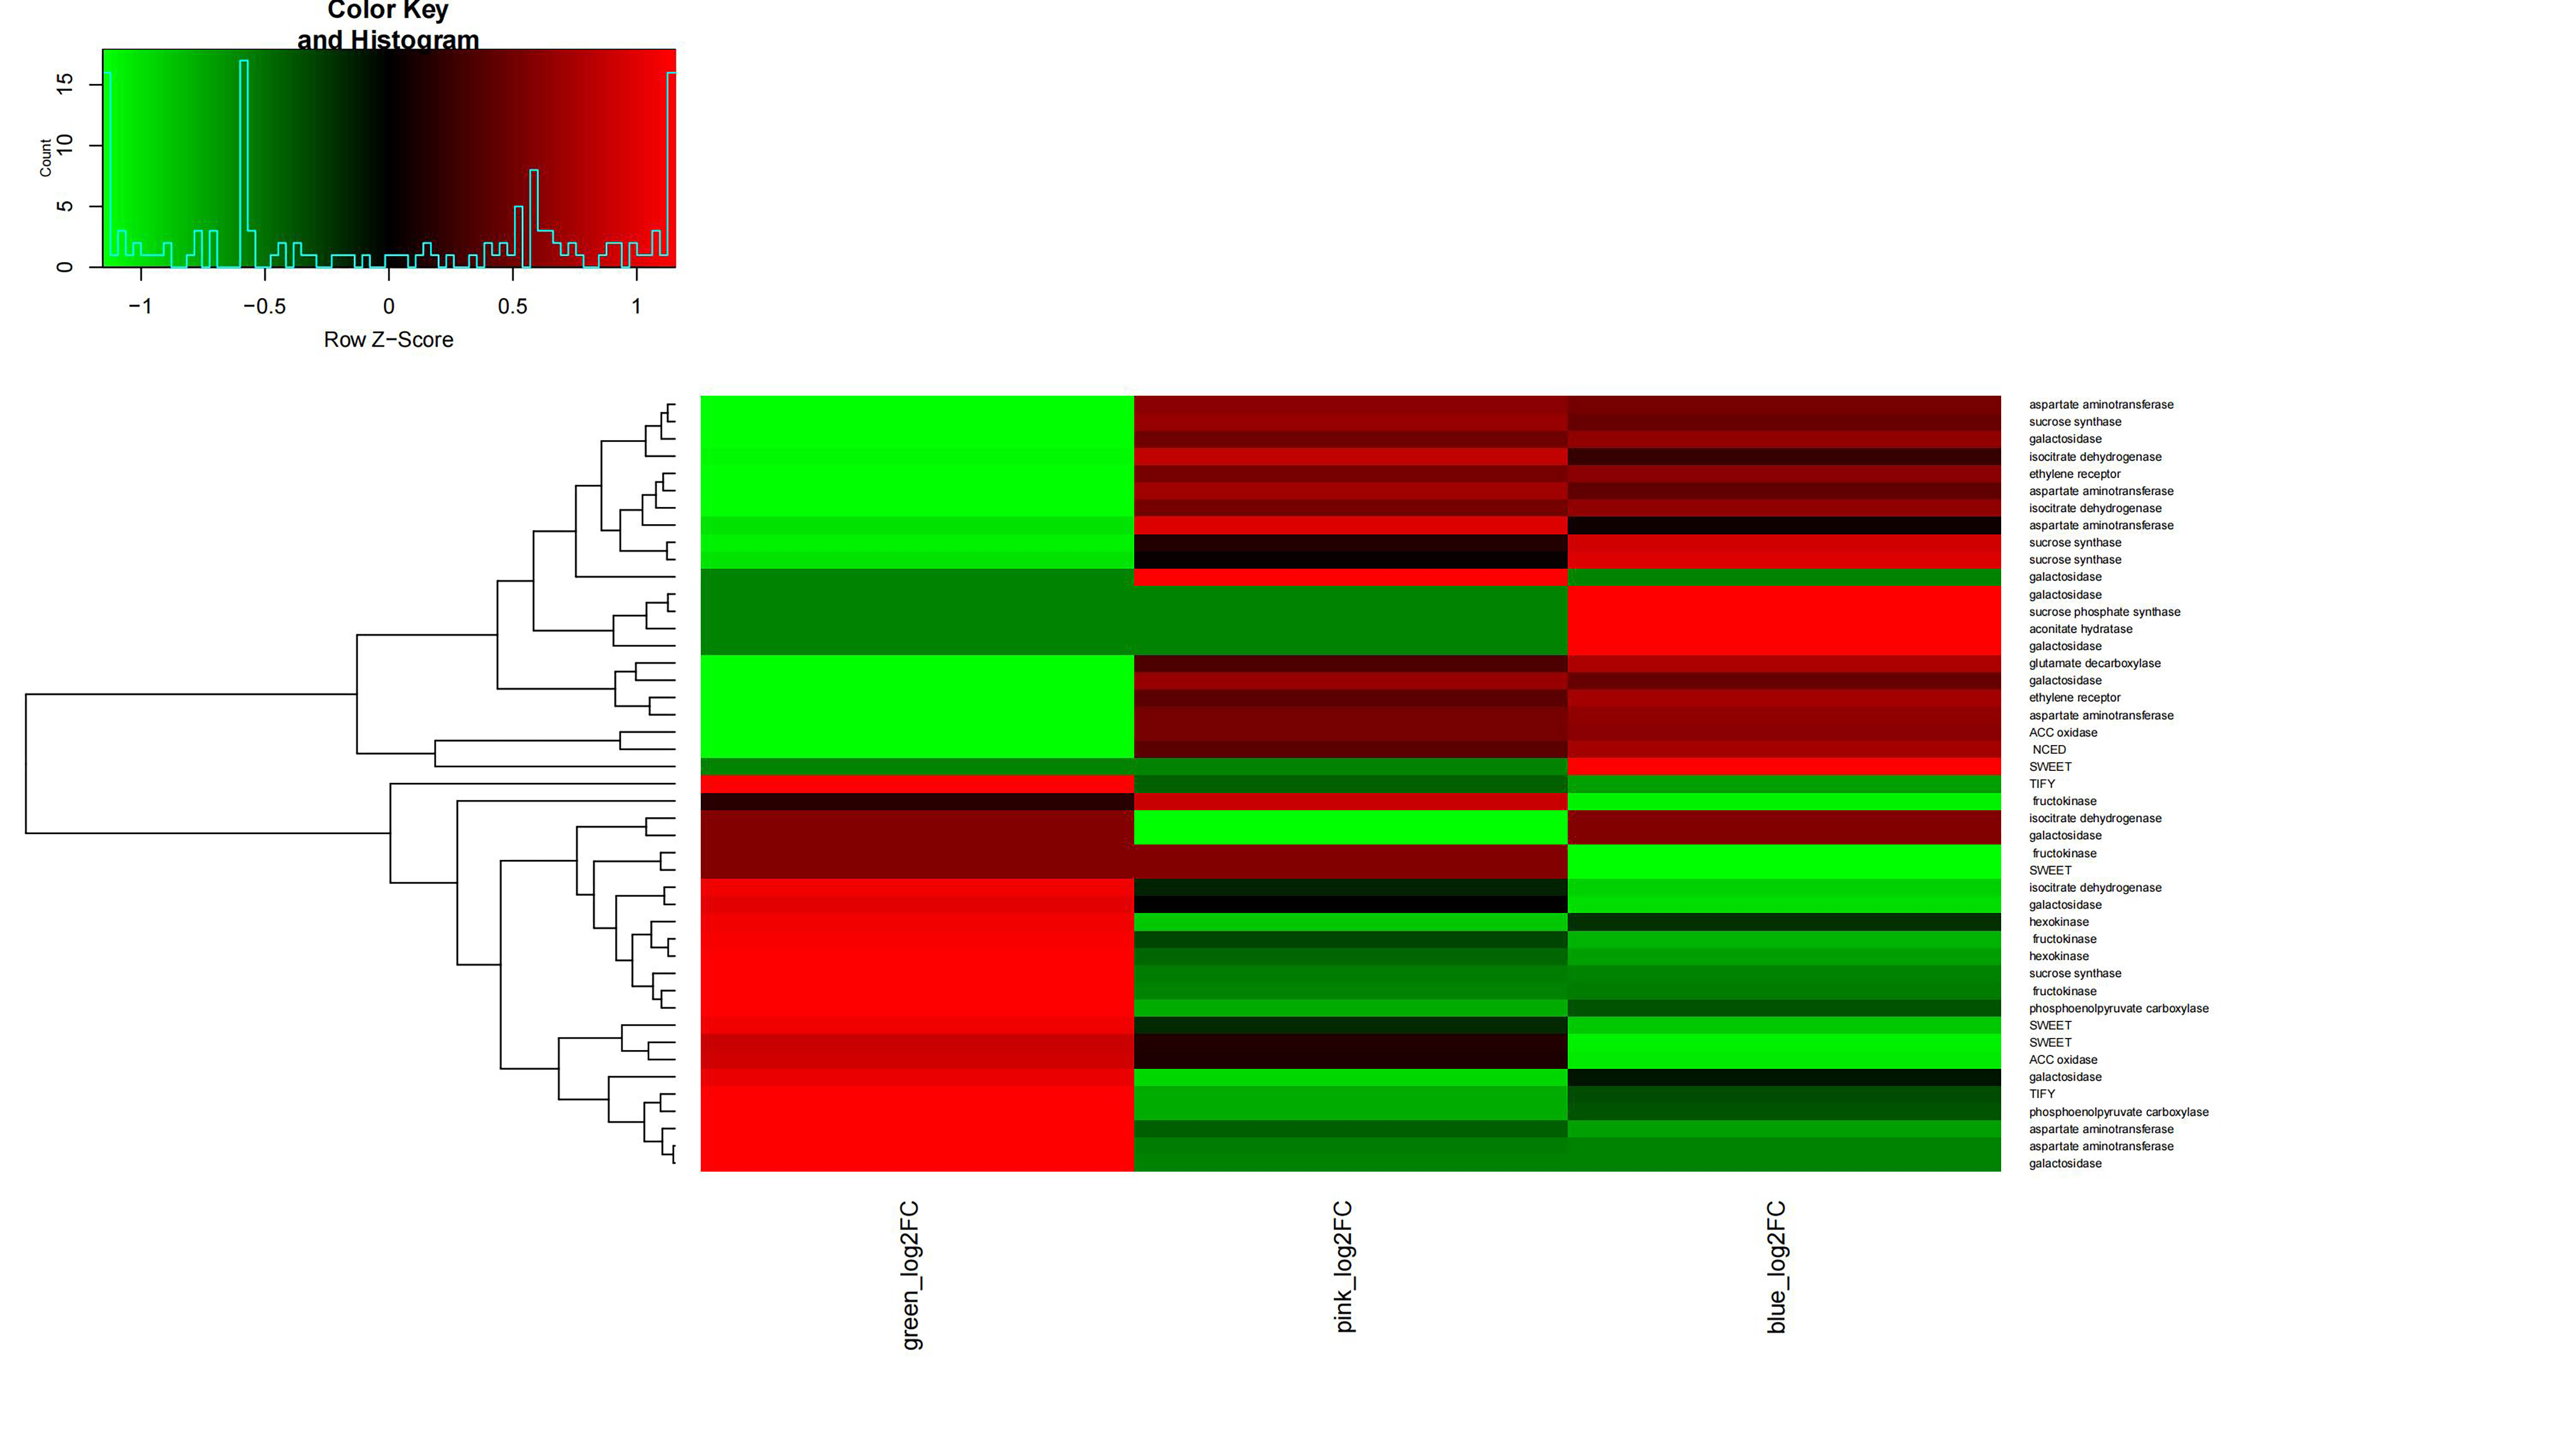
Differential expression patterns of sucrose synthase genes during V. bracteatum fruit development indicated that they may play various roles in fruit development. Sugar transporters have been proved to regulate intercellular sugar transport in the phloem to ripening fruit. In the current study, expression of three of the AST (encoding aspartate aminotransferase) homologs increased during the early stage of V. bracteatum fruit development, with no significant change being observed during the late stage. The expression of PEPC (encoding phosphoenolpyruvate carboxylase 4) was downregulated during the early stage of fruit development, a finding which was consistent with the results from a previous study[27]. We found that expression of IDH (encoding isocitrate dehydrogenase) was upregulated early in fruit development, whereas that of GDH (encoding glutamate dehydrogenase) was upregulated at the late stage. It seemed that most of the genes related to high fruit acidity were highly expressed early in fruit development in V. bracteatum, whereas the genes related to fruit sugar levels were highly expressed late in fruit development (Supplementary Fig. S12).
The genes associated with ethylene biosynthesis or signaling were highly expressed in the early stage rather than the late stage of fruit development. Two ACC oxidase and one ethylene receptor (ETR) genes were upregulated at the early stage. Ethylene has been reported to negatively regulate anthocyanin content[28]. The expression of NCED5 (encoding 9-cis-epoxycarotenoid dioxygenase 5) was upregulated in both the early and late stages of fruit development. NCEDs catalyze the first step of abscisic acid (ABA) biosynthesis from carotenoids. High expression of NCEDs was found in purple-skinned apple compared with non-purple fruit[29]. The expression of ethylene- or ABA-related genes indicated that the increasing content of anthocyanin during fruit maturation may be related to the regulation of phytohormone concentrations.
Hormones affect fruit development not only by the interaction between different hormones but also by the interaction between the hormone and sugars. For example, ABA, the auxin indole-3-acetic acid (IAA), and ethylene work together to regulate the development of blueberry fruit, while gibberellins (GA) and IAA can promote the absorption of sugar at the early stage of fruit development[30], whereas ABA and ethylene enhance it at the late stage. In our current study, ABA and ethylene may also increase the anthocyanin content. The blueberry color change during ripening is caused by changes in the anthocyanin content. The expression of some flavonoid biosynthesis structural genes such as phenylalanine ammonia-lyase (PAL), CHS, CHI, F3H, and F3'H, as well that of some transcription factor genes[31], increased during fruit development[32]. These results were in agreement with the findings of our own research.
In conclusion, we present here a chromosome-level genome sequence of the wild blueberry species V. bracteatum. This first genome assembly from wild blueberry is expected to advance our understanding of the evolutionary history of blueberry and of the gene expression changes which occur during fruit development. The genome sequence will provide fundamental genomic resources for blueberry improvement. Our phylogenetic analysis of MYB transcriptional factors in wild blueberry has already led to the discovery of several novel MYBs, as well as providing evidence to suggest that MYB110, MYB108, and MYB44 may play an important role in fruit maturation. From the transcriptome, levels of CHS, C4H, F3'5'H, sucrose synthases, sugar transporters, ACC oxidase, and ETR were shown to increase at the late stage of fruit development. In this way, the V. bracteatum genome will serve as an important resource for the development of genomics-assisted selection to achieve blueberry improvement, particularly for traits related to the efficiency of flavonoid production and with stress tolerance.
-
Young leaves of V. bracteatum were collected on 15 April 2019 in the low mountain and hill region of southern Anhui Province, China (30°51' N, 118°23' E) for genome sequencing, and were immediately frozen in liquid nitrogen and stored at −80 °C until DNA and RNA were extracted. The fruits were manually picked at three developmental stages: the expansion phase with green fruit (Stage 1), the color accumulation phase with pink-red fruit (Stage 2), and the ripening phase with blue fruit (Stage 3). Three biological replicates were conducted for each stage, with 10 representative fruits being sampled for each replicate at each stage. Fruit samples were frozen with liquid nitrogen, then stored at −80 °C until RNA was extracted. The RNA samples were used for transcriptome-based gene prediction.
Genome size estimation of V. bracteatum
-
From young leaves, total genomic DNA was extracted according to the CTAB protocol[33]. After that, the genomic DNA was randomly disrupted into 350 bp length. Through the steps of terminal repair, the addition of A adaptors and linkers, target fragment selection and PCR amplification, a small-fragment sequencing library was established. Subsequently, the library was quality inspected and chip fixed, and then subjected to PE 150 (paired-end 150-bp) sequencing using the Illumina HiSeq sequencer (Illumina, San Diego, CA, USA). Sequence data were characterized and filtered to obtain clean reads, which were used for genome size evaluation, genome assembly, GC content statistics, heterozygosity rate statistics, and post genome assembly assessment. K-mer is an oligonucleotide sequence of length k extracted from the sliding windows of sequencing data. Under the premise of a uniform distribution of sequencing reads, the following formula is as follow: Genomic size = total number of bases/average sequencing depth = total K-mer/median K-mer depth[34,35]. To evaluate genome size, heterozygosity and the repeat sequence ratio, the distribution map of K-mers (K = 19) was constructed based on the 350-bp library data.
Nanopore sequencing and Hi-C assisted genome assembly
-
The processes of sample quality detection, library construction, quality detection and sequencing were performed here according to the manufacturer's instructions (Oxford Nanopore Technologies, ONT, Canada). Clean data of Nanopore's third-generation sequencing were corrected with the software of Canu[36], and then assembled with Wtdbg2 software based on the corrected data. After that, the third-generation sequencing data were used for three rounds of correction through Racon software[37], and then the second-generation data is used for three rounds of correction through Pilon software[38].
Hi-C technology is used to assist genome assembly. Genomic DNA from the fresh leaves of V. bracteatum was prepared and in situ Hi-C was used for Hi-C library construction and sequencing, mainly including cell cross-linking, endonuclease digestion, terminal repair, cyclization, DNA purification and capture, and computer sequencing through the Illumina platform with reading length of PE150[39,40].
After sequencing, quality control, and Hi-C library quality evaluation, Hi-C-assisted genome assembly was carried out. The separation into groups, sequencing, and orientation of genomic sequences are carried out by using LACHESIS software, and the assembly results were evaluated[41].
Evaluation of genome assembly quality
-
The evaluation of assembly results includes three aspects: the ratio to the Illumine sequencing reads, core gene integrity and BUSCO evaluation. First, BWA software was used for reading comparison rate of second generation sequencing[42]. It compares the short sequences obtained from the Illumina HiSeq sequencing platform with the reference genome. By statistical comparison rate, the integrity of the assembled genome can be evaluated. Second, CEGMA v2.5 database contains 458 conserved core genes in eukaryotes, which can be used to evaluate the integrity of the final genome assembly[43]. Third, the database of BUSCO V5.0 was performed to evaluate the integrity of the genome assembly, the parameter of BUSCO was –evalue 1e-05 (E-value cutoff for BLAST searches)[44].
Genome annotation
-
Genome annotation analysis included repeat sequence annotation, coding gene prediction, non-coding RNA prediction, pseudogene annotation, and gene function annotation. For repeat sequence annotation, LTR_ FINDER and RepeatScout software were used to construct the repeat sequence database of the V. bracteatum genome based on the principle of structural prediction and de novo prediction[45,46]. PASTEClassifier was used for classifying all isolated sequences which later mapped to the Repbase database using RepeatMasker software[47−49].
Homologous proteins from four plant genomes (Arabidopsis thaliana, Oryza sativa ssp. japonica, Rhododendron_delavayi, and V._corymbosum) were downloaded from the Ensembl and NCBI databases. EVM v1.1.1 was used to integrate the predicted results. For non-coding RNA (ncRNA) prediction, different strategies have been adopted to predict the structural characteristics of different ncRNAs. Based on the Rfam database, the whole genome alignment was carried out with BLASTN to identify micro RNAs (miRNAs) and ribosomal RNA (rRNA). tRNAscan-SE was used to identify tRNA[50]. For pseudogene annotation, the predicted protein sequences were aligned by GenBLASTA software to find homologous gene sequences in the genome[51,52], and then GeneWise software was used to find immature termination codons and frameshift mutations in gene sequences, which could generate pseudogenes[53]. For gene function annotation, the predicted gene sequences were compared with the selected GO function database with BLAST v2.2.31 (-evalue 1e-5), in order to annotate and analyze the gene function[54,55].
Gene family cluster analysis
-
The protein sequences of V. bracteatum and the six related species (R. occidentalis, R. williamsianum, R. delavayi, F. vesca, V. vinifera, and S. lycopersicum) were used for gene family clustering. Orthofinder v2.4 software was used to classify the protein sequences of the above- mentioned seven species[56], and the PANTHER v15 database was used to annotate the gene families obtained[57]. Finally, GO and KEGG enrichment analyses were carried out for the unique gene families of V. bracteatum .
Phylogenetic tree construction and divergence time estimation
-
The phylogenetic tree was constructed from single-copy gene sequences using IQ-TREE v1.6.11 software[58]. Specifically, each single-copy gene family sequence was compared using MAFFT v7.205[59], and then Gblocks v0.91b was used to remove those regions with poor sequence alignment or large differences[60]. Finally, all the well-aligned gene family sequences of each species (V. bracteatum, R. occidentalis, R. williamsianum, R. delavayi, F. vesca, V. vinifera, and S. lycopersicum) were connected end-to-end to obtain a supergene, and then the model detection tool ModelFinder, provided by IQ-TREE, was used for model detection to obtain the best model, JTT + F + I + G4, which was used for constructing the phylogenetic tree (using the maximum likelihood (ML) method, and 1000 bootstrap replicates)[61].
Grape (V. vinifera) was designated as the outlier group of the phylogenetic tree. The MCMCTREE program of the software PAML v4.9i was applied to estimate the divergence time[62]. In detail, the fossil time of R. williamsianum vs. R. delavayi (6.3−9.7 Mya), V. vinifera vs. R. williamsianum (111−131 Mya), and R. occidentalis vs. F. vesca (26−60 Mya) were obtained from the Timetree website (
www.timetree.org ), which was used to correct the fossil age obtained by the software, based on an algorithm. Then, the two parameters of 'gradient' and 'Hessian' required for divergence time estimation were obtained by the mcmctree ctl file in the PAML package. Finally, the ML method was used to estimate the divergence time by the correlated molecular clock and JC69 model, and two replicate calculations were carried out to assess for consistency.Gene family expansion and contraction analysis
-
Combining the results of the phylogenetic tree with those from divergence time and gene family clustering analysis, the number of gene family members of the ancestor of each branch was estimated through the birth–mortality model by the CAFE v4.2 software, so as to predict the contraction and expansion of the gene family relative to the ancestor[63]. The criteria for defining whether there was significant expansion or contraction was that the family-wide P-values and viterbi P-values were less than 0.05. For the extracted expansion and contraction of the gene families of V. bracteatum, PANTHER annotation was carried out first, and then GO and KEGG enrichment analysis was carried out using clusterProfile software.
Positively selected gene analysis
-
The CODEML model in the PAML package is mainly used for positive selection analysis. The single-copy gene families among V. vinifera, R. delavayi, R. williamsianum, V. bracteatum, S. lycopersicum, F. vesca and R. occidentalis were obtained, and then the protein sequences of each gene family were aligned by MAFFT (parameter: -- localpair -- maxiterate 1,000 input_file). The sequences were reversed into codon alignment sequences by PAL2NAL. Finally, CodeML was used (F3 × 4 model of codon frequencies), based on the Branch-site model, Model A (assuming ω > 1) and the null model (no site is allowed with ω > 1), with likelihood ratio tests (LRTs) being performed by the 'chi2' program under the PAML package, and significant differences were identified (P value < 0.05)[64]. Then, the Bayesian empirical Bayes method (BEB) was used to obtain the a posteriori probability of the positive selection site (usually greater than 0.95, which is considered to be the significant positive selection site), and finally the significant positively selected genes were identified. The positively selected genes were then subjected to GO and KEGG functional annotation.
Whole-genome duplication and chromosome evolution analysis
-
Whole-genome duplication (WGD) is a process of genome duplication. We chose the Ks method with the wgd v1.1.1 software[65]. In the study of functional genomics, it is generally believed that collinear genes tend to have the same biological functions. In order to analyze the chromosomal collinearity between V. bracteatum and other related species (R. occidentalis, R. williamsianum, and F. vesca), the gene sequences of pairs of species were compared with diamond v0.9.29.130 software to determine similar gene pairs (e < 1E-5, C score > 0.5, in which the C score value was filtered by JCVI software)[66]. Then, using the gff3 file, the adjacent location on the chromosome of similar gene pairs was identified. This process was mainly carried out through MCScanx (parameter-m 15)[67], until all the genes in the collinear blocks could be obtained. The linear graph patterns and dot matrix forms of the collinearity relationship of each species were drawn by JCVI v0.9.13 and VGSC software, respectively[68,69].
RNA-Seq and data analysis
-
Total RNA was extracted from the 12 samples, namely leaf, green fruit, pink fruit, and blue fruit, which each tissue having three replicates. All the samples using the mirVana miRNA Isolation Kit (Ambion) following the manufacturer's protocol. Sequencing libraries were generated using NEBNext UltraTM RNA Library Prep Kit for Illumina (New England Biolabs, Ipswich, MA, USA) following the manufacturer's instructions, and index codes were added to attribute sequences to each sample. The clustering of the index-coded samples was performed on a cBot Cluster Generation System, using TruSeq PE Cluster Kit v4-cBot-HS (Illumina) according to the manufacturer's instructions. After cluster generation, the library preparations were sequenced on an Illumina platform and paired-end reads were generated at BIOMARKER (Beijing, China).
Data availability
-
Sequencing data used in this study are available in the NCBI Sequence Read Archive (SRA) database under the following accession numbers: BioProject PRJNA794927 (genomic data of native Chinese wild blueberry and RNA-Seq data derived from four different tissues).
This work was supported by Anhui Provincial Natural Science Foundation (2008085QC129 and 2008085MC77), the 17th Huo Yingdong Education Fund Project (171022) and and Key Research and Development Program in Anhui Province (202204c06020029).
-
The authors declare that they have no conflict of interest.
- Supplementary Table S1 Sequencing data used for genome assembly and annotation of V. bracteatum.
- Supplementary Table S2 Raw data and clean data statistics.
- Supplementary Table S3 Genome completeness evaluation based on Reads alignment, CEGs and BUSCOs.
- Supplementary Table S4 Statistics of Hi-C assembly data.
- Supplementary Table S5 Statistics of repeat sequences.
- Supplementary Table S6 Statistical results of coding gene quantity prediction based on Ab initio, Homology-based and RNA-Seq.
- Supplementary Table S7 Prediction results of coding genes after EVM integration.
- Supplementary Table S8 Noncoding RNA statistics and pseudogene prediction.
- Supplementary Table S9 Gene function annotation statistics.
- Supplementary Table S10 Gene family clustering statistical information of V. bracteatum and other six species.
- Supplementary Table S11 Enrichment analysis of the gene family of Vaccinium bracteatum.
- Supplementary Table S12 Annotation of expansion and contraction gene families among seven species.
- Supplementary Table S13 A total of 298 candidate genes with positive selection in Vaccinium bracteatum.
- Supplementary Table S14 Annotation of positively selected genes in Vaccinium bracteatum.
- Supplementary Table S15 Number statistics of positively selected genes in terms by GO analysis.
- Supplementary Table S16 Annotation of positively selected genes with KEGG analysis.
- Supplementary Fig. S1 K-mer distribution map The k-mer analysis (k=19) of Vaccinium bracteatum genome characteristics.
- Supplementary Fig. S2 Interactive thermogram of Hi-C assembly chromosome Note: LG01-LG12 stands for Lachesis group 01-12; abscissa and ordinate represent the order of each bin on the corresponding chromosome group.
- Supplementary Fig. S3 Distribution of integrated genes derived from three prediction methods.
- Supplementary Figs S4 Statistical chart of functional annotation classification of KOG Note: abscissa is the content of each KOG classification, and the ordinate is the number of genes.
- Supplementary Figs S5 KEGG path annotation diagram.
- Supplementary Figs S6 GO secondary node annotation classification statistical chart Note: The left side of the ordinate is the percentage of gene number, and the right side is the number of genes.
- Supplementary Fig. S7 GO and KEGG enrichment analysis of Vaccinium bracteatum specific gene family.
- Supplementary Fig. S8 The Ks distribution map within and between species.
- Supplementary Fig. S9 Principle component analysis of 12 samples to assess data quality.
- Supplementary Fig. S10 Number of significantly downregulated (down) and upregulated (up) genes in the two comparisons.
- Supplementary Fig. S11 Gene ontology (GO) analysis of Differentially expressed genes (DEGs) in the comparisons of pink fruit vs. green fruit (a) , and blue fruit vs. pink fruit (b) .
- Supplementary Fig. S12 Heat map diagram of the expression of differently expressed genes (DEGs) related to carbohydrate metabolism in fruit at three stages.
- Copyright: 2022 by the author(s). Exclusive Licensee Maximum Academic Press, Fayetteville, GA. This article is an open access article distributed under Creative Commons Attribution License (CC BY 4.0), visit https://creativecommons.org/licenses/by/4.0/.
-
About this article
Cite this article
Yang L, Li M, Shen M, Bu S, Zhu B, et al. 2022. Chromosome-level genome assembly and annotation of the native Chinese wild blueberry Vaccinium bracteatum. Fruit Research 2:8 doi: 10.48130/FruRes-2022-0008 

Chromosome-level genome assembly and annotation of the native Chinese wild blueberry Vaccinium bracteatum
- Received: 26 December 2021
- Accepted: 04 May 2022
- Published online: 29 June 2022
Abstract: Vaccinium bracteatum Thunb., an important native Chinese wild blueberry species, is widely used as a rootstock and in blueberry cultivar breeding, as well as in traditional medicine and local food. We report here the genome sequence of V. bracteatum using a combination of Oxford Nanopore Technologies long-read and Illumina HiSeq short-read sequencing technologies to obtain 65.30 Gb of clean data, achieving 114.60-fold genome coverage. The assembled genome has a total sequence length of 569.81 Mb and consists of 36,756 predicted genes. Repetitive DNA sequences represent 57.78% of the genome sequence. Comparative genomic analysis revealed that a total of 336 gene families had expanded and that 298 candidate genes had undergone positive selection during evolution in V. bracteatum. The divergence of V. bracteatum from the related Rhododendron williamsianum and Rhododendron delavayi occurred ~13−85 million years ago. The genome sequence of V. bracteatum allowed us to identify some important genes associated with traits involved in fruit development, such as flavonoid biosynthesis, sugar and acid metabolism, MYB transcription factor gene expression, and hormone regulation. The differential expression patterns of genes encoding flavonoid biosynthesis enzymes and MYB transcription factors might explain the high flavonoid content of V. bracteatum. This chromosome-level genome assembly provides reference sequences for the identification and characterization of genes important in the improvement of blueberry and related research.
-
Key words:
- Blueberry /
- Comparative genomics /
- Genomics /
- Flavonoid biosynthesis