


-
Apples (Malus domestica) are one of the most ancient fruit crops with evidence of domestication dating back to more than 3,000 years[1]. As a main source of human nutrition, apples are now the world's third most valuable fruit crop worth
${\$} $ www.fao.org/faostat/en/#data/QV ). Flavour is an important trait that determines consumer acceptability and by extension, its marketability. However, due to intense selection for traits that enable mass production and worldwide distribution such as storability, firmness and post-harvest shelf-life, little attention has been given to fruit flavour, which directly impacts consumer satisfaction. The lagging of this selection for fruit flavour can be at least partially attributed to the challenges and high costs of breeding and phenotyping for flavour-related phenotypes[2].Traditional apple breeding is time-consuming and expensive: it takes more than two decades to properly evaluate a new apple variety before commercial release due to its long juvenile period[3]. For example, in a breeding programme spanning 26 years, 52,000 seedlings were originally planted, and only three of these were subsequently commercialized[4]. Therefore, apple varieties that perform well are clonally propagated, for decades or even centuries, and there is a slow rate of change in variety composition on supermarket shelves despite consumer demand for new varieties with novel traits[2].
The small number of elite varieties that dominate worldwide markets means that only a small fraction of the available genetic diversity in apples is being explored[5], and this makes them prone to evolving pests and pathogens[6]. To mitigate this, a wide array of agrochemicals are used to keep apples commercially viable. Indeed, a primary target for most apple breeding programmes worldwide is disease resistance. However, new apple varieties must not only require less chemical input to grow but must also contain desirable flavours that result in commercial success[7]. Marker-assisted selection (MAS) can significantly improve the efficiency of traditional apple breeding by enabling breeders to select offspring using genetic markers associated with desirable traits, and markers that predict disease resistance are commonly used by numerous breeding programs worldwide[8]. Selection for flavour using MAS lags far behind the selection for disease resistance, however. The reason for this is that flavour is more genetically complex than disease resistance: while resistance to a particular disease is frequently controlled by a single gene of large effect, flavour is controlled by numerous interacting genes and environmental variation. Genetic markers that predict apple flavour are highly desirable, and an opportunity exists to find them and use them to reduce the labour and costs associated with growing trees to maturity for flavour evaluation.
Human perception of flavour involves a complex interaction between taste receptors on the tongue and olfactory receptors located in the nose[9]. While the taste of an apple is heavily influenced by its sugars and acids, its aroma also plays a primary role in determining quality[10,11]. Apple aroma is a complex trait determined by the composition of volatile organic compounds (VOCs) that vary among apple varieties[12] and whose production is intimately linked with fruit maturity[13, 14] and postharvest treatment[15−19]. A recent study found that 56% of the variance associated with overall consumer liking of blueberries and tomatoes can be attributed to VOCs[20]. Over 300 VOCs have been identified in apple, many of which are considered 'odor impact compounds' that play an important role in the perception of apple fruit flavour[21]. VOCs can be classified based on their chemical structure, which includes categories such as alcohols, aldehydes and esters. Among these, esters are the largest group of VOCs that are found in apples, and they contribute to the fresh and fruity flavour of apples[22].
Previous work determined that many VOCs show high heritability, but that individual markers showed relatively small effects on VOC variation, suggesting that most VOCs were subject to a quantitative polygenic inheritance model[23]. Despite this, genome-wide association studies (GWAS) of apple volatiles have suggested roles for alcohol acyltransferase (AAT), carboxylesterase (CXE) and lipoxygenase (LOX) genes in the control of VOC production among apple varieties[23−25]. Recent advances in high-throughput analytical chemistry have enabled the untargeted assessment of the apple's entire 'volatilome'[26], which, when paired with next-generation DNA sequencing of hundreds of apple varieties, provides a powerful platform to elucidate the genetic architecture of apple aroma. The pairing of volatilome quantification and next-generation genomics technologies has uncovered the genetic underpinnings of commercially important flavour molecules in a diversity of vegetable and fruit crops such as pear[27], soybean[28] and melon[29]. In the present study, we harness multi-dimensional apple VOC and genomic data to elucidate the mechanism of VOC production, as well as to identify genetic markers associated with key apple VOCs.
-
Apple varieties in this study were from Canada's Apple Biodiversity Collection (ABC), an orchard containing 1,119 unique apple varieties each planted in duplicate at the Kentville Research and Development Centre in Kentville, Nova Scotia, Canada. The ABC was designed as a genetic mapping population, and a comprehensive description of the statistical design of the ABC and phenotyping protocols are provided in Watts et al[30]. Briefly, the indicators of harvest readiness included the observation of fallen apples or alteration in the apple's skin color[31]. Further evaluation was conducted through a detailed examination of an apple from each tree, which included assessing firmness through touch, evaluating taste for sweetness and starch content, inspecting the coloration of the seed when cut, and verifying starch levels with an iodine solution[32]. Only after the assessment of these established ripeness metrics was completed did the evaluator decide whether the apples from a tree were ready to be harvested. When deemed ready for harvest, the harvest date for each variety was recorded in Julian days. For each variety, 10−20 apples were collected from either one or both replicates from each variety. For volatile quantification, the fruits from 550 varieties were stored at 3−3.5 °C for 1 month. After storage, a sample of 5−10 fruits was randomly selected from each variety, cored, and cut into eight slices using an 8-piece apple slicer and corer. One or two random slices from each apple were selected and frozen in liquid nitrogen. The slices were bagged, labelled, and held at −80 °C until analysis. The total mass for each sample ranged from ~300−500 g.
Volatile quantification
-
A 5 g composite frozen sample (−80°C) was blended with 95 g of a saturated salt solution (NaCl, Fisher Scientific Canada, certified ACS) for 1 min using a Kinematica model MB 800 laboratory mixer (Kinematica AG, Luzern, Switzerland) at setting 4. A 10 g sample of the homogenate was placed in a 20 mL headspace vial, capped and 5 µL of an internal standard (10.0 mg/L Benzaldehyde-d6) was added using a MultiPurpose Sampler (MPS, Gerstel, Linthicum, MD, USA). The VOCs were extracted and analyzed by solid-phase microextraction-gas chromatography × gas chromatography-time of flight–mass spectrometry. Vials were incubated at 30 °C for 300 s and then the divinylbenzene/carboxen/polydimethylsiloxane SPME fiber (Supelco Analytical, Bellefonte, PA, USA) was exposed to the headspace for 900s with agitation (on for 60 s; off for 1 s). The fiber was desorbed at 250 °C for 7 min. The injector was operated at 250 °C in the split mode of 1:20 for 1 min. Helium was used as the carrier gas at a flow rate of 1.4 mL/min. The MPS system was installed on a unit-mass resolution Pegasus 4D TOFMS (LECO, St Joseph, MI, USA). The modulator was mounted in an Agilent 7890 GC gas chromatograph equipped with a secondary oven and a quad-jet dual-stage thermal modulator. Liquid nitrogen was used for cooling the cold jet lines. The first dimension (1D) column was a polar Stabilwax® (30 m × 0.25 mm × 0.25 µm), and the second dimension (2D) column was a mid-polar Rxi®-5Sil MS (1.09 m × 0.25 mm × 0.25 µm). The optimized 1D GC oven temperature was initially set at 50 °C for 0.20 min, before increasing at 10.3 °C/min to 220 °C. The temperature offset for the secondary oven was 44 °C and the modulator temperature offset was +15 °C. The modulation period (PM) was 1.2 s, with a hot pulse time of 0.35 s on each jet. The transfer line was held at 250 °C. The TOF-MS was operated in electron ionization (EI) mode at 70 eV, with an acquisition mass range of 35–300 amu, area count calculation applied apex masses, an acquisition rate of 200 Hz, and a detector voltage of 1,500 V with an optimized voltage offset of 200 V. The ion source was heated to 250 °C. Daily mass calibration and tuning were performed using perfluorotributylamine (PFTBA). An acquisition delay of 100 s was applied. The chemical identification of the peaks was determined based on the retention index and correspondence of the mass spectra with the 'mainlib' and 'replib' of the 2017 National Institute of Standards and Technology (NIST) Mass Spectral Virtual Library (ChemSW, Fairfield, CA, USA). The VOCs that had NIST similarity scores below 850 were discarded. The retention index for compounds was identified from the retention time using Kovats Retention Index formula[33]. Some VOC names were then manually curated to resemble the most common written notation.
For each variety, the peak area value for each VOC was divided by the peak area value for benzaldehyde-d8 as a standardization procedure and the resulting units for abundance were considered normalized total ion counts (TIC). The final table contained 106 VOCs across 515 varieties (Supplemental Table S1). Each VOC was present in at least 35 apple varieties (6.8%) and every variety had at least 24 VOCs present (22.6%). Each VOC was manually categorized into one of the following 13 different classes: acids, alcohols, aldehydes, C13-norisoprenoid, esters (straight chain), esters (branched chain), furans, hydrocarbons, ketones, lactones, monoterpenoids, sesquiterpenes, and sulfur/nitrogen compounds (Supplemental Table S2). The totals for each VOC category were calculated by adding up the standardized peak area values for all VOCs within each category.
Genotyping
-
The genotyping-by-sequencing (GBS) method[34] was used to generate genome-wide single-nucleotide polymorphism (SNP) data from DNA extracted from leaf tissue as previously described in Migicovsky et al[35]. The initial genotype data consisted of 260,399 SNPs across 1,054 varieties. SNPs that were not assigned to any of the assembled 17 chromosomes of the reference genome[36] were assigned to a sequence of unanchored contigs designated as chromosome 'R'. Two additional markers were genotyped in the same varieties because of their potential role in the volatile synthesis and were then combined with the GBS data. First, a Kompetitive Allele Specific PCR (KASP) genotyping assay was used to genotype a functional non-synonymous SNP that results in glutamine to glutamate change at position 387 of the citramalate synthase (CMS) gene that may account for variability in ester synthesis across apple varieties[22]. Second, a high-resolution DNA melting (HRM)-based assay was used to detect the presence of a long terminal repeat (LTR) retrotransposon upstream of the MYB1 transcription factor that is associated with red skin[37]. Primer sequences and reaction details can be found in Supplemental File S1. Out of the 550 varieties for which VOC data were collected, genotype data were available for only 515 varieties, and thus the final SNP genotype matrix was filtered to include only those 515 varieties. SNPs with minor allele frequency (MAF) < 1% and heterozygosity > 90% were removed. The final genotype matrix contained 250,579 SNPs across 515 varieties. The genotype data were filtered using PLINK version v1.90b3r[38].
Statistical analysis
-
All statistical analyses were performed in R version 4.0.2[39]. Principal component analysis (PCA) was performed using the prcomp function with scale and center parameters from the stats package. GWAS was performed using the mlmm_cof function from the mlmm package (v0.1.1)[40].
A previous genetic analysis of apple varieties in the ABC found a high degree of relatedness (i.e., siblings and first-degree relationships), and the population structure as determined using PCA is strongly correlated with the harvest date[5]. To account for the observed population structure and relatedness, we included the first five principal components (PCs) and the kinship matrix as covariates in the GWAS model, which is standard practice when performing GWA[41, 42]. Thus, a simplified GWA model according to Yu et al.[43] can be represented as follows:
${\rm Y}\sim {\text α} + {\rm Q} + {\rm K} + {\rm e} $ where Y is a vector of phenotypic observations (i.e., an abundance of a particular VOC across varieties); α is a vector of SNP effects (i.e., SNP genotypes across varieties); Q is a matrix including the values from five PCs across varieties that controls for population structure; K is the pairwise kinship matrix that controls for close relatedness among varieties; and e is the error term (i.e., vector of residual effects).
The kinship matrix accounts for the dependency among SNPs correlated with the phenotypes due to relatedness among apple varieties. The kinship matrix was calculated using a standalone version of Tassel (v5.0) GBS pipeline (v2)[44]. To visualize GWA results, Manhattan plots and quantile-quantile (QQ) plots were generated using the ggplot2 (v3.3.5) package in R. The fit of the mixed model to the data can be evaluated by observing the QQ plots: the closer the observed values are to the expected values, the better the model fit. The model fit was quantitatively evaluated using the genomic inflation factor (λ), which expresses the deviation of the distribution of the observed test statistic compared to the distribution of the expected test statistic[45]. High genomic inflation factors (λ >> 1) indicate an excess of false positive genotype-phenotype associations that most frequently result from the model's inability to correct properly for the confounding effects of complex population structure and relatedness[46]. The λ values are shown within each QQ plot to enable an evaluation of model fit.
All correlations were calculated as Pearson correlations using the cor.test function from the stats package (v4.1.2).
-
To investigate apple aroma diversity, 106 VOCs were quantified across 515 apple varieties using 2D-GC-MS (Supplemental Table S1). Each VOC was categorized into one of the 13 VOC classes (Supplemental Table S2), and we determined that esters, aldehydes, and alcohols are not only the most ubiquitous (Fig. 1a) but also are the most abundant classes of VOCs in apples (Fig. 1b). In fact, nearly the entire apple volatilome as measured in this study is composed of esters, alcohols, and aldehydes: they make up ~98% of the total VOC abundance in our data set. This observation is in line with previous work showing that esters, aldehydes, and alcohols are the main contributors to fruit aroma[12]. Esters were not only the most abundant VOC class, but there were also a relatively large number of ester compounds in our dataset: 40 of the 106 compounds (38%) we identified were esters. Esters were previously reported to account for 80% of the fruit volatiles in apples[47], and our results support the notion that esters are likely the largest contributors to the apple volatilome.
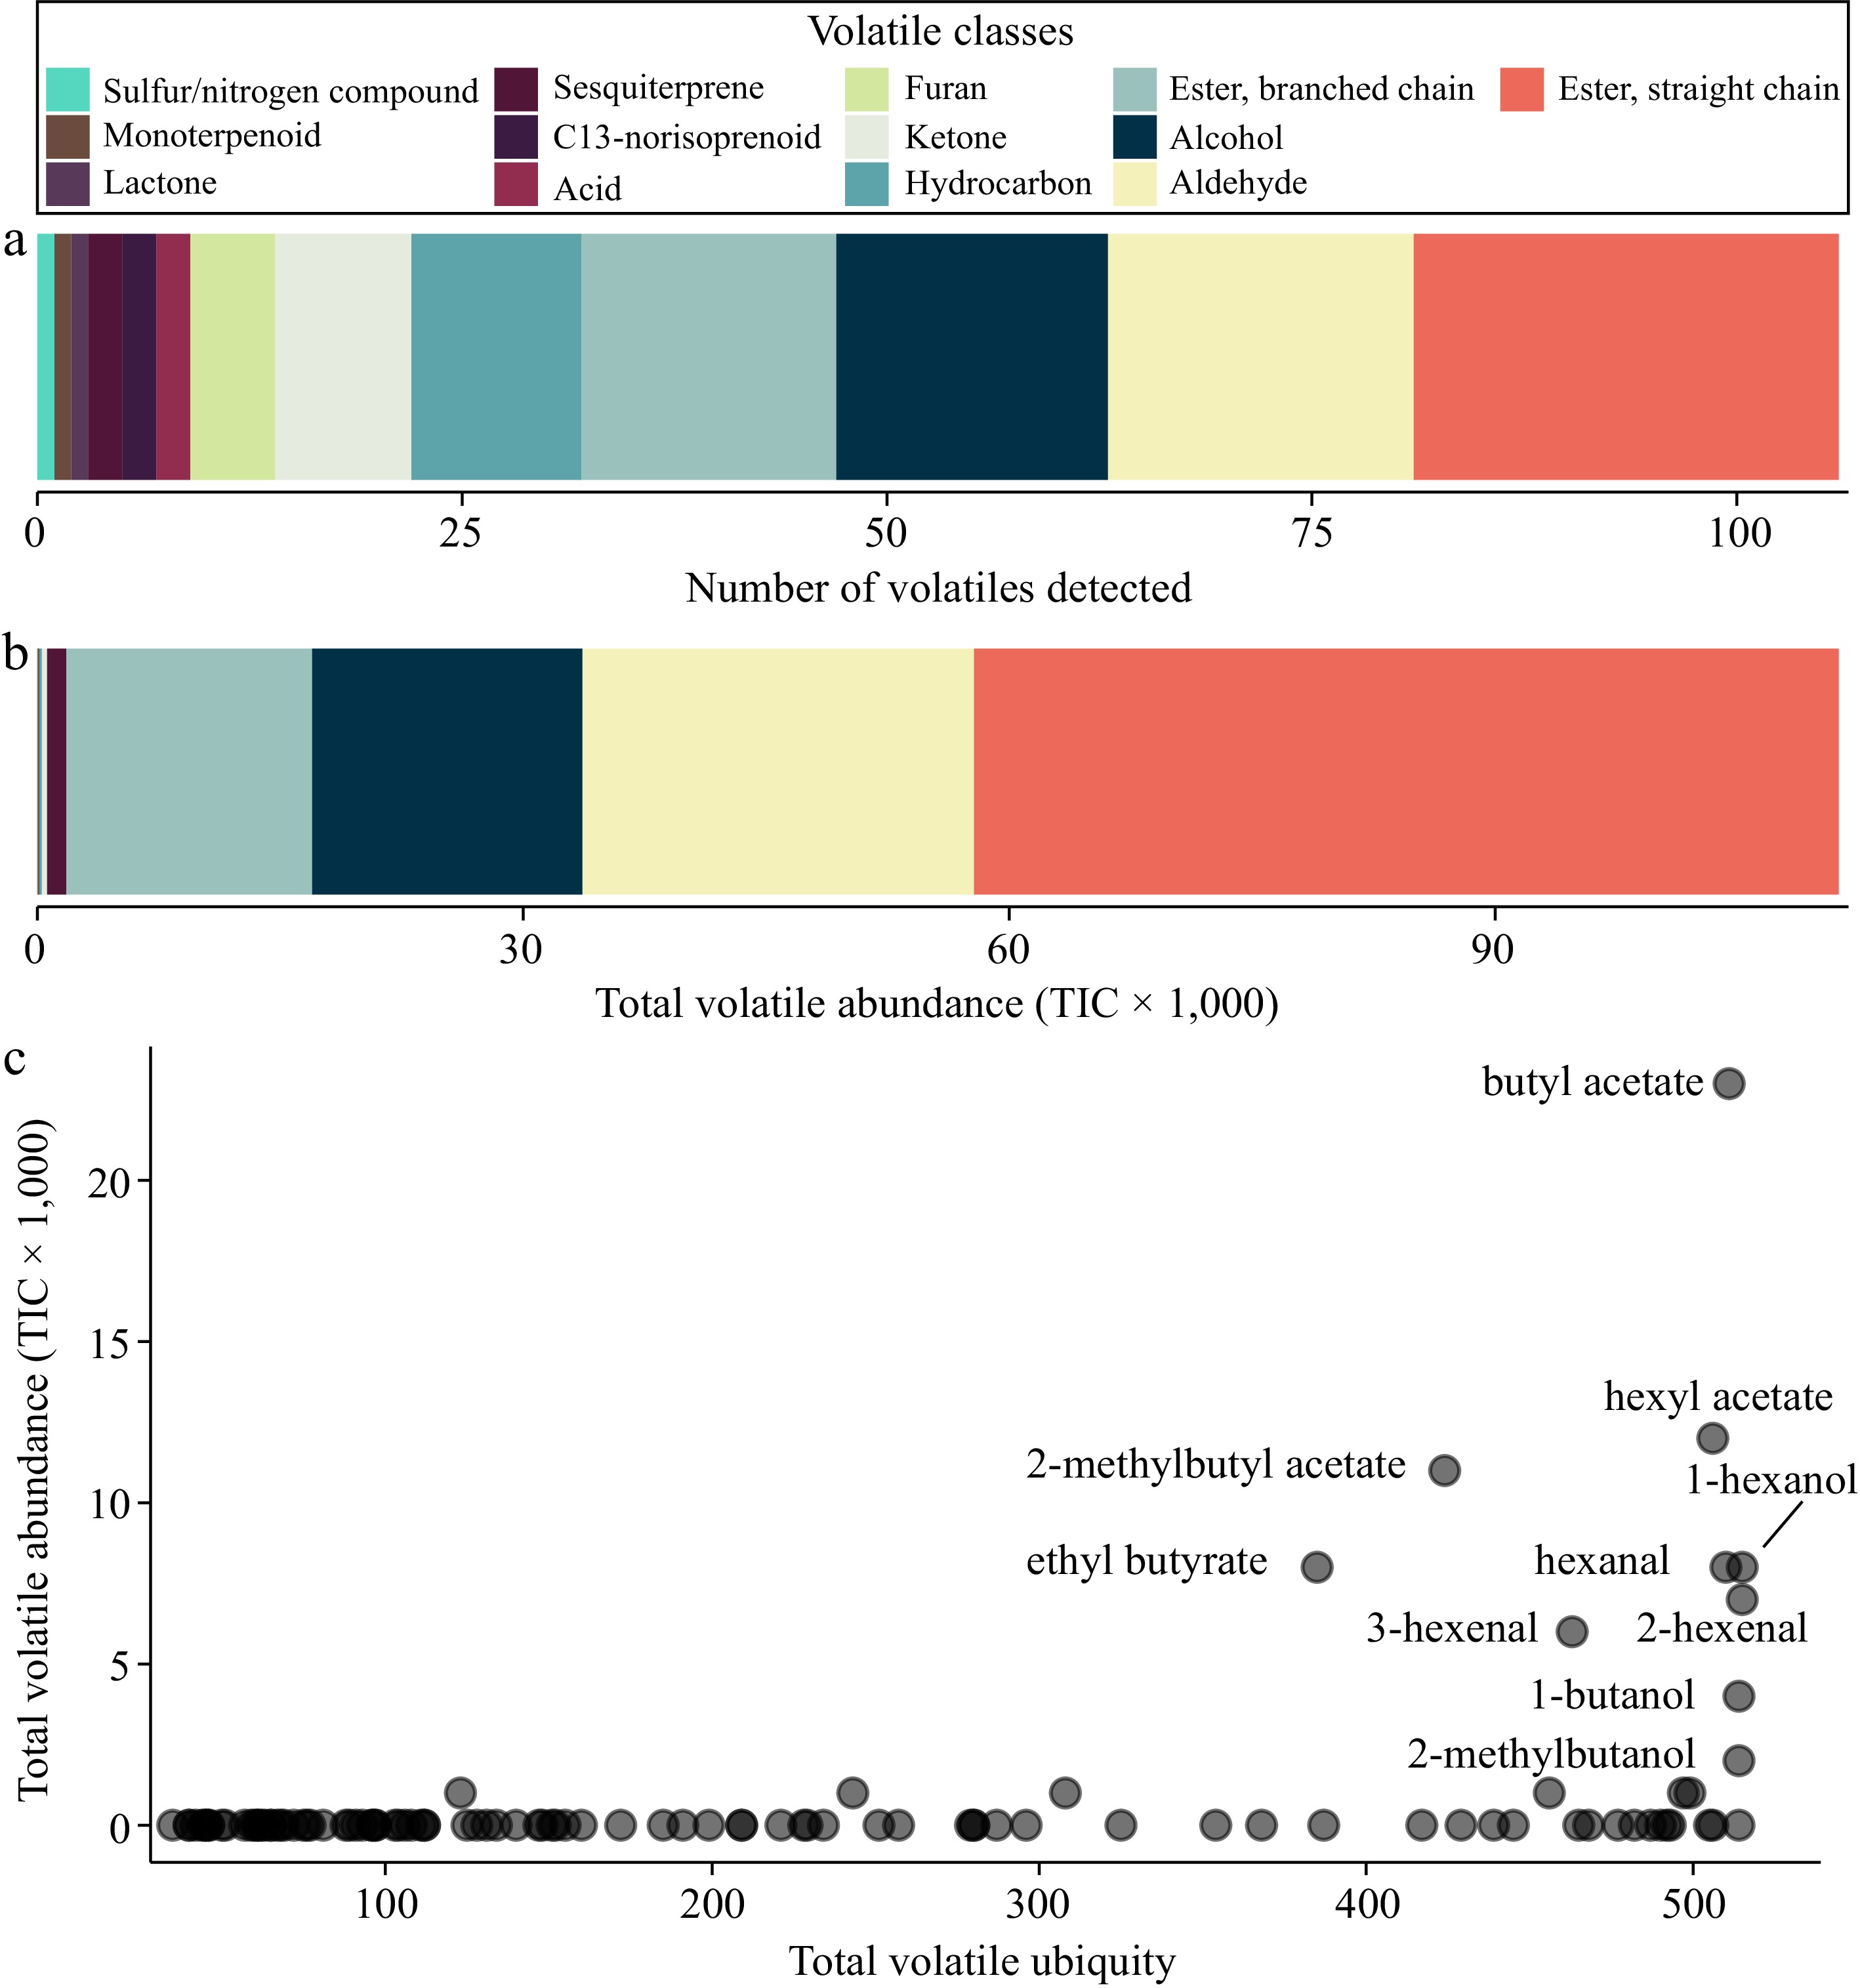
Figure 1.
VOC composition across 515 apple varieties. (a) The number of VOCs detected by VOC class. (b) The total volatile abundance by VOC class. (c) The ubiquity of each VOC (x-axis) is plotted against its abundance (y-axis). Ubiquity is defined as the number of samples in which a VOC was detected.
In addition to our observation that a small number of compound classes dominate the apple volatilome, we found that a relatively small number of individual VOCs account for a large proportion of the overall volatile abundance (Fig. 1c). These VOCs are ubiquitous and abundant: they were detected in nearly every variety and were present at relatively high concentrations. The most abundant VOC in our data set was butyl acetate (a volatile ester), which was detected in 511 of the 515 varieties and whose total abundance across all varieties represented 20.8% of the overall VOC abundance in our data set. Butyl acetate is commonly used as a flavouring agent in various foods as it has a 'fruity' aroma[48]. The variety with the highest concentration of butyl acetate is 'Dukat', a variety from Kazakhstan primarily eaten fresh or dried[49]. One of Dukat's parents, Golden Delicious, is known to have high concentrations of butyl acetate, which is designated as an 'impact compound' for its ability to have a strong effect on the sensory quality of the fruit[14]. Further, volatile esters are found at relatively high concentrations in both 'Cox's Orange' and 'Golden Delicious', the two parents of Dukat[50]. While butyl acetate was present in nearly all the varieties tested here, it remained undetected in four varieties and its concentration varied widely among varieties (Supplemental Table S1). The pattern of ubiquity and abundance of butyl acetate observed in the present study supports the notion that this compound may play a key role in the diversity of sensory quality across apple varieties.
The most ubiquitous compound we measured, which was present in all 515 varieties, was hexanol and its total abundance across all varieties represented 7.8% of the overall VOC abundance. It has been previously shown that the exogenous application of hexanol onto apple fruit induces soft scald, a common post-harvest disorder that appears in response to cold storage after about 2−8 weeks[51]. The variety 'Honeycrisp' is known to be highly susceptible to soft scald[52], but its level of hexanol is only slightly above the median value of the 515 varieties evaluated here. It is therefore unclear whether endogenous production of hexanol as detected here mediates soft scold susceptibility and, by extension, whether selection against hexanol production by apple breeders, either phenotypically or using genetic markers, may be an effective strategy for selecting for resistance to soft scald.
The apple with the highest number of VOCs was 'Red Cinnamon', which expressed 73 of the 106 VOCs. The apple with the highest cumulative VOC abundance was 'Krapchatoe'. Descriptions of these two varieties failed to reveal why they may lie at the extremes of these distributions. Conversely, the apple with the lowest volatile abundance was 'Black Ben Davis'. This apple is known for its ruggedness but is generally described to have poor flavour. It was famous in the 19th and 20th centuries because it withstood shipping and storage well. However, as shipping and packing improved, this variety fell out of favour[53]. This is a prime example of how flavour is an essential consideration for consumers but is often overlooked because of a focus on production-related traits.
It is worth noting that our quantification of the apple volatilome is subject to the constraints of our sampling and processing procedures. For example, the apples were subjected to one month of cold storage and subsequently sliced, frozen and blended in a laboratory mixer before GC-MS analysis. These processes affect the food matrix and influence the in vitro volatile profile[54, 55] . We therefore recognize that the volatile profile captured using our experimental protocol will vary, perhaps significantly in some cases, from the volatile profile experienced by a consumer during the chewing process. Despite this, the experimental protocol employed here represents a reasonable first step to assess the variation in the relative abundances of compounds and their correlation with genetic variation to provide insights into the genetic basis of apple aroma production.
Relationships among VOCs
-
To understand the relationships among VOCs, we generated a pairwise correlation matrix among all VOCs (Supplemental Fig. S1). Of the 5565 pairwise comparisons between pairs of VOCs, 726 (13%) were statistically significant after correcting for multiple comparisons. Positive correlations between VOCs were far more abundant than negative correlations: of the statistically significant correlations, 97% (704) were positive and only 3% (22) were negative. This suggests that the positive co-expression of VOCs is more common than negative co-expression. Furthermore, significant positive correlations were observed more often than expected between pairs of VOCs within the same class, and less often than expected between VOCs from different classes (χ2 = 243.1, p = 8.14 × 10−55). For example, the abundance of (E)-2-octenal was nearly perfectly correlated with the abundance of 2-heptenal (r = 0.97; p = 1.45 × 10−317), suggesting a tightly co-regulated metabolic relationship between these two aldehydes (Supplemental Fig. S2). Both of these VOCs are known autoxidation products of linoleic acid and may contribute to the off-flavour of apple juice in the presence of light[56]. A full investigation of each pair of co-expressed VOCs is beyond the scope of the present study. However, these data may be further analyzed to elucidate groups of compounds involved in similar metabolic pathways.
Harvest date shapes the apple volatilome
-
To assess the relationships among varieties based on their volatile profiles, we performed principal components analysis (PCA) on the entire VOC data set. The first two PCs explained 17.8% of the total variance (Fig. 2a) and we observed a significant correlation between harvest date and PC1 (R2 = 0.17; p = 3.33 × 10⁻²³): early-harvested varieties that ripen quickly have significantly lower PC1 values than late-harvested varieties that take longer to ripen (Fig. 2b). Thus, the main axis of variation from the apple volatilome was significantly correlated with harvest date. This relationship was strengthened by our observation that harvest date was also negatively correlated with the ubiquity and abundance of VOCs (Fig. 2c & d). These observations demonstrate that early-harvested apple varieties tend to express a larger number and quantity of VOCs than late-harvested apples. We propose that this phenomenon likely arises because the ripening process is accelerated in early-ripening varieties and operates at a slower rate in late-ripening varieties, and that this applies to post-harvest metabolic activity as well. Thus, the one month of cold storage we employed in our experiment likely resulted in more metabolic change for an early-ripening variety than a late-ripening variety, and this resulted in an increase in the overall abundance and ubiquity of VOC expression among early-ripening varieties. Regardless of the mechanism, our results suggest that the time it takes an apple to ripen on the tree is intimately linked to its volatilome.
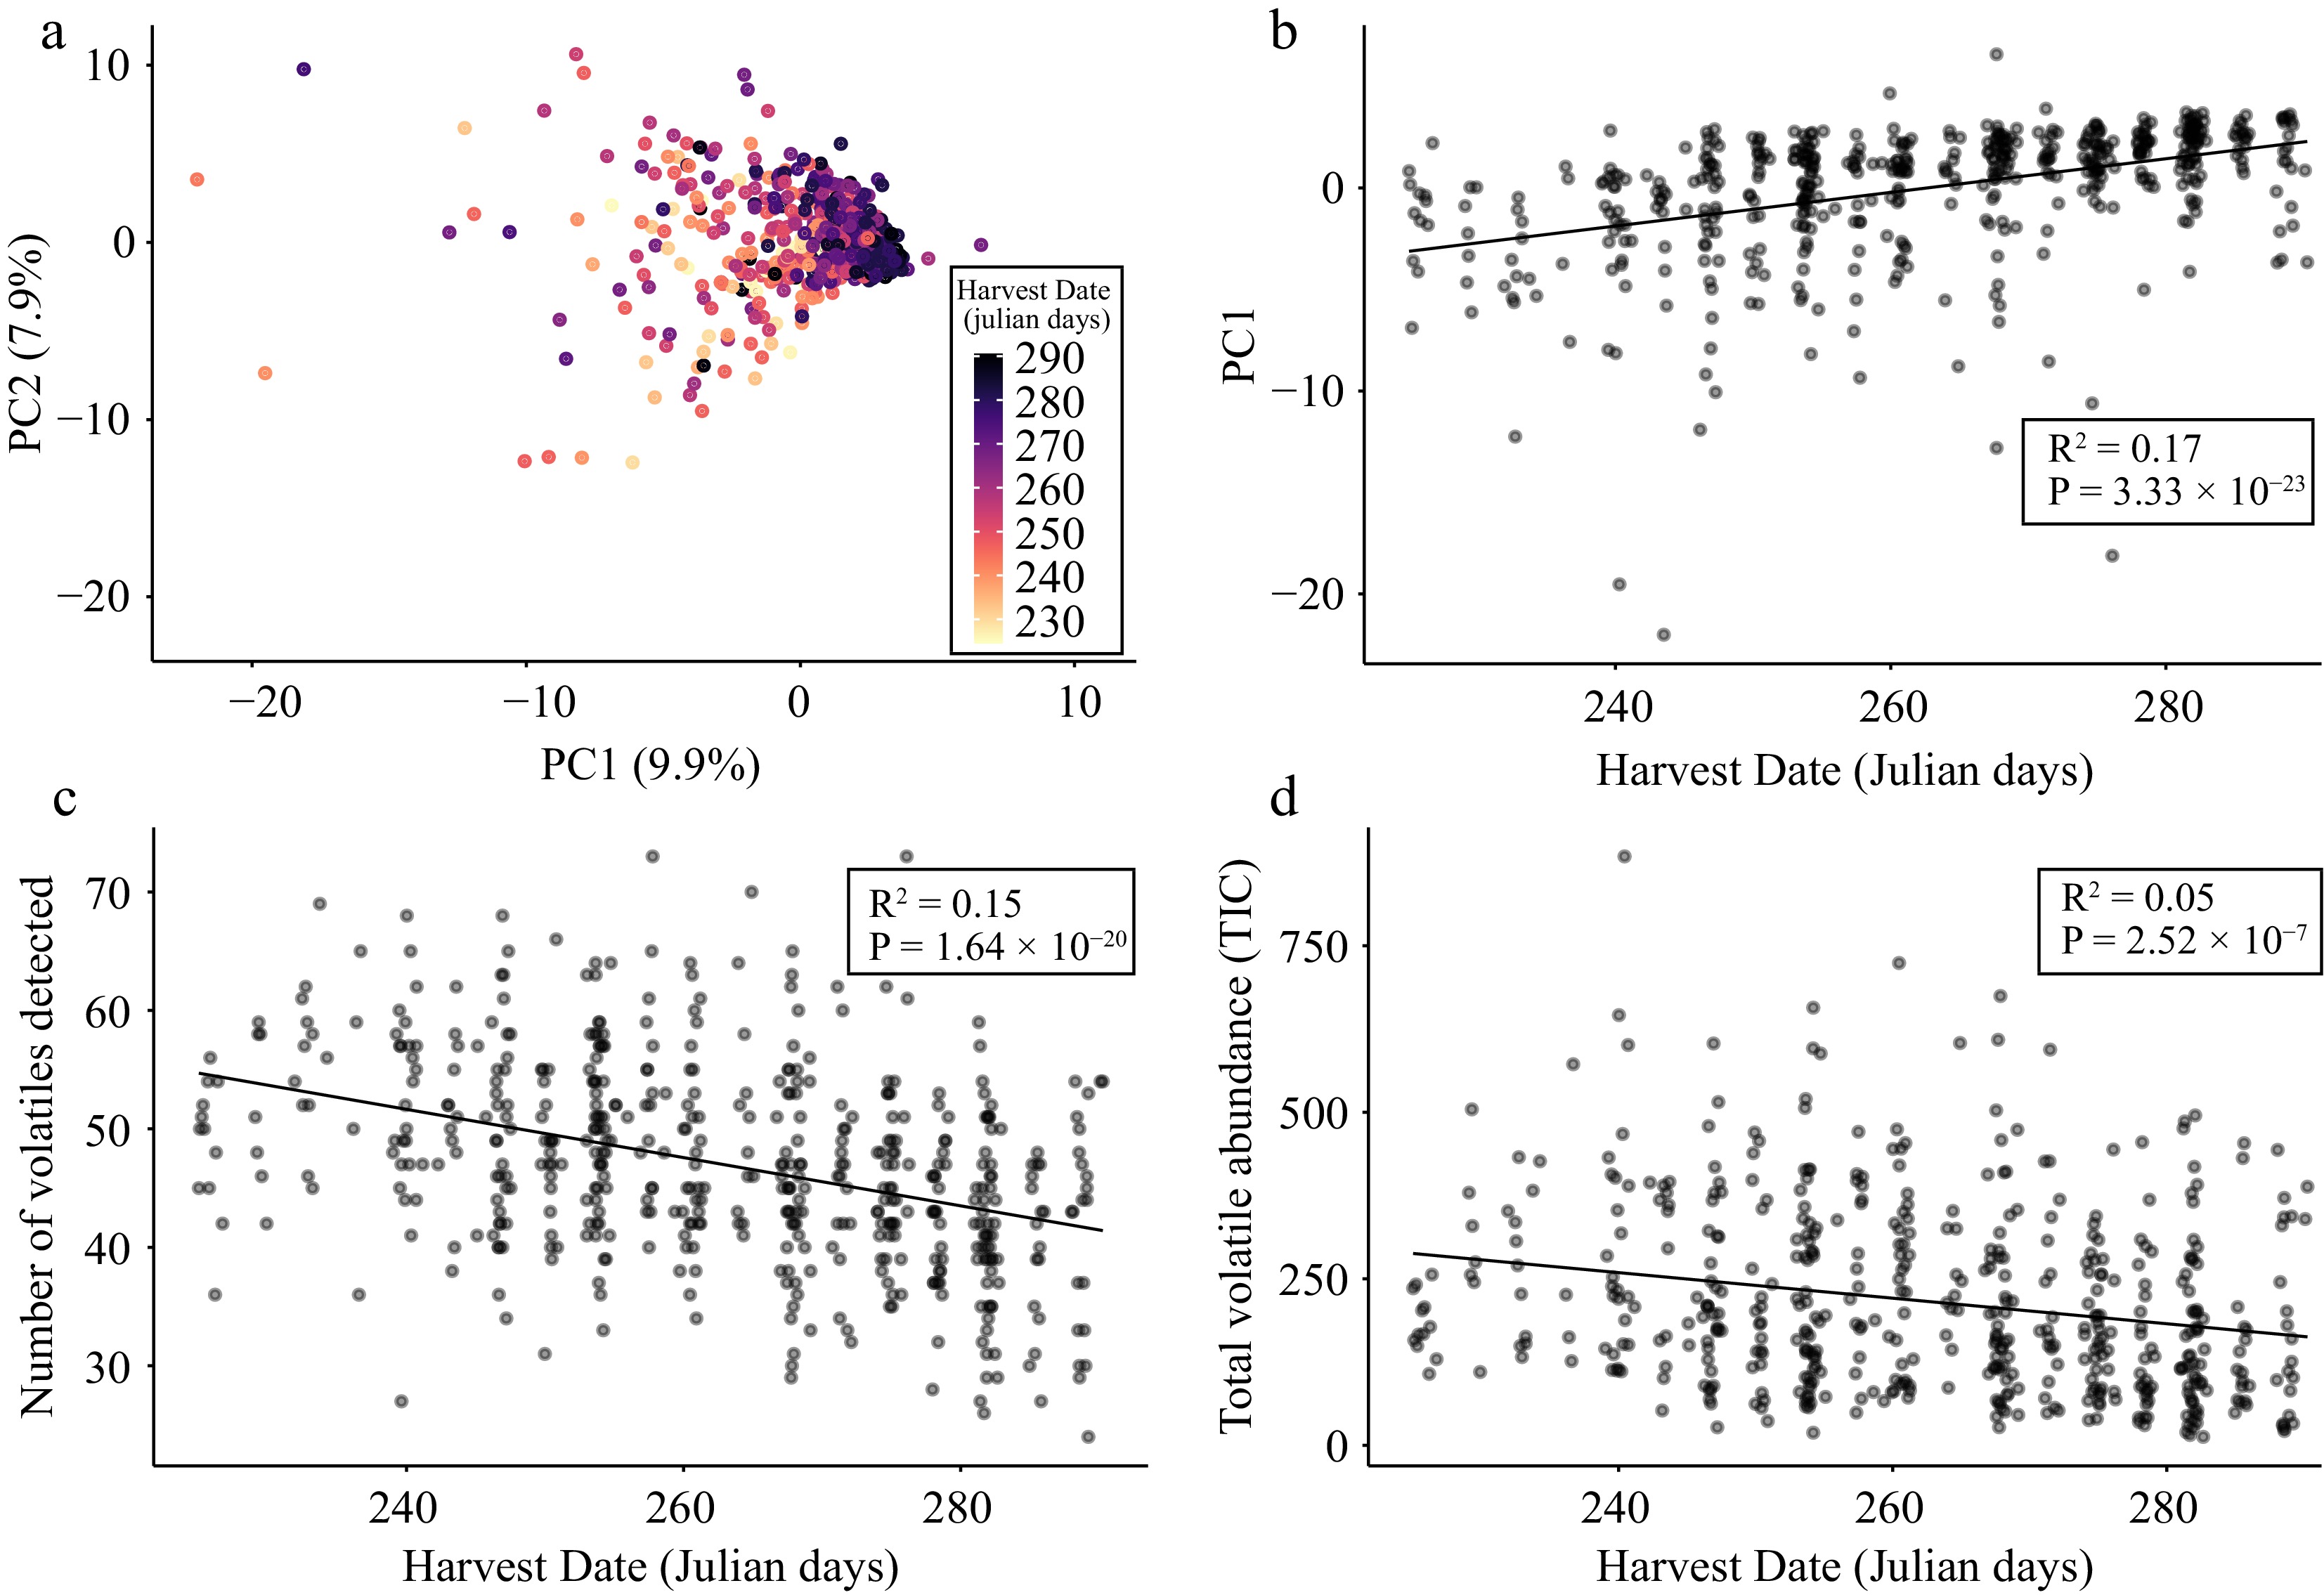
Figure 2.
Apple volatilome variation is associated with harvest date. (a) PCA bi-plot of PC1 and PC2 derived from a matrix of 106 VOCs across 515 apple varieties. Each point is a unique apple variety that is coloured according to its harvest date. (b) Scatter plot of PC1 values and harvest date across 515 varieties. (c) Scatter plot of VOC ubiquity (i.e., the number of VOCs detected per sample) and harvest date across 515 varieties. (d) Scatter plot of total volatile abundance and harvest date across 515 varieties. Lines of best fit, R2 and P values result from Pearson correlations between variables.
GWAS
-
We performed GWAS to identify genomic regions associated with the production of VOCs. In addition to over 250,000 genome-wide SNPs, we genotyped two markers we hypothesized may be involved in VOC variation across apple varieties. However, neither the functional non-synonymous SNP in the citramalate synthase (CMS) gene[22] nor the retrotransposon upstream of the MYB1 transcription factor associated with red skin[37] were significantly associated with any of the 106 VOCs we measured. This highlights the importance of surveying genome-wide variation when performing genetic mapping rather than relying on candidate genes for elucidating genotype-phenotype relationships.
Interpreting the resulting Manhattan and QQ plots from more than 100 GWASs was often challenging due to a lack of easily detectable, strong association signals suggesting loci with large phenotypic effects (Supplemental Fig. S3). A similar trend was observed in a previous GWAS of 49 VOCs quantified across 145 apple varieties[25]. Several explanations are possible for this observation. First, it could be that many VOCs were not adequately abundant or ubiquitous to enable a well-powered GWAS, or that their distribution resulted in a poor model fit. Our observation of numerous QQ plots where the genomic inflation factor (λ) deviated from the expected value of 1, suggests that a poor model fit may have often led to uninterpretable results (Supplemental Fig. S3). Second, it is possible that the marker density we employed was insufficient, and that large effect loci were missed because they were not in linkage disequilibrium with any of SNPs used in the present study. Indeed, it has been suggested that millions of markers are required to perform well-powered GWAS in diverse apple populations[57]. Finally, it may be that most VOCs are controlled by numerous loci of such small effect that our GWAS was underpowered to detect them, in agreement with previous work[23] . We hypothesize that all three of these factors likely played a role in our observation of only a small number of notable genotype-phenotype associations. Thus, we focus on the most reliable genotype-phenotype associations by only considering those that form a clear and reliable peak in a Manhattan plot, a signal that suggests the identification of a single genetic locus of large effect on the concentration of a VOC. While further exploration of more complex GWAS models could be explored in the future, only the most promising associations identified using a simple GWAS model are explored in detail below.
Butanol and hexanol were among the most ubiquitous and abundant VOCs detected (Fig. 1c) and both of their concentrations appear to be mediated by genetic variation at a single locus on chromosome 3 (Fig. 3). The most significant marker associated with these two VOCs is a non-synonymous SNP at position 30,698,039 bp on chromosome 3 within the NAC18.1 gene, a member of the NAC family of transcription factors (Supplemental Table S3). This is particularly noteworthy since several previous GWASs failed to find significant marker associations for these VOCs[23,25,55]. Functional genomics studies across diverse species have demonstrated that NAC transcription factors are implicated in ripening phenotypes across diverse agricultural crops, including tomato[58], melon[59], banana[60], peach[61,62], and apricot[63]. Notably, the homolog of NAC18.1 in tomatoes (Solanum lycopersicum) is the NON-RIPENING (NOR) gene, a well-studied gene that, when knocked out in tomatoes, produces the nor mutant tomato that does not ripen[64]. In apple, numerous recent GWASs have repeatedly identified associations between NAC18.1 and harvest date, often identifying the same nonsynonymous variant we identified here[25, 57, 65−67]. A recent study demonstrated that introducing the apple NAC18.1 transgene into a nor mutant tomato recovers ripening, providing strong evidence that genetic variation within NAC18.1 mediates the apple ripening process[68].
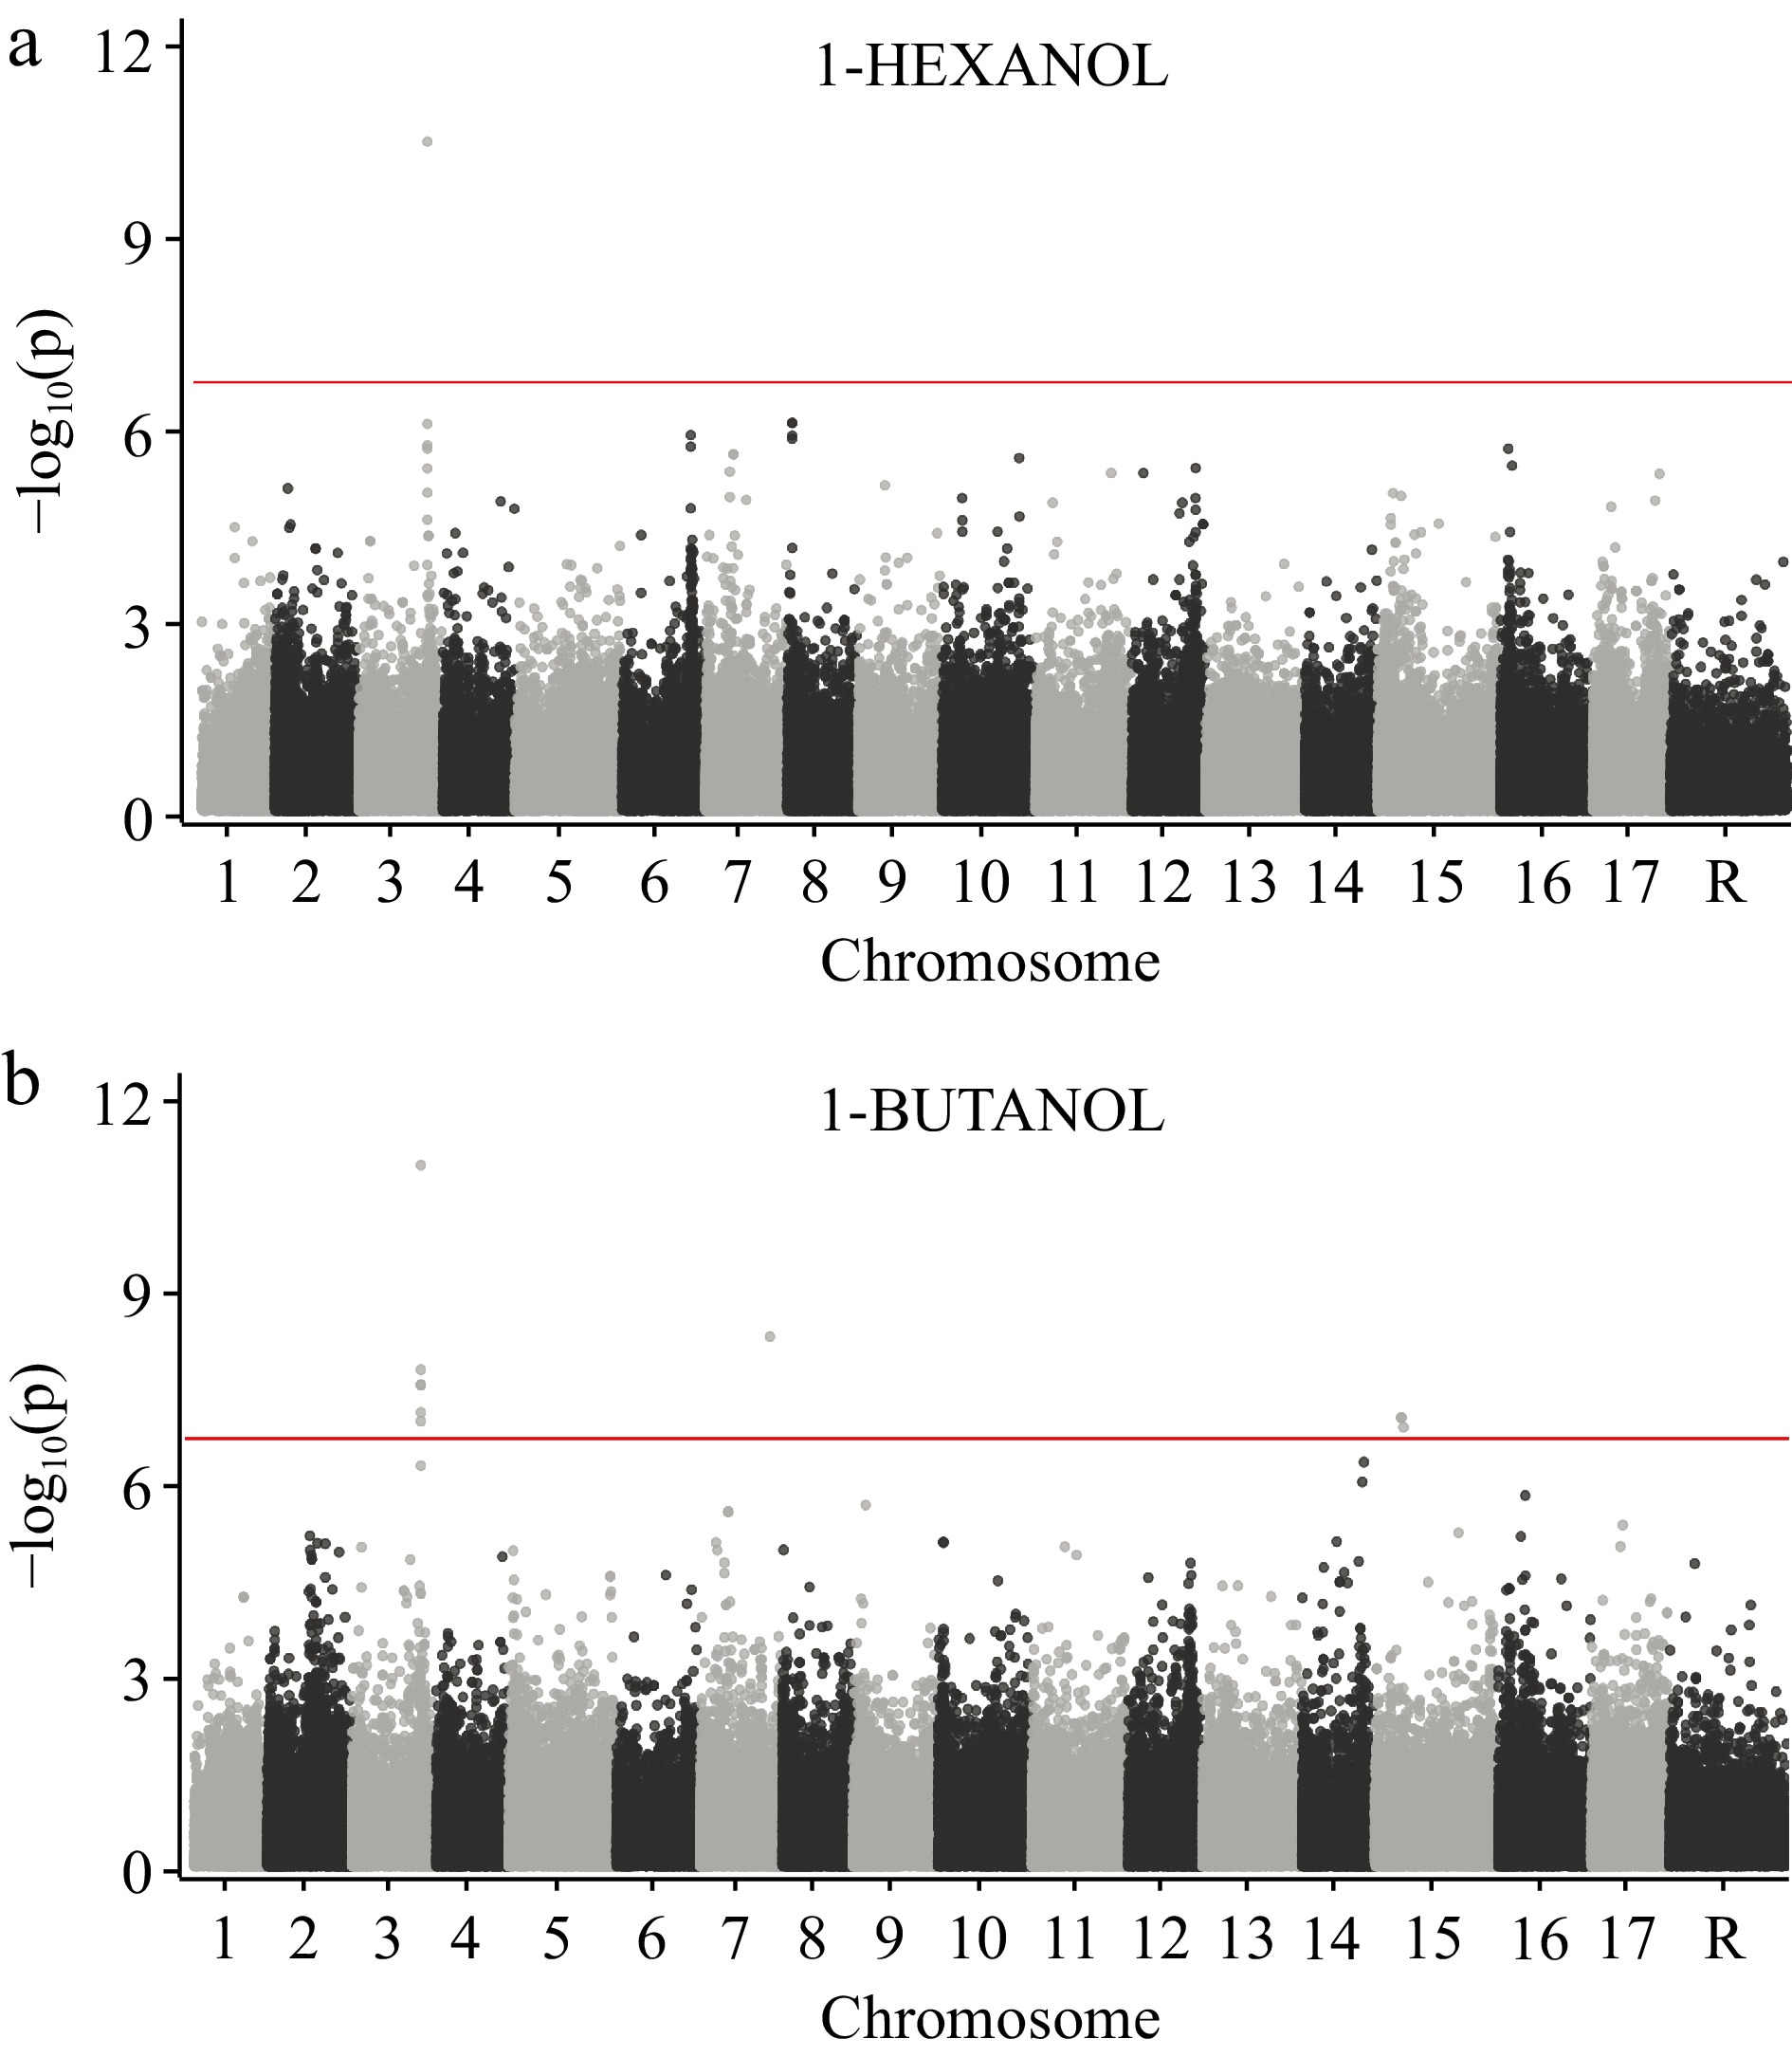
Figure 3.
GWAS of 1-hexanol and 1-butanol across 515 apple varieties using 250,579 SNPs. (a) Manhattan plot for 1-hexanol. (b) Manhattan plot for 1-butanol. The horizontal red line represents the significance threshold after correcting for multiple comparisons (see Methods). Chromosome 'R' is composed of contigs that remain unanchored to the reference genome.
Our observation that concentrations of butanol and hexanol were associated with genetic variation in NAC18.1 is consistent with our observation that harvest date was negatively correlated with both butanol (R = −0.46, p = 2.86 × 10⁻²⁸) and hexanol (R = −0.44, p = 9.75 × 10⁻²⁶). Both key VOCs were more abundant in early-ripening varieties than in late-ripening varieties, suggesting that the reduction in expression of these VOCs over the harvest season is mediated by genetic variation in or near the NAC18.1 gene. It is noteworthy that firmness was also strongly associated with harvest date, whereby early-harvested varieties were found to be softer than late-harvested varieties[57, 69−71]. We therefore propose that the NAC18.1 gene is a master regulator of apple ripening, and alleles at this locus modulate numerous ripening-associated phenotypes including harvest date, firmness, and the expression of key VOCs like butanol and hexanol.
Genetic control of ester biosynthesis
-
Esters represent a crucial group of VOCs that significantly contribute to the flavour and aroma of various fruits, including apples[72]. Depending on the precursors, either straight chain esters or branched chain esters can be produced. Straight chain esters, such as butyl and hexyl acetate, are believed to be associated with lipid and fatty acid metabolism[73], while branched chain esters, especially 2-methylbutyl acetate, were reported to be generated through the citramalate synthase (CMS) pathway[22]. Among the acetate esters, hexyl acetate, butyl acetate, and 2-methyl butyl acetate are critical in determining the characteristic apple aroma[74]. Interestingly, the concentrations of these acetate esters are strongly correlated with ethylene production, suggesting that their biosynthesis may be ethylene-dependent[18].
Our GWAS revealed strong associations at a single locus on chromosome 2 for various ester compounds, such as butyl acetate, pentyl acetate, hexyl acetate, isobutyl acetate, n-propyl acetate, and 2-methyl butyl acetate (Fig. 4a−f). The same association signal is also detected for the sum all esters (Fig. 4g). The top SNP in this region (chr2:1164704) is in a non-genic region, but genes within a 400kb region around the top SNP include a leucine-rich repeat (LRR) transmembrane protein kinase (MD02G1012000), a ribosomal protein S11-beta gene (MD02G1015900 and MD02G1015400), and AAT1, an alcohol acyltransferase gene (MD02G1013900) (Fig. 4h). Significant associations were also observed on chromosome "R", but since these SNPs are unanchored to assembled reference sequence, no annotated genes could be identified from these signals. Some significant associations were observed on other chromosomes as well (e.g. SNPs on chromosome 5 for n-propyl acetate; Fig. 4e), but we focus here exclusively on the large effect locus on chromosome 2.
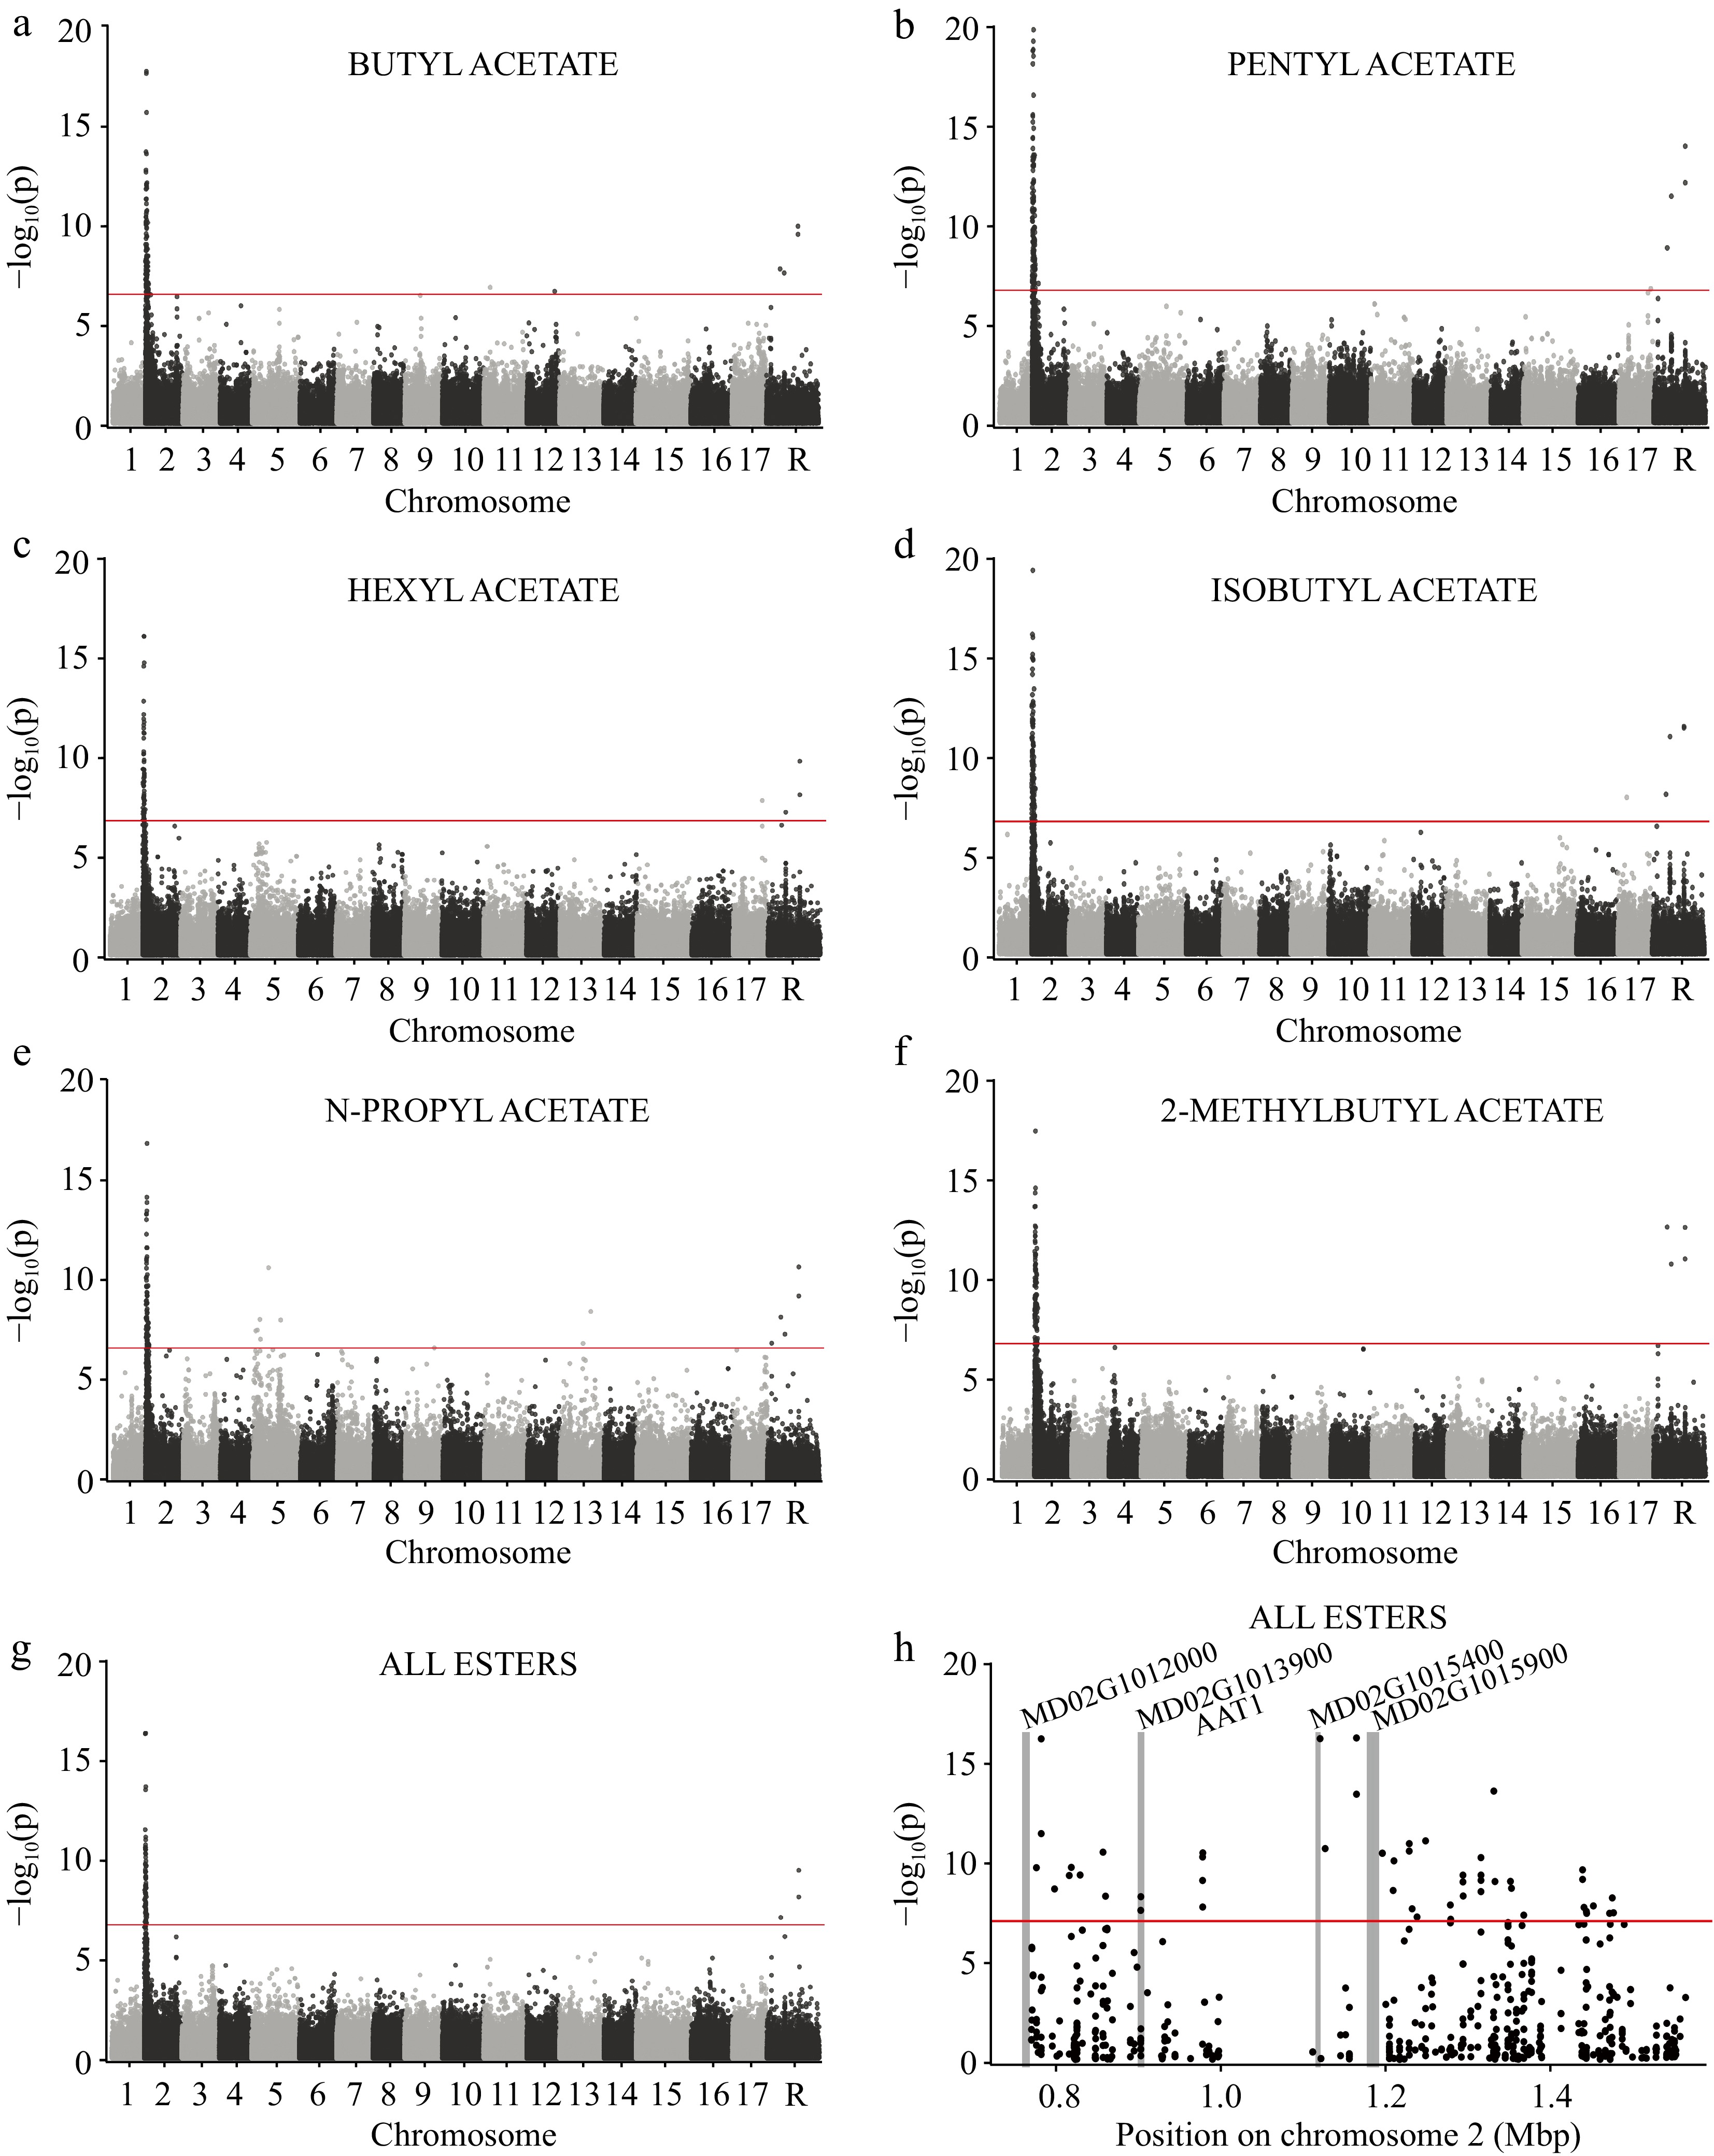
Figure 4.
GWAS of several esters across 515 apple varieties using 250,579 SNPs. Genome-wide manhattan plots are shown for (a) butyl acetate, (b) pentyl acetate, (c) hexyl acetate, (d) isobutyl acetate, (e) n-propyl acetate, (f) 2-methylbutyl acetate, and the (g) sum of all esters. The horizontal red lines represent the significance threshold after correcting for multiple comparisons (see Methods). Chromosome 'R' is composed of contigs that remain unanchored to the reference genome. (h) A manhattan plot showing only the locus of large effect on chromosome 2. The vertical gray bars indicate the locations of annotated genes within the region and gene names appear at the top of each bar.
While it is unclear what role the two ribosomal proteins (MD02G1015900 and MD02G1015400) at the locus on chromosome 2 may play in ester biosynthesis, MD02G1012000 is a member of receptor-like kinase (RLK) family involved in ethylene signaling[18], which suggests a potential role for this gene in the production of esters. However, the signal on chromosome 2 most likely stems from allelic variation at the alcohol acyltransferase gene, AAT1, which transfers an acyl group from acyl-CoA to the OH group of an alcohol in the final step of ester biosynthesis[12, 75]. The expression of AAT1 is ethylene dependent[55, 76] and previous work has confirmed its effect on VOC profiles in apple[15, 76] and kiwi[77]. Previous genetic mapping studies have identified an association with various esters at this same genomic region and have also reported AAT1 as the primary candidate gene underlying the observed signal[23-25,78]. Although the present study is relatively well-powered when compared to other genetic mapping studies performed to date in apple, the signal we detected on chromosome 2 for ester biosynthesis still spans a considerable genomic region of approximately 400 kb. Within this region, there is also a gap where no SNPs were identified (Fig. 4h), which suggests there may be presence/absence variation at this locus. With whole-genome sequences from the samples in this study, we plan to achieve higher mapping resolution and potentially locate the causal polymorphisms underlying esters at this locus and phenotypic variation at other large effect loci throughout the apple genome.
To assess the potential utility of the SNPs identified through GWAS for marker-assisted breeding, we assessed the genotypes of five elite cultivars at the SNP within NAC18.1 (chr3: 30698039) associated with alcohols and the non-genic SNP on chromosome 2 (chr2:1164704) associated with esters. These five elite cultivars were chosen because they are cultivars we evaluated that are among the ten most widely grown apple cultivars in the USA[79]. Each of the five elite cultivars were homozygous for the late-ripening allele, suggesting that breeders have driven this allele to fixation, or nearly so, among elite commercial cultivars. For the chr2:1164704 SNP, we found that the two alleles are evenly distributed across elite cultivars. The reference allele at chr2:1164704 is associated with higher ester concentrations and selection for this allele through marker-assisted breeding may therefore be useful for apple breeders wishing to generate novel apple cultivars with higher ester content.
-
Our approach to comprehensively evaluate the apple volatilomes of over 500 apple varieties provided key insights into the ubiquity, abundance, and variation among VOCs that play a key role in apple quality and consumer preference. In particular, we discovered that the variation among apples in two ubiquitous and abundant VOCs, hexanol and butanol, is likely controlled by genetic variation at the NAC18.1 gene and that this genetic effect contributes to early-ripening apples being more aromatic than late-ripening apples. We also found that esters were the most abundant and ubiquitous class of VOCs and that their expression across diverse apple varieties is likely controlled by alleles at the AAT1 gene. Given that alcohols (e.g. hexanol and butanol) are precursors of esters (e.g. hexyl acetate and butyl acetate), we propose that combinations of alleles at NAC18.1 and AAT1 likely account for significant variation in the overall abundance and distribution of VOCs that contribute to desirable apple aromas. It is therefore of great interest in the future to identify the causal genetic variants at these loci, and to target them using genomics-assisted breeding to generate novel apple varieties with desirable aroma profiles.
-
All relevant data generated and analyzed during this study are included within the article and its supplementary materials. Additionally, any code and data associated with this work, including raw data, processed data, and analysis scripts, can be accessed at the following GitHub repository:
https://github.com/MylesLab/apple-aroma . This repository ensures transparency and reproducibility of the results presented in this research paper. The authors would like to thank Leslie Campbell and Melinda Vinqvist-Tymchuk at AAFC for storage and handling of fruit. The authors thank the Nova Scotia Fruit Growers' Association and the Farm Services team at AAFC-Kentville for their work in establishing and maintaining the trees studied here. Funding for this project came from the AAFC research project (J002241.001.05) and the Natural Sciences and Engineering Research Council of Canada.
-
The authors declare that they have no conflict of interest. Zoë Migicovsky and Jun Song are the Editorial Board members of Fruit Research who were blinded from reviewing or making decisions on the manuscript. The article was subject to the journal's standard procedures, with peer-review handled independently of these Editorial Board members and their research groups.
- Supplemental File S1 Detailed method for Kompetitive Allele Specific PCR (KASP) genotyping assay for citramalate synthase (CMS) SNP, as well as high-resolution DNA melting (HRM)-based assay for detecting redTE for MYB retrotransposon SNP.
- Supplemental Fig. S1 Pairwise correlation matrix of VOCs. The matrix displays the Pearson correlation between each pair of the 106 VOCs analyzed.
- Supplemental Fig. S2 Scatter plot of abundance values for (E)-2-Octenal and 2-Heptenal across 515 apple varieties. Each point represents a unique apple variety, plotted according to its abundance values for the two specified VOCs.
- Supplemental File S1
- Supplemental Fig. S3 Manhattan and QQ-plots from genome-wide association studies (GWAS) for volatile organic compounds (VOCs) and volatile classes. The Manhattan plot displays genomic regions with corresponding significance levels on the y-axis. The QQ-plots show the genomic inflation factor (λ).
- Supplemental Table S1 Abundance of 106 VOCs measured across 515 apple varieties. Abundance is calculated as Total Ion Count (TIC; see methods). The column labeled “apple_id” contains a unique identifier for each apple variety, also used in previous work including Watts et al. (2021) and Migicovsky et al. (2022). The column labeled “cultivar_name” provides a common name for each apple variety according to the data published by Watts et al. (2021). The harvest date was measured in Julian days and was obtained from Watts et al. (2021).
- Supplemental Table S2 A list of all 106 VOCs detected in the present study and the VOC class into which they were manually categorized.
- Supplemental Table S3 VOCs with significant GWAS hits are shown along with the alleles, association p-value and minor allele frequencies at the SNP locations.
- Copyright: © 2023 by the author(s). Published by Maximum Academic Press, Fayetteville, GA. This article is an open access article distributed under Creative Commons Attribution License (CC BY 4.0), visit https://creativecommons.org/licenses/by/4.0/.
-
About this article
Cite this article
Soomro T, Jordan M, Watts S, Migicovsky Z, Forney CF, et al. 2023. Genomic insights into apple aroma diversity. Fruit Research 3:27 doi: 10.48130/FruRes-2023-0027 

Genomic insights into apple aroma diversity
- Received: 26 June 2023
- Accepted: 21 August 2023
- Published online: 15 September 2023
Abstract: An apple's aroma is a major determinant of its desirability by consumers. To better understand the aroma of apples, 2-dimensional gas-chromatography mass-spectrometry (2D-GCMS) was used to quantify 106 volatile organic compounds (VOCs) from 515 apple varieties. We identified esters and aldehydes as the most abundant classes of VOCs, with butyl acetate and hexyl acetate being present in nearly every variety. Principal component analysis (PCA) revealed that the primary axis of variation in the apple volatilome is correlated with harvest date, with early-harvested apples expressing a greater number and higher concentration of VOCs compared to late-harvested apples. Genome-wide association studies (GWAS) using 250,579 single nucleotide polymorphisms (SNPs) identified a significant association between SNPs near the alcohol acyltransferase (AAT1) locus and the abundance of several esters. Additionally, strong associations were observed between SNPs at the NAC18.1 transcription factor locus and the abundances of 1-hexanol and 1-butanol, which serve as precursors for hexyl acetate and butyl acetate, respectively. These findings provide a foundation for understanding the genetic basis of apple aroma production and pave the way for the genomics-assisted enhancement of the aroma profiles of apple varieties to meet consumer preferences.