


-
Peach (Prunus persica L.) is a typical plant belonging to Rosacea, which is indigenous to China. Given its economic importance and health-promoting properties, research on peach has begun to receive wide attention. The yield of Chinese peaches reached 15.02 million tons in 2020 and ranks first in the world (
www.fao.org/faostat/zh/#data/QC ). Peaches are the main type of deciduous fruit trees in Fujian Province, but peach ripening occurs only from late May to July, which often leads to low prices, seriously restricting improvements to the economic benefits of Fujian's peach industry. Late-mature peach varieties (those that ripen from late July to August) bring advantages to Fujian, extending the supply period for the fresh market, reducing the pressure of centralized listings, and improving the local peach industry's economic benefits. However, it is hard to tell different peach varieties apart based on plant and leaf morphology. This causes a lot of inconvenience in the accurate utilization and preservation of resources. Thus, studies on genetic diversity using various molecular marker systems can be useful in characterizing and protecting the genetic resources of late-mature peach varieties.Molecular markers are genetic markers based on nucleotide sequence variations in genetic material between individuals that can directly reflect genetic polymorphism on a DNA level. This is a powerful tool for estimating the characteristics of genetic diversity and distinguishing individuals from different sources[1]. For example, a high-resolution genetic linkage map of litchi was constructed using random amplified polymorphic DNA (RAPD), sequence-related amplified polymorphism (SRAP), and amplified fragment length polymorphism (AFLP); the distribution uniformity of SRAP markers in the genetic map is much better than that of AFLP[2]. A previous study showed that RAPD markers and simple sequence repeat (SSR) markers cannot distinguish between the 'Shatangju' variety and its bud sport 'Wuzishatangju', and specific bands were only obtained via the inter simple sequence repeat (ISSR) marker and the SRAP marker[3]. The results showed that ISSR and SRAP markers make relationship identification feasible. ISSR marker systems can detect polymorphisms in inter-microsatellite DNA regions without any prior sequence knowledge (which consist of repeating units ranging from one to six base pairs), targeting regions between two simple sequence repeat (SSR) sequences[4]. The SRAP marker is a PCR-based molecular marker[5] that uses a unique dual-primer design to amplify specific regions of open reading frames (ORFs). The ISSR and SRAP markers have proven their effectiveness for genetic diversity studies, variety identification, genetic map construction, localization, and cloning fruit tree genes. One study determined the relationships and genetic structures of 48 jujube cultivars derived from seven geographical regions of northern China using ISSR markers, and it was believed that there was a correlation between the genetic relationships between cultivars and their origins[6]. The high level of variation between Turkish apples can also be shown using the ISSR marker[7]. SRAP was used to evaluate the genetic diversity of wild Chinese persimmon species and foreign cultivars, indicating that different persimmon genera have broad genetic backgrounds and various origins[8]. The ISSR and SRAP markers have been used for cultivar identification in peaches. Sharma & Sharma[9] utilized the ISSR marker to analyze 45 peach cultivars and assess the value and magnitude of genetic divergence, confirming that it had validity in assessing genetic diversity in peach germplasms. The SRAP marker was employed to assess the biological and botanical characteristics of the 'Kawanakajima' peach and its bud variant line[10]. ISSR and SRAP stably amplified specific bands in the genome of the 'Piqiu' peach (white flesh) and its natural mutant (yellow flesh), proving that there was a small difference at the DNA level and that the yellow-flesh mutant budded from this peach variety[11]. Our previous results showed that the SRAP molecular marker can identify genetic relationships in late-mature peach varieties more effectively than the ISSR marker, showing that the 'Weiduanmihong' variety was a bud mutation of 'Yihong'[12].
In this study, the ISSR and SRAP markers were applied to elucidate genetic diversity and genetic relationship information from late-mature peach varieties in Fujian Province, China. Our objectives were as follows: (1) to access the genetic diversity and relationships between late-mature peach varieties to provide appropriate germplasm management and clonal identification at field breeding stations and (2) to evaluate the usefulness of the ISSR and SRAP markers in identifying the closest-related late-mature peach cultivars.
-
Thirty-nine samples were collected from eight sites in Fujian Province and Hunan Province during the spring and summer of 2019 (Supplemental Table S1). To ensure the reliability of sampling, 30 young leaves were randomly collected from the peach trees. The samples were carefully placed in a ziplock bag (280 mm × 400 mm, 0.03 mm thick, Heyuan Evergreen Plastic MFG. Co., Ltd., China), immediately placed in a foam box containing an ice pack, returned to the laboratory on the same day, and conserved at −20 °C for later use.
DNA extraction
-
Total genomic DNA was extracted following the CTAB method by Sun et al.[13]. The purity of the DNA was determined using a BioPhotometer and a nucleic acid protein analyzer. DNA with a ratio of absorbance (OD) of 260 nm/280 nm between 1.8 and 2.0, determined using an ultraviolet spectrophotometer (Eppendorf International Trade Co., Ltd.), was used for ISSR and SRAP amplification reactions. DNA samples were stored at −20 °C, and the quality was verified via electrophoresis on ethidium bromide stained with 1% agarose gel.
ISSR-PCR amplification
-
The optimum ISSR-PCR reaction system (20 μL) includes 10 μL of 2×easy taq PCR Super Mix (+ dye) (TransGen Biotech, Beijing, China), 0.3 μmol/L ISSR primers (Fuzhou Shangya Biotechnology Co., Ltd., Fuzhou, China), 50 ng/μL genomic DNA, adding up to 20 μL with ddH2O.
The PCR reaction was as follows: an initial denaturation step at 94 °C for 3 min, followed by 35 cycles of 94 °C for 30 s, annealing at 52 °C for 45 s (different ISSR primers may have different annealing temperatures), and 72 °C for 90 s; the final extension at 72 °C was held for 7 min. All amplified products were resolved on 1% agarose electrophoresis in 1× TAE buffer and then stained. The images were acquired using a JS-3000 automatic gel imaging analyzer (Peiqing Technology Co., Ltd., Shanghai, China).
SRAP-PCR amplification
-
The optimum SRAP-PCR reaction system (25 μL) included 12.5 μL of 2×easy taq PCR Super Mix (+ dye) (TransGen Biotech, Beijing, China), 0.5 μmol/L primers (Fuzhou Shangya Biotechnology Co., Ltd., Fuzhou, China), 80 ng/μL genomic DNA, adding up to 25 μL with ddH2O.
The PCR reaction was as follows: initial denaturation at 94 °C for 5 min followed by 5 cycles of denaturation at 94 °C for 1 min; annealing at 35 °C for 1 min and extension at 72 °C for 1 min; for the next 35 cycles, denaturation at 94 °C for 1 min, annealing at 50 °C for 1 min, and extension at 72 °C for 1 min; and a final extension step at 72 °C for 10 min. All amplified products were resolved on 1.5% agarose electrophoresis in 1× TAE buffer and then stained. The images were acquired using a JS-3000 automatic gel imaging analyzer (Peiqing Technology Co., Ltd., Shanghai, China).
Data analysis
-
The band patterns obtained with each ISSR and SRAP primer were scored as absent (0) or present (1). Only clear, reproducible bands were scored. The values were recorded using Microsoft Excel 2010 (Microsoft Co, Washington, USA). Genetic similarity between accessions was evaluated by calculating the Dice similarity coefficient, and cluster analysis was performed using the UPGMA (Unweighted Pair Group Method of Arithmetic Means) algorithm. A dendrogram was then produced based on the Dice similarity matrices for each marker type to investigate relationships between genotypes using the NTSYS-PC software package[13].
-
A total of 55 ISSR primers (Supplemental Table S2) were screened initially in three representative samples from the 39 accessions, which were designed by the University of British Columbia (UBC set No. 9) in Canada[14−18]. Figure 1 showed the ISSR-PCR electrophoretogram for the 55 primers.

Figure 1.
ISSR-PCR electrophoretogram with 55 ISSR primers of the 'Okubao' peach. Note: M: DNA Marker; 1-55: UBC807, UBC808, UBC809, UBC810, UBC811, UBC812, UBC815, UBC816, UBC817, UBC818, UBC820, UBC823, UBC824, UBC825, UBC826, UBC827, UBC829, UBC830, UBC834, UBC835, UBC836, UBC837, UBC840, UBC841, UBC842, UBC843, UBC844, UBC845, UBC846, UBC847, UBC848, UBC849, UBC850, UBC851, UBC853, UBC854, UBC855, UBC856, UBC857, UBC861, UBC862, UBC864, UBC865, UBC866, UBC867, UBC873, UBC874, UBC876, UBC880, UBC881, UBC888, UBC889, UBC890, UBC891, UBC895.
In total, 12 forward primers combined with 14 reverse-primer crossover trials were used to screen the primer pair[5, 19−20]; 168 pairs of SRAP-labeled PCR amplification primers were randomly combined using a forward primer and reverse primer (Supplemental Table S3). Figure 2 showed the SRAP-PCR electrophoretogram for the 168 primers.
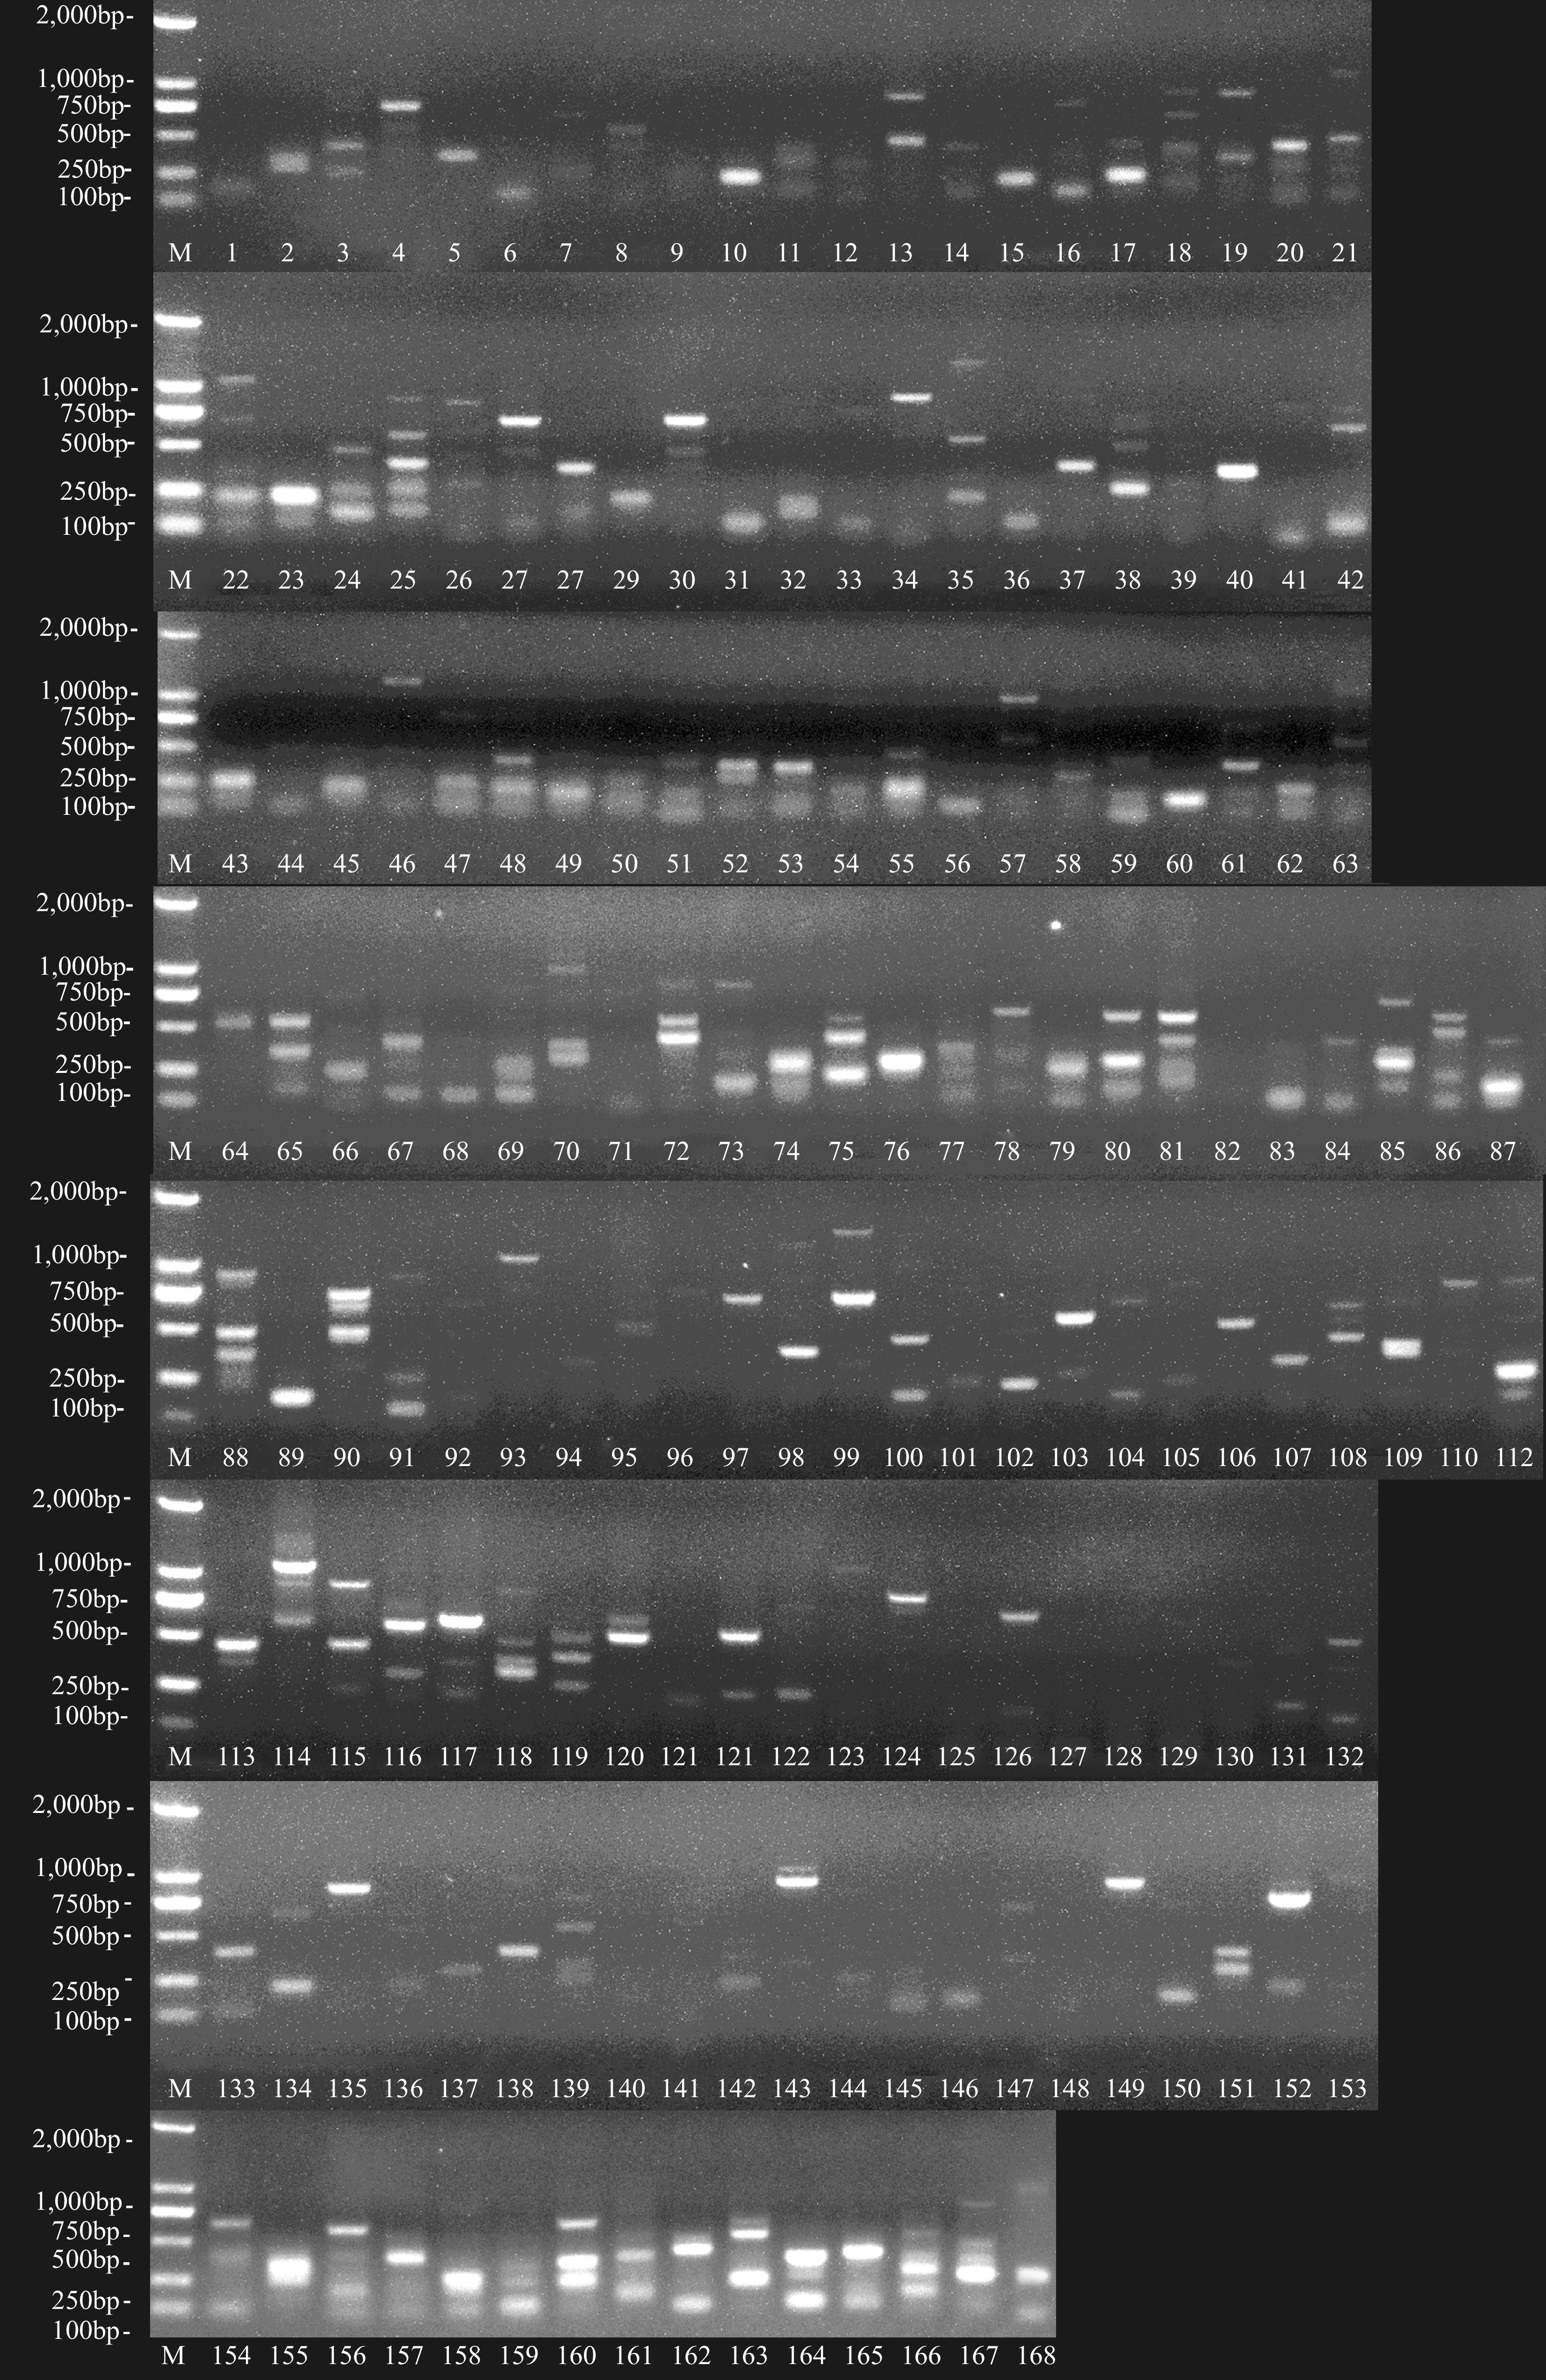
Figure 2.
PCR electrophoretogram with different SRAP primers of the 'Okubao' peach. Note: M: DNA Marker; 1-87: me1/em1, me1/em2, me1/em3, me1/em4, me1/em5, me1/em6, me1/em7, me1/em8, me1/em9, me1/em10, me1/em11, me1/em17, me1/em18, me1/em19, me2/em1, me2/em2, me2/em3, me2/em4, me2/em5, me2/em6, me2/em7, me2/em8, me2/em9, me2/em10, me2/em11, me2/em17, me2/em18, me2/em19, me3/em1, me3/em2, me3/em3, me3/em4, me3/em5, me3/em6, me3/em7, me3/em8, me3/em9, me3/em10, me3/em11, me3/em17, me3/em18, me3/em19, me4/em1, me4/em2, me4/em3, me4/em4, me4/em5, me4/em6, me4/em7, me4/em8, me4/em9, me4/em10, me4/em11, me4/em17, me4/em18, me4/em19, me5/em1, me5/em2, me5/em3, me5/em4, me5/em5, me5/em6, me5/em7, me5/em8, me5/em9, me5/em10, me5/em11, me5/em17, me5/em18, me5/em19, me6/em1, me6/em2, me6/em3, me6/em4, me6/em5, me6/em6, me6/em7, me6/em8, me6/em9, me6/em10, me6/em11, me6/em17, me6/em18, me6/em19, me7/em1, me7/em2, me7/em3, me7/em4, me7/em5, me7/em6, me7/em7, me7/em8, me7/em9, me7/em10, me7/em11, me7/em17, me7/em18, me7/em19, me8/em1, me8/em2, me8/em3, me8/em4, me8/em5, me8/em6, me8/em7, me8/em8, me8/em9, me8/em10, me8/em11, me8/em17, me8/em18, me8/em19, me9/em1, me9/em2, me9/em3, me9/em4, me9/em5, me9/em6, me9/em7, me9/em8, me9/em9, me9/em10, me9/em11, me9/em17, me9/em18, me9/em19, me10/em1, me10/em2, me10/em3, me10/em4, me10/em5, me10/em6, me10/em7, me10/em8, me10/em9, me10/em10, me10/em11, me10/em17, me10/em18, me10/em19, te1/em1, te1/em2, te1/em3, te1/em4, te1/em5, te1/em6, te1/em7, te1/em8, te1/em9, te1/em10, te1/em11, te1/em17, te1/em18, te1/em19, mo1/em1, mo1/em2, mo1/em3, mo1/em4, mo1/em5, mo1/em6, mo1/em7, mo1/em8, mo1/em9, mo1/em10, mo1/em11, mo1/em17, mo1/em18.
In this study, 18 ISSR primers and 18 SRAP primers were selected, which produced clear and repeatable fragments for variety identification and genetic relationship analysis (Supplemental Table S4).
ISSR and SRAP polymorphisms
-
As noted, 18 ISSR primers were selected for cultivar identification and genetic relationship analysis in this study. Supplemental Table S4 showed a total of 123 bands with an average of 6.83 were screened out from the 39 late-mature peach cultivars, among which, 86 were polymorphic, yielding a polymorphism rate of 70.09%. The number of polymorphic bands varied from 1 (UBC835) to 8 (UBC880). The amplification results of primer UBC812 were shown in Fig. 3. The results showed that the genetic diversity of late-mature peach resources in Fujian Province was rich, and the genetic differences between individuals were large. The ISSR marker was suitable for determining the genetic diversity of late-mature peach resources.
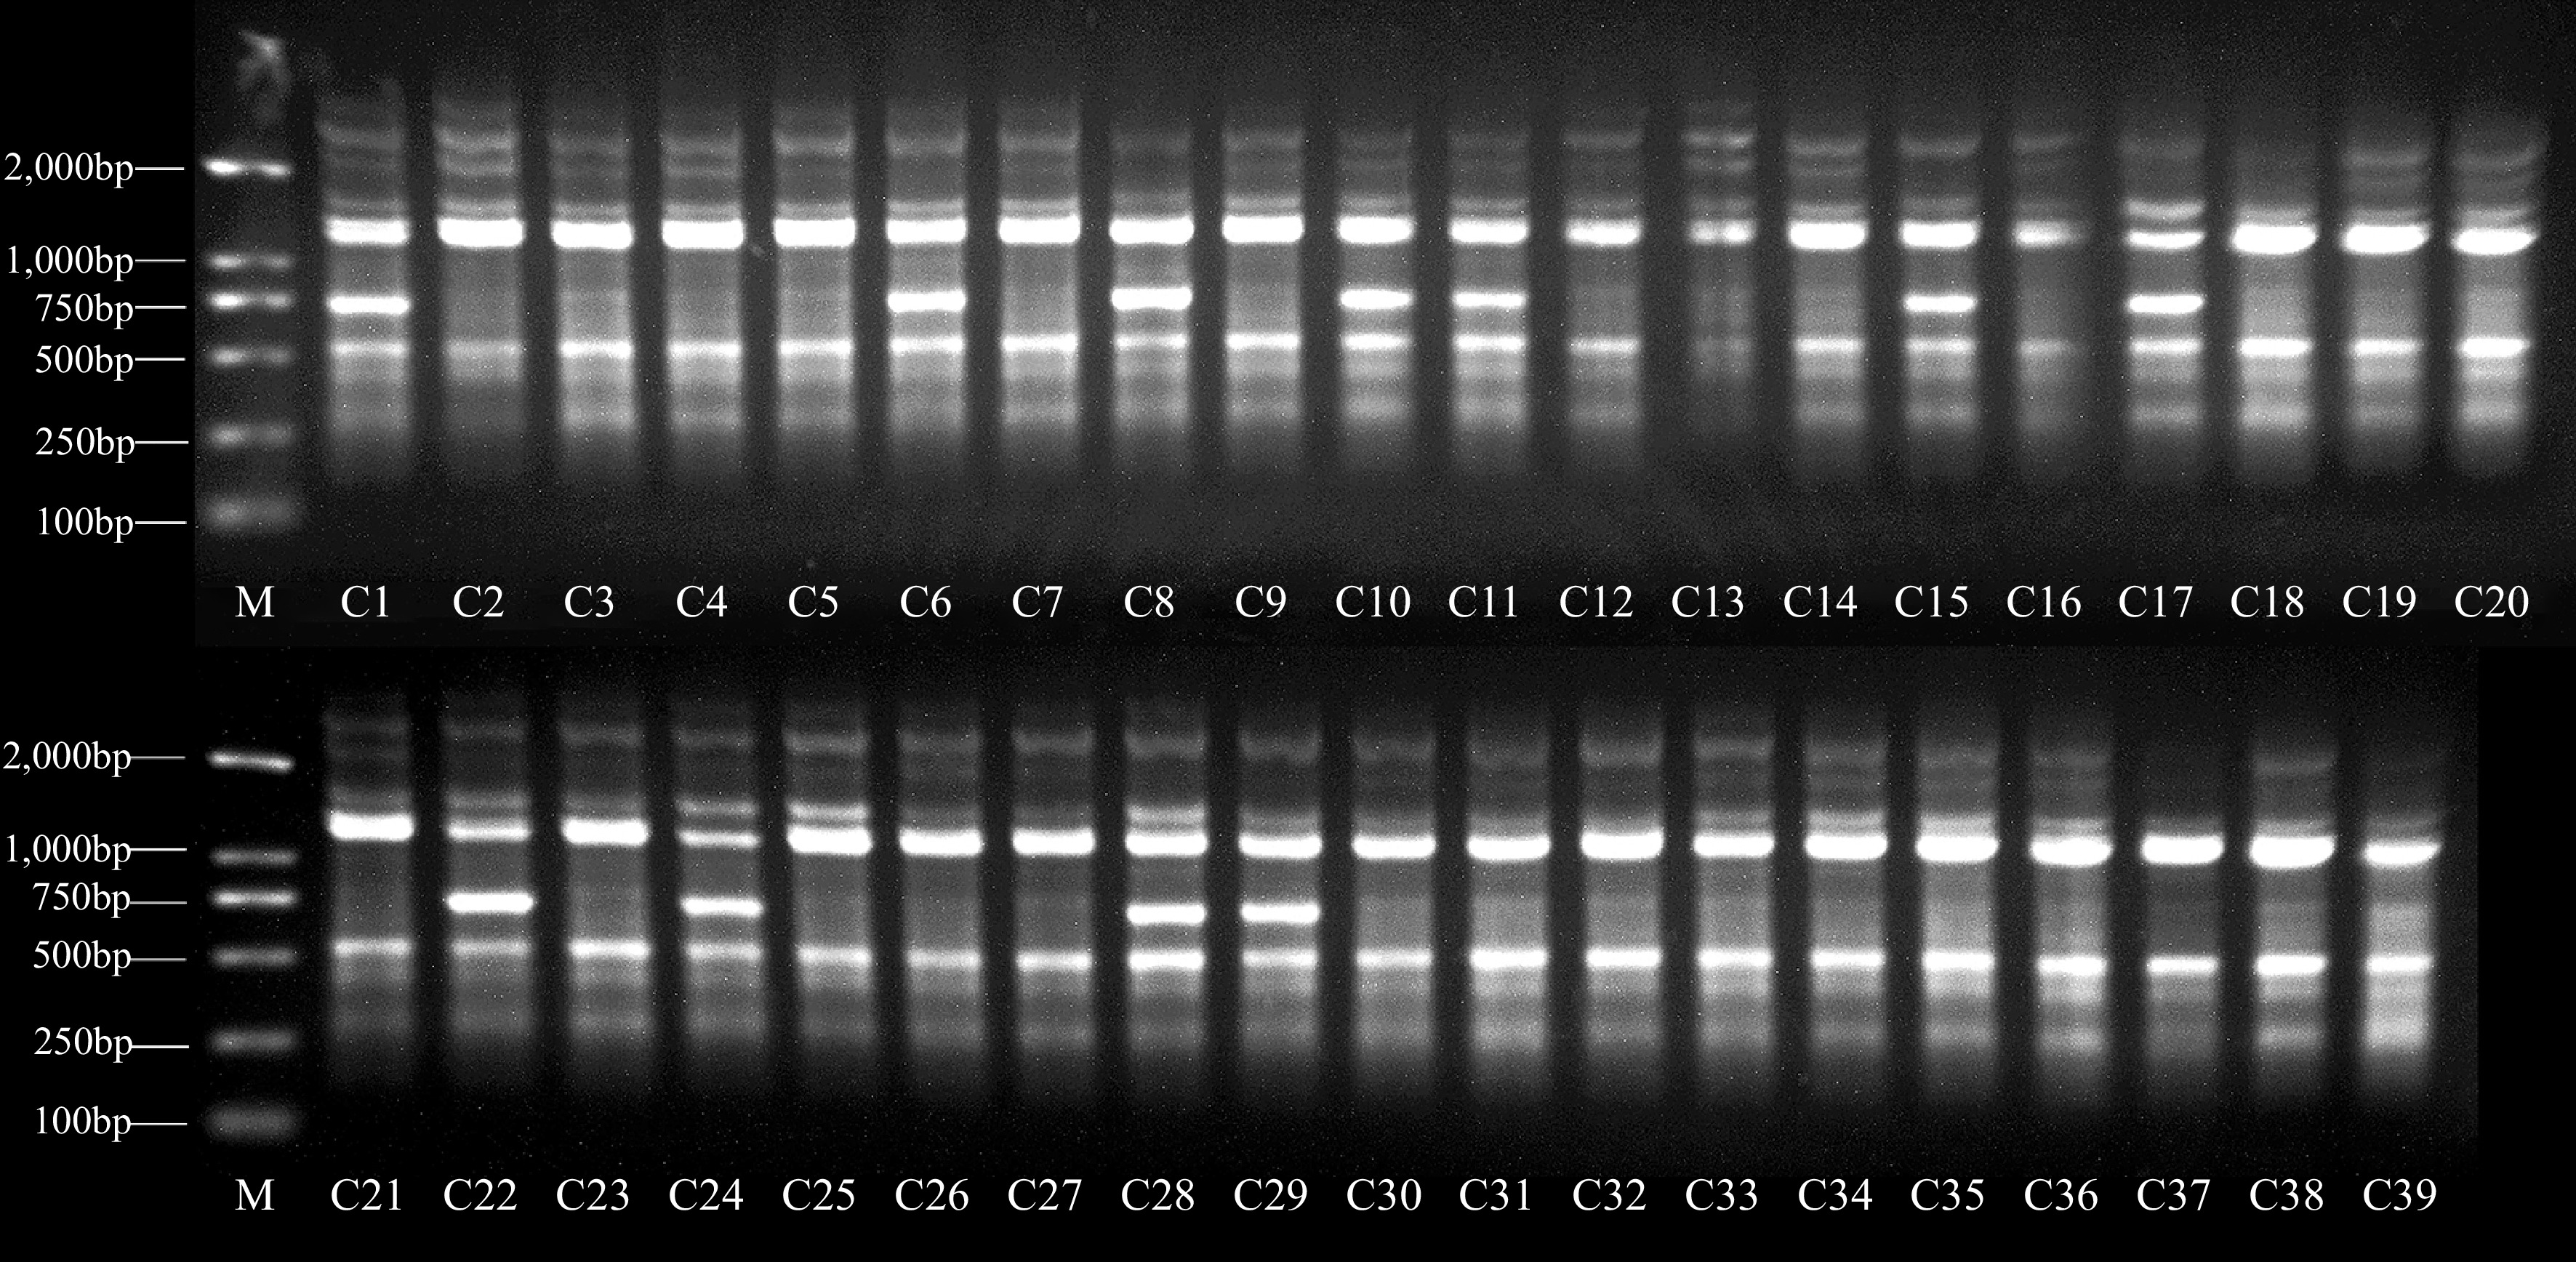
Figure 3.
Electrophoretic profiles of genomic DNA amplification products using ISSR primer UBC812. The numbers in the figure correspond to the numbers listed in Supplemental Table S1.
Eighteen SRAP primers that generate high polymorphic bands were chosen for genetic diversity analysis, and a total of 90 bands were generated by these 18 primers, ranging from 3 (me1/em6, me5/em6, me9/em8, and me9/em11) to 9 (me2/em11). Of the 90 bands produced, 66 (73.33%) were polymorphic. The above results were showed in Supplemental Table S4. The amplification results of primer me2/em11 were shown in Fig. 4. Although the total number of bands in SRAP was smaller than in the ISSR marker, the polymorphism of SRAP marker bands was higher than those of the ISSR marker. These results suggested that the SRAP marker was also suitable for determining the genetic diversity of late-mature peach resources.
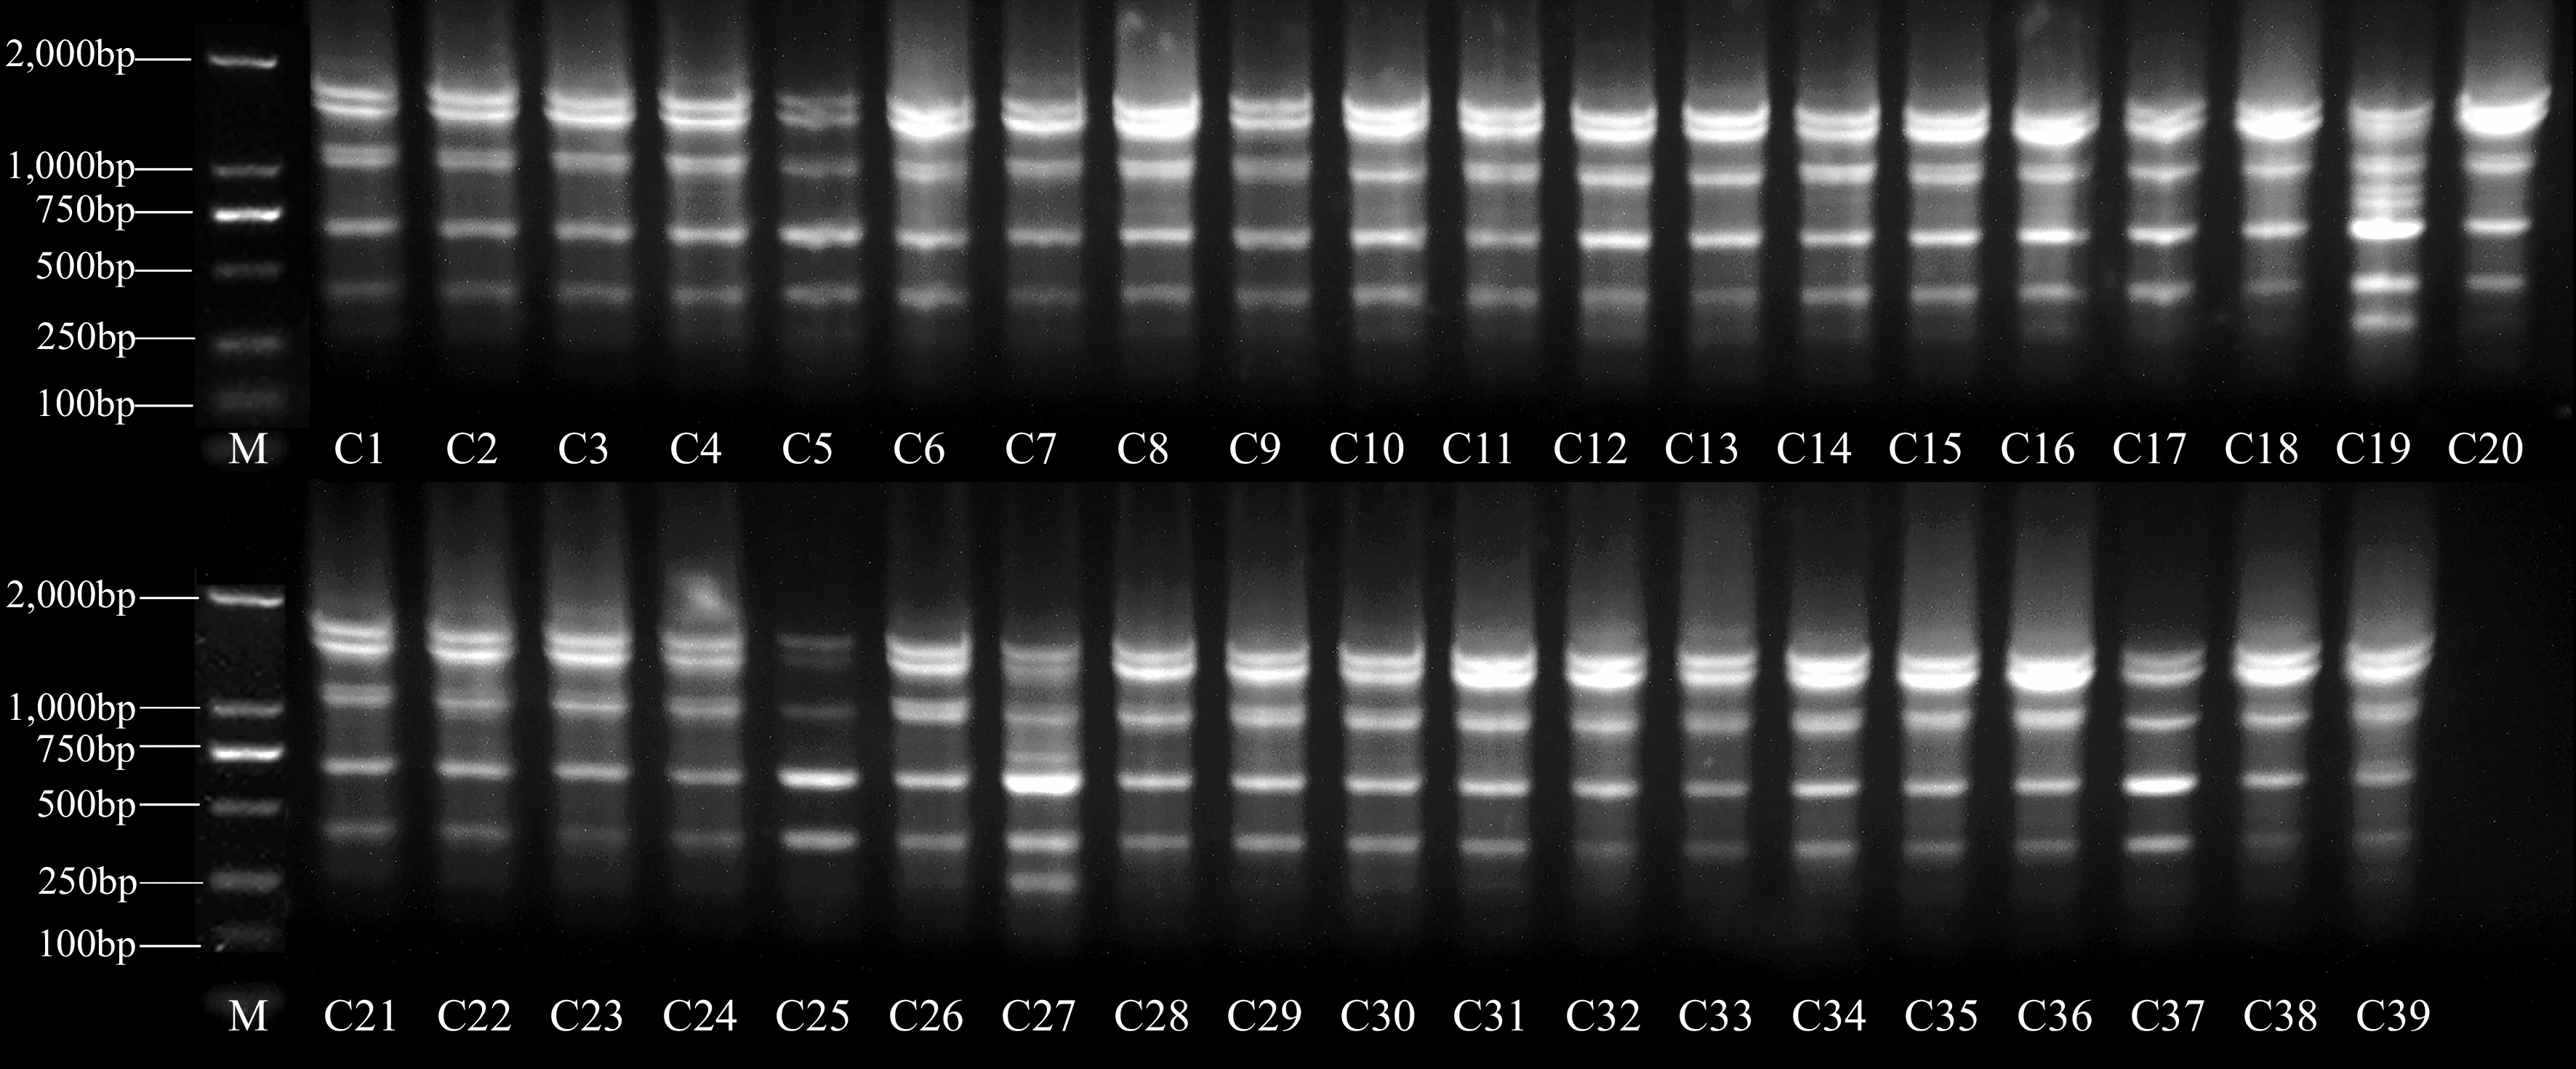
Figure 4.
Electrophoretic profiles of genomic DNA amplification products using SRAP marker me2/em11. The numbers in the figure correspond to the numbers listed in Supplemental Table S1.
Figures 3 & 4, Supplemental Figs S1−S4 showed that there was no single ISSR or SRAP primer to distinguish all late-mature peach cultivars independently. Furthermore, the results showed that ISSR and SRAP markers could effectively reveal polymorphisms between late-mature peach materials, which indicated the presence of high genetic diversity between late-mature peach germplasms.
Analysis of ISSR marker
-
The ISSR marker (Fig. 5) had a similarity coefficient ranging from 0.61 to 0.90, indicating substantial diversity in the germplasm. A maximum similarity coefficient of 0.90 was observed between C12 'Weiduanmihong' and C32 'Weiduanmihong' and a minimum of 0.61 was observed in C37 'Linkui 1' and the rest of the genotypes. A cluster tree analysis obtained after pooled ISSR analysis showed that germplasm C37 'Linkui 1' was far removed from other germplasms.

Figure 5.
Dendrogram obtained after pooled ISSR analysis of late-mature peach germplasms. The numbers in the figure correspond to the numbers listed in Supplemental Table S1.
The pairwise similarity coefficient heatmap obtained using the combination of both ISSR markers ranged from 0.5408 to 0.8953, with an average of 0.6971 (Fig. 6). A maximum similarity coefficient of 0.8953 was observed between C12 'Weiduanmihong' and C32 'Weiduanmihong', and a minimum of 0.5408 was observed in C10 'Zhongtao 5' and C37 'Linkui 1', which indicated that C12 'Weiduanmihong' from YKY had a close relationship with C32 'Weiduanmihong' from WD, but its genetic relationship with C10 'Zhongtao 5' and C37 'Linkui 1' was the furthest. Thus, significant genetic variation has occurred between C10 'Zhongtao 5' and C37 'Linkui 1'.
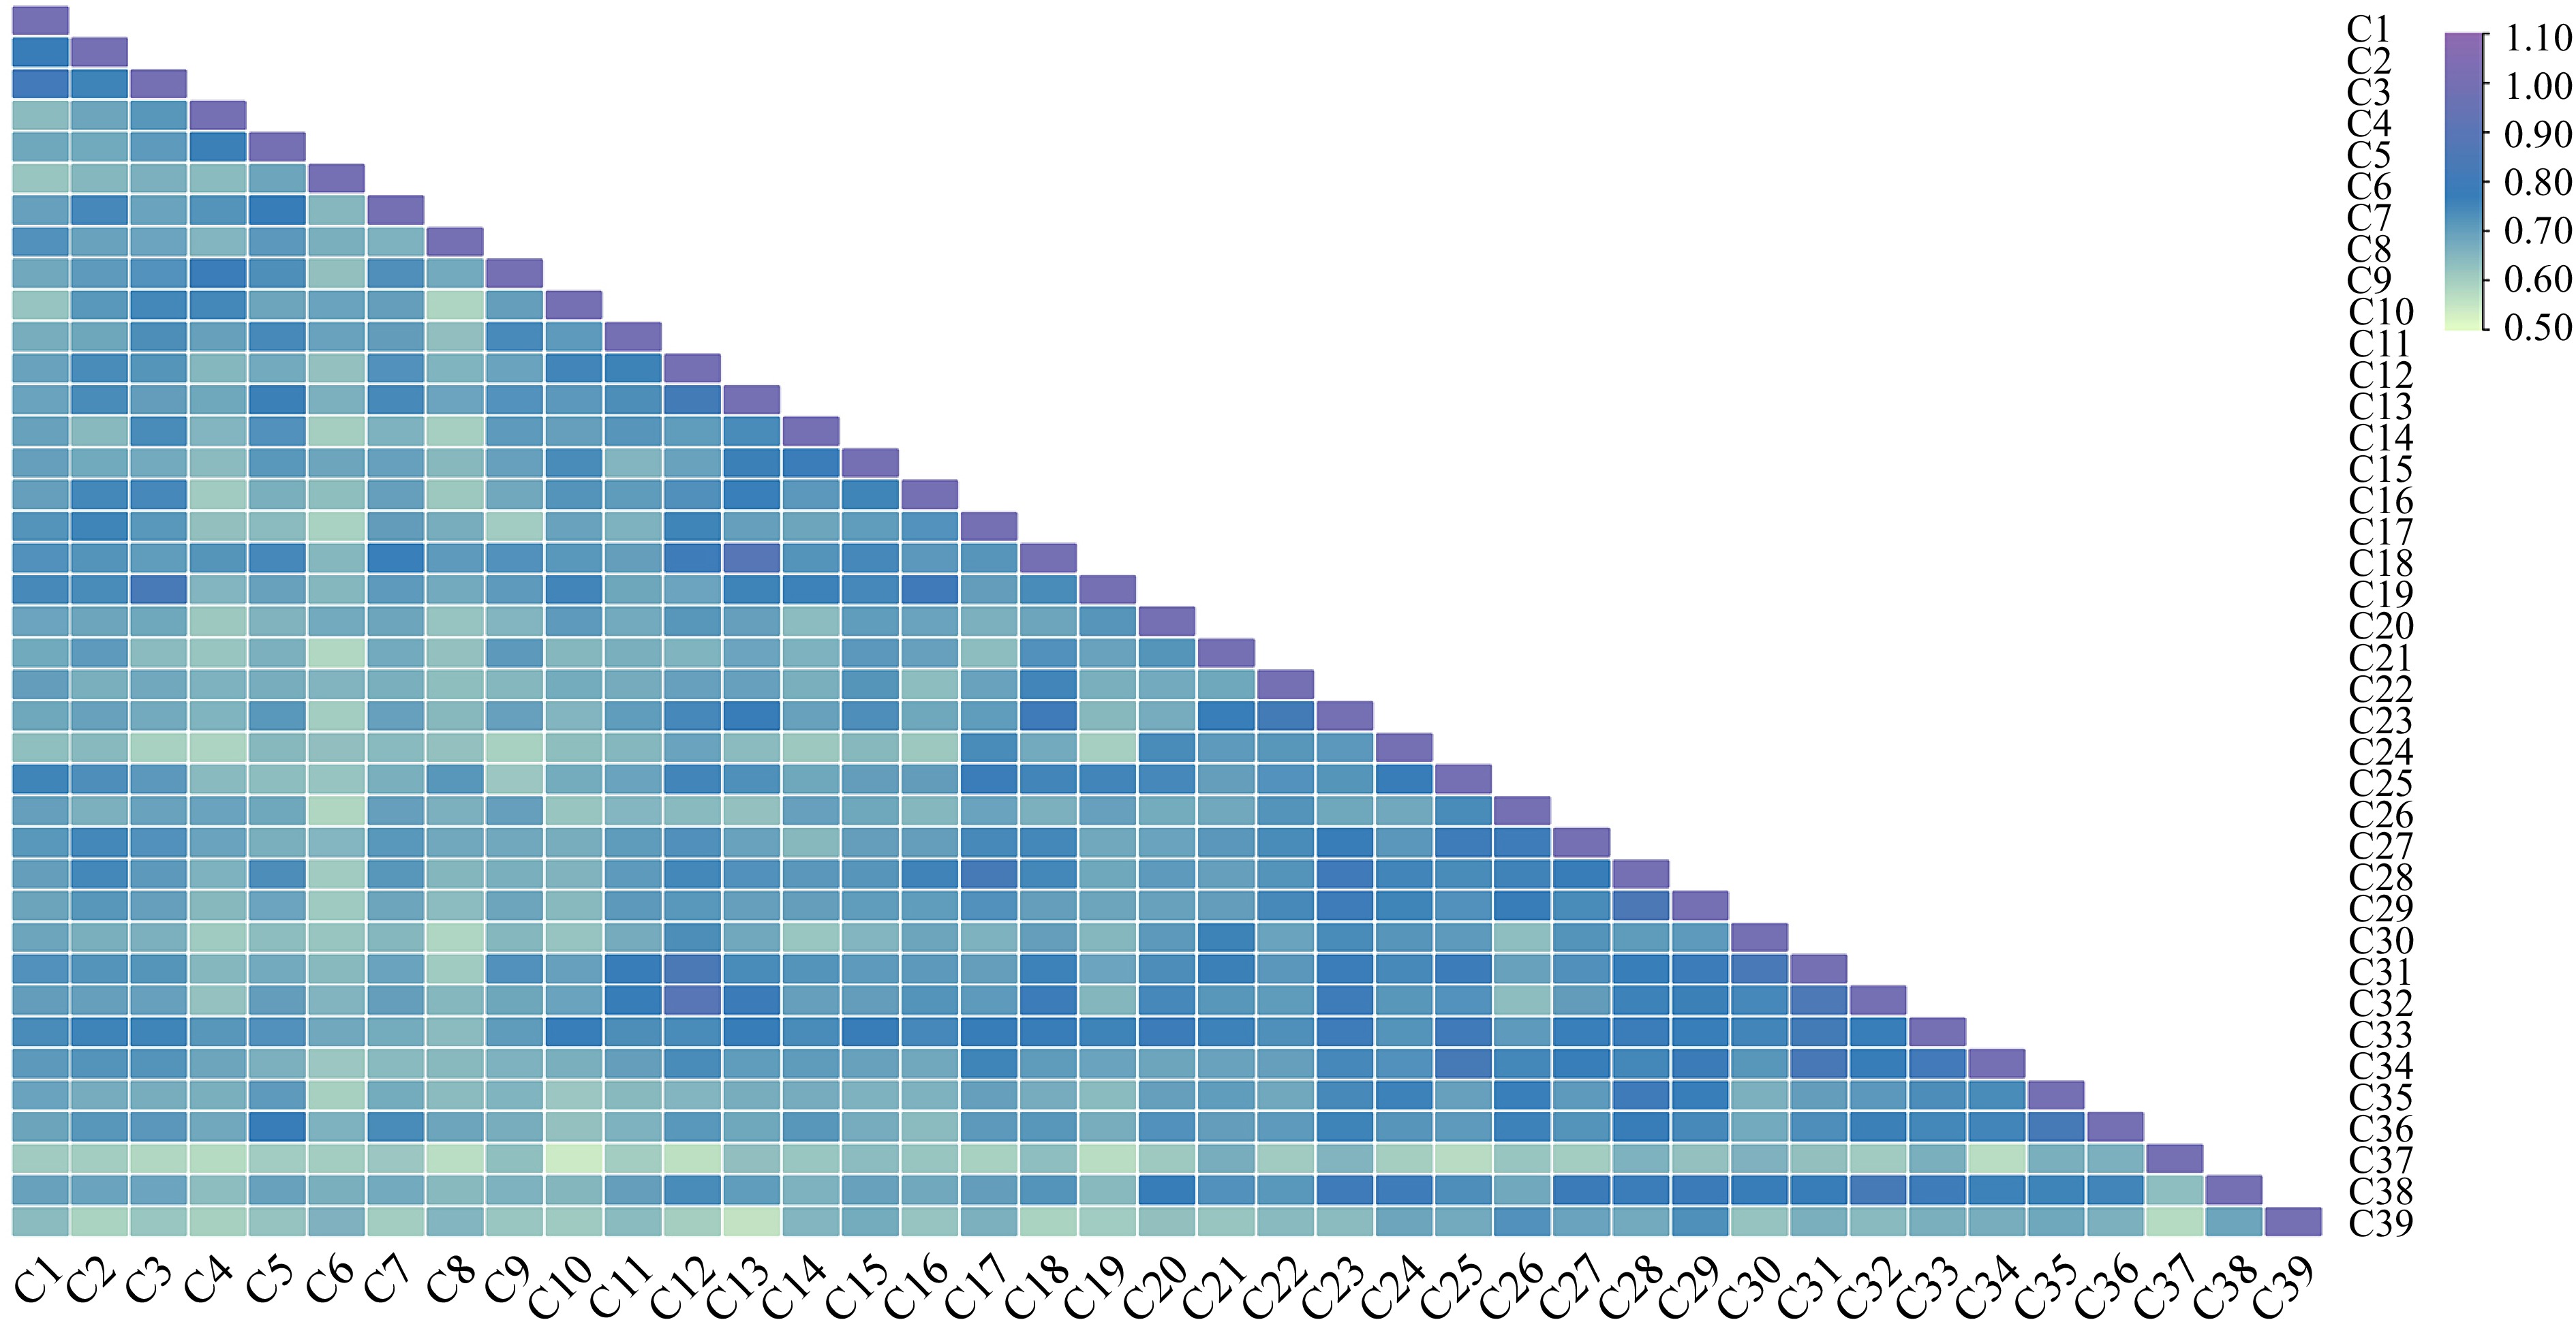
Figure 6.
Genetic similarity coefficient heatmap of 39 late-mature peach germplasm based on ISSR markers. The numbers in the figure represent different late-mature peach germplasms in Supplemental Table S1.
Analysis of SRAP marker
-
The SRAP marker (Fig. 7) showed that the similarity coefficient ranged from 0.63 to 0.91, indicating substantial diversity present in the germplasm. A maximum similarity coefficient of 0.91 was observed between C31 'Weiduanmihong' and C32 'Weiduanmihong', and a minimum of 0.63 was observed in C35 'Qinhuang 2', C36 'Xianghuang', C39 'Yonglian No.1', and the rest of the genotypes. The cluster tree analysis obtained after the pooled SRAP analysis showed that germplasms C35, C36, and C39 were far removed from the other germplasms.

Figure 7.
Dendrogram obtained after pooled SRAP analysis of late-mature peach germplasms. The numbers in the figure correspond to the numbers listed in Supplemental Table S1.
The pairwise similarity coefficient heatmap obtained using the combination of both ISSR markers ranged from 0.5352 to 0.9063, with an average of 0.6945 (Fig. 8). A maximum similarity coefficient was observed between C31 'Weiduanmihong' and C32 'Weiduanmihong', and a minimum was observed in C2 'Baili' and C36 'Xianghuang', which indicated that C31 from WD had a close relationship with C32 from WD, and its genetic relationship with C2 and C36 was the furthest. Thus, significant genetic variation had occurred between C2 and C36.

Figure 8.
Genetic similarity coefficient heatmap of 39 late-mature peach germplasms based on SRAP markers. The numbers in the figure represent different late-mature peach germplasms in Supplemental Table S1.
Pooled Analysis of ISSR and SRAP Studies
-
The pooled ISSR and SRAP studies (Fig. 9) showed that the similarity coefficient ranged from 0.65 to 0.89, indicating substantial diversity present in the germplasms. A maximum similarity coefficient of 0.89 was observed between C12 'Weiduanmihong' and C32 'Weiduanmihong', and a minimum of 0.65 was observed in C6 'Huangjin-mitao 5' and the rest of the genotypes. The cluster tree analysis obtained after the pooled ISSR and SRAP analysis showed that the 39 peach genotypes could be grouped into two major clusters, one comprising 38 genotypes, and the other comprising C6 'Huangjin-mitao 5' (Fig. 9). Germplasm C6 'Huangjin-mitao 5' was far removed from the other germplasms.

Figure 9.
Dendrogram obtained after pooled ISSR and SRAP analysis of late-mature peach germplasms. The numbers in the figure correspond to the numbers listed in Supplemental Table S1.
The pairwise similarity coefficient heatmap obtained using the combination of both ISSR and SRAP markers ranged from 0.5767 to 0.8926, with an average of 0.6957 (Fig. 10). A maximum similarity coefficient of 0.8926 was observed between C12 'Weiduanmihong' and C32 'Weiduanmihong', and a minimum of 0.5767 was observed in C6 'Huangjinmitao 5' and C26 'Tiantao', which indicated that C12 'Weiduanmihong' from YKY had a close relationship with C32 'Weiduanmihong' from WD, and its genetic relationship with C6 'Huangjinmitao 5' and C26 'Tiantao' was the furthest. Thus, significant genetic variation had occurred between C6 'Huangjinmitao 5' and C26 'Tiantao'.
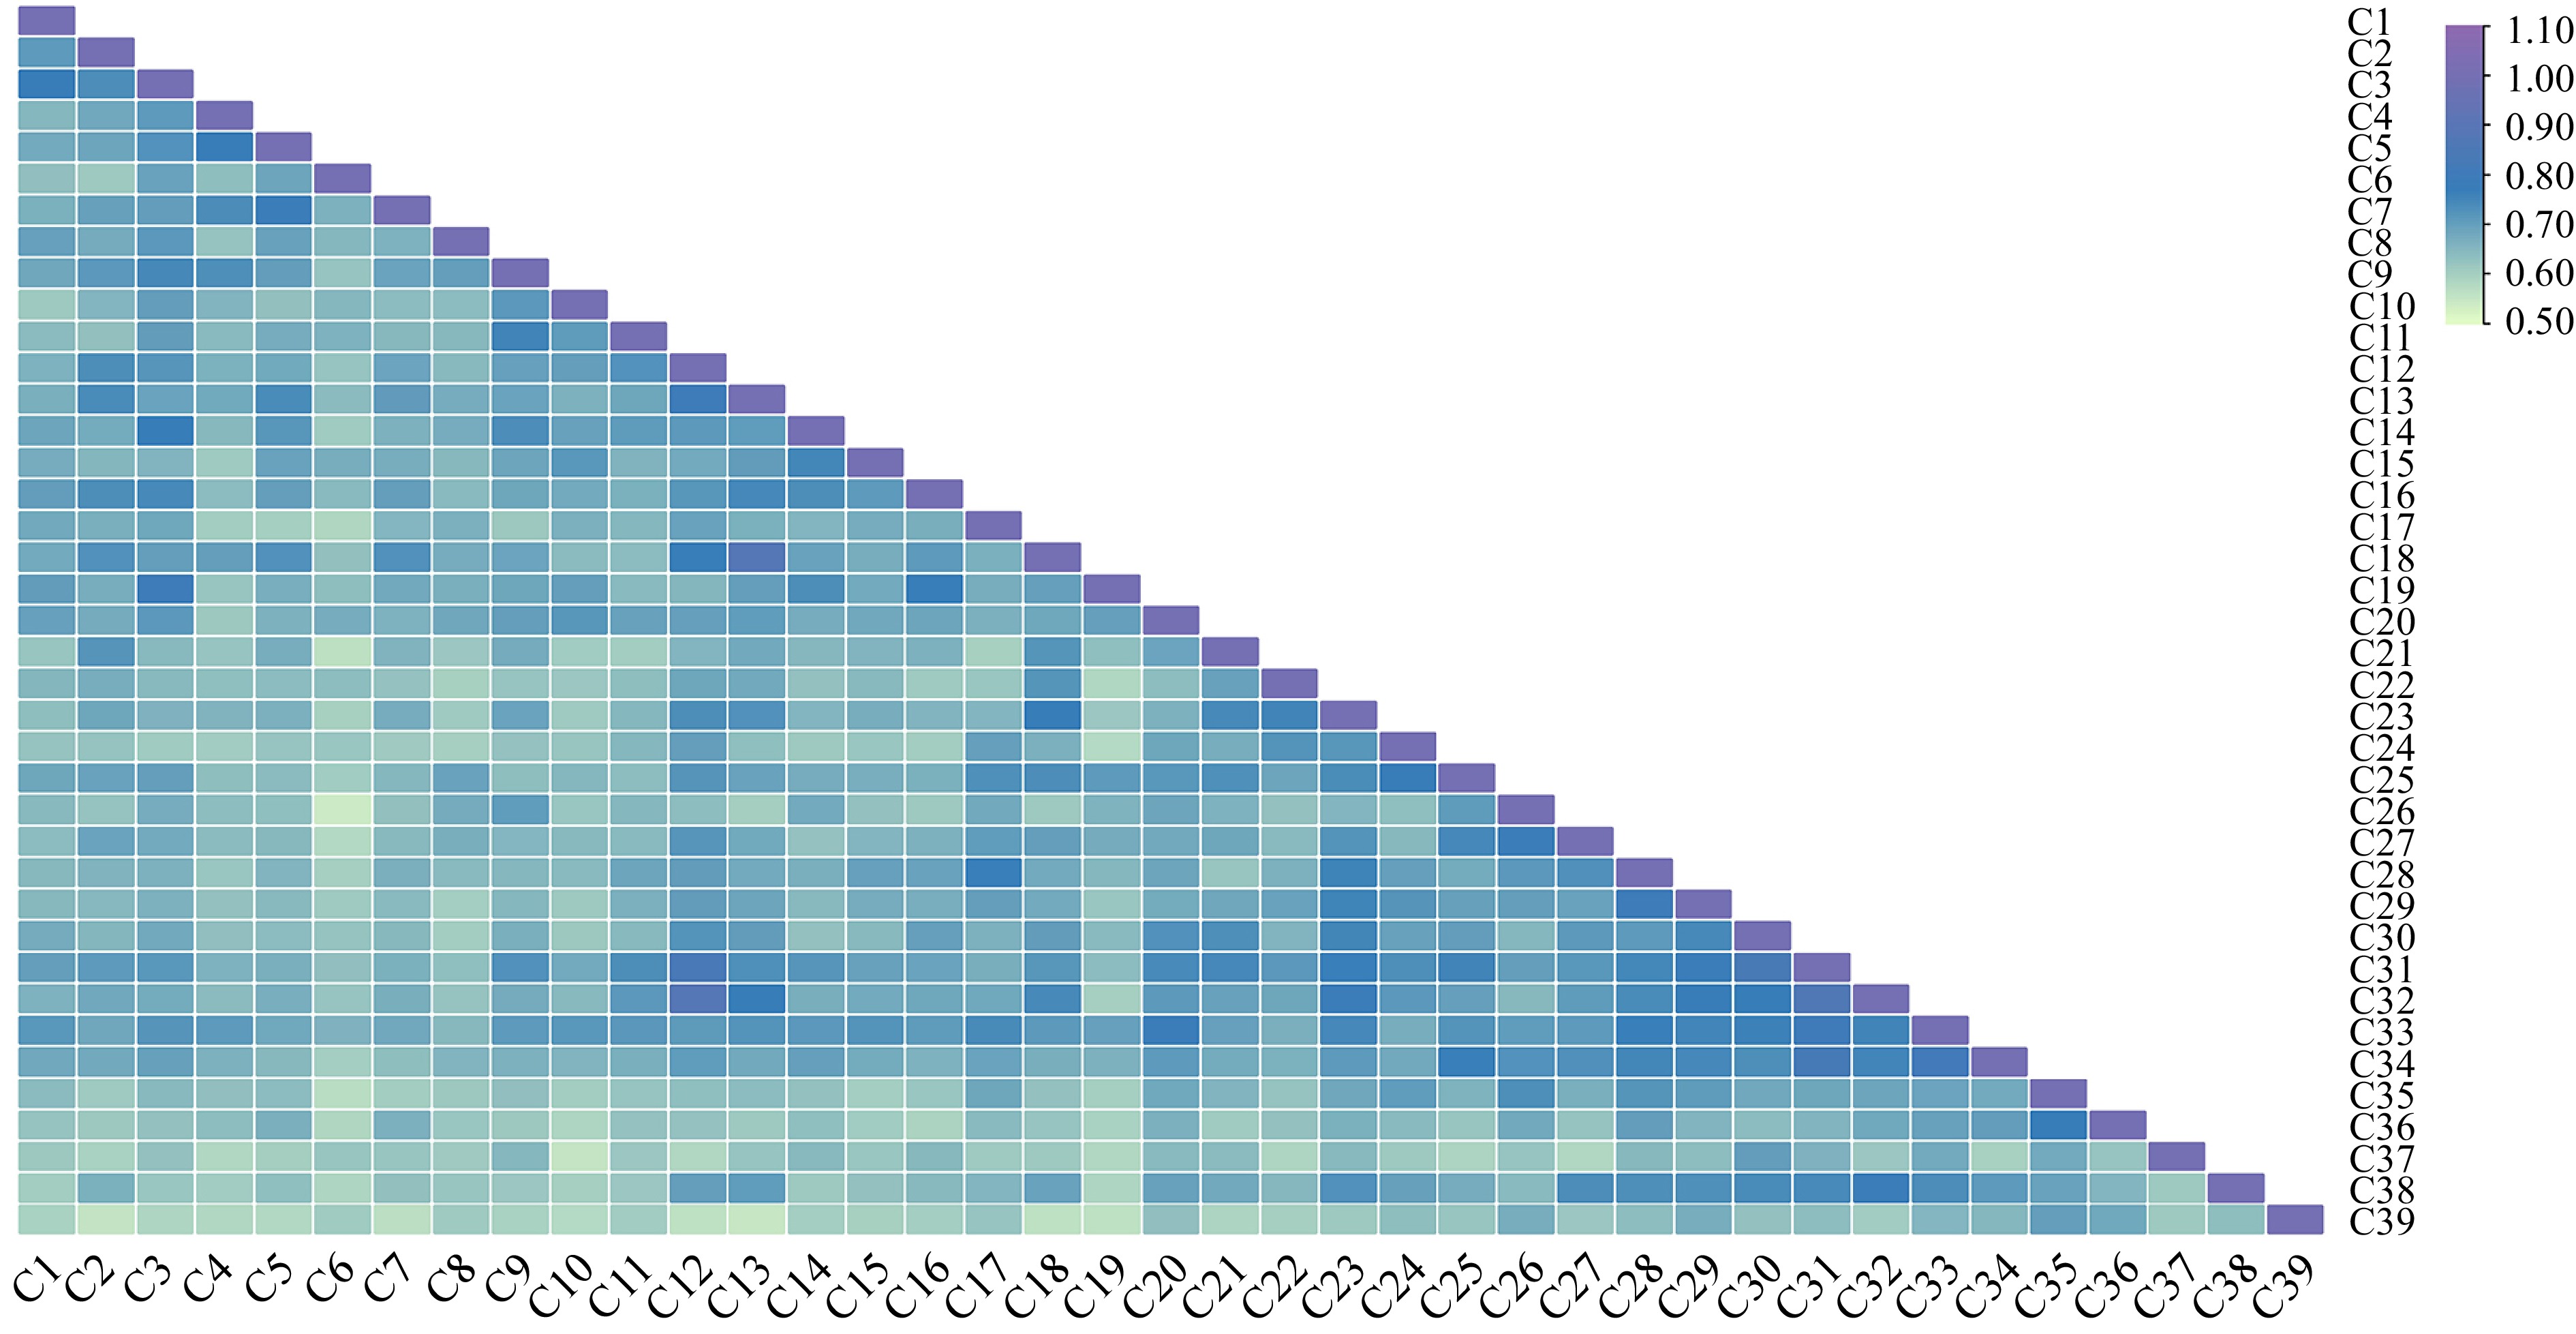
Figure 10.
Genetic similarity coefficient heatmap of 39 late-mature peach germplasms based on ISSR and SRAP markers. The numbers in the figure represent different late-mature peach germplasms in Supplemental Table S1.
-
Genetic diversity refers to the sum of genetic variation between populations or individuals within a population, reflecting the genetic background, genetic differentiation, and breeding potential of a species[21]. Molecular marker technology is a robust approach to studying the genetic diversity of crop germplasm resources[22]. Studies have shown that the ISSR molecular marker could overcome the shortcomings of the RAPD and SSR markers[3, 23], and that SRAP combines the advantages of RAPD and AFLP markers[24]. ISSR and SRAP markers have the advantages of simplicity, rapidity, high stability, good repeatability, relatively low cost, and rich polymorphism, making them suitable for genetic diversity analyses[25]. In a previous study, ISSR and SRAP molecular markers have been used for cultivar identification in peaches. Based on 20 SSR and 49 SRAP polymorphic fragments, the relationship among the 38 peach and nectarine cultivars was represented by the UPGMA dendrogram, with the nectarine cultivars being interspersed among the peach cultivars[20]. Additionally, SSR and SRAP molecular markers have been used for the grouping and identification of peach and nectarine cultivars, with SRAP protocols revealing more polymorphisms in peach cultivars than SSR marker[20]. Of the cultivars analyzed, more than 85% had a unique SRAP fingerprint, confirming which confirmed the high efficiency of this marker system for identifying genetic diversity in peach and nectarine cultivars[20]. A total of 132 useful markers were generated from 10 ISSR primers for 16 ornamental peach taxa, and using UPGMA, two different categories of peach taxa could be clustered at the coefficient level of 0.775[26]. These studies proved that the ISSR marker was represents a useful technique to reveal groups (different pedigrees and different growth habits) and genetic relationship among ornamental peach varieties. The pedigree prunus davidiana has been involved in the breeding and selection of ornamental peach cultivars, and these cultivars apparently have genetic distance from pure prunus persica cultivars[26]. Techniques using ISSR and SRAP molecular markers can also be applied to the identification and analysis of peach bud variation materials to provide a foundation for genetic analysis for the future breeding of new peach varieties[11, 12]. SSR primers were able to produce one or two discrete fragments in 'Beijing 28' and its bud-variant material, and 39 ISSR primers were able to amplify 314 bands, with a polymorphic percentage of 11.46%. ISSR showed higher polymorphism than SSR[14]. SRAP markers have been applied to analyze the genetic relationships among Taiwan precocious peach and its bud sport germplasm, 'May Red' peach. It was determined that 'May Red' showed polymorphic bands that were different from those of Taiwan precocious peach and were mutated at the DNA genetic level, indicating that this germplasm might belong to a new, especially early-mature germplasm resource[27]. ISSR and SRAP markers were applied to analyze 'Piqiu' peach and its mutant strains, 'Yihong' peach and 'Weiduanmihong', respectively. The primers stably amplified specific bands in the genome of 'Piqiu' peach and its mutant strain as well as in 'Yihong' peach and its mutant strain 'Weiduanmihong'[11,12]. The above proves the existence of DNA-level differences between the control group and the mutant strains[11,12]. In our study, 123 bands were amplified using 18 ISSR primers, with 6.83 bands per primer on average, and 90 bands were amplified using 18 SRAP primers with 5 bands per primer on average. The ISSR marker generated more bands than the SRAP marker. This difference may be because ISSR amplified the whole plant genome sequence, while SRAP amplified only the ORFs[4,5, 28]. ISSR and SRAP also had a higher percentage of polymorphic bands (PPB) in the 39 late-mature peach germplasms samples (ISSR = 70.09%; SRAP = 73.33%), indicating that both markers effectively revealed polymorphisms among the late-mature peaches and that the SRAP marker was more efficient in distinguishing differences between them. This was supported by Yan et al.[1] and Huang et al.[3], who found that genetic diversity revealed using the SRAP and ISSR markers is highly consistent.
The combination selection of different markers can cover the genome to the greatest extent, which is conducive to increasing the density and quality of the map[29]. The relationships based on the ISSR and SRAP molecular markers analysis had many similarities, such as clustering in 'Weiduanmihong' samples (C12, C31, and C32) from different places, clustering in 'Yihong' samples (C13 and C18) from different places, clustering C33 'Wanbaifeng' and C34 'Zhonghuashoutao' samples together, clustering C5 'Jinxiu' and C7 'Jinyuan' samples together, all of which indicates that the markers were effective. These results agreed with the views of Li et al.[30] and Mao et al.[31]. Li et al.[30] indicated that combinations of high-efficiency and -capacity ISSR and SRAP marker systems could be useful in discriminating apricot cultivars. In addition, the genetic diversity of various late-mature peach genotypes was investigated using ISSR and SRAP marker technologies, along with dendrogram construction. Our results showed that the similarity coefficient of the 39 late-mature peaches was as low as 0.65 and as high as 0.89, and the pairwise similarity coefficients ranged between 0.5767 and 0.8926, indicating that the collected peach samples had high genetic diversity. The genetic relationships between the 39 late-mature peach cultivars were analyzed by combining the ISSR and SRAP markers to avoid the limitations of a single marker. The UPGMA analysis showed that C6 'Huangjinmitao 5' was clustered in a single group, indicating that it had the furthest-removed genetic relationship from other cultivars. Ma et al.[28], Wang et al.[32], and Parthiban et al.[33] reported that their UPGMA analyses showed slightly different clustering patterns based on SRAP and ISSR, which might be related to a different portion of genomes amplified with different marker systems. Therefore, the combination of ISSR and SRAP markers could result in more comprehensive and accurate analyses of genetic relationships between accessions[34,35]. The similarity coefficient between C12 'Weiduanmihong' (Fujian Yikangyuan Farm Co., Ltd., 26.58° N, 118.75° E), C31 'Weiduanmihong' (WeiduanVillage, 26.58° N, 118.75° E), and C32 'Weiduanmihong' (WeiduanVillage, 26.58° N, 118.75° E) was largest of all (0.8560−0.8926), meaning there was a close relationship between the three; the similarity coefficient between C13 Zhijiang 'Yihong' (Hunan Province Kangruinong Ecological Agriculture Co., Ltd., 27.45° N, 109.68° E) and C18 Zhijiang 'Yihong' (Fujian Yikangyuan Farm Co., Ltd., 26.58° N, 118.75° E) was larger (0.8924) than the one between the other resources, which meant that C12 and C32 are the same peach germplasm, and C13 and C18 should be the same clone. Similar results were reported by Sun et al.[15].
-
ISSR and SRAP markers revealed low genetic diversity between different late-mature peach accessions from different regions of Fujian Province, indicating that there were rich late-mature peach germplasm resources in Fujian. Analyses of genetic diversity and genetic relationships between late-mature peach germplasms will help gather and select good-quality peach lines in the future. Our results showed that ISSR and SRAP were useful methods in detecting high genetic diversity in late-mature peach germplasms. The results will also provide technical support for the further construction of late-mature peach germplasm resources and provide a theoretical basis for their protection, breeding, and development.
-
The authors confirm contribution to the paper as follows: study conception and design: Ma C, Qiu D; data collection: Li W, Ma Y, Kou Y, Zeng Z; analysis and interpretation of results: Li W, Ma C, Qiu D; draft manuscript preparation: Li W, Ma C, Qiu D. All authors reviewed the results and approved the final version of the manuscript.
-
The datasets generated during the current study are available from the corresponding author on reasonable request.
This work was financially supported by the Fujian Provincial Natural Science Foundation Project (2022J01590), the National College Student Innovation Training Program (202210389036), and the Major Project of Industry–University Cooperation for the University in Fujian Province (2018N5004). The authors thank the teachers and students at the laboratory for their help and support during the experiment and article-writing process. We are also extremely grateful to the Gutian Mengxiangyuan Fruit Professional Cooperative, Gutian Natural Pantaoyuan Family Farm, Fujian Yikangyuan Farm Co., Ltd., Hunan Province Kangruinong Ecological Agriculture Co., Ltd., Fujian Feihu Agricultural Development Co., Ltd., and Nianqing Family Farm, who kindly provided large quantities of different peach varieties.
-
The authors declare that they have no conflict of interest.
- Supplemental Table S1 Name and sources of sampled plants and tree age of the leaf materials.
- Supplemental Table S2 ISSR primer sequence.
- Supplemental Table S3 SRAP primer sequence.
- Supplemental Table S4 Polymorphism detected using ISSR and SRAP primers in 39 late-mature germplasm accessions.
- Supplemental Fig. S1 Electrophoresis results of 39 late-mature peach germplasm resources amplified via ISSR primer UBC817.
- Supplemental Fig. S2 Electrophoresis results of 39 late-mature peach germplasm resources amplified via ISSR primer UBC855.
- Supplemental Fig. S3 Electrophoresis results of 39 late-mature peach germplasm resources amplified via SRAP primer me5/em3.
- Supplemental Fig. S4 Electrophoresis results of 39 late-mature peach germplasm resources amplified via SRAP primer me5/em6.
- Copyright: © 2023 by the author(s). Published by Maximum Academic Press, Fayetteville, GA. This article is an open access article distributed under Creative Commons Attribution License (CC BY 4.0), visit https://creativecommons.org/licenses/by/4.0/.
-
About this article
Cite this article
Li W, Ma Y, Kou Y, Zeng Z, Qiu D, et al. 2023. Analysis of genetic diversity and relationships between late-mature peach (Prunus persica L.) varieties assessed with ISSR and SRAP markers. Fruit Research 3:36 doi: 10.48130/FruRes-2023-0036 

Analysis of genetic diversity and relationships between late-mature peach (Prunus persica L.) varieties assessed with ISSR and SRAP markers
- Received: 06 May 2023
- Accepted: 04 September 2023
- Published online: 15 December 2023
Abstract: Molecular characterization of 39 late-mature peach (Prunus persica L.) accessions was carried out using ISSR (inter simple sequence repeats) and SRAP (sequence-related amplified polymorphism) markers to assess the value and magnitude of genetic divergence. The ISSR primers revealed 70.09% polymorphism and the SRAP marker generated 73.33% polymorphism. Pooled ISSR and SRAP, along with UPGMA clustering based on similarity coefficients, were estimated to assess the efficiency of the marker system in peaches. Similarity coefficients between accessions regarding the ISSR and SRAP markers ranged from 0.65 to 0.89, indicating a broad genetic peach base. A maximum similarity coefficient of 0.89 was observed between C12 'Weiduanmihong' (Fujian Yikangyuan Farm Co., Ltd., 26.58° N, 118.75° E) and C32 'Weiduanmihong' (WeiduanVillage, 26.58° N, 118.75° E), and a minimum of 0.65 was observed in C6 'Huangjinmitao 5' (Gutian Natural Pantaoyuan Family Farm, 26.58° N, 118.75° E) and the rest of the genotypes. The present study found that a high level of polymorphism indicated their applicability in framing more extensive studies to develop superior progeny, conduct molecular breeding, investigate genetic population diversity, make comparative maps, select parents, etc., in various peach crop improvement programs.
-
Key words:
- Late-mature peach germplasm resources /
- ISSR /
- SRAP /
- Genetic diversity