


-
Millions of people worldwide struggle with food insecurity and hunger, a problem exacerbated by the ongoing effects of COVID-19[1,2]. To secure global food supplies by 2050, it is estimated that average crop production must increase by approximately 60%[3,4]. One way to address this challenge is to increase crop yield per unit area of land, thereby reducing the pressure of sustained population growth without expanding agricultural land. Innovations in germplasm resources, such as ideotype breeding or plant architecture modifications, can increase productivity and meet the rapidly growing demand for food grain production[5,6]. For instance, the Green Revolution increased the yield of crop species such as wheat, rice, and maize through the introduction of semi-dwarf traits[6,7]. Semi-dwarf breeding to increase yield potential is a type of ideotype breeding or modification of plant architecture[8]. Developing an ideal rice architecture with a smaller tiller number and more grains per panicle has been proposed as a means to increase rice yield potential[9,10]. In addition, heterosis breeding has been utilized to enhance rice yield potential, creating rice hybrids with 10%–20% higher yields than conventional varieties, which have been grown commercially in China since the 1970s.
Additionally, varieties resistant to multiple diseases, such as blast, bacterial blight, grassy stunt, and insects like brown planthopper, green leafhopper, stemborer, and gall midge have helped stabilize the world rice production[6,11]. Innovations in germplasm resources, including the development of ideal plant architecture, heterosis, and resistance to biotic and abiotic stresses, often result in a comprehensive increase in crop yield by improving the yield potential per plant. However, how the high-yield potential per plant is efficiently translated into an overall increase in production is rarely addressed. The yield gap accurately measures the efficiency of converting the maximum genetic yield into the average yield per unit area, globally or nationally. Despite these advances in agricultural research, however, differences between yields obtained in research stations and those achieved by farmers in the field persist in many nations, finally causing yield gaps to widen[12,13].
The concept of wide adaptation as a breeding trait is not frequently referenced[6]. However, crop varieties with this attribute have the potential for rapid expansion of their cultivation areas. For instance, the semi-dwarf rice variety IR8, released by the International Rice Research Institute (IRRI) in 1966, produced twice the yield of traditional varieties when grown under irrigation and became widely cultivated in various rice-growing regions of Asia, Africa, and Latin America, earning it the moniker 'miracle rice'[6]. Similarly, the Chinese hybrid rice super variety Shanyou63, grown on 90 million mu from 1984 to 2012 in China, showed wide adaptability[14]. We showed previously that growing Shanyou63, a variety with gradual daylength sensing capability, according to optimum cropping modes, enhanced its capacity for multi-latitude adaptation[15]. However, whether wide adaptability can affect yield efficiency of crop varieties had not been confirmed. Here, we developed a statistical model to quantify the contributions of variety yield and planting area to overall crop yield efficiency for rice, maize, soybean, and wheat. Our results support the hypothesis that expanding the cultivation area of high-yielding varieties can improve crop yield per unit area and close the yield gap, offering a strategy for increasing crop yield efficiency through wide adaptation.
-
The data for rice, maize, soybean, and wheat variety information (variety name, approval year, approval province, unit area yield [the average yield from all trial regions], plant height, disease resistance, etc.) came from A-Seed (
www.a-seed.cn ). Data for the variety planting area (variety name and planting area for each year) came from the China Seed Industry Big Data Platform (http://202.127.42.145/bigdataNew/home/ManageOrg ). The intersection of crop variety information and variety planting area was used as the crop variety dataset. Information about total sowing area, sowing area in each province, national crop unit area yield, and crop unit area yield in each province came from the National Bureau of Statistics (www.stats.gov.cn ). Data for crop yield of different countries came from the Food and Agriculture Organization of the United Nations, FAO (www.fao.org/home/en ).Modeling the planting area–enhanced production theory
Definition the model parameters of the theory
-
The yield rate is used to measure the rate of change of unit area yield. Since the yield fluctuates greatly between consecutive years, if the yield rate between these years is used, the background noise will be large. Therefore, to remove the background noise, the yield rate is calculated over a 5-year sliding window. Here,
$ \overline{{y}_{A}} $ $ \overline{{y}_{B}} $ $ {yield\;rate}_{i}=\dfrac{\overline{{y}_{\mathrm{B}}}-{\overline{{y}_{\mathrm{A}}}}}{\overline{{y}_{\mathrm{A}}}} $ rarea is the ratio between the planting area of the crop with the largest planting area (Area1) and the total planting area (Total area) for each year. Area1 represents the planting area of the variety, and Total area refers to the cultivated area of the crop.
$ {r}_{\mathrm{a}\mathrm{r}\mathrm{e}\mathrm{a}}=\dfrac{{Area}_{1}}{Total\;area} $ We use r'area to represent the area share of a given variety.
$ {r'_{\mathrm{a}\mathrm{r}\mathrm{e}\mathrm{a}}}=\dfrac{{Area}_{variety}}{Total\;area} $ We approximate the average yield of the top five varieties (
$ \overline{{y}_{\mathrm{T}\mathrm{o}\mathrm{p}5}} $ $ \overline{{y}_{\mathrm{T}\mathrm{o}\mathrm{p}5}} $ $ \overline{{y}_{\mathrm{o}\mathrm{t}\mathrm{h}\mathrm{e}\mathrm{r}}} $ $ {r}_{\mathrm{y}\mathrm{i}\mathrm{e}\mathrm{l}\mathrm{d}}=\dfrac{\overline{{y}_{\mathrm{T}\mathrm{o}\mathrm{p}5}}}{\overline{{y}_{\mathrm{o}\mathrm{t}\mathrm{h}\mathrm{e}\mathrm{r}}}} $ A variety from a r'yield data is the ratio of the yield of that variety to the national yield per unit area, representing a high potential for a single variety.
$ {r'_{\mathrm{y}\mathrm{i}\mathrm{e}\mathrm{l}\mathrm{d}}}=\dfrac{\overline{{y}_{\mathrm{v}\mathrm{a}\mathrm{r}\mathrm{i}\mathrm{e}\mathrm{t}\mathrm{y}}}}{\overline{{y}_{\mathrm{n}\mathrm{a}\mathrm{t}\mathrm{i}\mathrm{o}\mathrm{n}\mathrm{a}\mathrm{l}}}} $ rarea and ryield indicators are important measures of crop cultivation, with the former reflecting the diversity of planting structures and the latter reflecting the stability and improvement of variety yields.
Yield gap is defined as the difference between the average yield of the top five varieties (
$ \overline{{y}_{\mathrm{T}\mathrm{o}\mathrm{p}5}} $ $ yield\;gap=\overline{{y}_{\mathrm{T}\mathrm{o}\mathrm{p}5}}-{Y}_{\mathrm{m}\mathrm{e}\mathrm{a}\mathrm{n}} $ Building different types of models
-
A multiple linear regression model of the yield rate, rarea, and ryield was established using the lm() function in R software. The purpose of this model is to investigate the relationships between the yield rate, rarea, and ryield to determine how they contribute to crop yield. The model can be expressed as:
$ yield\;rate\sim{{r}_{\mathrm{a}\mathrm{r}\mathrm{e}\mathrm{a}}+r}_{\mathrm{y}\mathrm{i}\mathrm{e}\mathrm{l}\mathrm{d}} $ A multiple linear regression model for the yield gap, rarea, and ryield can be established using the lm() function in R.
$ yield\;gap\sim{{r}_{area}+r}_{yield} $ A multiple linear regression model that improves upon the yield gap model can be created by adding an interaction term between rarea and ryield. In this model, the lm() function in R is used to establish a multiple linear regression model with yield gap as the dependent variable and rarea, ryield, and the interaction term between rarea and ryield as the independent variables. The purpose of the model is to explore the interaction effects between different independent variables on the dependent variable.
$ yield\;gap\sim{r}_{yield}+r_{area}+r_{yield}:r_{area} $ A multiple linear regression model was used to investigate the impact of the interaction between rarea and ryield on yield gap. The R software's lm() function was used to establish a multiple linear regression model based on the yield gap and the interaction between different types of rarea and ryield. This modeling approach can help clarify the impact of different types of rarea and ryield on yield gap.
$ yield\;gap\sim{{ind.\_r}_{\mathrm{y}\mathrm{i}\mathrm{e}\mathrm{l}\mathrm{d}}:ind.\_r}_{\mathrm{a}\mathrm{r}\mathrm{e}\mathrm{a}}+{{jap.\_r}_{\mathrm{y}\mathrm{i}\mathrm{e}\mathrm{l}\mathrm{d}}:jap.\_r}_{\mathrm{a}\mathrm{r}\mathrm{e}\mathrm{a}} $ Here, jap. represents japonica, ind. represents indica.
p value is used to verify whether the regression coefficient is significant. Adjusted R2 is used to represent the fit of the model, n is the sample size, and k is the number of independent variables in the model, which is 2 in this model.
$ \mathrm{a}\mathrm{d}\mathrm{j}\mathrm{u}\mathrm{s}\mathrm{t}\mathrm{e}\mathrm{d}\;{R}^{2}=\mathrm{ }1\mathrm{ }-\left(1\mathrm{ }-{R}^{2}\right)\times \left(\dfrac{n- 1}{n- 1 -k}\right) $ -
This study introduces a theory describing the interplay between planting area and crop yield enhancement. In this model, the control Variety C is used as the baseline, with its yield considered as the reference point. Although Variety A has a yield 40% higher than that of control Variety C, its limited adaptability results in a smaller planting area (i.e., only 10% of the total area nationally, with the remaining 90% occupied by Variety C) and, thus, a comparatively small contribution to national yield (4%; Fig. 1a). In contrast, although the yield of Variety B is only 20% higher than that of control Variety C, its wide adaptability allows a larger planting area (25% of the total planting area), resulting in a significantly higher yield contribution (5%; Fig. 1a). Thus, despite its lower yield, Variety B can make a greater contribution than Variety A to the national yield per unit area. We refer to this concept as the 'planting area–enhanced production theory'.
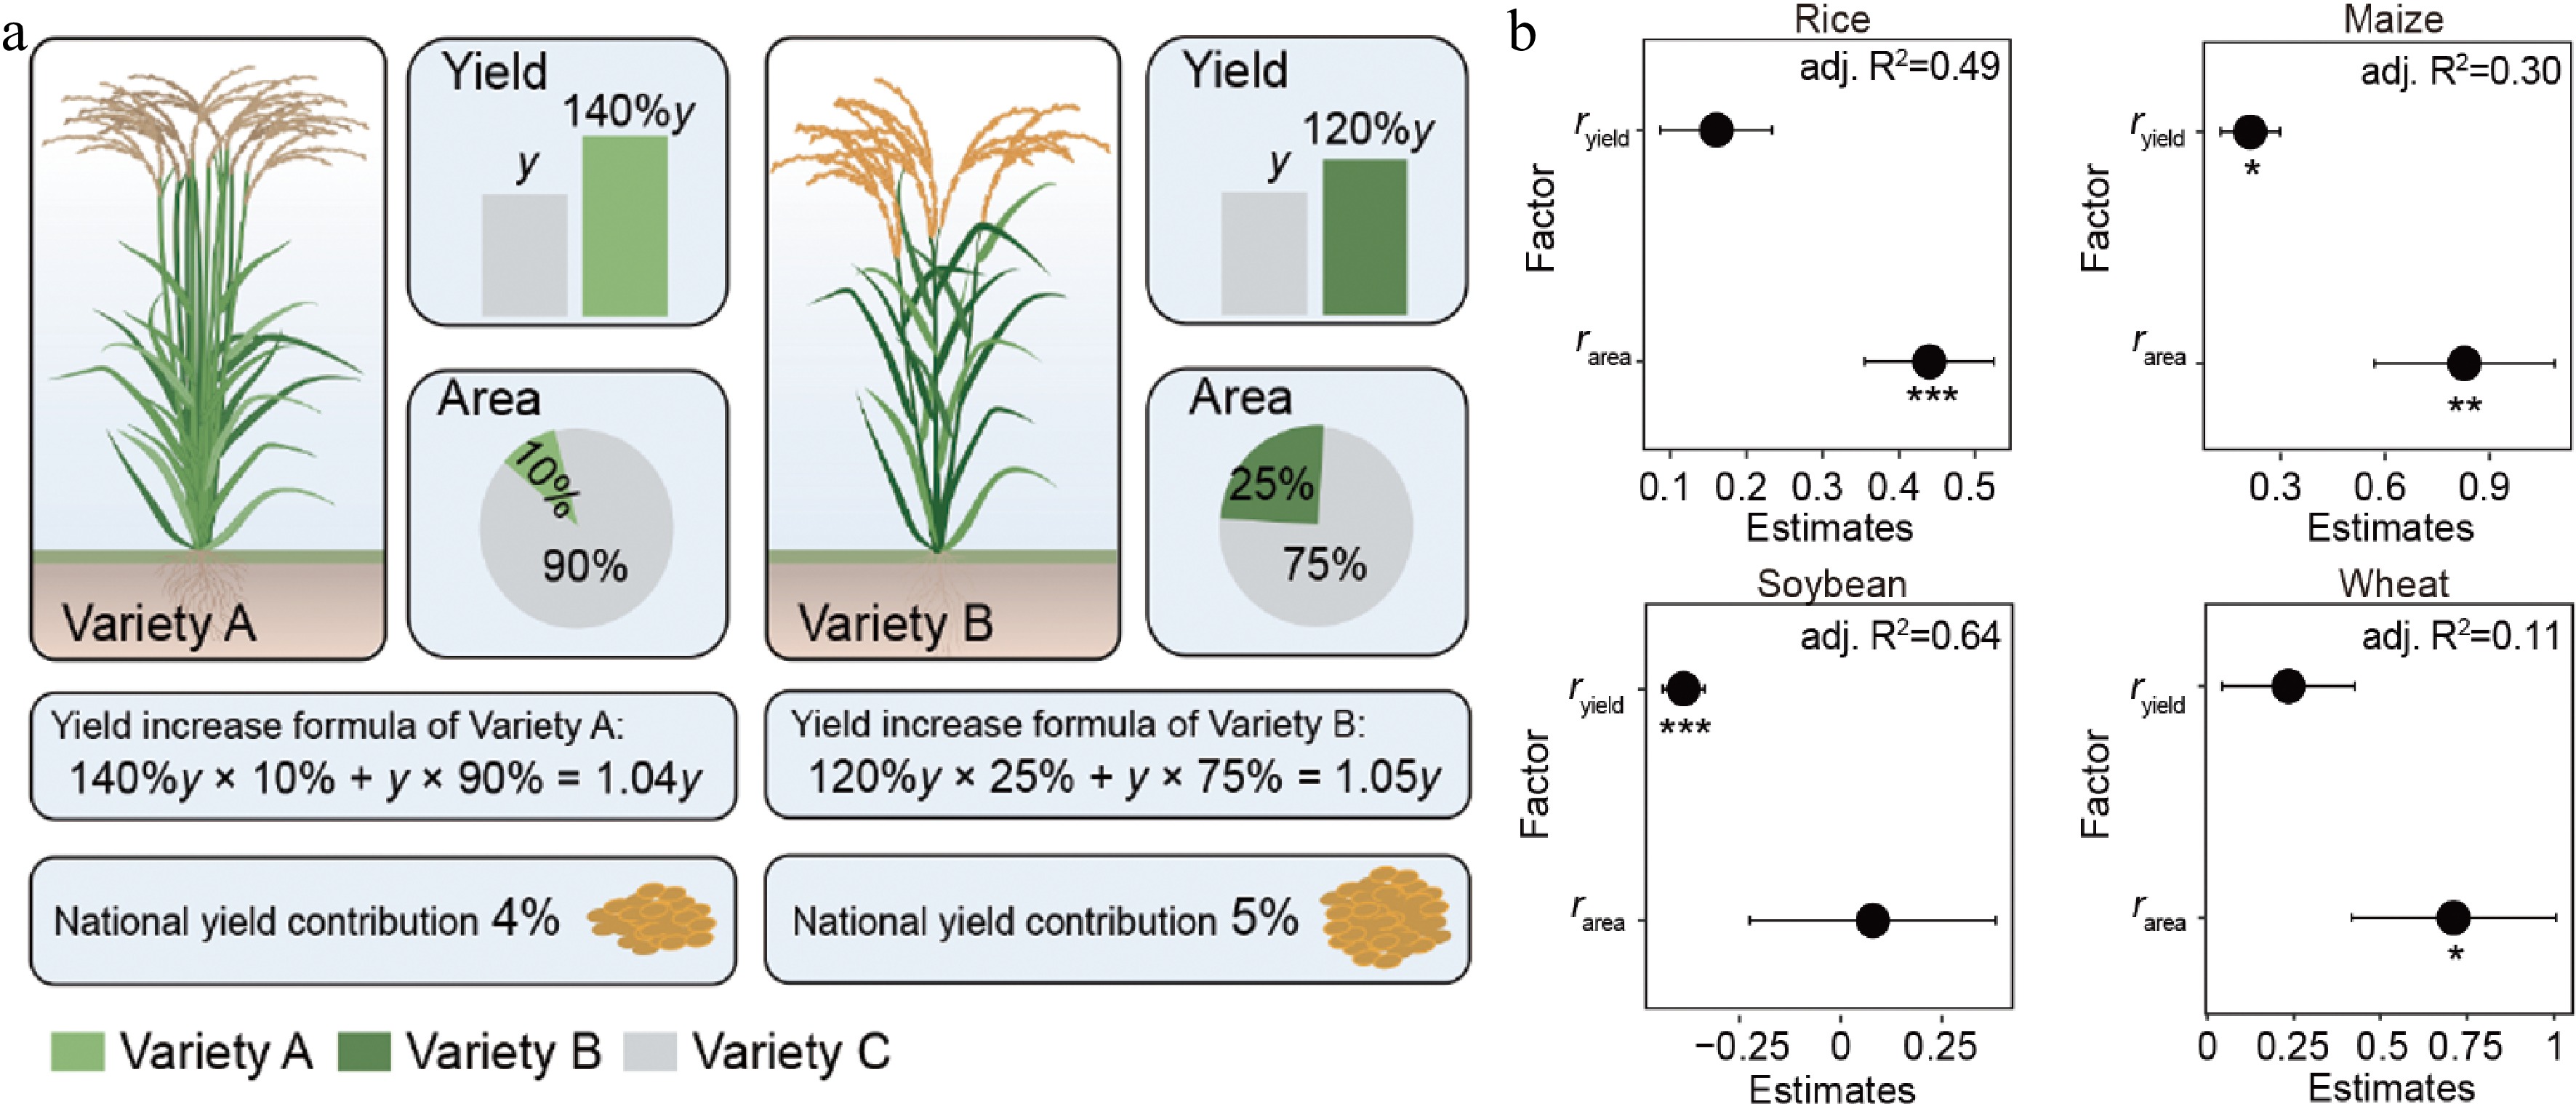
Figure 1.
Planting area–enhanced production theory. (a) Diagram illustrating the theory. y is the average yield of control Variety C. The rice plant as 'Created with BioRender.com'. (b) Multilevel linear regression for yield rate by ryield to rarea in global regions. The 95% confidence intervals (CIs) of the partial regression coefficient are shown. The asterisk is used to represent the significance of the regression coefficient. (*** p < 0.001; 0.001 < ** p < 0.01; 0.01 < * p < 0.05)
To validate the accuracy and universality of this theory, we analyzed a comprehensive dataset of Chinese national statistics for rice, maize, soybean, and wheat collected over a 30-year period. We investigated three key parameters (see Methods): yield rate (the increase in yield per unit area); ryield (the ratio of the highest yield to the average yield of a particular crop, which is used to measure the performance of a crop variety and to compare it with that of other crops); and rarea (the ratio between the maximum planting area occupied by a single variety and the total planted area). A high ryield number indicates that a variety has a high potential for high yield compared to the average yield of the same crop. The rarea is an important indicator for evaluating the market share and geographic distribution of crop varieties. A high rarea value indicates that a variety is widely grown and occupies a large portion of the total cultivated area, while a low rarea value may suggest a less popular or available variety. Our findings reveal a weak positive correlation between the rarea and yield rate across different crop species, but we did not observe a consistent positive correlation between ryield and yield rate across all crops (Supplemental Fig. S1). Additionally, our multiple regression analysis indicated that rarea has a significant positive impact on yield rate (Fig. 1b, Supplemental Table S1). These results support the theory that an increase in the planting area of specific crop varieties can lead to a substantial improvement in national yield, thereby confirming the validity and generalizability of the planting area–improved production theory.
The difficulties of bridging the yield gap under the limitations of social, biological, cultural, environmental, and abiotic constraints need close examination[13,16,17]. There is currently a large yield gap in Southeast Asia, which limits its potential to continue to be a major global 'rice bowl'[18]. Increased crop yields may be achievable by optimizing plant varieties and agricultural management strategies (nutrient availability, water management, etc.)[12,19]. However, these strategies may conflict with national/economic human development needs and entail additional input, labour, and equipment costs. Therefore, understanding which traits of a crop variety can best contribute to narrowing the current yield gap will provide another tool to increase production and farm incomes. Our analysis delves more deeply into the potential contribution of the planting area–improved production theory not just to enhance yield per unit area but also, more broadly, to close yield gaps at the national scale (Fig. 2a). We analyzed, at a national scale, the maximum yield (
$ \overline{{y}_{\mathrm{T}\mathrm{o}\mathrm{p}5}} $ $ \overline{{y}_{\mathrm{T}\mathrm{o}\mathrm{p}5}} $ 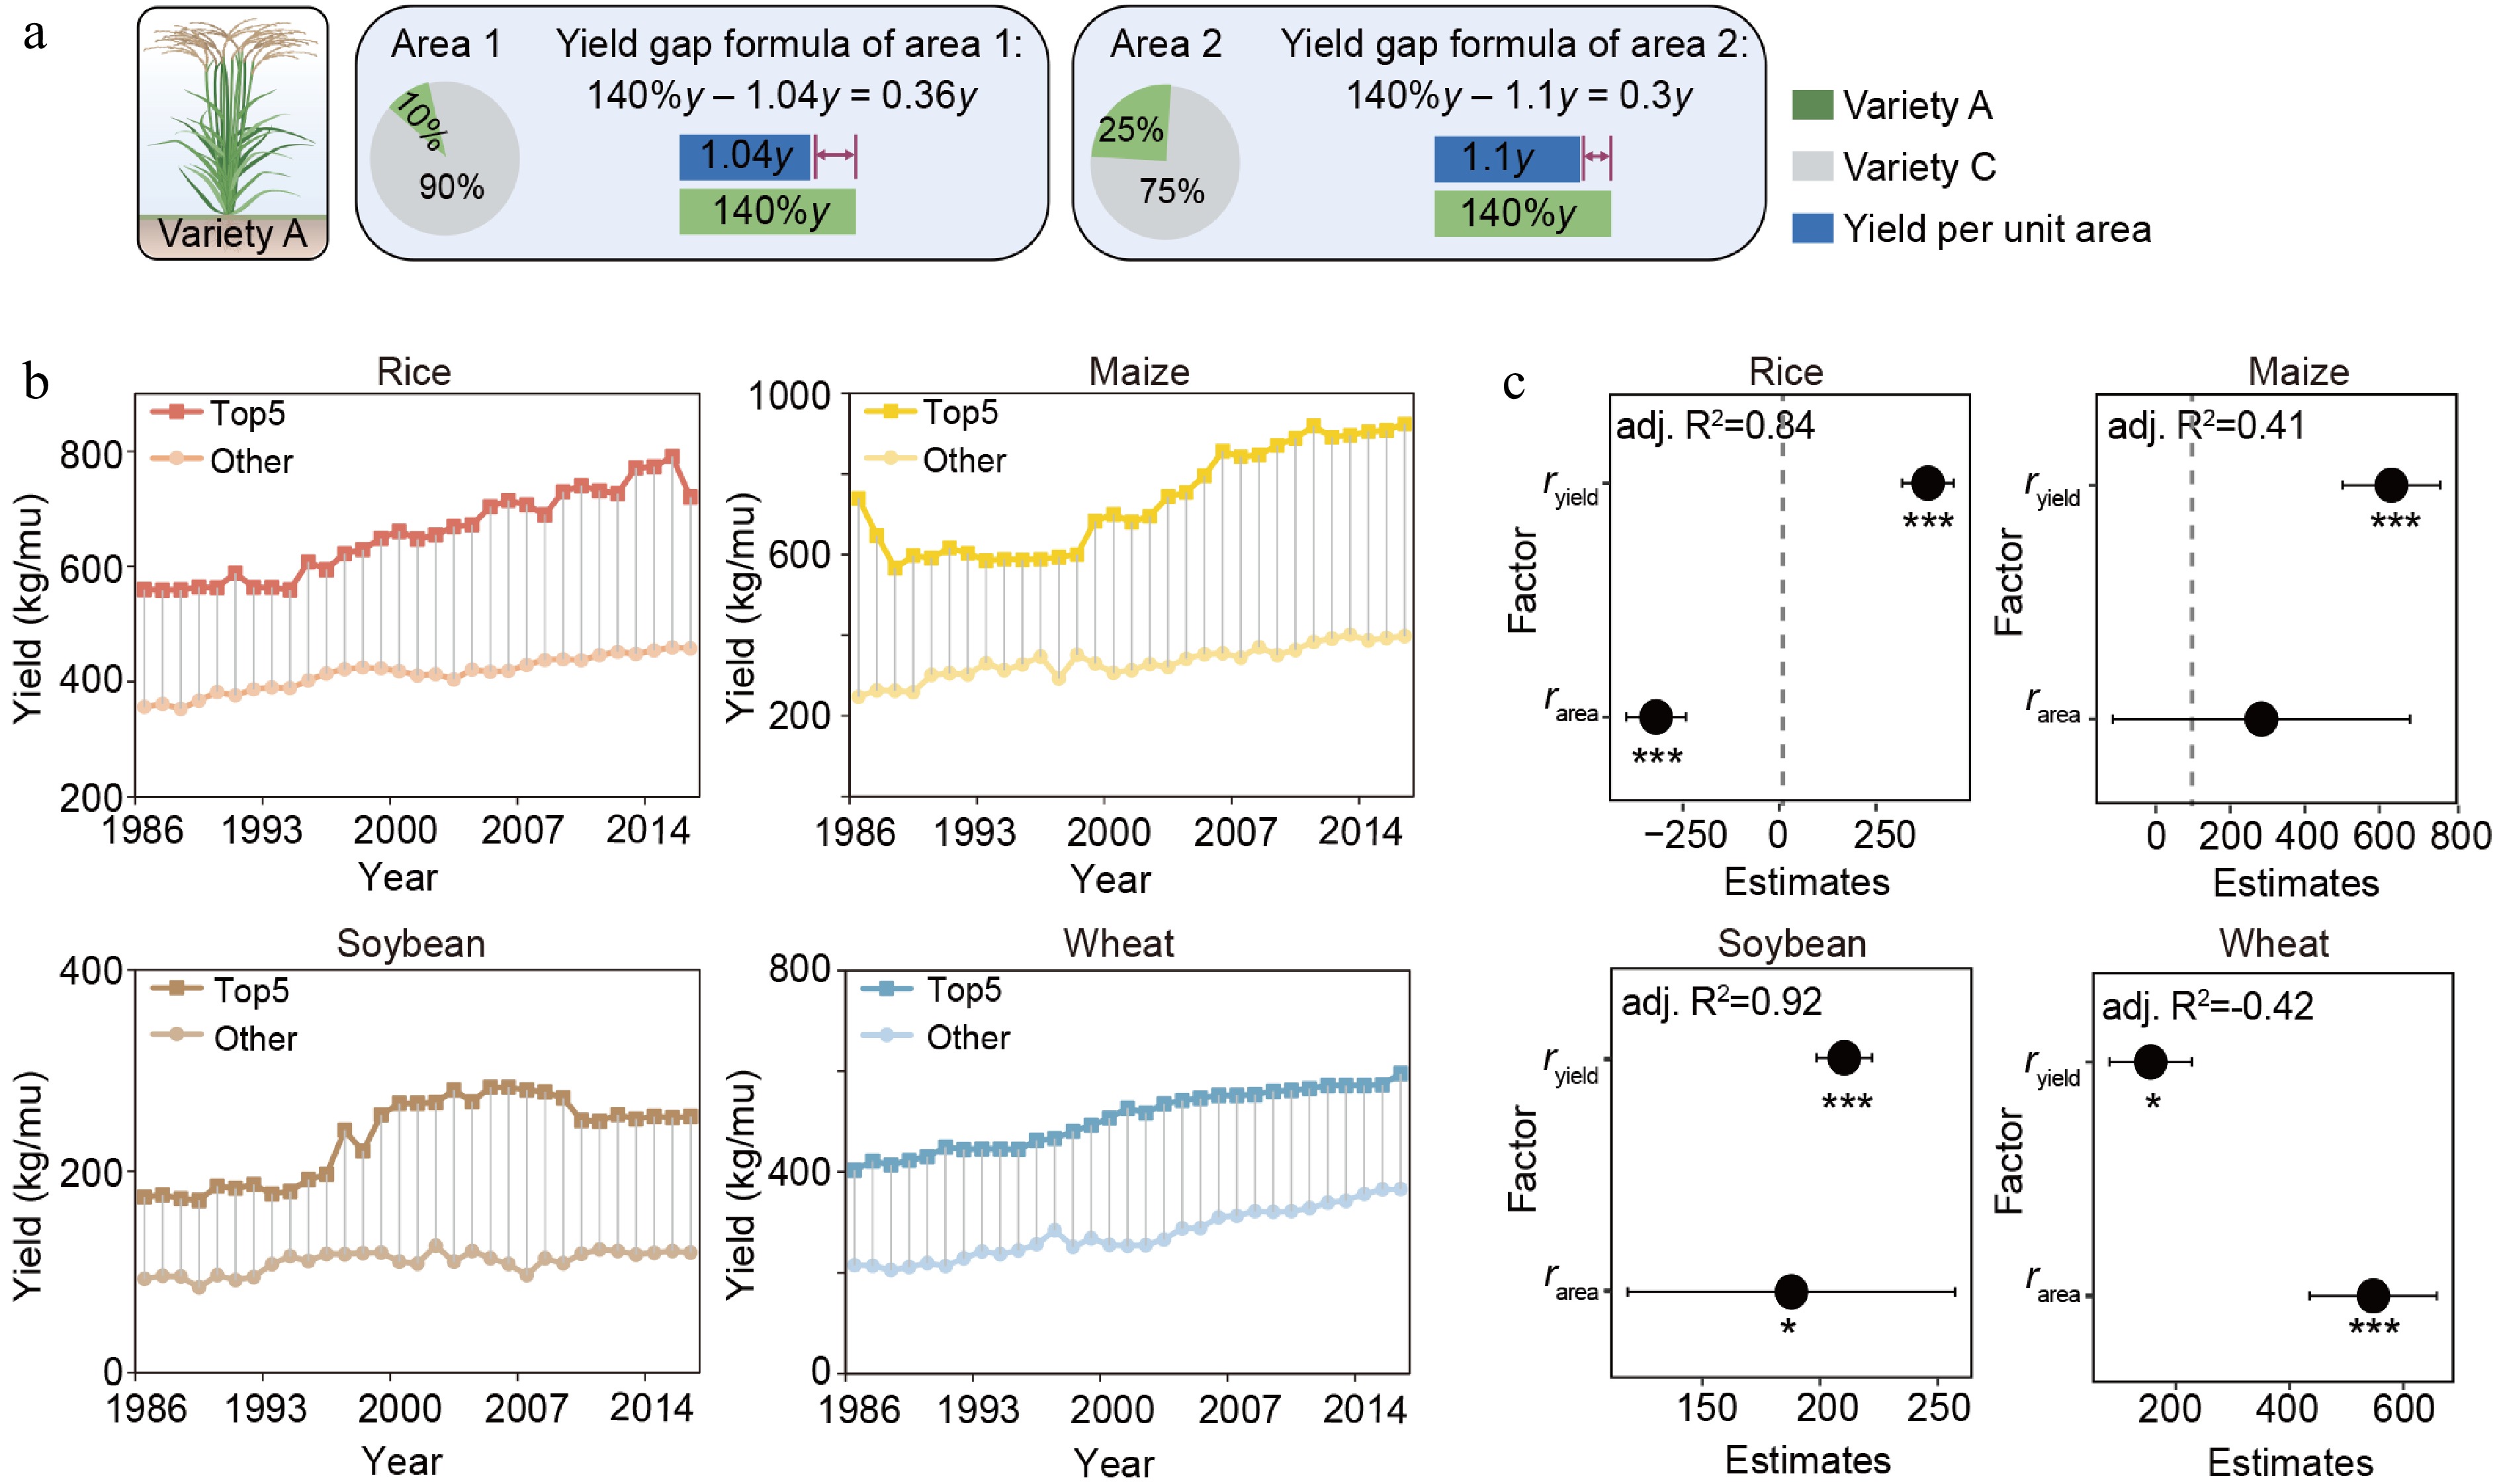
Figure 2.
Expanding the planting area helps reduce the yield gap in rice. (a) Modeling results showing the effect of large-scale planting of high-yielding varieties on the yield gap. y is the average yield of control Variety C. The rice plant as 'Created with BioRender.com'. (b) Yield gaps in different crops. (c) Multilevel linear regression for yield gap by ryield to rarea of rice, maize, soybean, and wheat in global regions. The 95% confidence intervals (CIs) of the partial regression coefficient are shown. The asterisk is used to represent the significance of the regression coefficient. (*** p < 0.001; 0.001 < ** p < 0.01; 0.01 < * p < 0.05).
Historical data from 1985 to 2016 show that high-rarea rice varieties were mainly planted before 2000 (Fig. 3a). Notably, from 1985 to 2000, high-rarea rice varieties were also the highest-yielding varieties (Fig. 3a), with Shanyou63 showing the highest rarea and yield (Fig. 4). No similar trend was observed in maize, soybean, or wheat (Fig. 3c, d). Nevertheless, maize and wheat showed rapid yield increases in periods when the rarea value was high, meaning that having one or a few varieties that were widely planted improved the national yield even when these varieties were not the highest-yielding ones available (Figs 1b, 3b−d, & 4). These results provide hard evidence for the theory we proposed (Fig. 1a). Multiple regression analysis further confirmed that the interaction between the rarea and ryield significantly decreased the production gap in rice (Supplemental Fig. S3, Supplemental Table S3).
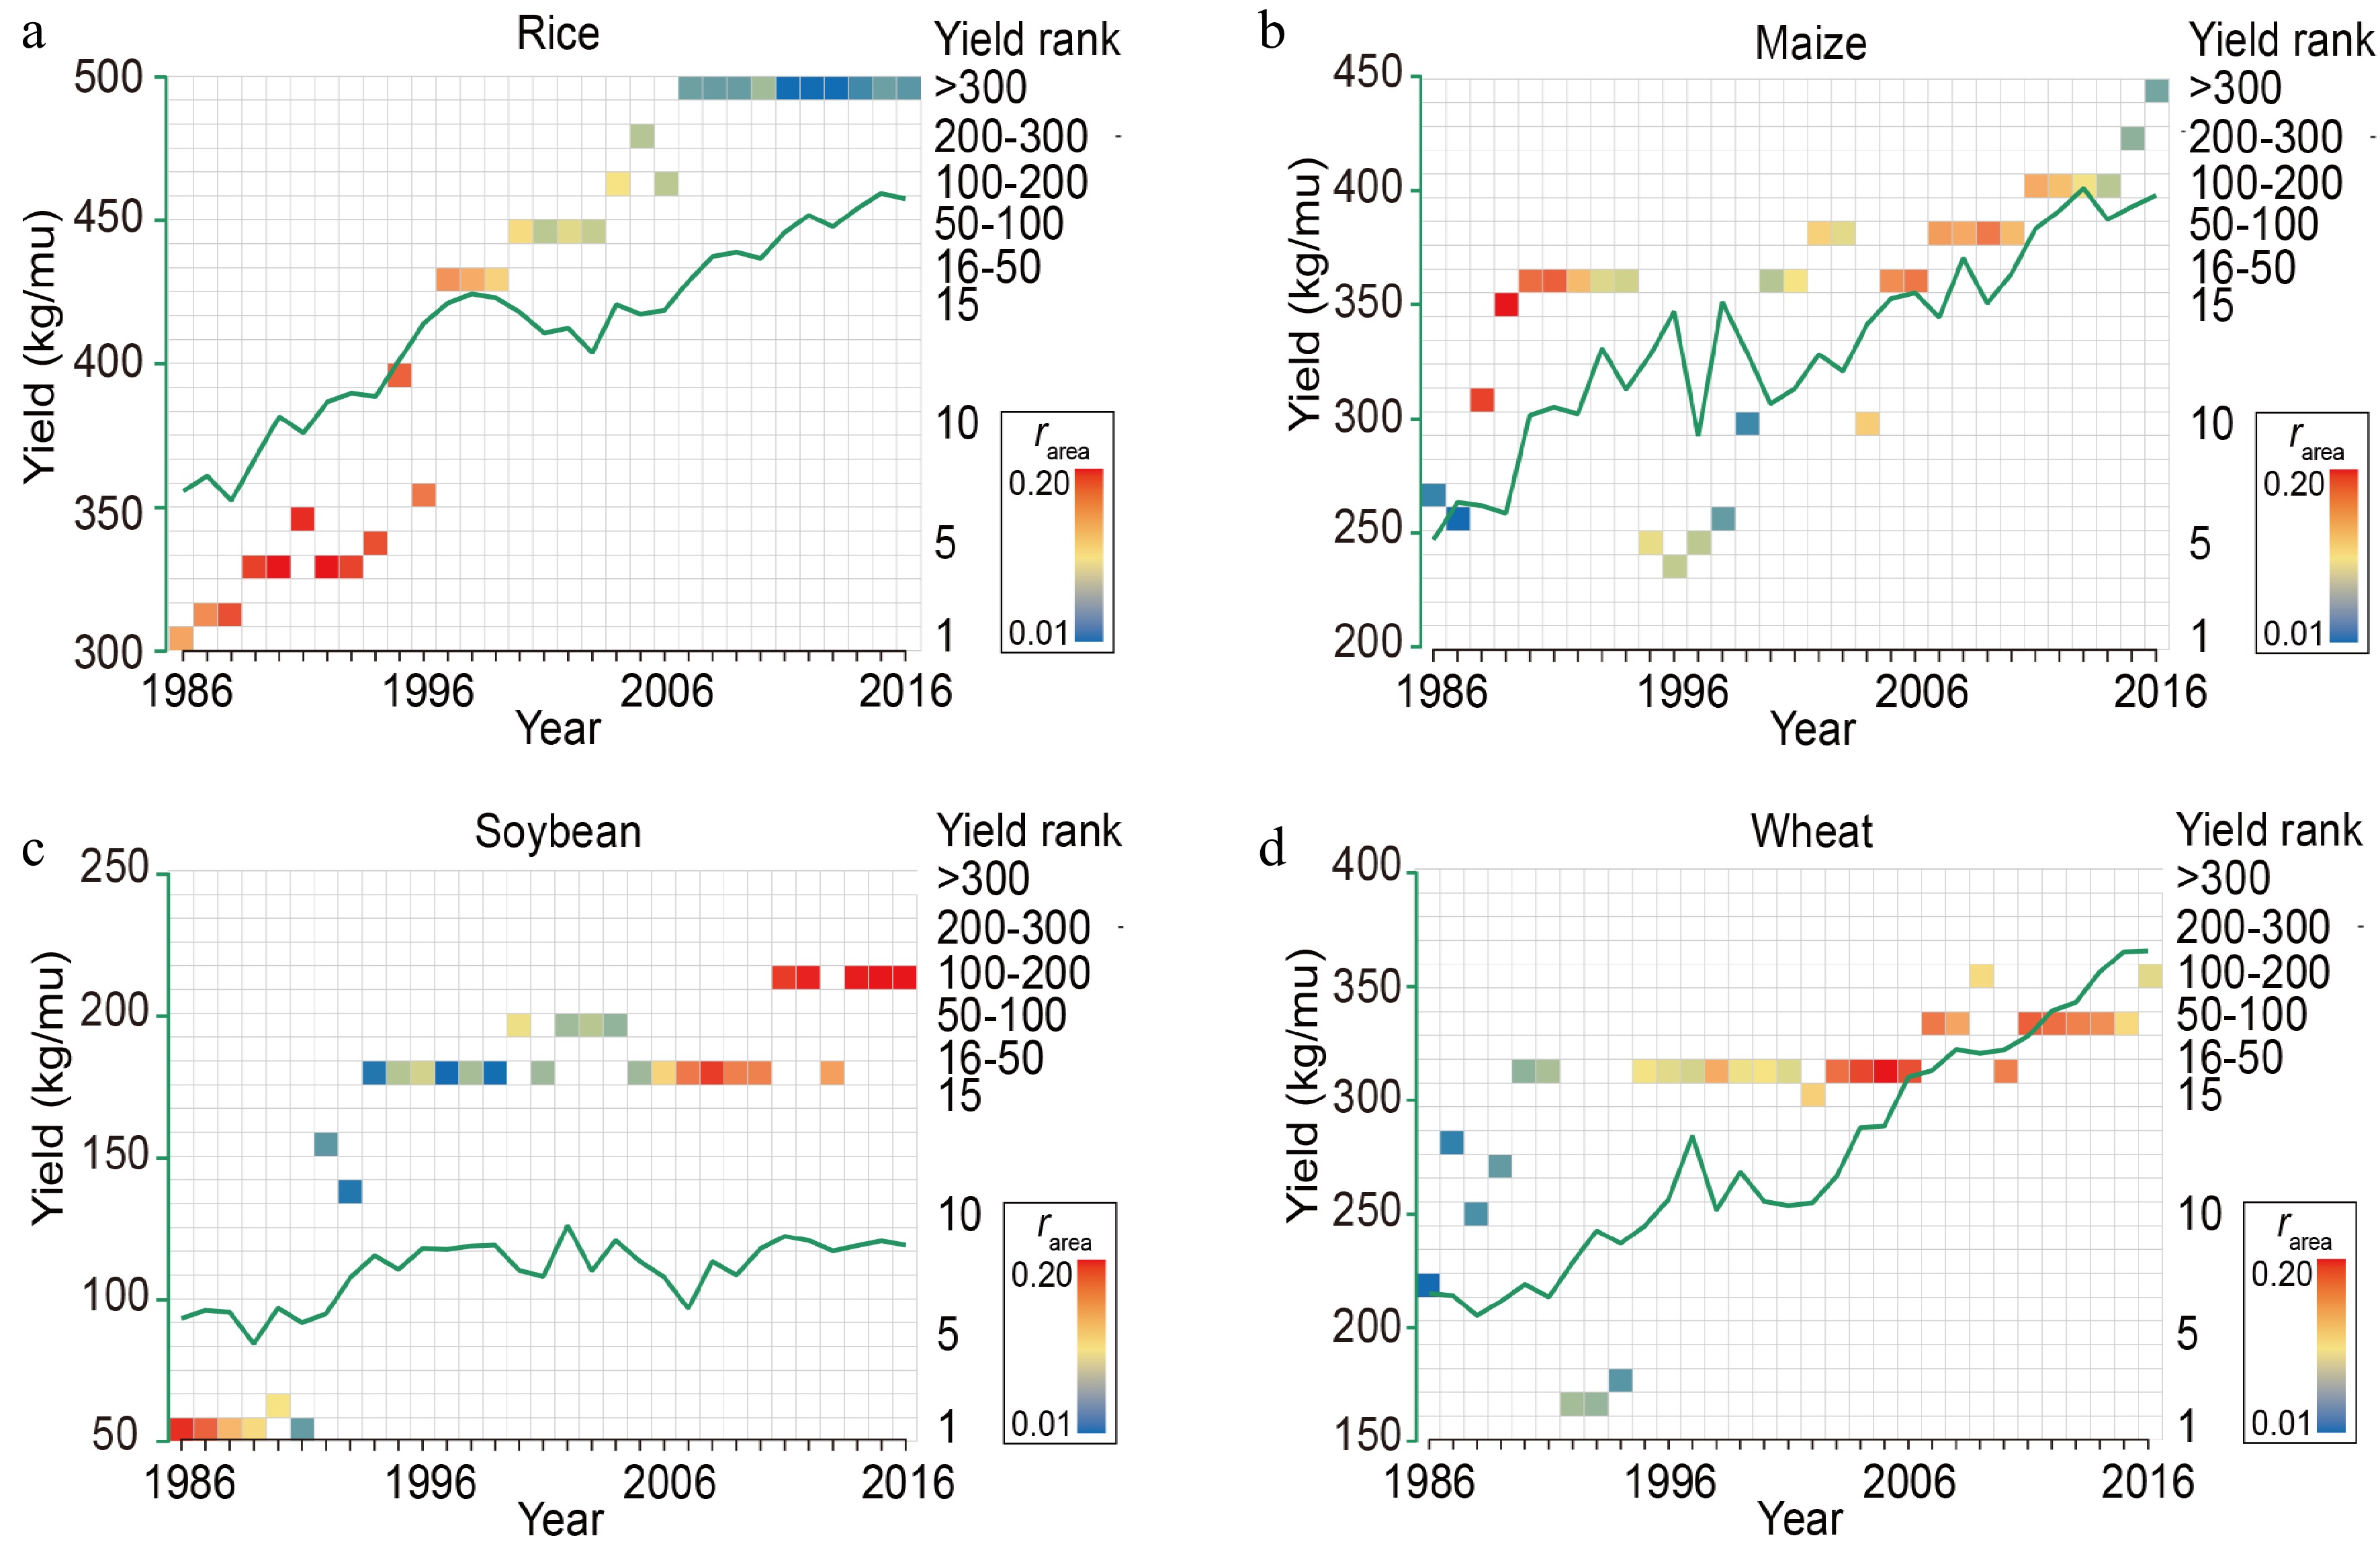
Figure 3.
rarea and yield ranking of the varieties with the largest planting area and yield per unit area for (a) rice, (b) maize, (c) soybean, and (d) wheat in different global regions. Each square represents a region, with colors representing the rarea and positions representing the yield ranking; the green lines represent the mean country yield per unit area planted.

Figure 4.
$r'_{\rm{area}} $ and $r'_{\rm{yield}} $ of varieties in different crop. Circle color represents different crops, and circle size represents the value of $r'_{\rm{area}} $ × $r'_{\rm{yield}} $.
Our data indicated a shift in rice planting trend over time. Before 2000, the extensively planted high-yielding variety was Shanyou63. However, with the development of breeding techniques, a large number of high-yielding varieties have been bred. Since 2000, the predominant trend has been the planting of local high-yielding varieties in local conditions (Fig. 4). We divided the rice cultivation data into two cultivation intervals: 1986–2000 and 2001–2016, according to the planting trends. And we analyze the impact of rarea and ryield on yield rate. Our results showed that rarea had a significant positive effect on yield rate during 1986–2000 (Supplemental Fig. S4a, b), indicating that the increase of rice yield in 2000 was mainly due to the widespread planting of Shanyou63 (Supplemental Table S4). During 2001-2016, ryield had a positive effect on yield rate (Supplemental Fig. S4c). However, when rarea was taken into account, ryield no longer had a statistically significant effect on yield rate (Supplemental Fig. S4d). Despite the rise in rice production since 2000 (Fig. 3a), it is possible that other factors, such as industrial fertilizers and advancements in farming techniques, attributable to the increase in yield. Furthermore, planting various high-yielding varieties according to local conditions necessitates a substantial allocation of germplasm resources. Consequently, we conclude that although planting high-yield varieties that adapt to local conditions can increase yield, the benefits are not as significant as those obtained through widespread planting the wide adaptation varieties (Supplemental Fig. S4e).
The planting area of indica rice was much larger than that for japonica rice in China, and Shanyou63 is an indica rice variety. So, when we assessed japonica and indica rice varieties separately, we found that the interaction between rarea and ryield in indica rice significantly reduced the production gap, but this was not true for japonica (Fig. 5, Supplemental Table S3). Thus, extensive cultivation of the high-yielding indica variety Shanyou63 significantly increased the national average yield in 1985–2000. These findings support the idea that applying the planting area–improved production theory to high-yield, widely adaptable varieties can effectively reduce the yield gap (Fig. 2a).
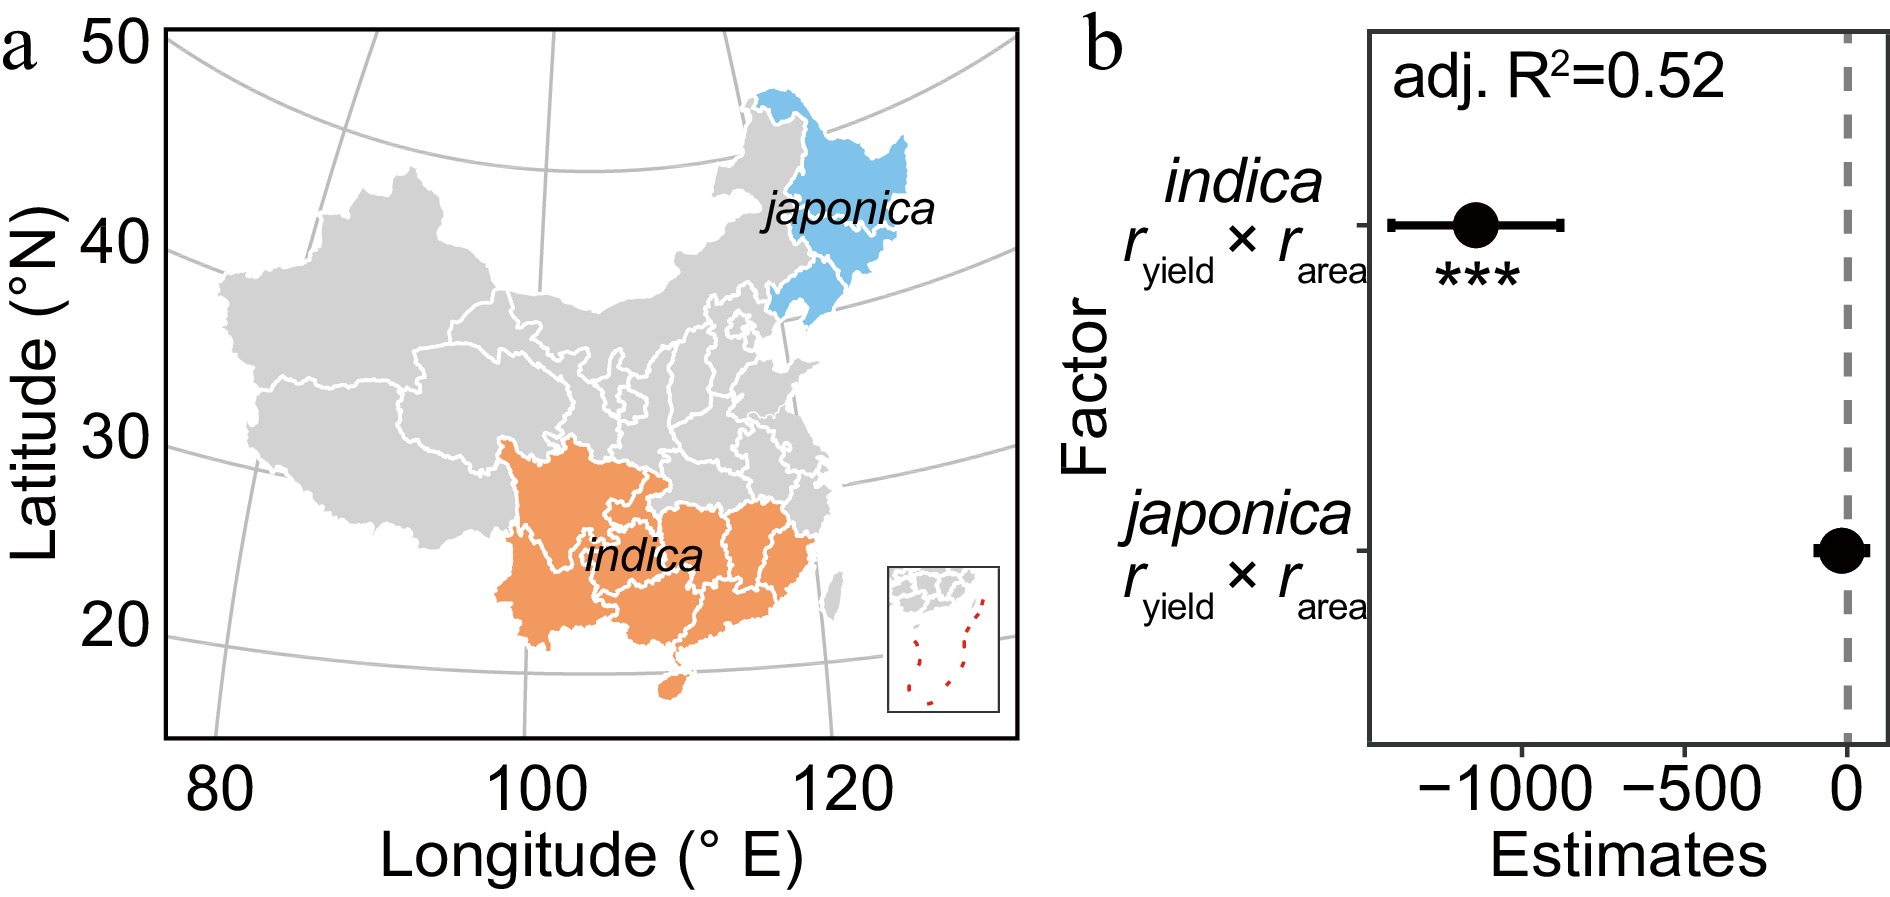
Figure 5.
The planting of indica rice helps reduce the yield gap. (a) Distribution of indica and japonica rice cultivars; provinces where both indica and japonica varieties were grown are omitted. (b) Multilevel linear regression for yield gap by interactions of rarea and ryield in different rice ecotypes. jap. and ind. represent areas where japonica and indica cultivars are grown, respectively. The 95% confidence intervals (CIs) of the partial regression coefficient are shown. The asterisk is used to represent the significance of the regression coefficient. (*** p < 0.001; 0.001 < ** p < 0.01; 0.01< * p < 0.05).
IR8 ('miracle rice'), a representative Green Revolution rice variety, increased total rice yield from 60–150 to 250–350 kg/mu[20] and was grown in more than 30 low-latitude countries and regions[20] (Supplemental Fig. S5), perfectly conforming to the planting area–improved production theory. However, due to the mismatch between IR8's growth period and the cropping season in mid-latitude regions[21], it is limited to low-latitude regions. Meanwhile, the high-yielding hybrid rice variety Shanyou63, with gradual daylength sensing coupled with optimized cropping systems to achieve multiple-latitude adaptation[15], again demonstrated the validity of the planting area–improved production theory (Supplemental Fig. S5). Thus, outcomes from both the rice Green Revolution and hybrid rice breeding conform to our planting area–improved production theory, demonstrating the importance of plant broad adaptation for global food security.
-
In China, annual soybean imports are ~90 million tons and are expected to exceed 100 million tons in 2023 (Supplemental Fig. S6a). Only 250 million mu of land in China is suitable for soybean cultivation (Supplemental Fig. S6a), while 1 billion mu of arable land is needed to achieve self-sufficiency in soybean production. Heavy dependence on soybean imports contributes to the instability of global food security. Competition between rice, maize and soybean for arable land utilization is significant (Supplemental Fig. S6b), as a continuous increase in rice production is crucial for the efficient use of China's limited arable lands. Since 2000, the highest yield per mu of rice varieties in China has surpassed 800 kg/mu, but the national average yield remains 400 kg/mu (Fig. 2b). This may be due primarily to the poor adaptability of these high-yielding varieties, which limits their widespread planting (Figs 3a & 4), precluding application of the planting area–improved production theory to narrow the yield gap. Moreover, yield gaps are much higher for double-cropping than for single-cropping rice varieties[22]. If narrowing the yield gap of double-cropping rice or modern high-yielding rice varieties can increase their proportion of total planting area, total rice yield can be secured with less cultivated land, and the surplus land can be used to alleviate the shortage of arable land for soybeans.
The emergence and advancement of agriculture have been significantly influenced by plant introductions and domestication. Therefore, in the process of seed introduction, it is imperative not only to select suitable seed materials but also to comprehensively understand the key ecological factors. Varieties with wide adaptability can be distributed over a wide range, so wide adaptation plays a crucial role in the seed introduction. The establishment of wide adaptation is based on multiple factors (e.g., daylength, disease resistance, cold tolerance, heat tolerance, etc.). Wide adaptation encompasses latitude adaptation, and the latter is a crucial aspect of achieving a comprehensive adaptation of varieties. Latitude adaptation presents significant challenges due to substantial variations in light, temperature, humidity, and pathogen microspecies at various latitudes. Achieving latitude adaptation requires co-ordination of multiple conditions to overcome these challenges. Our previous study suggests that daylength sensing is the key determinant of the latitudinal distribution of crops[23]. Rice varieties with critical daylength sensing are suited for cultivation in low-latitude regions with relatively stable daylength, while daylength-insensitive rice thrives in high-latitude areas characterized by significant daylength fluctuations. Rice varieties that exhibit a gradual daylength sensing, in turn, possess greater flowering plasticity and can adapt to a wider range of growing regions. Therefore, relying on daylength sensing process can provide a foundational framework for breeding wide adaptation varieties. However, given the disparities in environmental factors beyond daylength among different regions, breeding efforts within the daylength perception framework also necessitate the consideration of comprehensive factors such as temperature sensitivity and resistance. Given that widespread promotion of a single variety can render crops susceptible to risks such as pests and diseases, and historical data show that the proportion of the planting area occupied by rice varieties resistant to rice blast fungus is higher than that occupied by blast-susceptible varieties (Supplemental Fig. S7), indicating that crop resistance traits can promote wide adaptability. So, breeding crops with broad resistance can help counter the risks of planting large areas of a single variety. Rice varieties adapted to high-latitude regions require not only daylength insensitivity but also cold tolerance. Conversely, rice varieties suited for low-latitude regions, in addition to their critical daylength sensing, should also exhibit heat tolerance.
Thus, using daylength sensing process as a fundamental framework, coupled with traits like temperature sensitivity and resistance, will be essential for breeding wide adaptation varieties in the future.
Improving the adaptability of high-yielding varieties will help expand their planting area, thereby increasing the overall national grain output. How to strengthen the adaptation of a high-yielding variety is the key point of perfecting this theory. In our previous research, we demonstrated that daylength sensing is a crucial factor influencing the latitude adaptation of crops, and varieties with gradual daylength sensing have the potential for multi-latitude adaptation[15]. In addition, optimizing cropping modes can improve the multi-latitude adaptation of crops[15]. Therefore, selecting high-yielding varieties with gradual daylength sensing and establishing their multi-latitude adaptation through cropping modes optimization is an important way to strengthen the adaptation of a high yielding variety. On the one hand, we can modify current varieties' photoperiodic genes to change their daylength sensing mode into gradual daylength sensing, but it's time-consuming. On the other hand, we also can use current varieties to establish a new cropping mode when the growth period of various crops can be rapidly predicted. Our results suggest that resistance to rice blast further enhances varietal risk tolerance and thus promotes crop wide adaptation. These results indicate that enhancing plant resistance, optimizing daylength sensing, and improving the cropping system can strengthen the adaptation of high-yielding varieties.
-
The mathematical principles behind the planting area–improved production theory are simple (Fig. 1a). However, in the absence of supporting data, people have grasped the importance of wide adaptability only intuitively. Our work now confirms this using historical data, providing a solid basis for incorporating wide adaptability as a breeding goal in genetic resource innovation and supporting rational allocation of crop planting areas at the national level. Currently, crop yield gaps in China (Fig. 2b), Europe, West Africa, and Southeast Asia significantly affect crop yield efficiencies[12,13,18,24]. Our research suggests that promoting high-yielding, broadly adaptable varieties in these countries can help reduce yield gaps and alleviate global food security risks.
-
The authors confirm contribution to the paper as follows: research conception and design: Ouyang X; research performing: Wang X, Huang H, Lu M, Cui Y, Huang R, Wang X, Fu R, Liang W, and Ouyang X; data analysis: Wang X, Huang H, Liang W, and Ouyang X; draft manuscript: Wang X, Ouyang X. All authors reviewed the results and approved the final version of the manuscript.
-
All data supporting the findings of this study are available within the paper and within its supplementary data published online. Correspondence and requests for materials should be addressed to Ouyang X.
This work was supported by the National Natural Science Foundation of China (32270250), the National Science Foundation of Fujian Province of China (2022J02004) and the Open Research Fund of the State Key Laboratory of Hybrid Rice (Hunan Hybrid Rice Research Center) (2021KF02). We thank Shigui Li (Sichuan Agricultural University), Jianfu Zhang (Fujian Academy of Agricultural Sciences), Bingran Zhao (Hunan Hybrid Rice Research Center), Xinqi Li (Hunan Hybrid Rice Research Center), Qiming Lv (Hunan Hybrid Rice Research Center), Yaoguang Liu (South China Agricultural University), Jingxin Guo (South China Agricultural University) and Yongzhong Xing (Huazhong Agricultural University) for reading and commenting on the manuscript. We thank Meilin Wang (Xiamen University) for technical assistance. We thank Dabing Zhang (deceased, served as Chair Professor in the School of Life Sciences & Biotechnology at Shanghai Jiao Tong University) for his help, and this paper expresses our remembrance to Professor Zhang.
-
The authors declare that they have no conflict of interest.
-
# Authors contributed equally: Xiaoying Wang, Haicheng Huang, Ming Lu
- Supplemental Fig. S1 rarea and yield rate show a weak positive correlation across global regions.
- Supplemental Fig. S2 ryield and yield gap show a strong positive correlation in global regions.
- Supplemental Fig. S3 Effect of interaction between rarea and ryield on yield gap.
- Supplemental Fig. S4 Local high-yielding varieties in different local conditions enhanced production.
- Supplemental Fig. S5 The planting region of IR8 and Shanyou63. Green color on the map represents the planting areas of IR8, while orange represents the planting areas of Shanyou63; the broken line represents the yield of rice (yields for some countries are shown on the map).
- Supplemental Fig. S6 Current situation of Chinese soybean.
- Supplemental Fig. S7 The cumulative planting areas of blast-resistant and -susceptible rice varieties.
- Supplemental Table S1 Multilevel linear regression for yield rate by ryield to rarea in global regions.
- Supplemental Table S2 Multilevel linear regression for yield gap by ryield to rarea in global regions.
- Supplemental Table S3 Interactions of rarea and ryield was integrated in the multiple linear regression model for yield gap.
- Supplemental Table S4 The information of top 5 varieties in yield and the varieties with the largest planting area from 1986 to 2016.
- Copyright: © 2023 by the author(s). Published by Maximum Academic Press on behalf of Hainan Yazhou Bay Seed Laboratory. This article is an open access article distributed under Creative Commons Attribution License (CC BY 4.0), visit https://creativecommons.org/licenses/by/4.0/.
-
About this article
Cite this article
Wang X, Huang H, Lu M, Cui Y, Huang R, et al. 2023. Expanding crop adaptability to increase planting area: a promising strategy for enhancing agricultural production. Seed Biology 2:20 doi: 10.48130/SeedBio-2023-0020 

Expanding crop adaptability to increase planting area: a promising strategy for enhancing agricultural production
- Received: 05 July 2023
- Accepted: 24 October 2023
- Published online: 04 December 2023
Abstract: The yield gap accurately measures the efficiency of converting the maximum genetic yield into the average yield per unit area, nationally or globally. However, despite continuous advancements in breeding and cultivation technology, the yield gap continues to widen in many regions worldwide. Our findings suggest that widespread planting of high-yielding varieties can enhance crop yield per unit area and narrow the yield gap, thereby offering an effective strategy to convert the potential high yield per plant into an overall increase in production.
-
Key words:
- Crop yield /
- Yield gap /
- Wide adaptation