













-
The quality of coffee is a complex interplay of factors, including variety, environmental conditions, agronomic practices, and post-harvest processing (beneficiation). These factors collectively influence the formation of chemical compounds within the coffee bean, which are subsequently expressed during the roasting process[1,2].
Various researchers[3,4] have established a correlation between coffee quality characteristics and its geographic origin. Variables such as altitude, climatic conditions, and soil type affect the development of the coffee plant, which ultimately impacts the quality of the final beverage[5]. For instance, a study conducted in Indonesia[6], correlated altitude with coffee production, finding optimal yields in farms between 1,200 and 1,500 m, with the lowest production occurring above 1,600 m. In contrast, a study in two geographically close but altitude-differentiated regions of Costa Rica (Region 1: 1,000–1,300 m; Region 2: 1,500–1,800 m) reported that increasing shade density and shifting from low to medium altitude improved productivity, although altitude change did not result in significant differences in sensory variables[7].
The coffee-growing regions of Colombia are situated along the three Andean mountain ranges—Western, Central, and Eastern—those that traverse the country from south to north. Latitudinally, this area is categorized into three broad zones: the North Zone (latitude > 7° N), the Central Zone (latitude 3°−7° N), and the South Zone (latitude < 3° N)[8]. To improve planning within the coffee agroindustry, Cenicafé introduced the concept of coffee ecotopes[9]. These ecotopes are defined as relatively homogeneous agro-ecological areas created by unifying similar conditions across climate, soil, and relief. This process defined 86 ecotopes spanning the coffee-growing zone, identifying productive areas with similar responses to environmental conditions. To facilitate data management, a standardized three-digit and one-letter coding system was established for each ecotope: the first digit indicates the mountain range (1. Western, 2. Central, 3. Oriental, and 4. Sierra de Santa Marta), the subsequent two digits are a consecutive number from north to south, and the final letter denotes the slope (A, western and B, eastern).
Following the definition of the 86 coffee ecotopes, various regional studies have been conducted. In the characterization of the agroclimatic and geographic factors of the coffee ecotopes in Caldas, Quindío, and Risaralda, we conclude that these are essential elements for organization and territorial planning. However, our results suggest the need to refine the limits of ecotopes, excluding protected natural areas[10].
In the evaluation of coffee samples from farms at various altitudes within the 206B ecotope (latitudinal range 4°55' N to 5°18' N), a relationship was estimated between beverage quality and altitude; however, they could not establish a linear mathematical expression, concluding that the influence of altitude on sensory variables is neither proportional nor direct[11]. Seeking to develop a strategy for regional denominations of origin, coffee samples from Nariño and Cauca were evaluated[3]. They determined that aside from altitude, significant differences existed among all other environmental conditions which could account for the final sensory quality. This information served as a foundation for the National Federation of Coffee Growers to develop regional designations of origin for Cauca, Nariño, Huila, Tolima and Sierra Nevada. Furthermore, the quality characteristics of coffee from 260 farms in 17 municipalities within the coffee cultural landscape of Caldas, consistently found coffee of excellent physical and sensory quality over three harvests, at 21 farms. This highlights the high potential for producing differentiated, outstanding-quality coffee. Nevertheless, they frequently identified sensory defects such as fermentated, earthy, and immature flavors which are typically associated with failures in post-harvest processing or damage from the coffee berry borer[12].
While previous studies[3,10,11] have characterized specific ecotopes or focused on the correlation of altitude within narrow regions, a comprehensive, multi-departmental analysis that integrates physical, sensory, and chemical characteristics of widely distributed ecotopes, remains a critical gap. Identifying possible associations between these characteristics and the specific climatic/geographic variables of multiple, diverse ecotopes across the Central Colombian coffee zone is essential for strategic planning and the targeted production of high-quality, differentiated coffee.
For this reason, the present study was conducted to characterize the physical and sensory qualities, chemical composition, and safety of coffee samples collected from coffee farms located in 12 key coffee departments in the central zone of Colombia, and to identify possible associations between these characteristics and the climatic variables of each ecotope.
-
A total of 400 coffee farms were randomly selected across a latitudinal range of 3° N to 7° N. This selection encompassed 12 departments and 20 distinct coffee ecotopes, based on the classification established. The geographic distribution of the selected ecotopes is illustrated in Fig. 1.
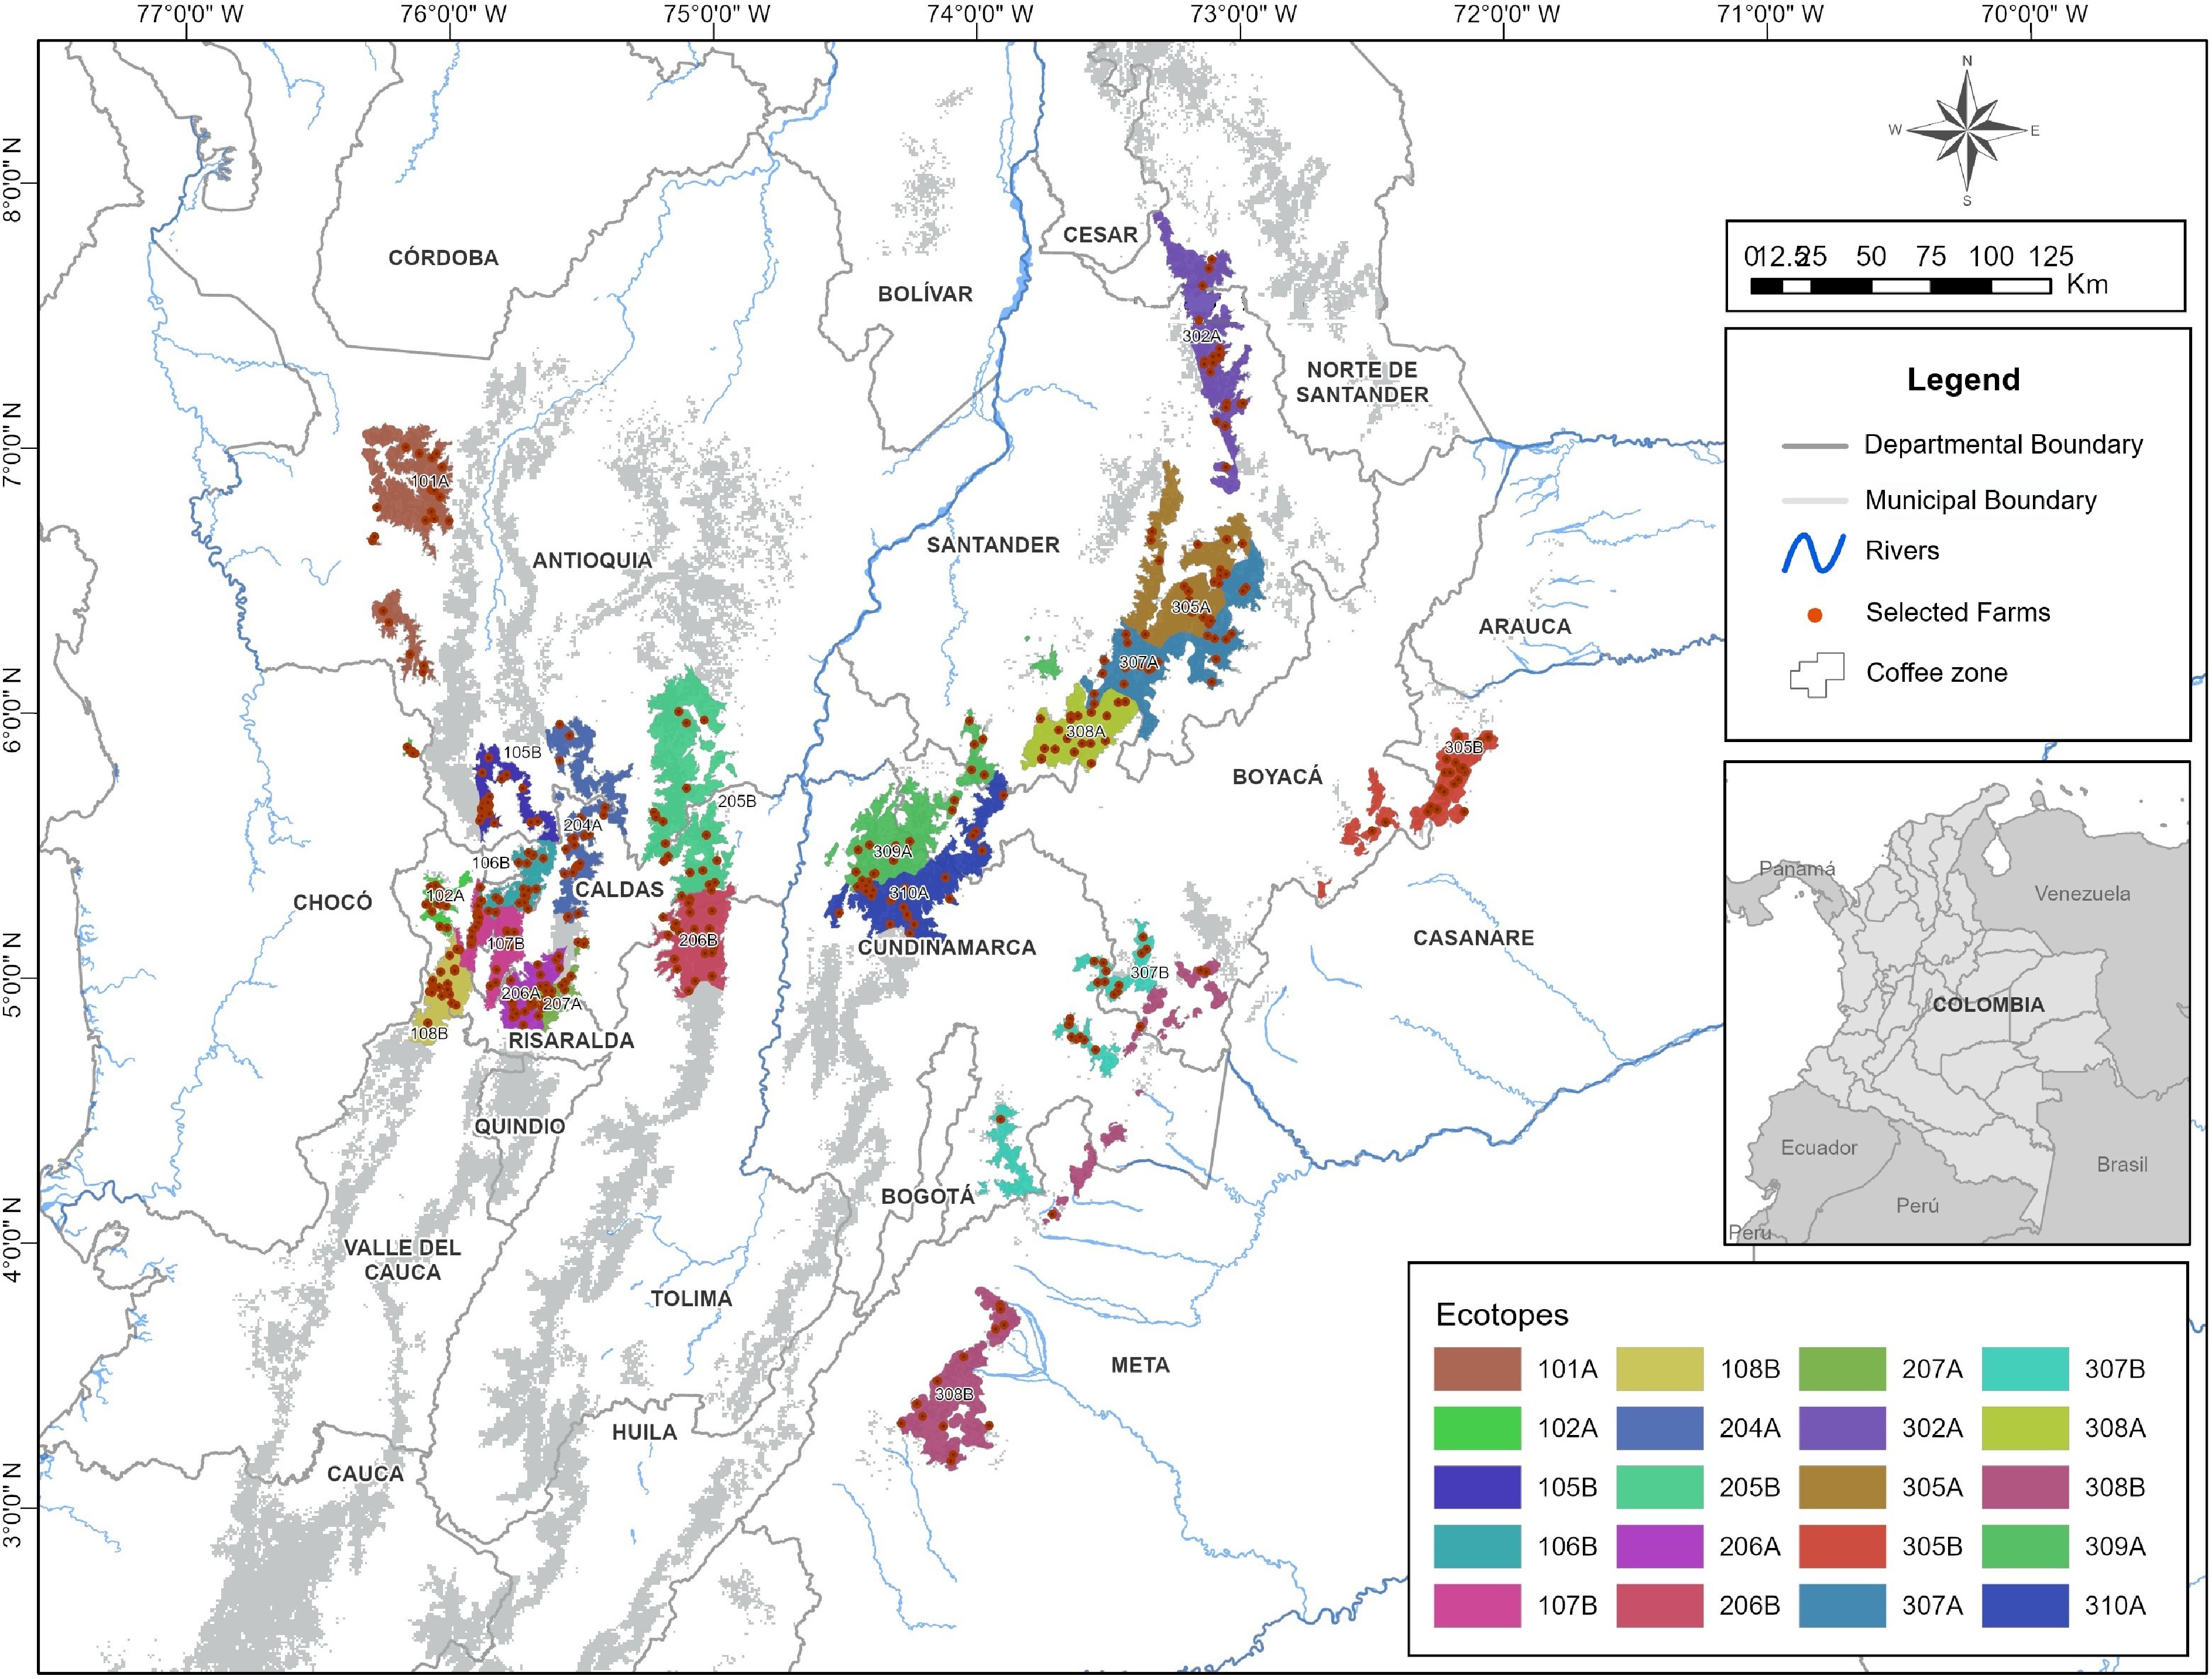
Figure 1.
Geographic location of the ecotopes identified for characterization of the quality and chemical composition of coffee.
Cultivation information and climatic variables for each farm were sourced from the Coffee Information System (SICA). SICA is a dynamic, national-coverage database that contains basic and georeferenced information on the country's coffee growers, their farms, and their coffee production systems, including cultivation area and age.
With the support of extension workers from the Extension Service of the National Federation of Coffee Growers of Colombia (FNC), a total of 1,110 dry parchment coffee samples were collected between 2021 and 2023. Wet processing was performed according to the specific criteria of each coffee grower. Samples were subsequently sent to the quality laboratories of the National Coffee Research Center (Cenicafé) for analysis. The samples were received and analyzed as quickly as possible. When necessary, they were stored in cold rooms with controlled temperature and humidity, 18 °C, and 65%, respectively.
Physical analysis
-
All analyses characterizing the physical quality of the coffee beans were conducted at the Coffee Quality Laboratory of Cenicafé. The procedures were based on the ICONTEC Colombian Technical Standards (NTC), and standardized FNC protocols.
Moisture and water activity
-
Moisture content for both dry parchment coffee beans and green coffee beans was determined using the reference standard NTC 2325[13]. Bean moisture was measured using a Kett instrument (Kett, USA), which operates on the capacitance principle. Water activity (aw), a thermodynamic parameter indicating the amount of available free water, was determined using the Reference Standard ISO 8787:2017[14]. The aw was measured on a 0 to 1 scale using a temperature-controlled Lab Master Neo instrument (Novasina, Germany).
Defects and granulometry
-
Physical defects were assessed based on the reference standard ICONTEC NTC 5938[15]. Percentages of loss attributable to husk (milling yield), healthy beans (without physical defects), and specific physical defects (brocaded, black, and sour beans) were determined. A percentage ≥ 75% healthy beans was defined as an indicator of good practices. The proportion of healthy beans was calculated using the ratio of the number of beans with physical defects, to the number of healthy beans in a 250 g sample of dry parchment coffee. Bean size was determined from a 300 g sample of green coffee using the methodology established in the NTC 5248 standard[16]. Granulometric analysis was performed using sieves; for instance, mesh 18 retains beans with a diameter of 18/64''.
Sensory analysis
-
Sensory analyses were performed following the Specialty Coffee Association (SCA) methodology[17]. Green coffee samples free of physical defects were roasted in a Probat sample roaster. An initial temperature of 200 °C (±10 °C) was maintained for 8 to 12 min to achieve a medium roast, corresponding to a color of 55 points on the Agtron/SCA scale. The cupping process was initiated at least 8 h after roasting.
The cupping panel comprised five Q-Graders certified by the Coffee Quality Institute (CQI). Each cupper scored the following sensory attributes on a scale of 6 to 10 points: fragrance, aroma, flavor, aftertaste, acidity, body, sweetness, uniformity, clean cup, balance, and the cupper's score. The SCA total score, which is the sum of the values of each attribute, was used as the response variable for sensory quality. Classifications of interest, according to the SCA scale, include < 70 points (outside the commercial range, presence of sensory defects), very good (80−84.99 points), excellent (85−89.99 points) and exceptional (90−100 points)[17].
Chemical composition
-
Green coffee bean samples were analyzed using Near-Infrared Spectroscopy (NIRS) across the wavelength range of 400–2,500 nm (NIRS Model 6500, NIRSystems, Silver Spring, Maryland, USA). This technique was employed to predict the content of key compounds: caffeine, total chlorogenic acids (CQA), total lipids, fatty acids (palmitic, linoleic, oleic, stearic, and arachidic), sucrose, and trigonelline. The analyses relied on predictive models developed and validated by Cenicafé[18]. The relative prediction errors for these compounds were 0.011, 0.004, 0.010, 0.002, 0.001, 0.003, 0.005, 0.007, 0.002, and 0.025, respectively.
Ochratoxin A determination
-
Ochratoxin A (OTA) concentration was determined by fluorometry using Vicam Ochratest® immunoaffinity columns, following the instructions in the manufacturer's manual[19]. Twenty five grams of ground coffee beans were extracted with 50 mL of methanol containing 3% NaHCO3, shaken at high speed, and filtered through Whatman No. 4 filters. Five mL of the filtrate were diluted in 20 mL of phosphate-buffered saline (PBS) with 2.0% Tween 20 and filtered through a 1.5 μm glass microfiber filter. For extraction, 10 mL of the diluted extract was passed through the column at a rate of 1 to 2 drops per s, using a glass syringe to generate controlled vacuum pressure. The column was subsequently washed with 10 mL of PBS/2% Tween-20 at the same flow, and finally, with 10 mL of distilled water. Elution was performed with 1.5 mL of Ochratest® eluting solution at a rate of 1 drop per s. The eluate was collected in a vial, placed in a previously calibrated Vicam fluorometer (4Ex series), and the OTA concentration of the sample was recorded in parts per billion (ppb).
Climatic data acquisition
-
Annual historical information on climatic variables was obtained for each farm. The variables considered were precipitation (mm) and average, maximum, and minimum temperatures (°C). These data were sourced using the tools and information bases available on the Coffee Agroclimatic Platform[20].
Statistical analysis
-
A descriptive analysis was carried out for all variables of interest. The distribution of farms based on their location and altitudinal range was determined for each ecotope.
A multivariate classification analysis was conducted to identify homogeneous groups of coffee samples based on; physical quality variables, (percentages of moisture, loss, and healthy beans, yield factor, water activity [aw], and bean size); chemical composition variables (lipids, total chlorogenic acids [CQA], sucrose, caffeine, trigonelline, and palmitic, linoleic, oleic, stearic, and arachidic acids); sensory quality (SCA total score), and climatic/geographic variables (altitude, average annual precipitation, and average annual temperature).
Prior to the analysis, all quantitative variables were standardized to zero mean and unit variance to avoid scale effects and ensure comparability. Clustering was performed using the K-means algorithm implemented in the FASTCLUS procedure of SAS (version 9.4) (Supplementary Table S1). The analysis was constrained to a maximum of four clusters and Euclidean distances computed on standardized variables were used for cluster assignment. Initial cluster seeds were specified to ensure reproducibility.
The quality of the clustering solution was evaluated using internal validation statistics, including the Pseudo-F statistic, the Cubic Clustering Criterion (CCC), and the overall R2.
To further assess cluster separation and identify the variables that most contribute to group discrimination, a canonical discriminant analysis (CDA) was subsequently performed using PROC CANDISC, with cluster membership as the classification variable. Canonical variables were used to visualize cluster separation in a two-dimensional space.
-
The geographic distribution analysis revealed that 60.9% of the studied farms are located at altitudes exceeding 1,400 m. Specifically, ecotopes 308A and 204A showed a high concentration of high-altitude farming, with over 50% of their associated farms situated above 1,800 m. Conversely, ecotopes 305B and 308B showed a lower altitude profile, with at least 48% of their farms falling into the range below 1,200 m. Furthermore, 40% of the farms within ecotopes 101A, 102A, 107B, 206A, 302A, 307A, 309A, and 310A are concentrated in the altitudinal band between 1,400 m and 1,600 m. Regarding latitude, 67.7% of the coffee samples are located in the range of 5° N to 6° N. In ecotope 302A, all farms are situated north of 6° N, corresponding to farms in the departments of Santander and Norte de Santander.
Climatic conditions
-
Figure 2 shows the annual average precipitation data and the annual average values of the mean, maximum, and minimum temperatures for the evaluation years 2021, 2022, and 2023. These years have been characterized as La Niña conditions[21].
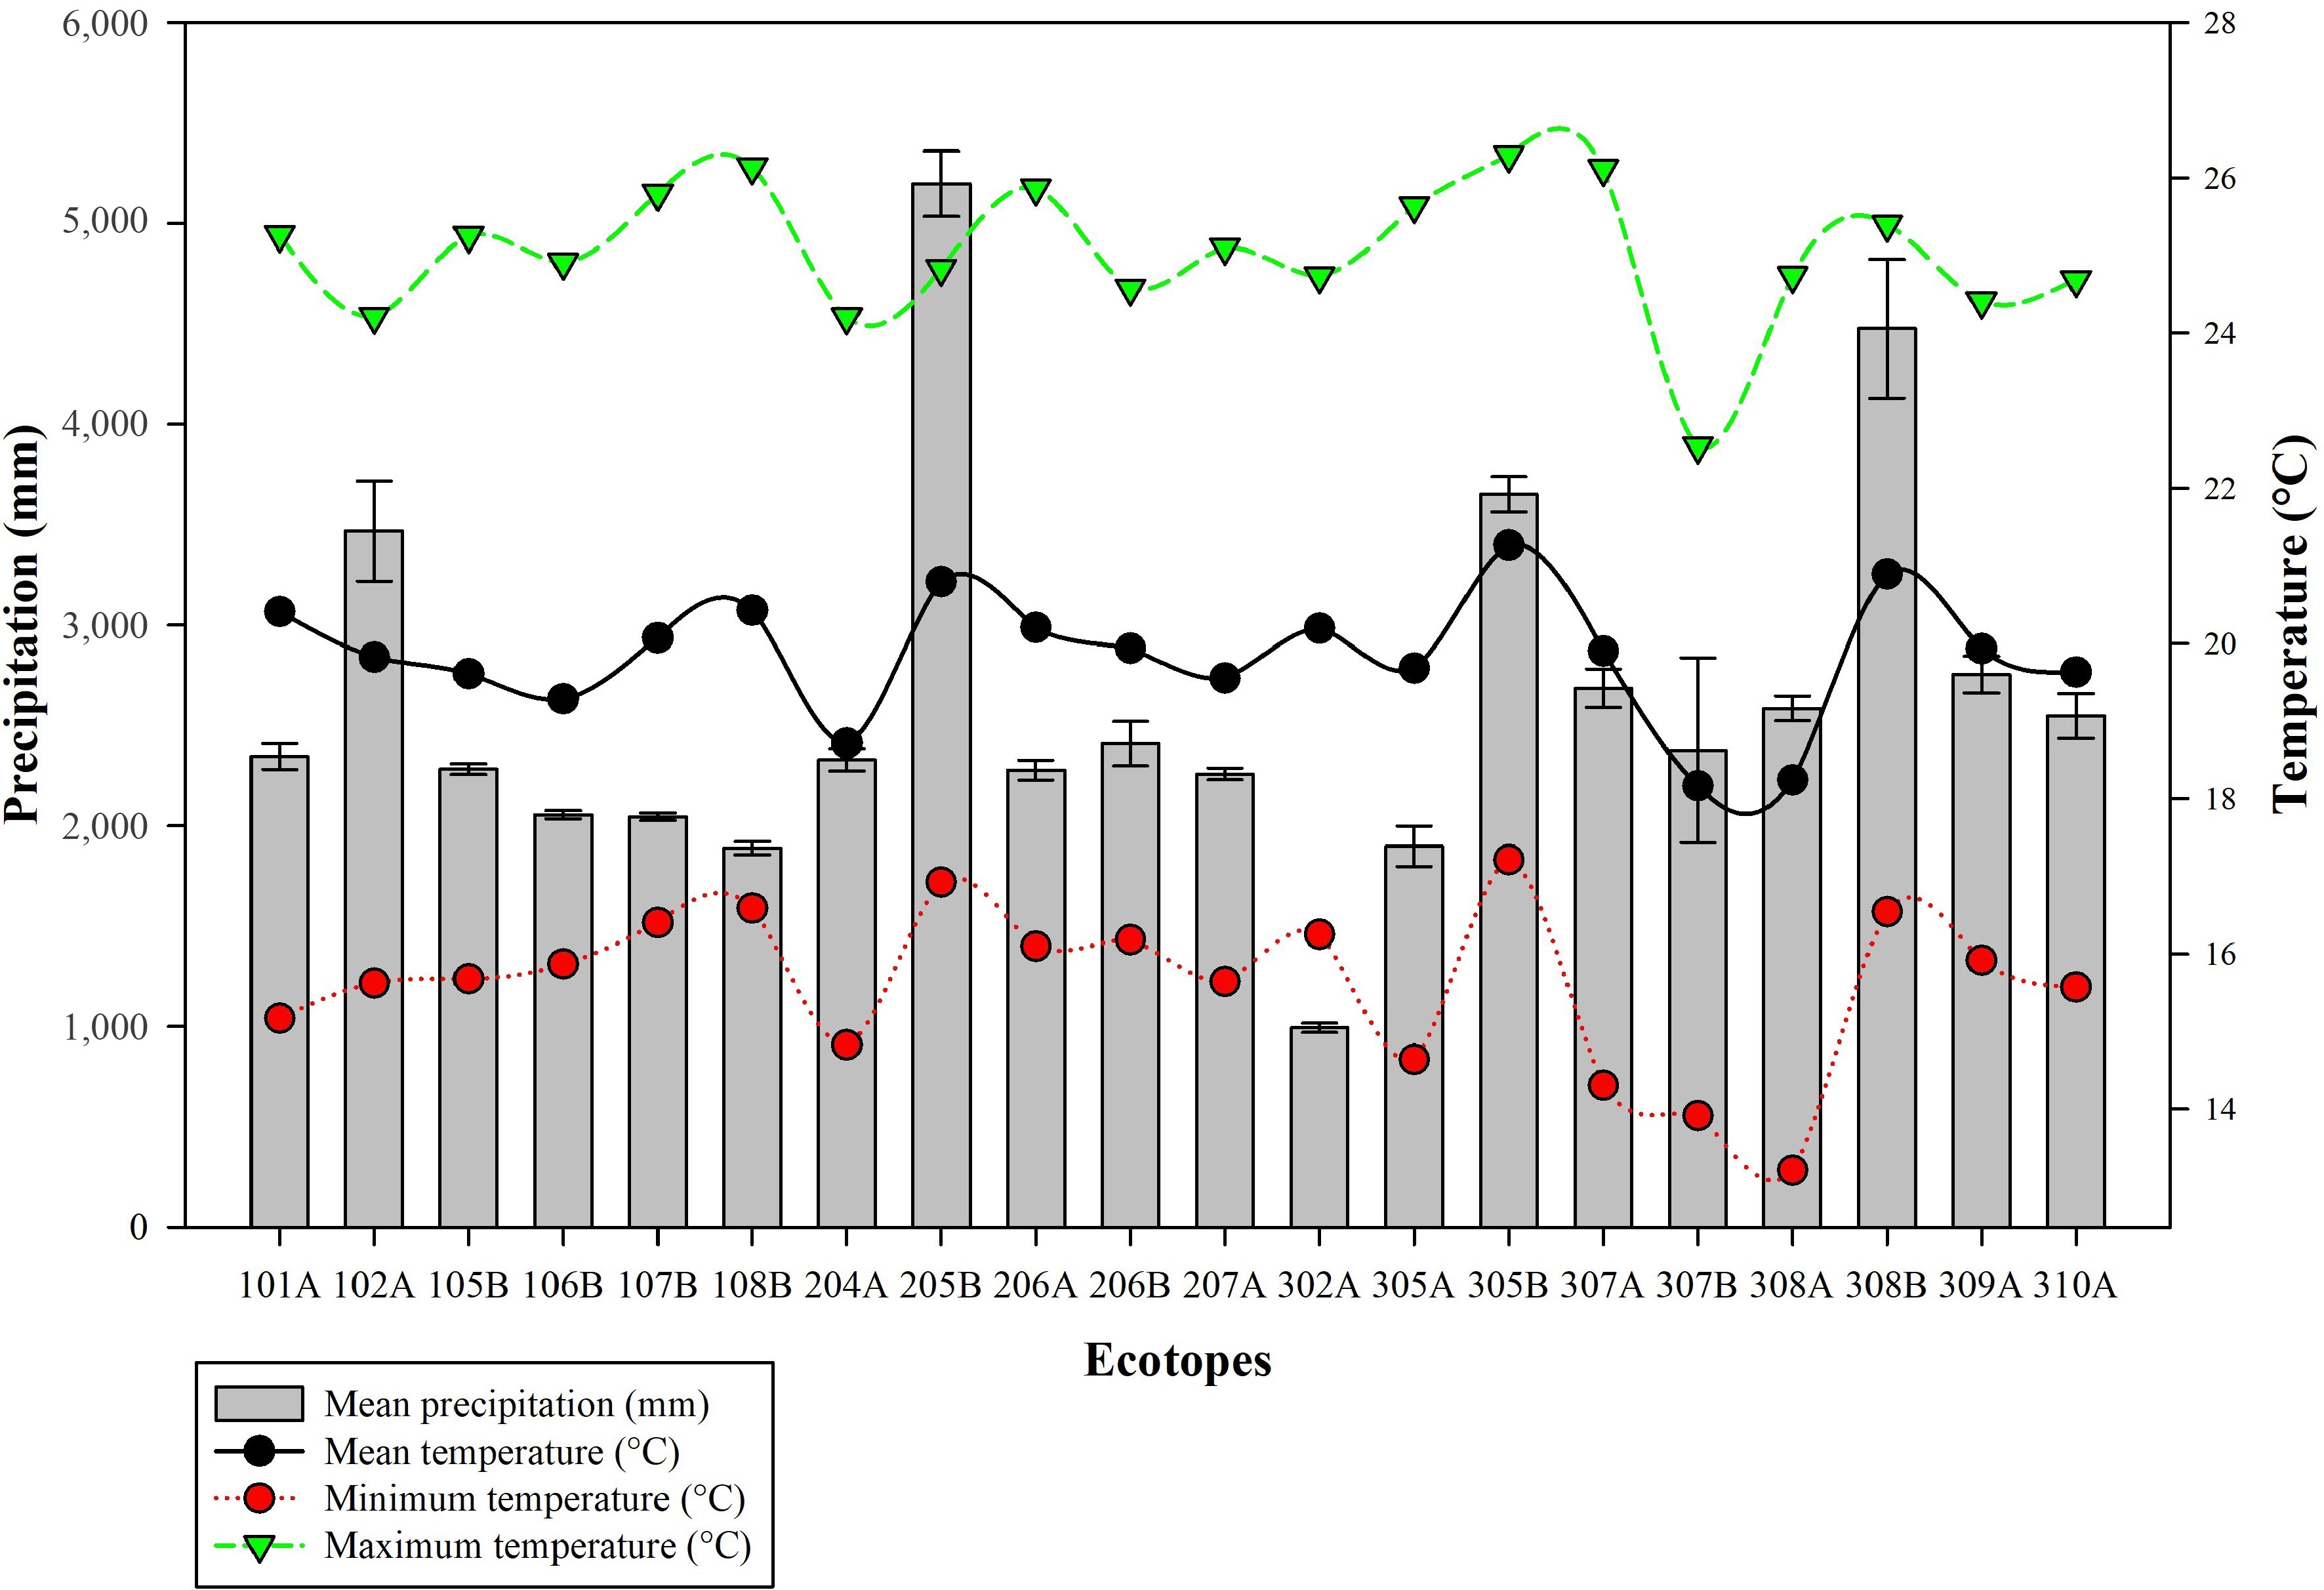
Figure 2.
Annual precipitation (mean and interval) and temperature metrics (mean, maximum, and minimum values) across different ecotopes from 2021 to 2023.
The size of the farms was on average 5.7 ha, between 0.2 ha in size in ecotopes 106B and 107B, and large farms of more than 50 ha located in ecotopes 101A (59.99 ha), 206A (86.41 ha), 308B (60 ha), and 307A (80 ha), which are located in the departments of Antioquia, Caldas, Meta, and Santander, respectively. In general, 44.1% of the farms are less than 1.0 ha. In the 206A ecotope, the highest proportion of farms with areas greater than 5.0 ha are located in the departments of Caldas and Risaralda, specifically in the municipalities of Chinchiná and Marsella, respectively.
The useful life of a coffee tree can reach 20 years, but intervention via tissue rejuvenating pruning must occur every four or five harvests when production begins to decline[22]. On average, the age of the crops in the ecotopes was 5.65 years, with observed maximums and minimums of 20.68 and 0.46 years, respectively. In ecotopes 302A (47.6%), 307B (47.6%), and 308B (68.2%), there were farms with at least 40% of their crops that were more than 6 years old. These ecotopes are part of the departments of Norte de Santander, Santander, Boyacá, Cundinamarca, and Meta, respectively.
The physical, sensorial, and chemical composition of coffee is affected by the plant's genetic origin. In Colombia, the National Federation of Coffee Growers (Federación Nacional de Cafeteros), through genetic development, and while conserving the Coffea arabica species, has provided growers with varieties that are resistant to diseases and possess acceptable physical and quality parameters. For the development of these varieties, different advanced progenies from the Cenicafé Genetic Improvement Program were evaluated. These progenies originated from the cross between the Caturra variety, and the Timor Hybrid 1343[23]. All coffee samples analyzed in this work belong to the Coffea arabica species, and 98.11% were disease-resistant varieties, with 85.02% of Castillo®, 10.29% Colombia, Cenicafé 1, 2.01%, and Tabi 0.72%. Other farms had coffee cultivars not resistant to coffee rust, such as Caturra and Típica, with 1.35% and 0.54% respectively.
Physical quality
Coffee moisture
-
Of the total of 1,110 samples received during the three years, 57.5% presented humidity in the coffee hulls in the desired range of 10% to 12%. A total of 8.7% presented values higher than those desired, and 33.8% were below 10%. These values have a negative effect on the shelf-life of the coffee in terms of the storage, threshing, and subsequent roasting processes[24]. In general, the average humidity of dry parchment coffee was 10.49%, with a maximum value of 28.2% and a minimum value of 6.4%.
Water activity
-
The average water activity value was 0.59. When the humidity of the coffee ranged from 10% to 12%, the water activity values were less than 0.62[24]. The samples from ecotopes 101A, 307B, 204A, 205B, 106B, 105B, 108B, 305B, 305A, 302A, 207A, and 206A had average values less than 0.6, indicating a high proportion of final coffee moisture values below 10%.
Bean size
-
A total of 88.0% of the coffee samples were retained in mesh 16, indicating a grain size classified as supreme. Similar values were reported for coffee samples from the department of Huila, with 73% being resistant cultivars[25]. Among the samples evaluated in this study, 97.8% were from coffee varieties resistant to the disease caused by the fungus Hemileia vastatrix, such as Castillo®, Colombia, Cenicafé 1 and Tabi, which explains the size of the beans.
In general, the average healthy bean percentage was 78.1%. Ecotopes 105B, 204A, 302A, 305A, and 305B are highlighted, where average values greater than 79% were observed. Moreover, in no ecotope were the average values less than 75%, indicating good physical quality of the samples.
The overall average value of the losses was 17.89% for the samples received. Physical defects, such as black and vinegar beans, are classified into Group 1, as in addition to affecting physical quality, they also have an impact on sensory quality. For this variable, the lowest average value was found in ecotope 204A, and the highest was found in 308A, corresponding to the departments of Caldas and Risaralda (204A), and Boyacá, Santander, and Cundinamarca (308A). Additionally, brocaded grains are indicators of pest control and management. Black and vinegars beans can generate sensory defects that are classified as overfermented, whether pulped, fermented, or stinker[1].
Sensory quality
-
In general, 60% of the samples were obtained without sensory defects (Table 1). The sensory defects presented were: Earthy (14.53%), Fermented (13.9%), Immature (5.14%), Rested (4.6%), and to a lesser extent, phenol (1.81%). This defects are associated with overfermented and earthy defects, which are indicators of undesirable practices in the fermentation process of the mucilage of coffee[26] and drying interruptions with moisture contents greater than 40%.
Table 1. Percentages of samples without defects, and with sensory defects, present in each ecotope.
Ecotope Phenol
(%)Fermented
(%)Immature
(%)Rested
(%)Earthy
(%)No defect
(%)101A 10,8 7,7 1,5 20,0 60,0 102A 15,8 7,0 8,8 14,0 54,4 105B 3,5 12,3 3,5 1,8 14,0 64,9 106B 1,7 21,7 5,0 3,3 11,7 56,7 107B 1,5 15,2 7,6 6,1 15,2 54,5 108B 5,0 21,7 5,0 6,7 20,0 41,7 204A 25,0 1,7 1,7 5,0 66,7 205B 1,7 21,7 5,0 1,7 26,7 43,3 206A 1,9 18,5 3,7 5,6 18,5 51,9 206B 3,8 17,0 5,7 1,9 7,5 64,2 207A 9,5 4,8 7,9 9,5 68,3 302A 1,6 9,5 6,3 1,6 15,9 65,1 305A 3,3 13,3 5,0 8,3 70,0 305B 1,9 7,7 90,4 307A 5,2 6,9 1,7 17,2 69,0 307B 4,2 10,4 10,4 10,4 6,3 58,3 308A 3,8 23,1 1,9 3,8 13,5 53,8 308B 3,4 6,9 3,4 20,7 22,4 43,1 309A 9,7 3,2 19,4 67,7 310A 3,2 6,5 6,5 19,4 64,5 Average (%) 1,8 13,5 5,1 4,6 14,6 60,4 Standard
deviation (%)1,7 7,0 2,2 4,9 5,9 11,3 Coefficient of
variation (CV)98,8 51,9 43,7 107,1 40,6 18,8 In Table 1, the proportions of samples without defects and with sensory defects are presented, and in ecotopes 305A, 305B, and 307A, more than 68.0% of the samples were without sensory defects. Ecotope 305B, which covers the departments of Boyacá and Casanare presented the highest percentage (90.4%) of samples without sensory defects. In a characterization carried out from 2015 to 2017 in municipalities in the eastern department of Caldas, 75.16% of the samples did not present sensory defects, which is much greater than the percentage of sensory defects reported in this study, since the beneficiation process was standardized and controlled[27]. Regarding the types of defects found, the most frequently reported were fermentation (8.06%), and earthiness (5.81%), which also corresponds to those with the highest frequency found in the 20 ecotopes evaluated in this study. Among the 445 coffee samples from the coffee-growing municipalities of Huila collected in 2016, 2017, and 2018, 75.19% of the samples were without defects[25], which also exceeds the percentages reported in this study, and coincides with the fact that the process was standardized[27]. The defect that they reported in greater proportion was rested coffee (13.54%)[25], which, in this study, had a lower value.
Fermented and earthy sensory defects were the most frequently present. In ecotopes 204A and 205B, the fermented and earthy defects occurred in 25% and 26.7% of samples, respectively.
The average total score for the samples without sensory defects was 81.2 (CV 1.4%). Ecotopes 101A, 102A, 308A, 309A, and 310A stand out, where maximum scores above 85 points were observed, which classify coffee as excellent, and are from farms located in the departments of Antioquia, Chocó, Santander, and Cundinamarca.
Coffee safety
-
To characterize the safety of the beans, ochratoxin A (OTA) content was quantified. The highest value was observed in samples from ecotope 307B (8.11 ppb). Grain coffee subjected to interruptions during mechanical drying reported variable values ranging from 4.2 to 6.8[28]. These coffees were processed through all the classification stages of the beneficiation process to obtain healthy coffee. In general, the average OTA concentration in the samples obtained from the farms was 5.22 ppb. The current standard (EU1370/2022) for roasted coffee and soluble coffee contains values up to 5.0 µg kg–1; however, although this mycotoxin is heat resistant, it has been shown that there is a reduction due to the roasting process, and reduction percentages of 69% to 90% have been reported[29]. It was concluded that for this variable, all the samples from the ecotopes would not exceed the maximum levels allowed after roasting.
K-means cluster analysis
-
The K-means analysis identified four distinct clusters of coffee samples with statistically significant separation (Pseudo-F = 103.7; p < 0.001). The Cubic Clustering Criterion and the overall R2 supported the presence of a well-defined multivariate structure. Variables related to grain physical quality, yield efficiency, lipid composition, and agroclimatic conditions showed the highest discriminatory power among clusters.
Canonical discriminant analysis confirmed the robustness of the clustering solution. The first two canonical variables explained approximately 84% of the between-cluster variability, and all canonical dimensions were statistically significant (Wilks' λ = 0.115, p < 0.0001). The first canonical axis (Can1 = 54.0%) was mainly associated with grain size, lipid composition, altitude, and temperature, whereas the second axis (Can2 = 29.8%) reflected differences in grain physiological condition, moisture, and yield-related variables. These results indicate that the four clusters are well differentiated in the reduced multivariate space, supporting the validity of the K-means classification
Dimensionality reduction through canonical discriminant analysis projects individual coffee samples from the original multivariate space into a reduced canonical space, preserving the main patterns of similarity and dissimilarity among samples.
When clusters were projected onto the canonical discriminant space, clear differences in their multivariate profiles became evident. Cluster 3 was associated with samples originating from higher altitudes, characterized by larger bean size and a favorable lipid profile, particularly higher linoleic acid content.
In contrast, cluster 2 comprised samples from lower-altitude environments, associated with higher temperatures and increased stearic acid content. Cluster 1 was characterized by inferior physical quality, exhibiting higher percentages of defective material (hulling loss) and a lower yield factor, thus representing a low physical and productive quality profile. Conversely, cluster 4 grouped samples with good physical quality and a favorable yield factor, reflecting a balanced and stable quality profile.
The identified clusters represent distinct coffee profiles integrating physical, chemical, and environmental attributes. The strong influence of grain size and lipid composition highlights their relevance in differentiating quality classes, while variables such as altitude and temperature contribute to structuring these profiles. Grouping by altitudinal ranges was selected because Canonical Discriminant Analysis (CDA) identified altitude as a primary determinant of the first canonical variable (Can1), which explains the highest proportion of the total variance (54%). Altitude functions as a structural driver that modulates both physical bean development and chemical composition, enabling a clear and statistically significant differentiation between high-quality profiles (Cluster 3–high altitude) and profiles conditioned by thermal stress (Cluster 2–low altitude). Based on these results, a detailed description of physical, chemical and sensory quality attributes is presented according to altitudinal ranges.
Physical quality by altitudinal range
-
The physical quality variables included the humidity of the coffee, the presence of physical defects, and the size of the coffee beans. For the variable percentage of healthy beans, higher values were obtained in farms located in an altitude range of less than 1,000 m (Table 2). These results differ from those reported for coffee samples obtained from different coffee regions of the department of Huila, where the lowest value of healthy beans was obtained in samples from agroecological Zone 4 (ZAE4), which are from farms located at lower altitudes[25]. For this specific study, farms located at lower altitudes possibly employ appropriate classification practices during the beneficiation process and have agroforestry systems that favor lower values of physical defects and pest attacks[30,31].
Table 2. Physical quality variables by altitudinal range.
Cluster Hulling loss* (%) Healthy beans* (%) Milling field factor* Bean size greater than 16* (%) Av1. S.D. Av. S.D. Av. S.D. Av. S.D. 1 17.98 1.368 77.26 4.289 90.73 5.915 87.81 6.494 2 17.54 1.787 77.20 5.350 91.03 7.154 86.03 7.834 3 16.43 1.860 79.72 3.121 87.94 3.530 85.47 8.386 4 18.73 1.193 77.41 3.640 90.89 4.756 87.84 6.663 * Values are shown for descriptive purposes only.
1 AV: average. S.D: Standard deviation.In contrast, the bean size was greater in the farms located in a range greater than 1,400 m. In coffee from the Kaffa area in Ethiopia, the altitude of the farms affected significantly (p value < 0.001) the size of the beans, resulting in higher retention values above mesh 14 (98.15%) for coffee from areas at altitudes greater than 1,500 m[4].
Sensory quality by altitudinal range
-
The SCA score of samples without sensory defects did not differ significantly among clusters. Confirming what was found in the identification of the classification variables, where maximum or minimum scores can be obtained regardless of the altitudinal range or cluster where it is found. In Fig. 3, the distribution of the total score of all samples by altitudinal range is presented.
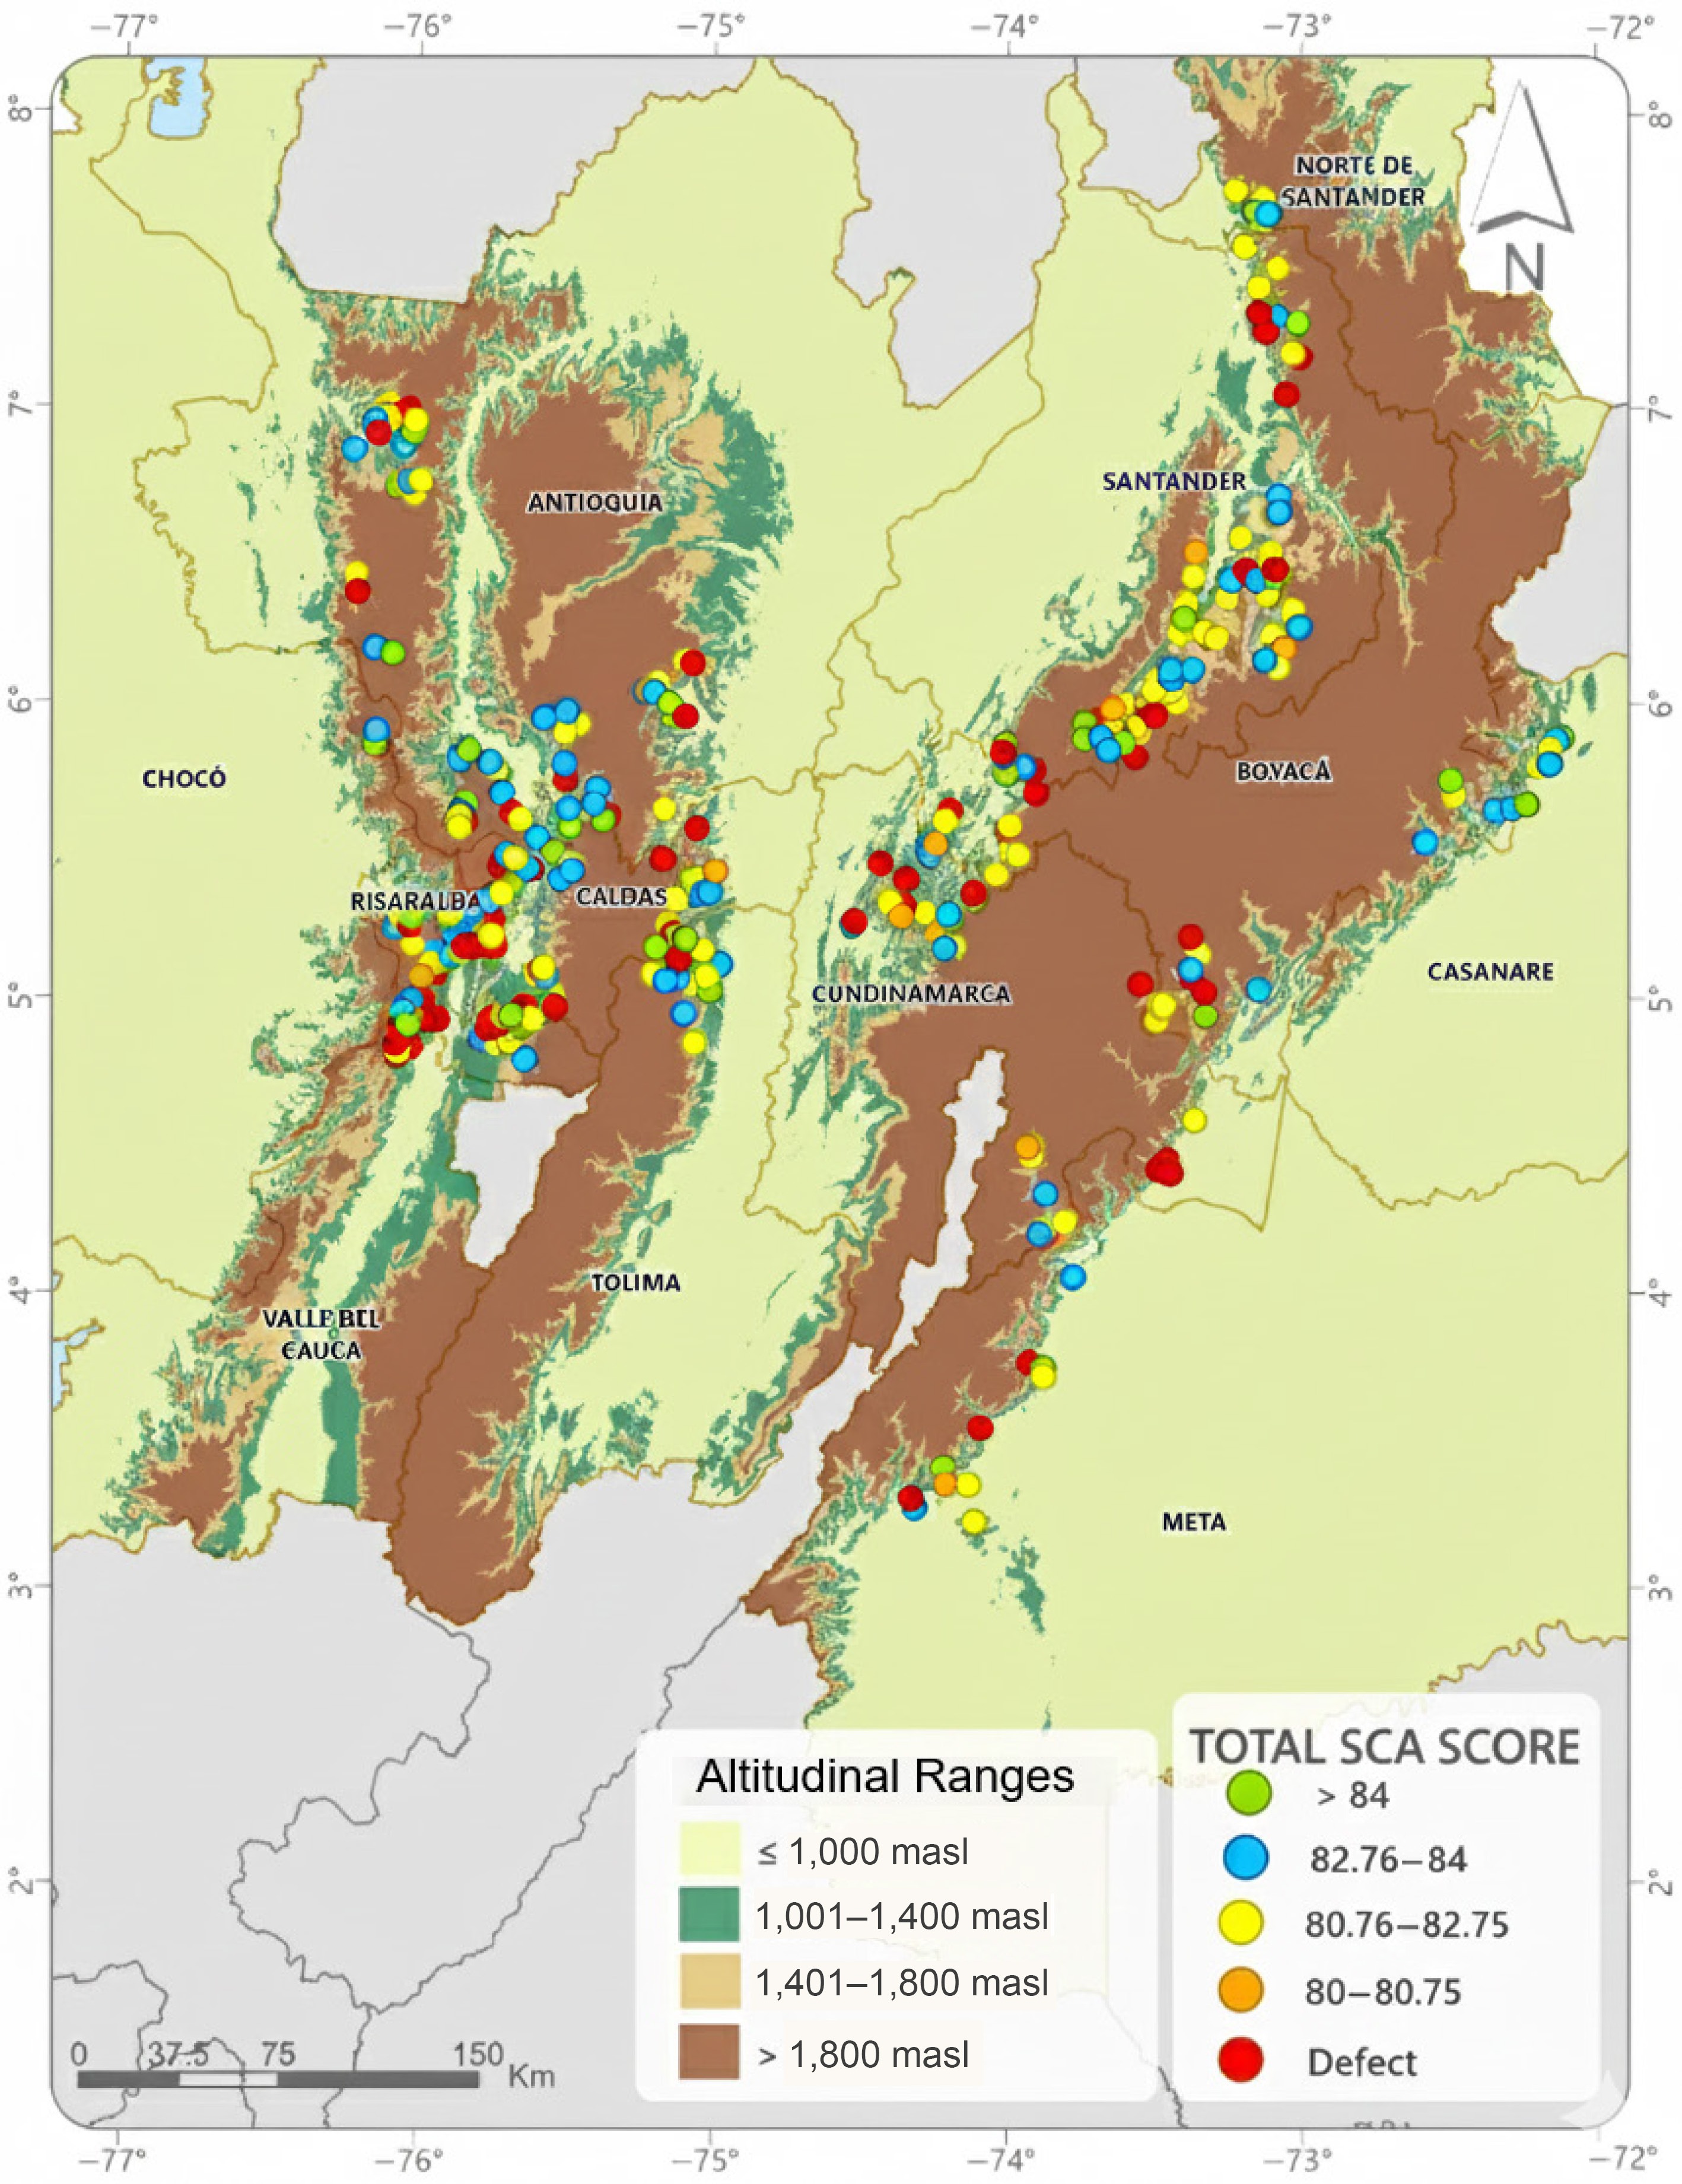
Figure 3.
Total SCA score of the samples received by the altitudinal range.
Chemical composition and quality precursors
Sugars, chlorogenic acids, and alkaloids
-
Sucrose content was highest in samples from the > 1,800 m range (8.10%) (Table 3), suggesting that the cooler conditions at the highest altitudes favor sucrose accumulation[32]. Conversely, total chlorogenic acids (CQA), key precursors of bitterness, showed a clear negative relationship with altitude, with the lowest concentration observed in the > 1,800 m range (5.23%). Caffeine and trigonelline contents did not show a similarly marked relationship with altitudinal ranges.
Table 3. Chemical compounds by altitude range.
Chemical Compounds (%)* Altitudinal range (m) Less than 1,000 1,001–1,400 1,401–1,800 Greater than 1,800 AV S.D. CV** AV S.D. CV AV S.D. CV AV S.D. CV Total lipids 10.38 0.84 8.1 10.98 0.78 7.1 11.08 0.66 6.0 11.12 0.59 5.3 Chlorogenic acids 5.44 0.16 2.9 5.39 0.20 3.7 5.37 0.20 3.8 5.23 0.22 4.2 Sucrose 8.02 0.44 5.5 8.01 0.39 4.8 7.98 0.38 4.7 8.1 0.42 5.2 Caffeine 1.01 0.07 7.1 1.05 0.09 9.0 1.09 0.09 8.3 1.09 0.09 7.8 Trigonelline 0.82 0.04 5.0 0.86 0.06 7.0 0.85 0.05 5.8 0.86 0.05 6.1 FA. Linoleic 39.59 0.73 1.8 39.81 0.95 2.4 40.31 0.91 2.2 40.79 0.86 2.1 Palmitic FA. 37.62 0.65 1.7 37.67 0.68 1.8 37.95 0.61 1.6 38.00 0.53 1.4 FA. Oleic 12.74 0.68 5.3 12.33 0.83 6.7 12.19 0.81 6.7 11.88 0.78 6.6 Stearic FA. 8.18 0.44 5.3 8.31 0.59 7.1 7.92 0.56 7.1 7.82 0.51 6.5 Arachidic FA. 2.02 0.34 16.7 2.01 0.37 18.2 1.81 0.37 20.2 1.71 0.36 20.9 * Values are shown for descriptive purposes only.
** CV Coefficient of variation.Lipids and fatty acid profile
-
Total lipid levels (Table 3) were higher in the clusters above 1,400 m (10.8% to 11.12%) compared to the lower clusters (10.38%). Similar behavior was reported in green coffee samples from Quindío in the years 2021 and 2022[33]. Regarding the major fatty acids:
(1) Palmitic acid (saturated): the highest concentration (37.9%) was identified in samples collected above 1,400 m.
(2) Linoleic acid (polyunsaturated): a peak of 40.79% was recorded at the highest altitude (> 1,800 m), aligning with its negative correlation with ambient temperature[34].
(3) Oleic acid (monounsaturated): the maximum value (12.74%) was observed in samples from altitudes ≤ 1,000 m.
-
The present study involved a large-scale analysis of 1,110 coffee samples from 400 coffee farms located in 20 different ecotopes, incorporating physical, sensory, and chemical analyses. Clustering analyses, along with climatic information, revealed that the variables could be classified into four altitudinal ranges. This revealed a clear agroclimatic stratification that drives the accumulation of some chemical compounds in the bean. However, sensory quality, quantified in score SCA, was not related to altitudinal range. Similar results were reported in previous regional studies[35], where they concluded that sensory quality was not significantly differentiated solely by wide altitudinal ranges; our multidimensional approach, incorporating chemical and clustering analyses, reveals a clear agroclimatic stratification driving the accumulation of some chemical compounds. Specifically, samples sourced from the highest altitudinal range (> 1,800 m) exhibited the maximum sucrose content (8.10%), consistent with the theory that cooler conditions slow fruit maturation, thus prolonging the period available for the translocation and accumulation of sugars[32]. Simultaneously, these same high-altitude samples showed the lowest concentration of Total Chlorogenic Acids (CQA), (5.23%).
Significant differences were also observed in the lipid fraction, which is crucial for aroma transport, beverage body, and stability during storage and roasting[33]. Total lipid content was significantly higher in the clusters above 1,400 m (reaching 11.12%). Furthermore, we demonstrated a differential accumulation pattern for fatty acids. Palmitic acid (a saturated fatty acid, [SFA]) was significantly higher in samples above 1,400 m (37.9%), while Linoleic acid (a polyunsaturated fatty acid, [PUFA]) was highest in coffee from the > 1,800 m range (40.79%). The high concentration of linoleic acid at high altitudes is consistent with its reported negative correlation with temperature[34], indicating that PUFA synthesis or preservation is favored in the cooler climate.
The use of K-means clustering proved essential for dissecting the complex interplay between the variables. By grouping the 400 farms based on physical, chemical, GPS data, and climatic/geographic data, the analysis was able to identify homogeneous groups whose separation is rooted in multi-dimensional characteristics, rather than just one parameter. This robust grouping methodology explains the stratification of the key chemical parameters (sucrose, CQA, lipids) and resolves the apparent contradiction noted in previous studies that relied on simpler, one-dimensional altitudinal stratifications[35].
In conclusion, this comprehensive analysis substantiates the critical role of altitude-driven agroclimatic conditions in shaping the chemical composition and quality potential of Colombian arabica coffee. However, it is imperative that all recommendations regarding bean classification and sorting be rigorously implemented and maintained. These practices are essential for preventing the occurrence of defects associated with inadequate procedures during the wet-milling (beneficio) stage. Furthermore, it is crucial to ensure the exclusive processing of mature cherries, and to secure adequate drying capacity, which allows for the uninterrupted continuity of the drying process. In this way, the quality of the final beverage obtained across the country's diverse producing regions can be consistently guaranteed.
Additionally, validating the stability of these identified clusters across multiple harvests will be crucial for establishing them as reliable indicators for quality-based geographical indication or denomination of origin strategies in the country.
-
The physical, sensory, and chemical compositions of coffee produced on 400 farms across 12 departments in 20 ecotopes in the central zone of Colombia were comprehensively characterized. Our findings confirm that Colombian coffee ecotopes exhibit significant agroclimatic diversity, which is fundamentally contributing to the wide range of chemical and sensorial profiles observed.
The analysis establishes a strong correlation between altitudinal clusters and the bean's chemical composition. Specifically, the concentrations of key compounds—including lipids, caffeine, trigonelline, and sucrose—were significantly higher in samples originating from altitudinal clusters above 1,400 m. Furthermore, physical quality indicators (proportion of healthy beans, defect levels, and bean size) were consistently robust, falling within established commercial ranges for high-quality coffees across all 20 ecotopes evaluated.
Crucially, no significant differences were identified in the total SCA sensory quality score across the altitudinal ranges. This outcome strongly indicates that while altitude provides the inherent chemical potential for superior quality, the final sensory outcome is not solely determined by this variable.
Therefore, to achieve superior quality, it is strongly recommended that post-harvest processing (beneficiation) techniques and defect mitigation strategies be optimized at the farm level. Strengthening technical training in processing is paramount to effectively unlocking the inherent quality potential of Colombian coffee.
To the technical management of the National Federation of Coffee Growers. To the coffee growers in the Colombian departments that participated in the project. At Cenicafé, to Dr. Álvaro Gaitán and colleagues Claudia Gallego, Paola Calderon, Wilson Vargas, Víctor Castañeda, and Valentina Cruz.
-
The authors confirm their contributions to the paper as follows: study conception and design: Pabón J, Osorio V; data collection: Pabón J; analysis and interpretation of results: Pabón J, Osorio V, Gómez CR, Medina R; draft manuscript preparation: Pabón J, Osorio V, Gómez CR, Medina R, Garcia JC. All authors reviewed the results and approved the final version of the manuscript.
-
The datasets generated during and/or analyzed during the current study are available from the corresponding author upon reasonable request.
-
The authors declare that they have no conflict of interest.
-
accompanies this paper online at: https://doi.org/10.48130/bpr-0026-0006.
- Supplementary Table S1 PROC FASTCLUS analysis using LEAST = Clustering Criterion.
- Copyright: © 2026 by the author(s). Published by Maximum Academic Press, Fayetteville, GA. This article is an open access article distributed under Creative Commons Attribution License (CC BY 4.0), visit https://creativecommons.org/licenses/by/4.0/.
-
About this article
Cite this article
Pabón J, Osorio V, Medina R, Gómez CR, García JC. 2026. Quality and chemical composition of coffee from the central zone of Colombia. Beverage Plant Research 6: e020 doi: 10.48130/bpr-0026-0006 

Quality and chemical composition of coffee from the central zone of Colombia
- Received: 21 October 2025
- Revised: 23 December 2025
- Accepted: 04 February 2026
- Published online: 28 May 2026
Abstract: Colombian coffee is a key reference in the global market due to its quality, which is determined by the interaction of multiple agronomic factors, fundamentally including the cultivar (variety), the specific characteristics of the origin (terroir), and the efficiency of post-harvest practices. This study characterized the physical, sensory, and chemical composition of coffee across Colombia to establish quality benchmarks. A multi-year analysis (2021–2023) examined 1,110 samples from 20 ecotopes across 12 departments (Caldas, Antioquia, Casanare, Chocó, Cundinamarca, Boyacá, Santander, Norte de Santander, Risaralda, Meta, Tolima and Valle del Cauca). The study focused on rust-resistant varieties (97.8%). Methods included physical grading, SCA sensory evaluation, and chemical assessment. Sensory analysis revealed 40% of samples had defects, primarily ferment (14%) and earthy (13%), indicating processing inconsistencies. However, ecotopes 101A (Antioquia), 308A/309A (Santander), and 102A (Chocó) yielded excellent quality (> 85 points). Classification analysis defined four altitudinal ranges explaining chemical variations. Although altitude did not significantly affect total sensory scores, samples above 1,400 m showed higher lipids, caffeine, trigonelline, and palmitic acid, while sucrose and linoleic acid increased above 1,800 m. The climatic variability of the central Colombian zone induces diverse sensory profiles; however, preserving and fully expressing this qualitative potential requires the optimization of post-harvest practices, a critical factor for the effective prevention of defects.
-
Key words:
- Altitude /
- Ecotope /
- Sensory defects /
- Trigonelline /
- Latitude