











-
Rice ranks as the world's second most vital staple crop, cultivated across more than 100 nations on approximately 155 million hectares[1]. In Sri Lanka, rice is grown in all districts and makes a significant economic contribution-accounting for about 5% of the national GDP and 17.5% of the agricultural GDP[2]. Rice farming in Sri Lanka spans diverse climatic, edaphic, and hydrological settings. The country is broadly categorized into three Climatic Zones (CZs) based on annual rainfall patterns: the Dry Zone (DZ), receiving under 1,750 mm with a marked dry season; the Wet Zone (WZ), receiving over 2,500 mm evenly throughout the year; and the Intermediate Zone (IZ), which lies between these extremes[3]. Based on both rainfall and elevation, seven Agro-Climatic Zones (ACZs) are identified: Dry zone Low country (DL), Intermediate zone Low country (IL), Intermediate zone Mid country (IM), Intermediate zone Up country (IU), Wet zone Low country (WL), Wet zone Mid country (WM), and Wet zone Up country (WU). Except for WU-where terrain restricts rice farming-rice is cultivated in all other zones[3]. In the DL and IL, rice cultivation is largely reliant on an established system of cascade irrigation tanks that compensate for erratic rainfall, whereas paddy farming in the rest of the zones is more dependent on precipitation[4]. Irrigation systems are further classified based on their command area: schemes covering more than 80 hectares of paddy lands are termed major, while those less than 80 hectares of paddy lands are considered minor[4]. The DL and IL zones, due to higher temperatures and greater solar radiation, exhibit enhanced yield potential compared to other zones[5]. Paddy lands in Sri Lanka occur on various soil orders, including Alfisols, Entisols, Histosols, Inceptisols, Ultisols, and Vertisols, all originating from different geological settings[6]. Variability in rice productivity across the country has been linked to differences in ACZs, soil classifications, and irrigation sources[5].
Soil pH, often referred to as soil reaction, is a crucial chemical indicator that reflects the hydrogen ion activity in the soil solution and serves as a key determinant of nutrient availability and biological processes within soil ecosystems[7,8]. It is expressed as a logarithmic scale of H+ concentration, whereby each unit decrease in pH signifies a tenfold increase in acidity[9,10]. Hence, pH provides a direct measure of soil acidity and alkalinity. The soil's cation composition contributes significantly to its pH; acidic soils are typically dominated by hydrogen (H+), aluminum (Al3+), and iron (Fe2+/Fe3+) ions, while calcium (Ca2+), magnesium (Mg2+), potassium (K+), and sodium (Na+) are base-forming cations[9,11]. Soil pH is influenced by both inherent factors such as parent material, native vegetation, climatic conditions, soil buffering capacity, and biological activity, as well as human interventions such as land management and cropping practices[7,12−15]. A pH range of 5.0 to 7.5 is generally favorable for most crops because it allows optimal nutrient solubility and uptake[9,16,17]. Soil pH not only affects nutrient forms and concentrations but also governs the chemical behavior, movement, and availability of nutrients, thereby influencing the efficiency of fertilization[9]. Elements such as K, Ca, Mg, and Mo become more accessible in soils with a pH between 7.0 and 8.0, whereas micronutrients such as Fe, Mn, Cu, and Zn are more readily available when the pH ranges from 5.0 to 6.5[18]. Electrical conductivity (EC) is another fundamental parameter used to evaluate soil quality[8,19]. It is a rapid and cost-effective method for estimating the concentration of soluble salts in the soil solution, which consists of various cations (e.g., Ca2+, Mg2+, K+, Na+, H+), and anions (e.g., NO3−, SO42−, HCO3−, CO32−, Cl−)[7,20]. EC reflects the soil's ability to conduct electrical current and is affected by several physical and chemical properties, including moisture content, clay mineralogy, organic matter, bulk density, temperature, and cation exchange capacity[8,21]. These factors influence crop productivity indirectly by altering the soil's ionic environment[8,21]. Soil salinity is commonly assessed through the EC measurements, with typical classifications being: very low (< 0.15 dS·m−1), low (0.15–0.4 dS·m−1), moderate (0.4–0.8 dS·m−1), high (0.8–2.0 dS·m−1), and very high (> 2 dS·m−1)[22,23]. The influence of agro-climatic conditions, soil types, and irrigation sources on determining soil pH and EC in Sri Lankan lowland rice ecosystems remains inadequately studied.
Soil management practices-especially those affecting the topsoil-have a substantial impact on both pH and EC levels[24]. For instance, conventionally fertilized systems often exhibit lower pH and higher EC compared to organically managed fields[12]. In saline-sodic conditions, elevated EC and pH levels can reduce nutrient uptake by creating osmotic and ionic stress for crops[25]. Additionally, long-term use of nitrogen-based fertilizers is known to accelerate acidification of soils[26,27]. Such changes not only affect soil fertility but also pose environmental risks and reduce the long-term sustainability of rice farming systems. The complexity of interactions between climatic conditions, soil characteristics, and irrigation practices highlights the need for integrated assessments of soil quality indicators such as pH and EC in rice fields. With increasing pressures on land-use, water resources, and food security, understanding the spatial variation and environmental drivers of pH and EC is essential for guiding adaptive management in Sri Lanka's rice sector. Despite the documented relevance of these factors, systematic studies combining agro-climatic zones, soil orders, and irrigation types in Sri Lanka remain scarce, leaving a critical gap in optimizing site-specific nutrient and water management strategies.
Therefore, the aim of this study is: (1) to assess the distribution of soil pH and EC in Sri Lanka; and (2) to investigate the combined effects of agro-climatic zone, soil order, and water source on the pH and EC of lowland rice-growing soils. This research used a stratified sampling approach across different agro-climatic zones, soil orders, and irrigation schemes to capture representative variation across the major rice-growing areas. Through an analysis of pH and EC across these factors, the finding from the study provides critical insights into how environmental and management variables shape soil quality. The results are expected to support sustainable rice production by informing better-targeted soil fertility and salinity management practices across Sri Lanka's diverse paddy landscapes.
-
The procedure for selecting sampling locations and collecting soil samples was adapted from Kadupitiya et al.[28]. In this study, Sri Lanka was divided into 1 km2 grids using vector-based operations in QGIS (version 3.16.0-Hannover,
https://qgis.org ), a free and open-source GIS platform. Each grid was assigned a unique identifier by combining its easting and northing values based on the Kandawala/Sri Lanka Grid (EPSG:5234) coordinate reference system. This grid division resulted in a total of 65,610 units across the country. By overlaying these grids with a rice land-use layer (scale 1:50,000 from the Survey Department), 35,537 grids were identified as rice-growing areas. From this, a subset of 8,782 grids for pH and 8,801 grids for EC were selected using a stratified random sampling approach, stratified by administrative district (Supplementary Tables S1–S4, Fig. 1). Sampling locations were navigated using smartphones integrated with Google Maps, enabling precise geo-location tracking[28].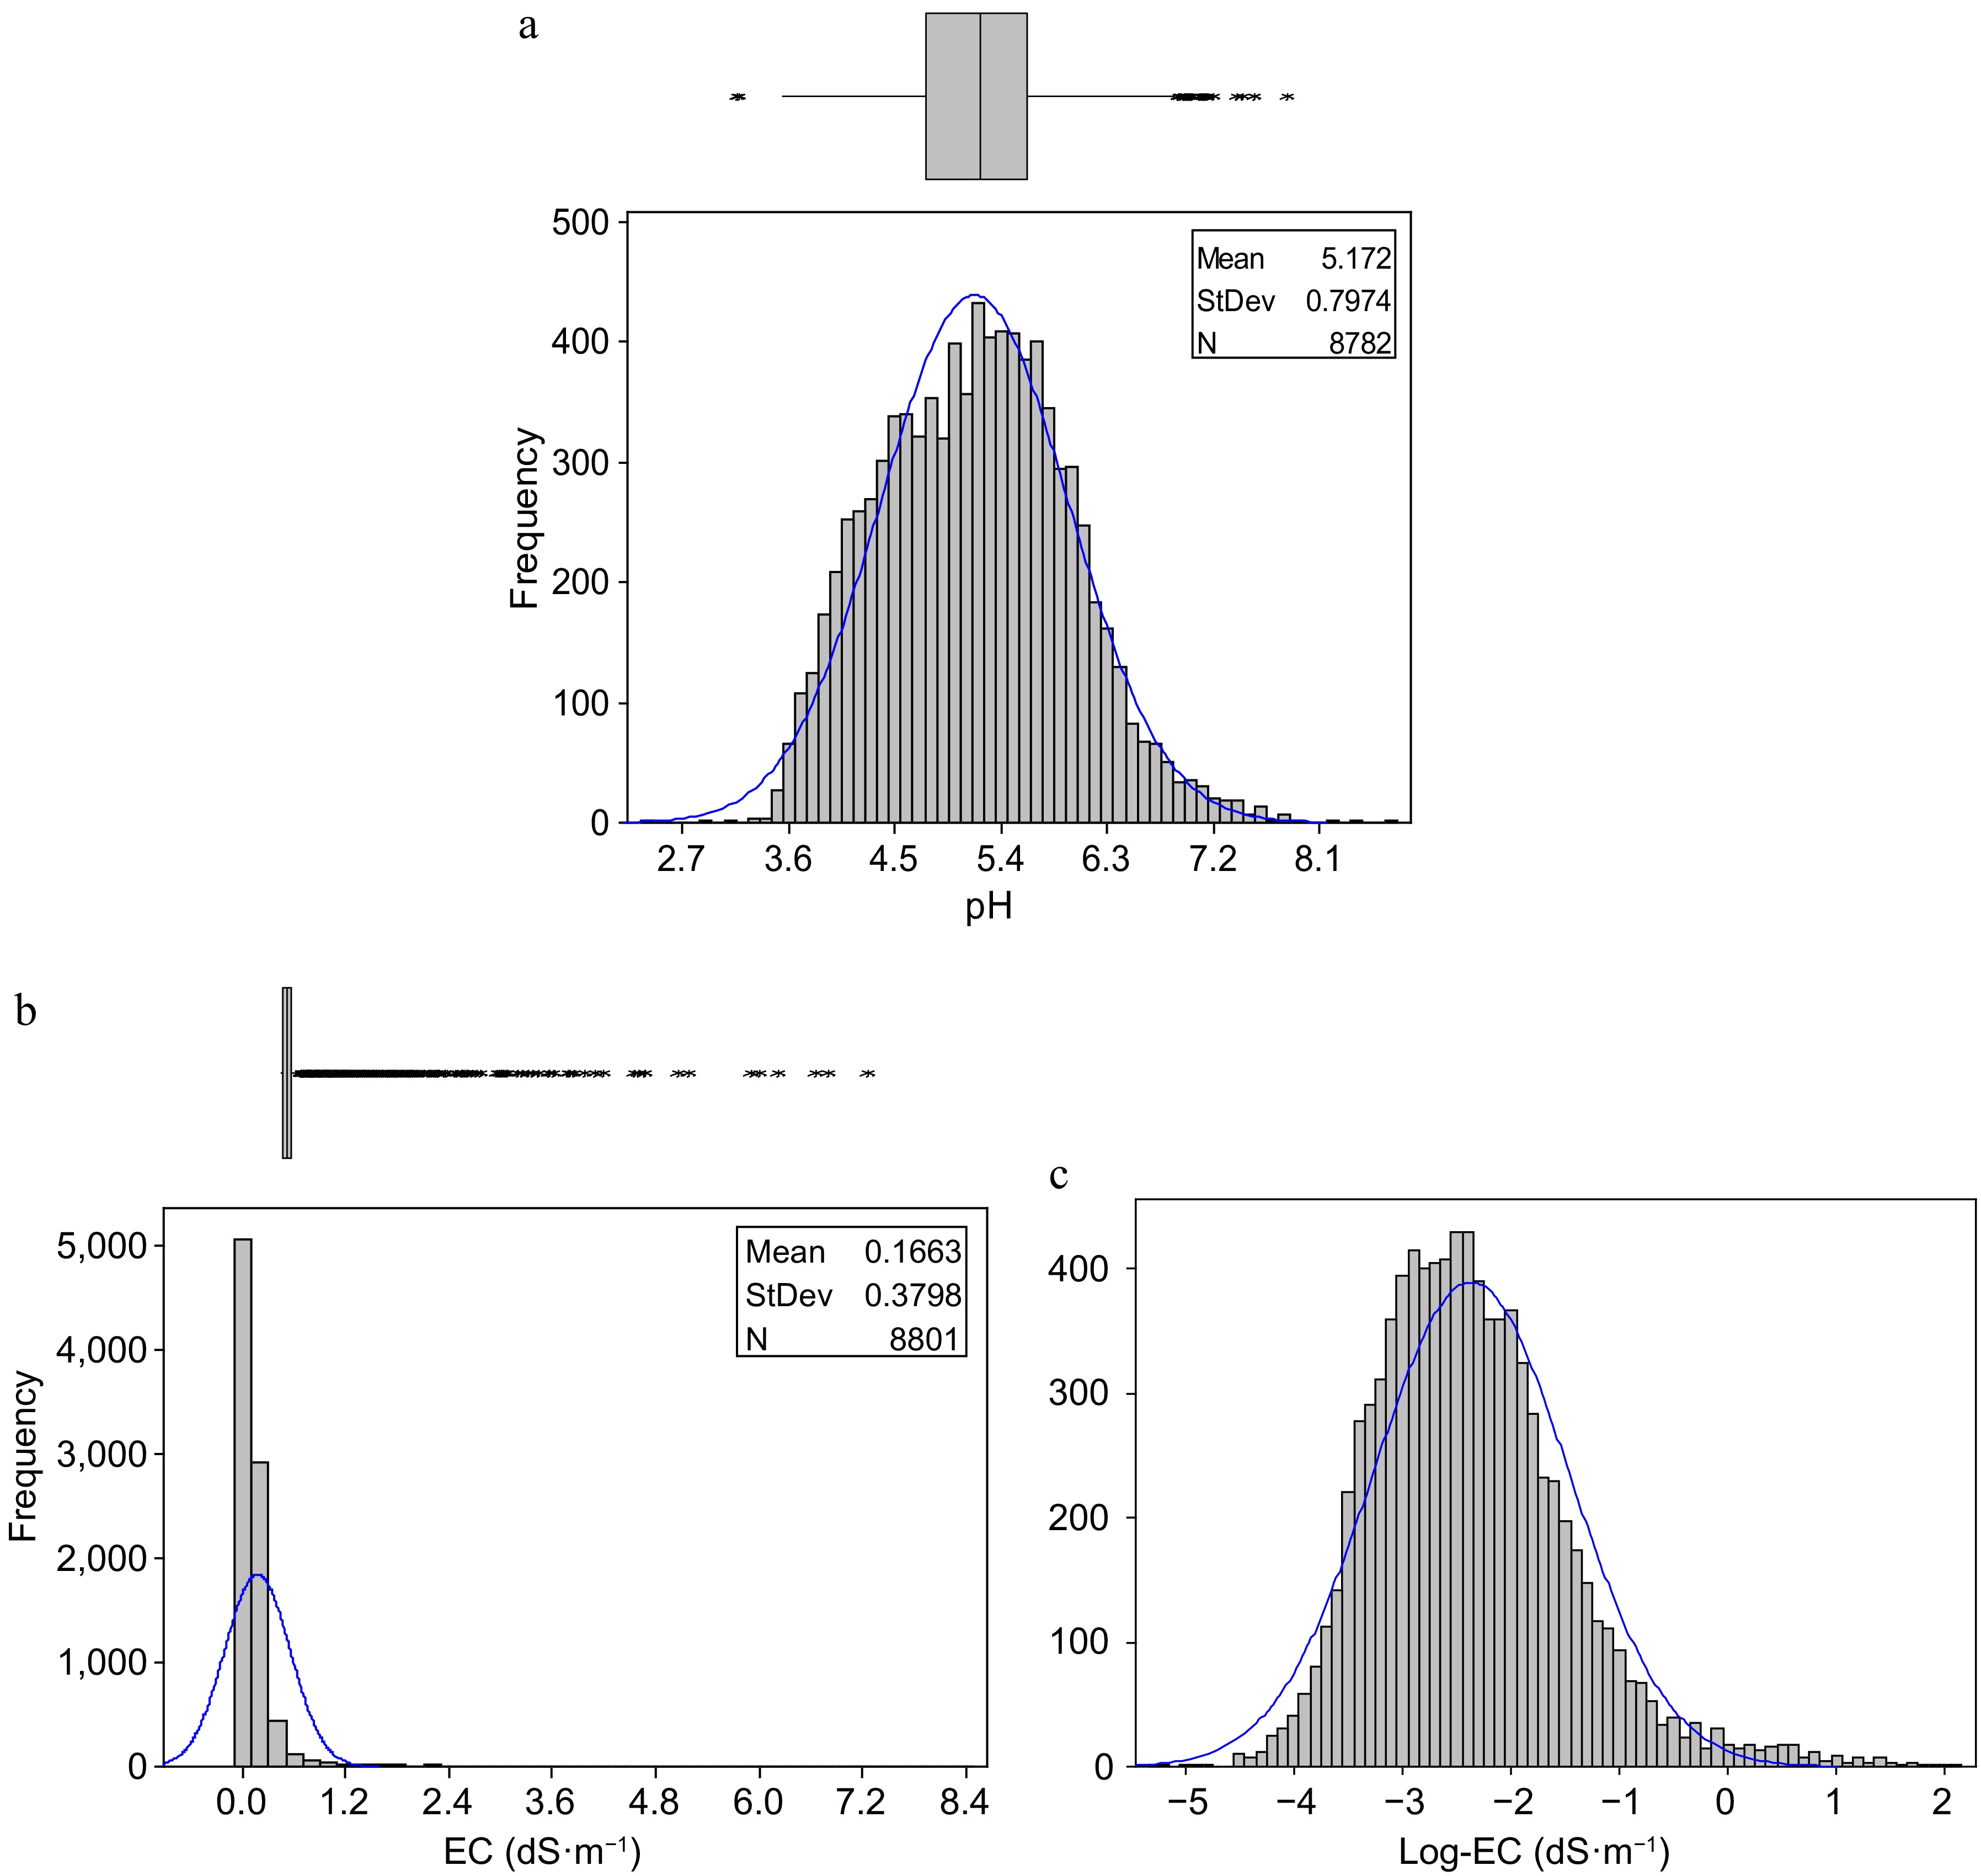
Figure 1.
(a) Box plots, and (b) histograms of pH and EC, and (c) log-10 transformed electrical conductivity (EC) values in paddy soil samples collected from Sri Lanka.
For each sampling grid, relevant information such as Grid ID, Agro-Climatic Zone (ACZ), district, Divisional Secretariat Division (DSD), and village name was documented during sampling. From each selected village, one rice track—a physically defined lowland area jointly managed by a group of farmers—was chosen at random. A composite soil sample was formed by mixing six subsamples taken from the top 0–15 cm soil depth within the selected rice track. The number of soil samples collected across various climatic zones, agro-climatic zones, soil orders, and irrigation sources is presented in Supplementary Tables S1−S4. All collected soil samples were air-dried, cleared of plant residues and stones, homogenized, and passed through a 2 mm sieve. The classification of the sampling points by climatic zone, agro-climatic zone, soil order, and irrigation source was carried out by overlaying multiple GIS layers in QGIS. Farmers were also interviewed during sample collection to record the paddy yield (t ha−1) from the previous cropping season.
Laboratory analysis
-
In the laboratory, each sample was analyzed using the standard soil suspension method[29]. Ten grams of air-dried soil were combined with 50 mL of distilled water in a beaker and shaken for two hours using an orbital shaker at ambient temperature. After allowing the suspension to settle for 15 min, pH and EC were measured with a pH/EC meter (Eutech WC PC 650, Singapore). For quality assurance, each analysis batch (36 soil samples) included two laboratory control soils and two blanks. The electrodes of the pH and EC meter were calibrated daily with standard buffer and conductivity solutions provided by the manufacturer.
Preparation of spatial maps
-
Each sampling location retained its original Grid ID, which encoded its spatial coordinates (in km) along the X and Y axes. This consistent tagging from field collection through to laboratory and data analysis ensured easy geo-referencing of samples and simplified spatial visualization. These Grid IDs enabled efficient development of the spatial dataset and facilitated the production of GIS-based thematic maps.
Statistical analysis
-
Descriptive statistics were first calculated for soil pH and EC. The distribution of pH and EC was assessed for normality using the Shapiro–Wilk test. EC values were log-transformed to meet the assumptions of normality (Fig. 1). Statistical comparisons were conducted through a two-step Analysis of Variance (ANOVA). Initially, the General Linear Model procedure was used to examine the main effects and interactions of agro-climatic zone, soil order, and water source on soil pH and EC. Six levels of the factor agro-climatic zone (i.e. Dry zone Low country, Intermediate zone Low country, Intermediate zone Mid country, Intermediate zone Up country, Wet zone Low country, Wet zone Mid country), six levels of the factor soil orders (i.e. Alfisols, Entisols, Histosols, Inceptisols, Ultisols, and Vertisols) and three levels of the factor water source (i.e., major irrigation, minor irrigation and rainfed) were compared using statistical tests. Since many higher-order interactions were found to be significant, a second ANOVA was carried out within each agro-climatic zone to explore the variation in soil pH and EC among different soil orders and water sources. Means were separated using Duncan's New Multiple Range Test (DNMRT), with statistical significance evaluated at α = 0.05. All analyses were performed using SAS software version 9.1.
-
Soil pH ranged between 2.36 and 8.74, with a mean of 5.17 and a median of 5.18 (Fig. 1). Only 34% of the samples were within the ideal pH range for rice cultivation (5.5–7.0), while 64.5% had pH values below 5.5 and 1.5% exceeded 7.0. The overall distribution of soil pH was approximately normal.
Electrical conductivity ranged between 0.005 and 8.45 dS·m−1, with mean and median values of 0.166 and 0.086 dS·m−1, respectively (Fig. 1). Among all samples, 73% had EC values below 0.15 dS·m−1, 21% ranged between 0.15 and 0.4 dS·m−1, 3% between 0.4 and 0.8 dS·m−1, 2% between 0.8 and 2.0 dS·m−1, and only 1% exceeded 2.0 dS·m−1. The distribution of EC was positively skewed, largely due to the prevalence of samples with low conductivity and relatively few with elevated EC. Thus, the log transformation of EC was used to reach normality.
Variation of soil pH and EC among climatic and agro-climatic zones
-
The highest average pH was reported in the Dry Zone, and the lowest in the Wet Zone (Fig. 2a). For EC, both Dry Zone and Wet Zone showed similar values, which were significantly higher than those observed in the Intermediate Zone (Fig. 2a).
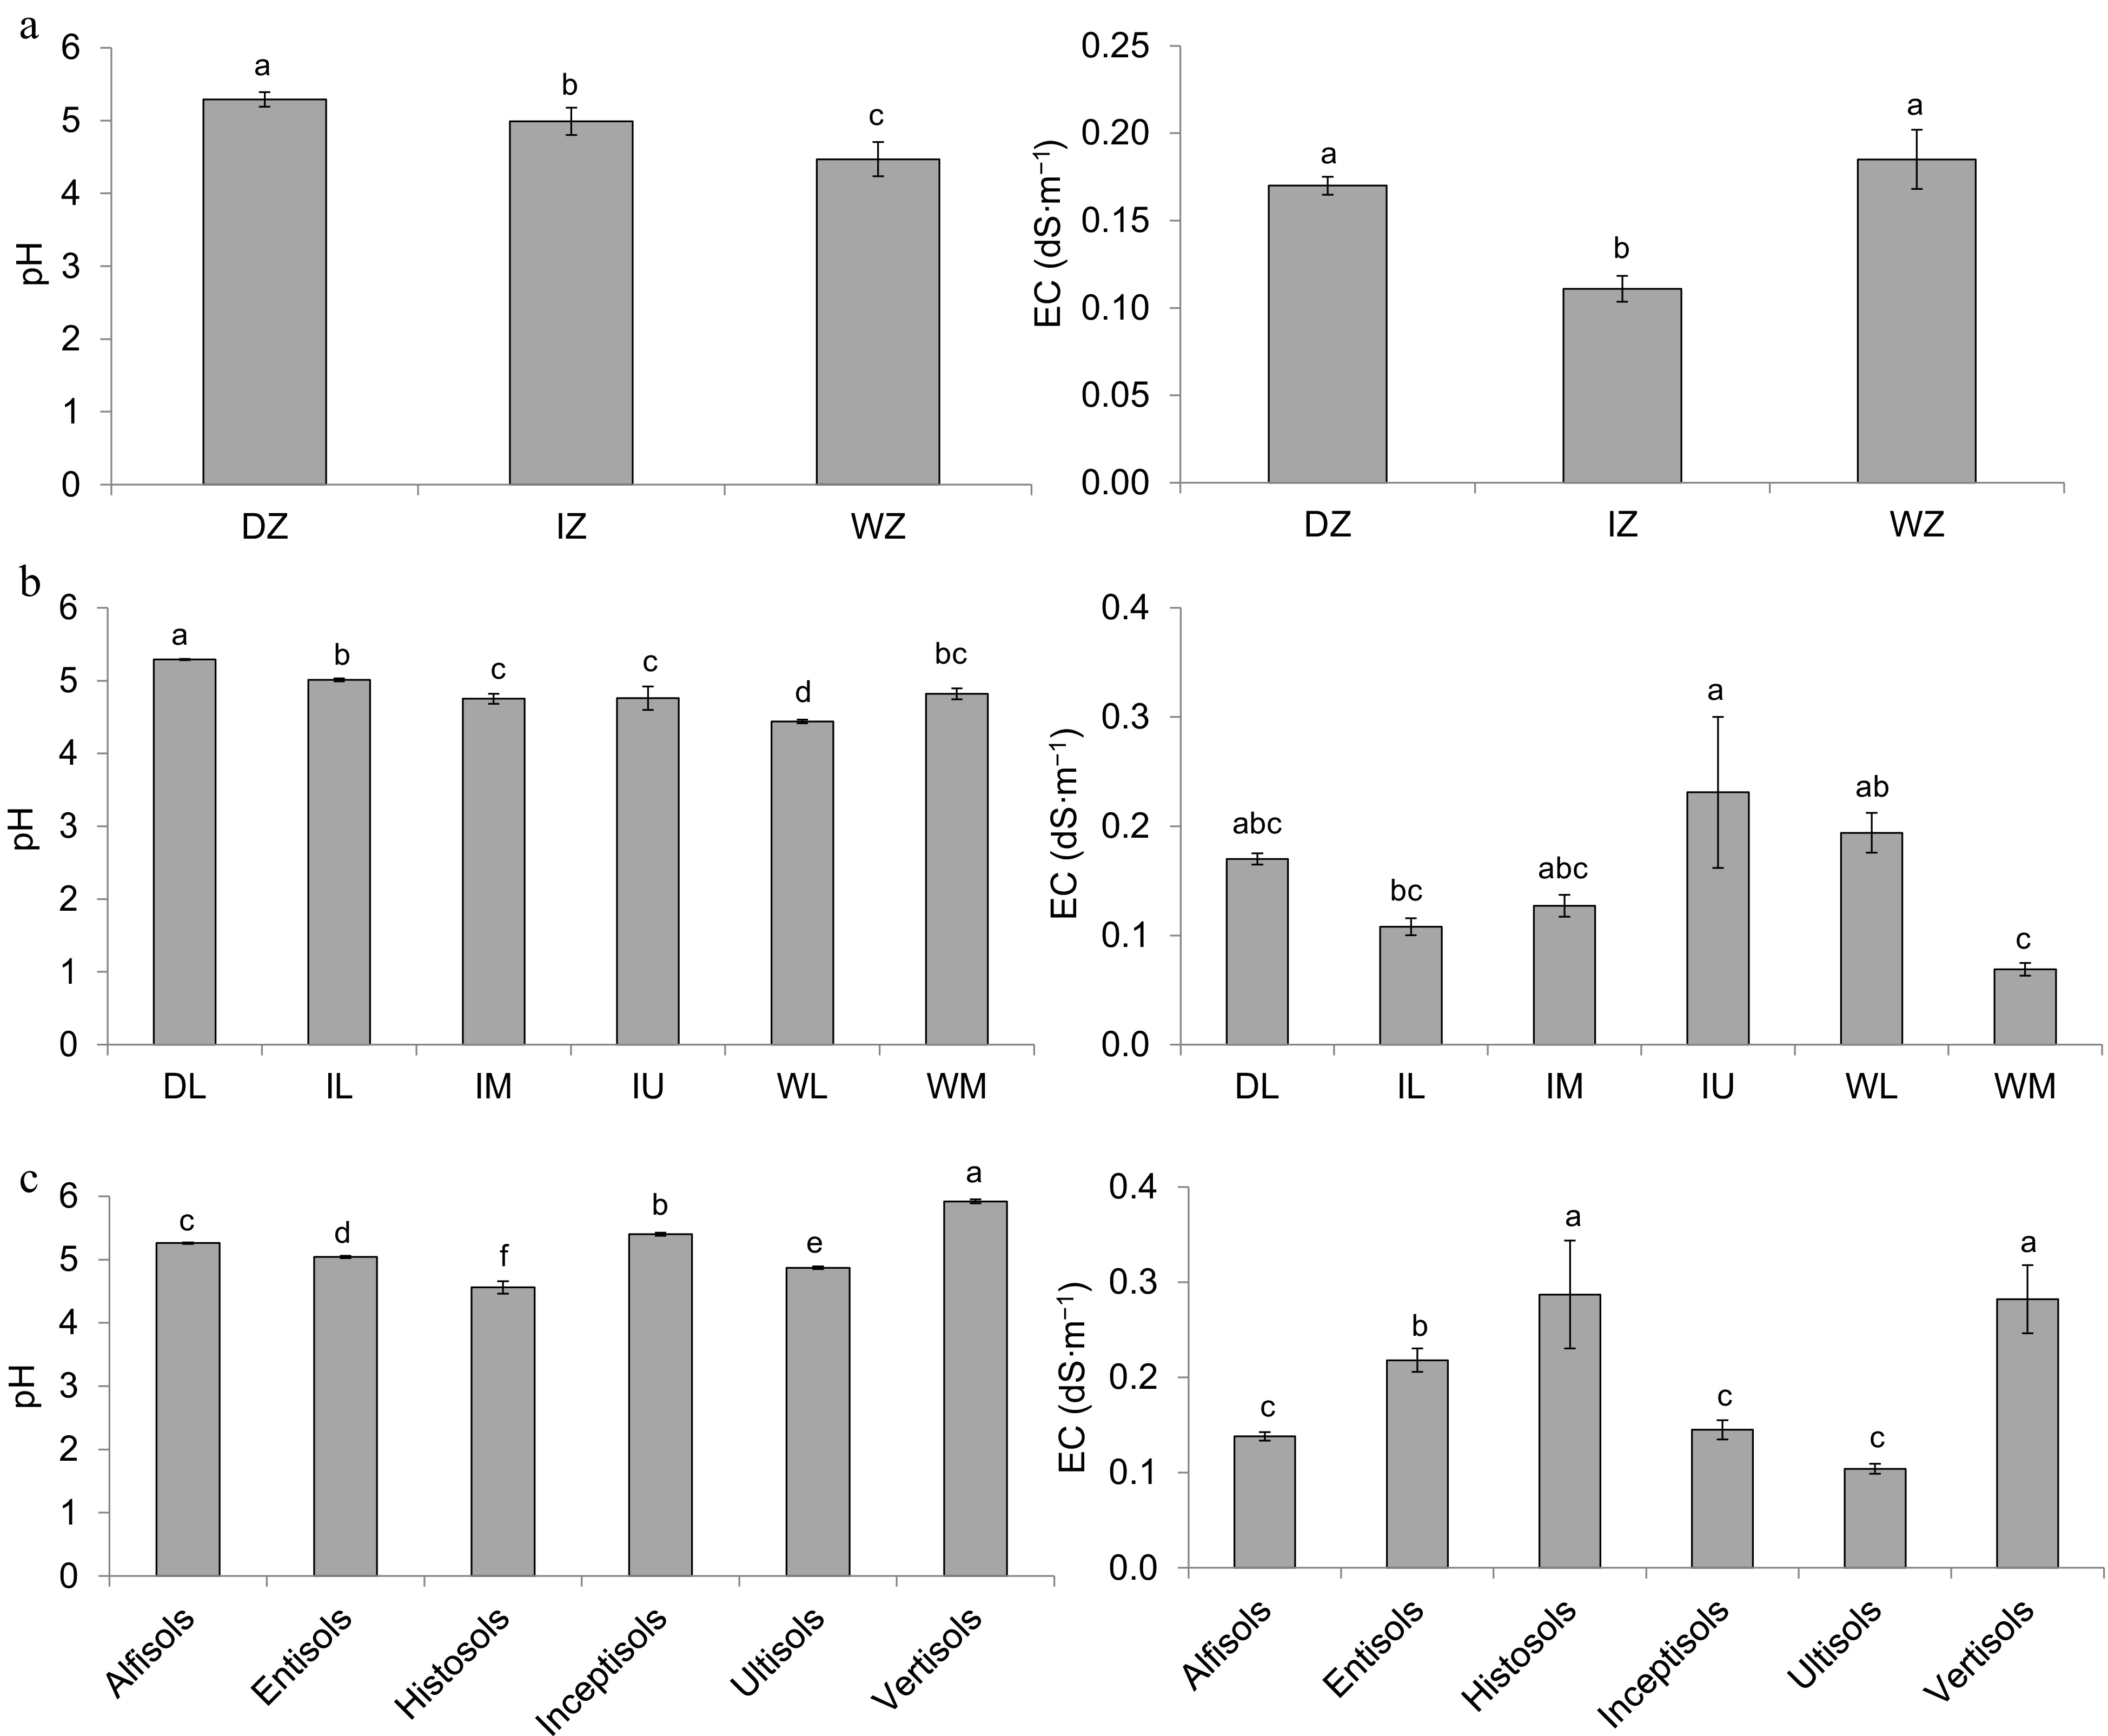
Figure 2.
(a) Soil pH and electrical conductivity (EC) in the lowlands used to cultivate rice in different climatic zones [DZ-Dry Zone, IZ-Intermediate Zone, WZ-Wet Zone], (b) agro-climatic zones [DL-Dry zone Low country, IL-Intermediate zone Low country, IM-Intermediate zone Mid country, IU-Intermediate zone Upcountry, WL-Wet zone Low country, WM-Wet zone Mid country], and (c) soil orders in Sri Lanka.
Significant differences in both pH and EC were observed among the agro-climatic zones (Fig. 2b). The highest pH was recorded in paddy fields located in the Dry zone Low country, whereas paddy fields in Wet zone Low country exhibited the lowest values (Fig. 2b). Electrical conductivity was highest in the Intermediate zone Up country and lowest in the Wet zone Mid country among the agro-climatic zones.
Although Sri Lanka is divided into seven agro-climatic zones, nearly two-thirds of its landmass is located in the Dry zone Low country (Fig. 3). Within the Dry zone Low country, northern and southern regions exhibited higher pH and EC values, whereas lower values were reported from the eastern region (Fig. 3).
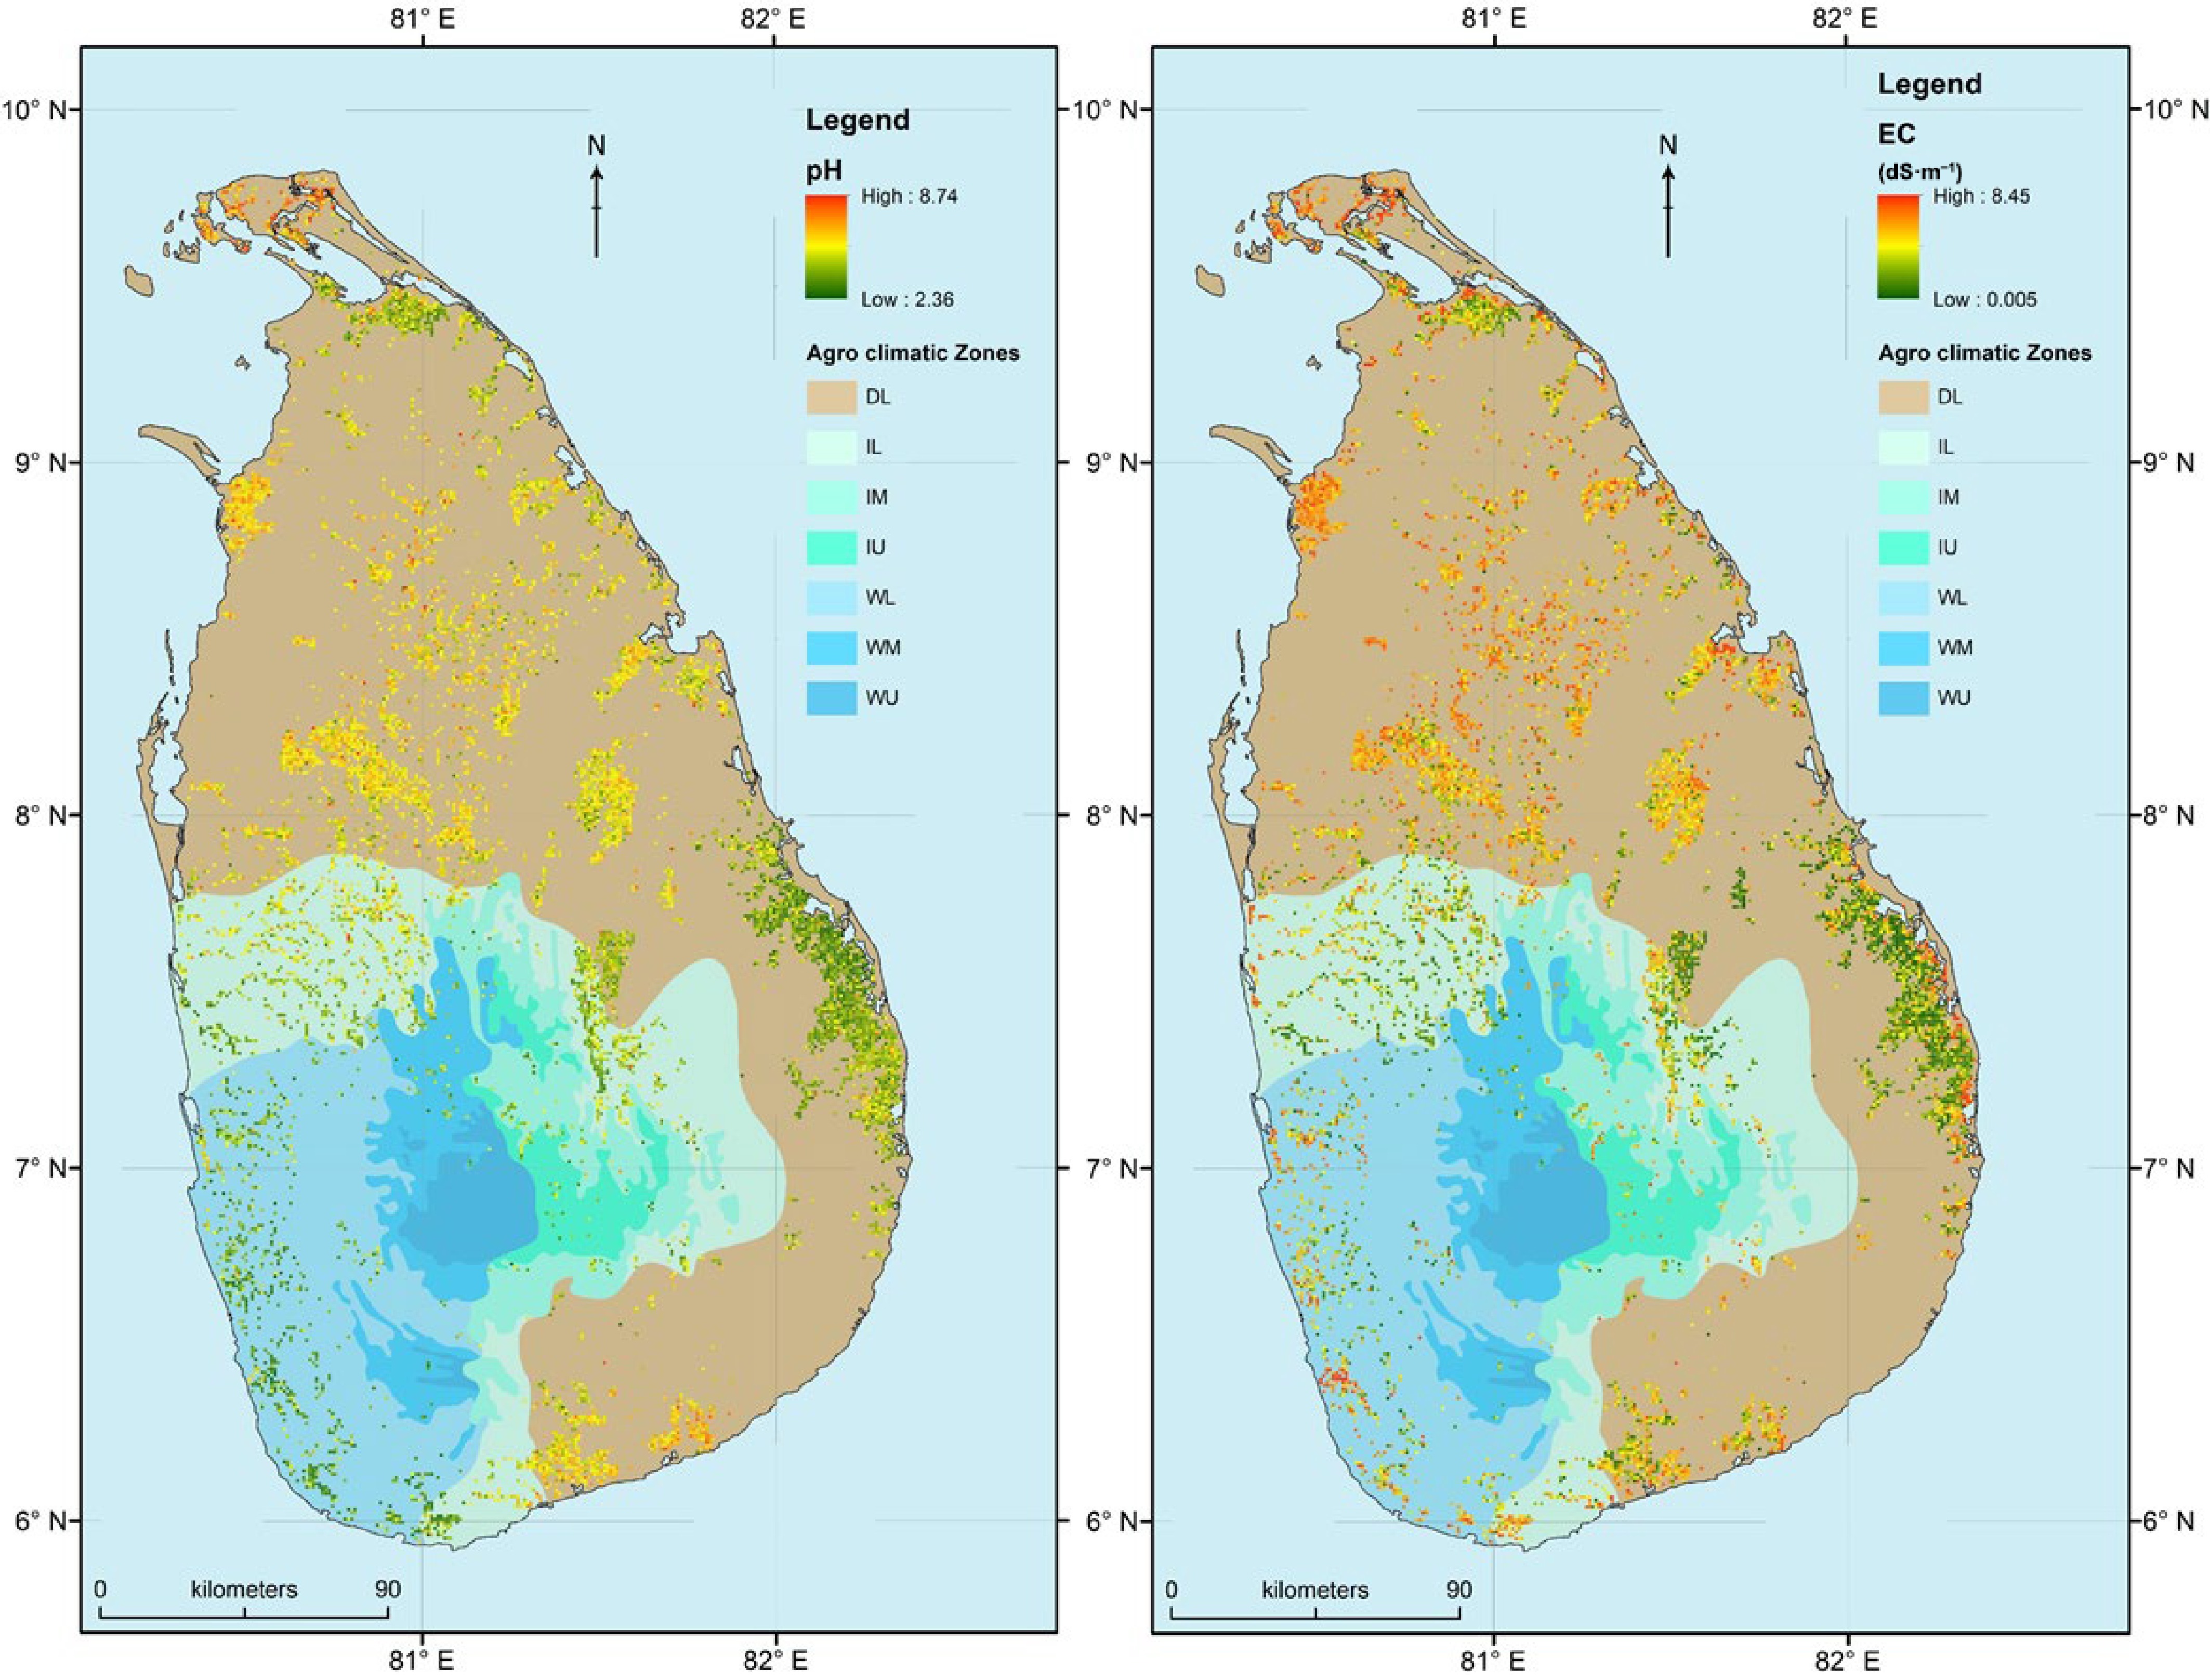
Figure 3.
Spatial distribution of soil pH and electrical conductivity (EC) in lowlands used to cultivate rice in different agro-climatic zones of Sri Lanka, DL-Dry zone Low country, IL-Intermediate zone Low country, IM-Intermediate zone Mid country, IU-Intermediate zone Up country, WL-Wet zone Low country, WM-Wet zone Mid country.
Variation of soil pH and EC among soil orders
-
When comparing soil orders, Vertisols exhibited the highest pH values, whereas Histosols and Ultisols recorded the lowest (p < 0.05) (Fig. 2c). For EC, the highest values were reported in Entisols, Histosols, and Vertisols, while Ultisols had the lowest (p < 0.05, Fig. 2c). Alfisols, which are widely distributed in the Dry zone Low country, had lower EC than Entisols, Histosols, and Vertisols (p < 0.05), but were not significantly different from Inceptisols (p > 0.05) (Figs. 2c, 4).
A significant interaction was observed between the agro-climatic zone and soil order in relation to soil pH (p < 0.05). In the Dry zone Low country, Vertisols recorded the highest pH, while Alfisols and Entisols had the lowest (p < 0.05, Fig. 5). Vertisols were confined to a specific low-lying area in the northwestern Dry zone Low country (Fig. 4). Entisols typically appeared as scattered patches in flat lowland coastal zones, and Alfisols were the dominant soil type in the Dry zone Low country (Figs. 3, 4). In the Intermediate zone Low country, Inceptisols displayed higher pH values, with Histosols exhibiting the lowest (p < 0.05) (Fig. 5). The most common soil orders in Intermediate zone Low country were Ultisols and Alfisols (Figs. 3, 4). In Wet zone Low country, Alfisols had the highest pH (Figs. 3, 4). No significant pH variation was observed among soil orders in Intermediate zone Mid country, Intermediate zone Up country, or Wet zone Mid country (p > 0.05) (Fig. 5).
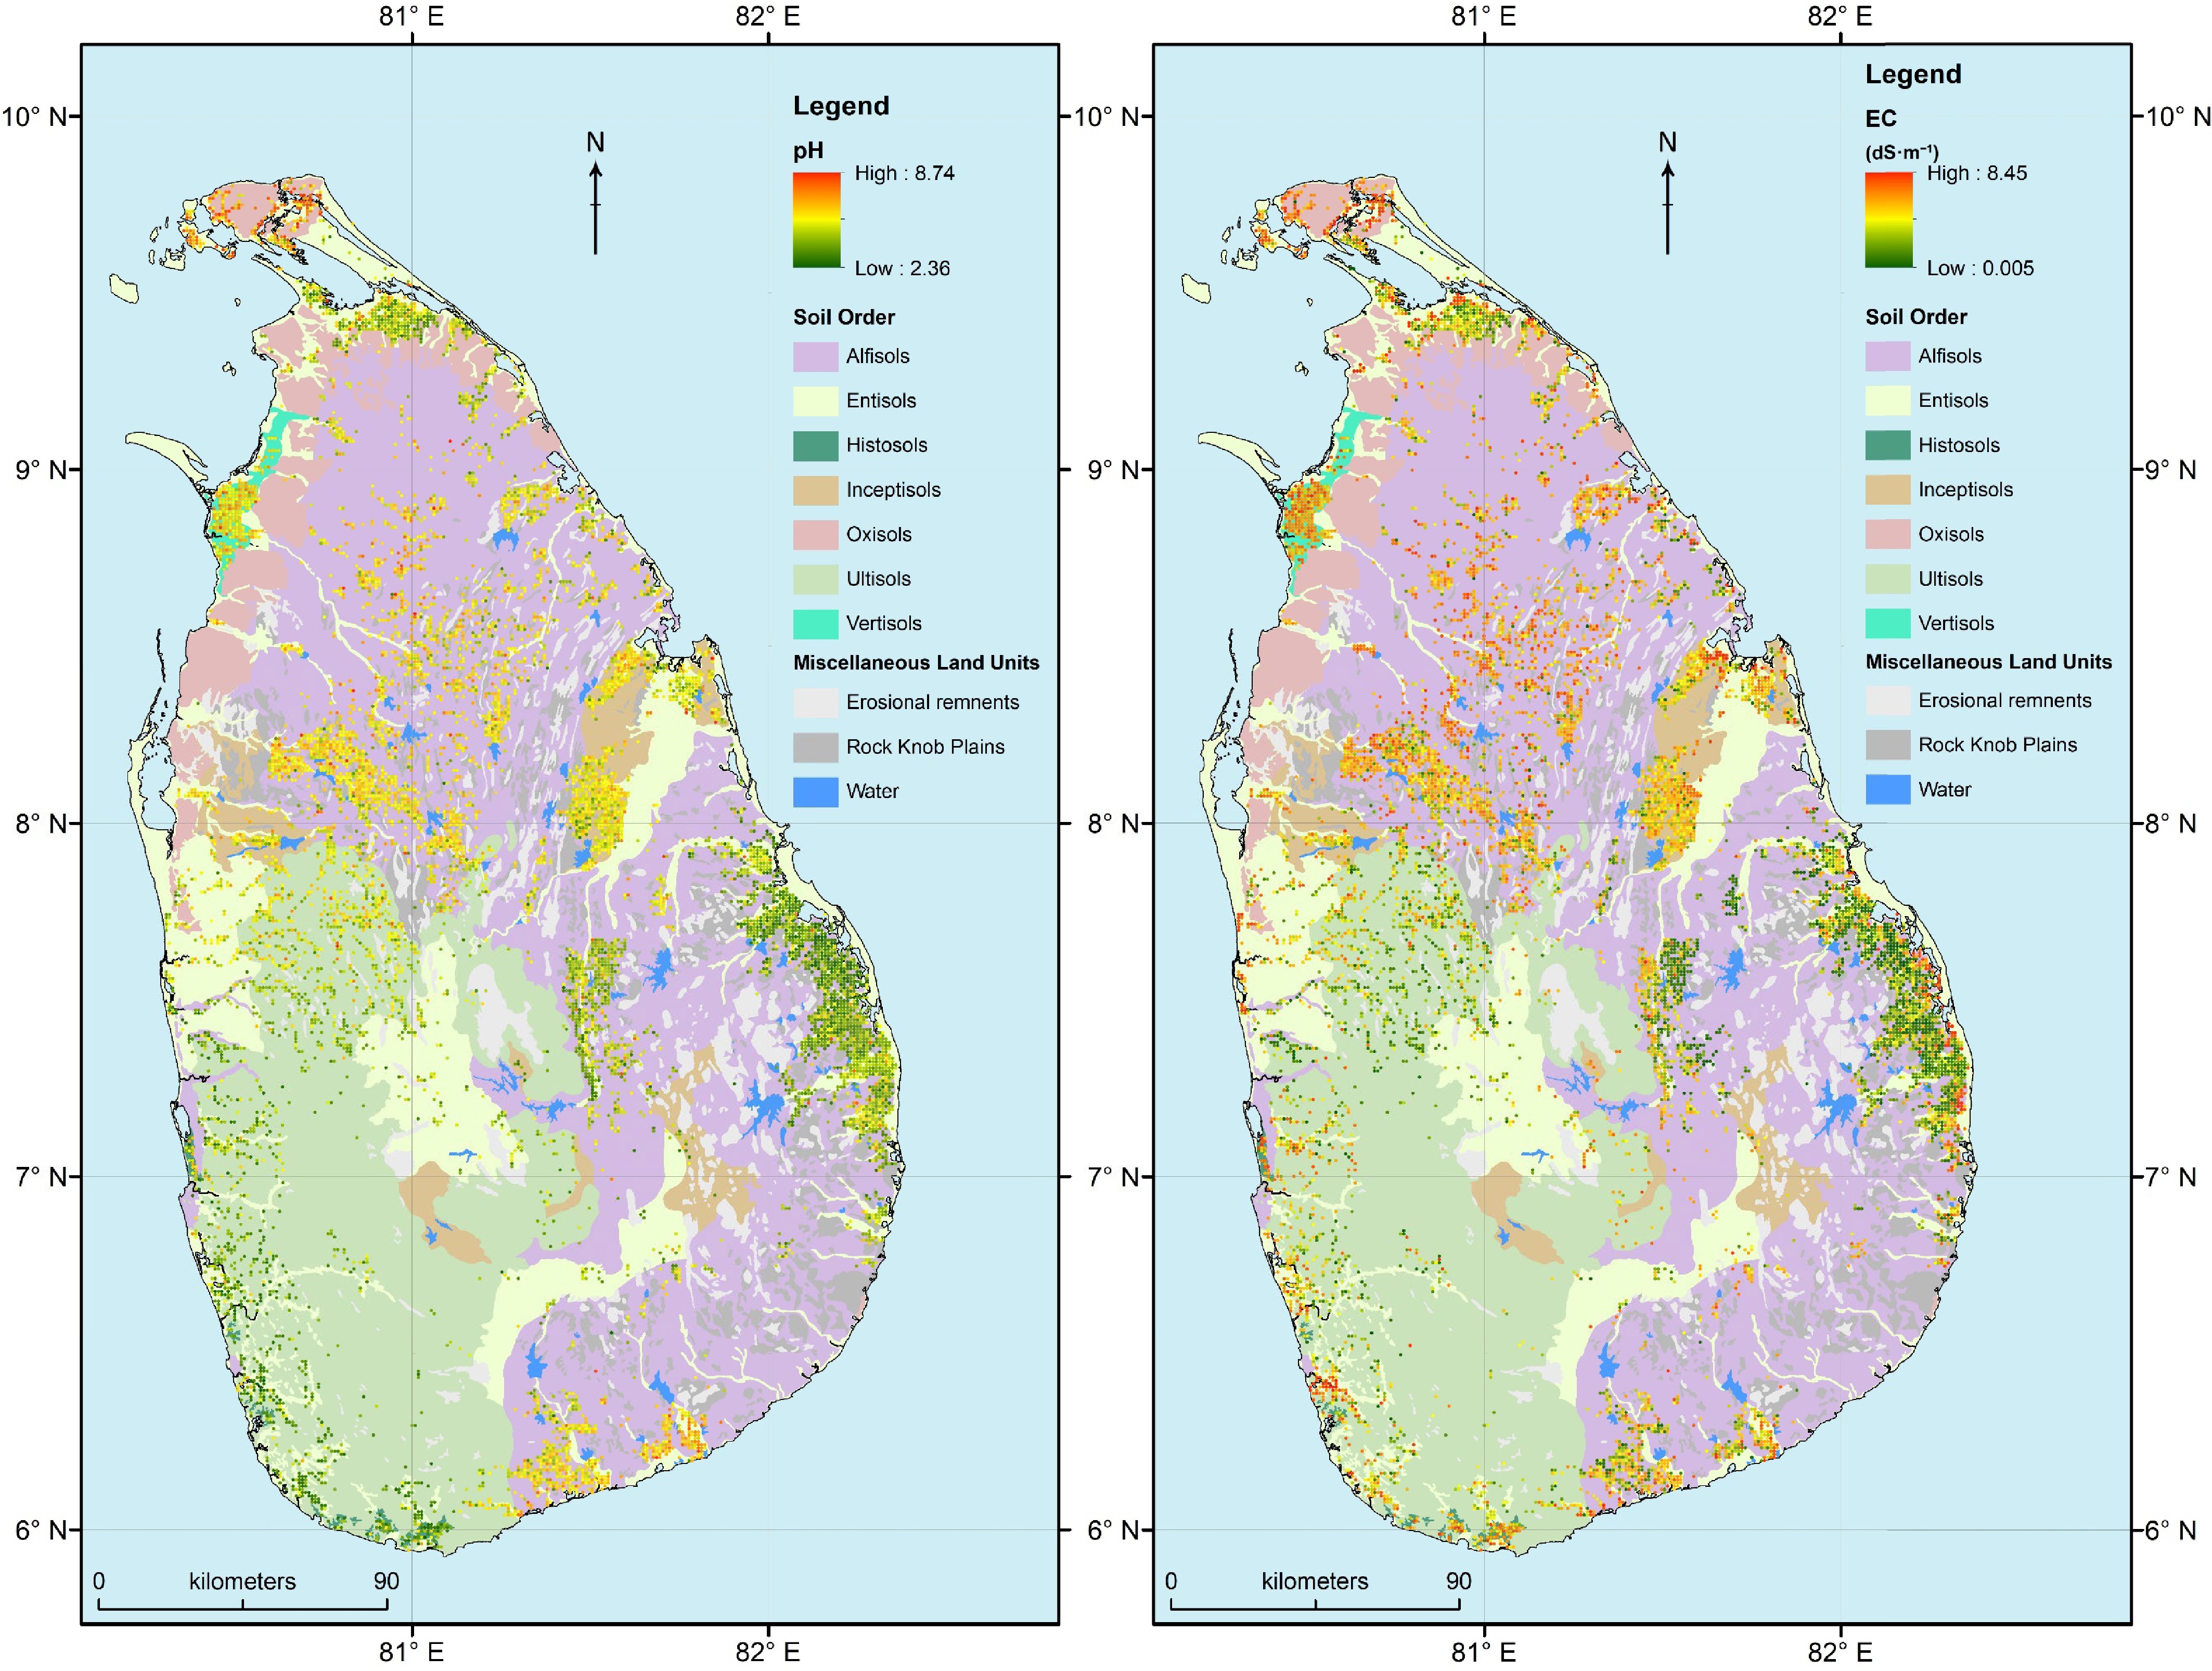
Figure 4.
Spatial distribution of soil pH and electrical conductivity (EC) in lowlands used to cultivate rice under different soil orders in Sri Lanka.
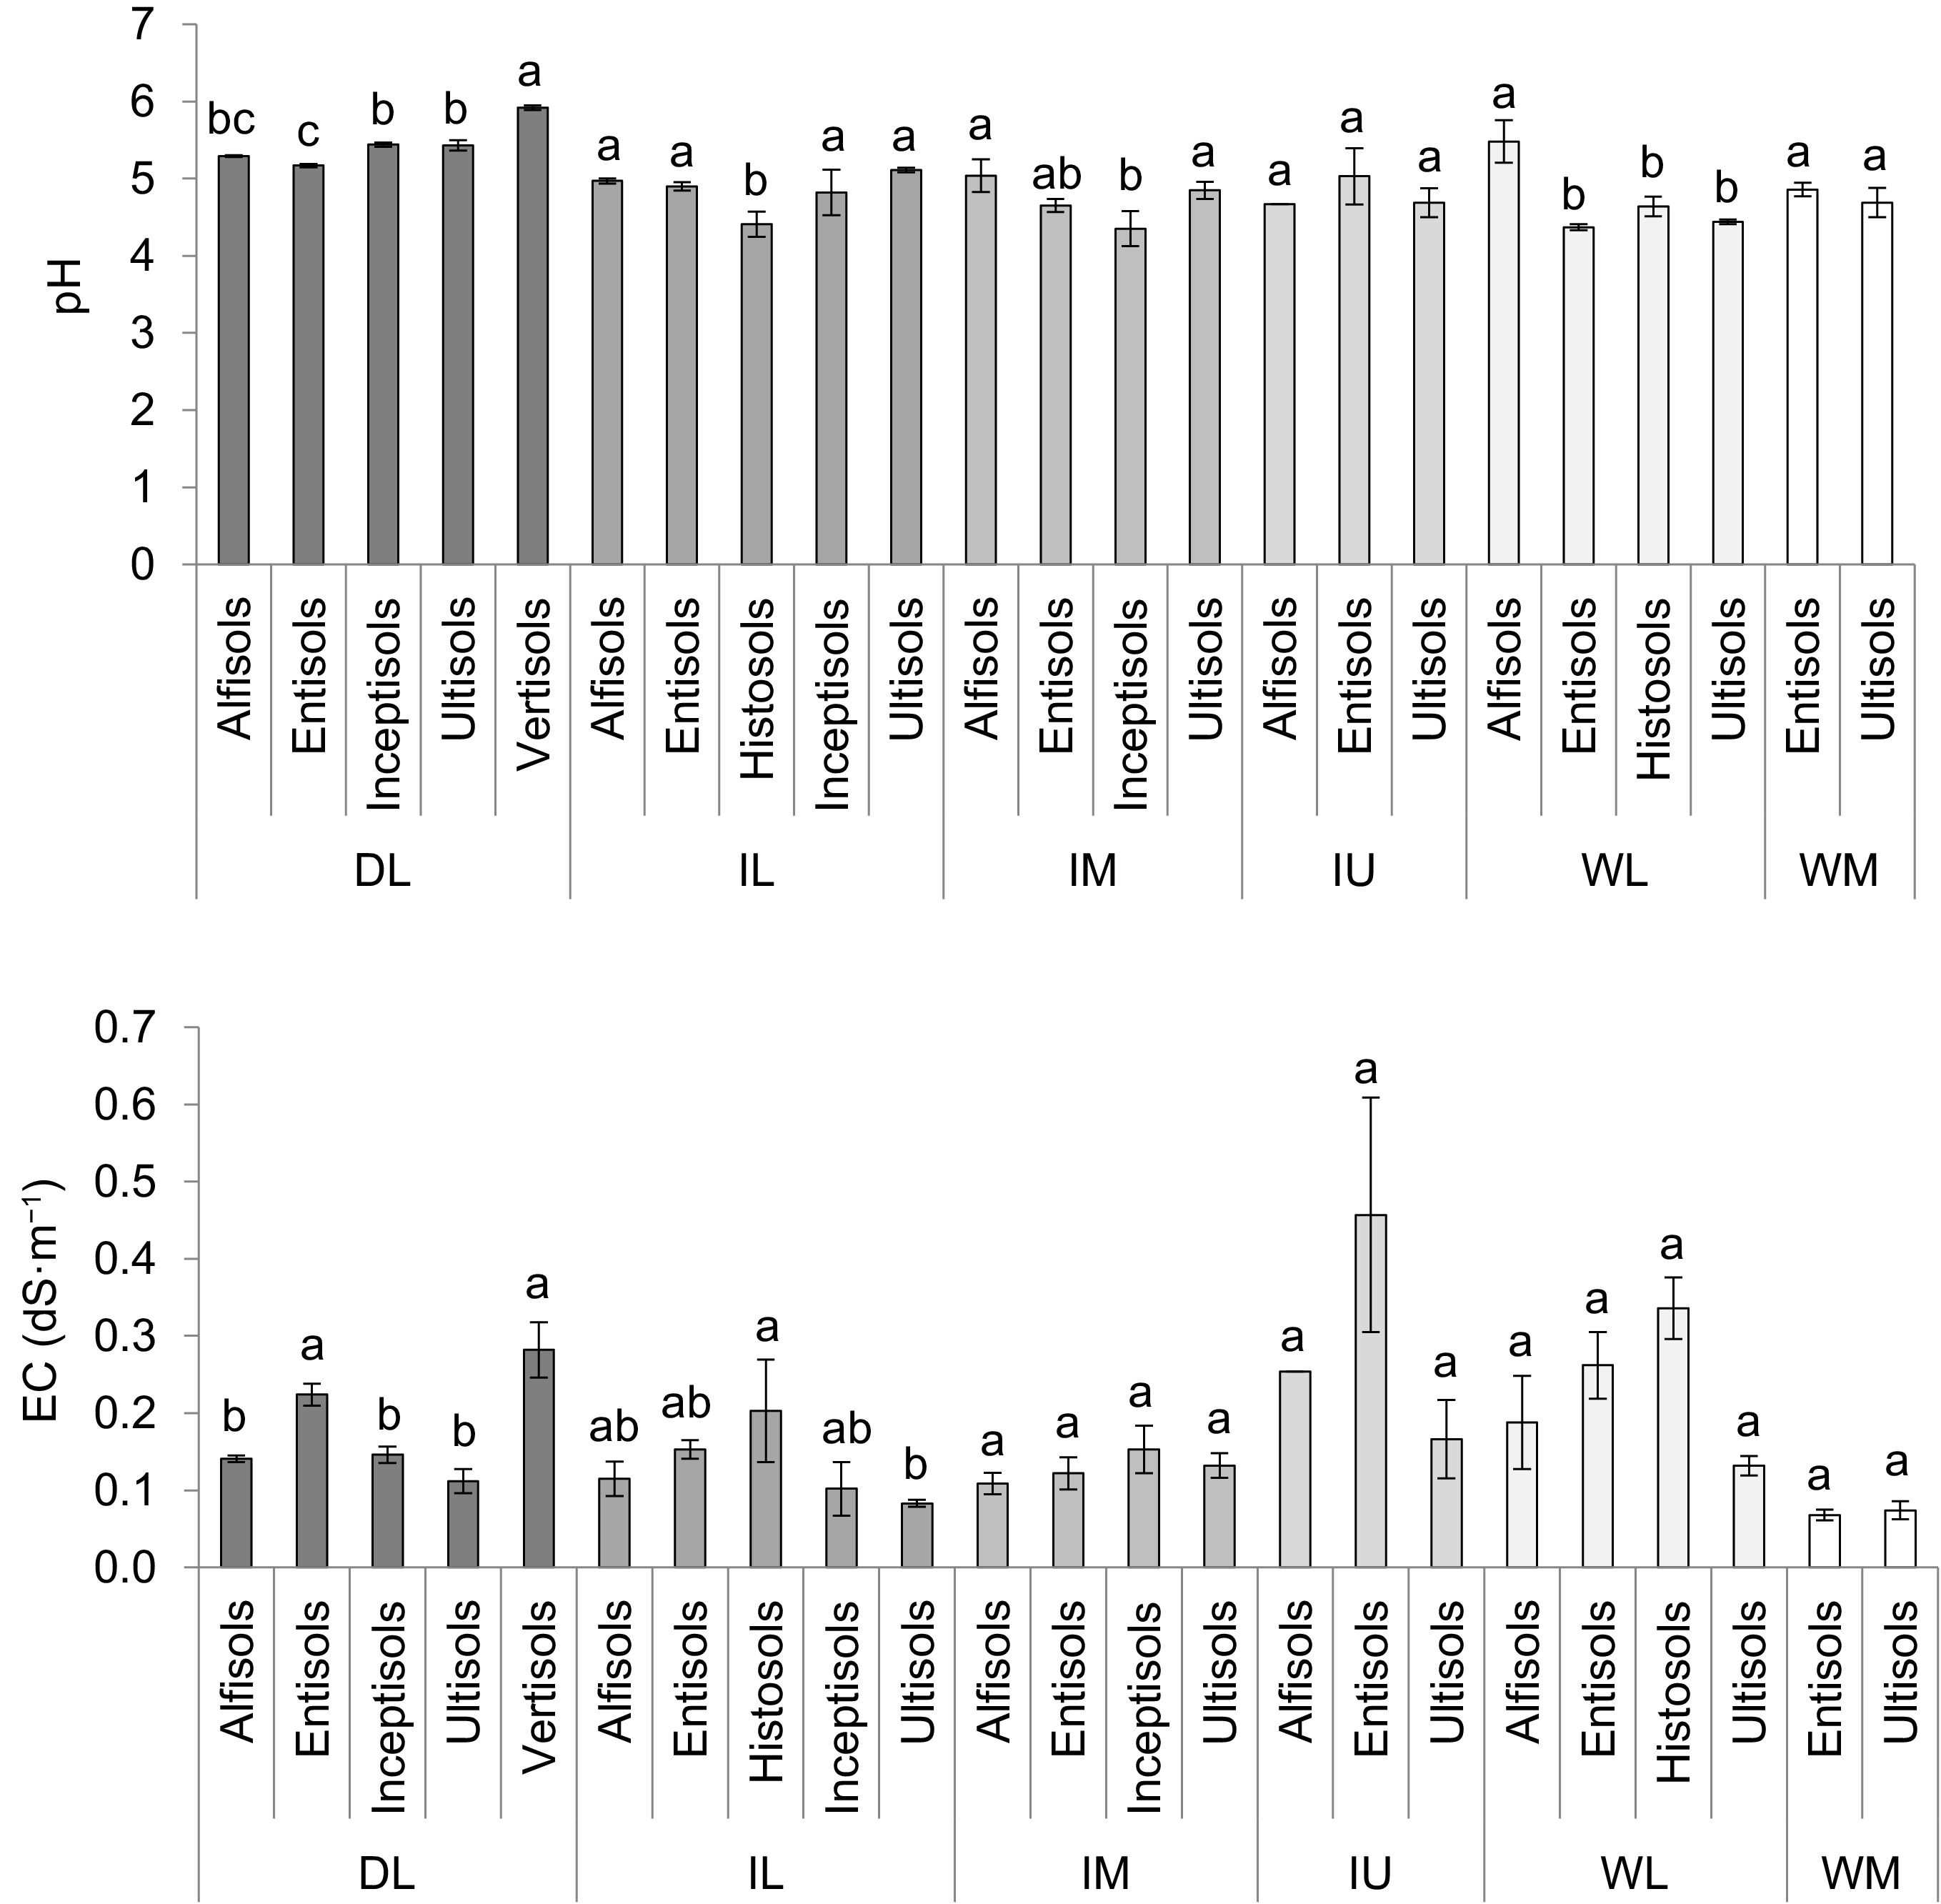
Figure 5.
Soil pH and electrical conductivity (EC) in the paddy fields used to cultivate rice in different soil orders and agro-climatic zones of Sri Lanka, DL-Dry zone Low country, IL-Intermediate zone Low country, IM-Intermediate zone Mid country, IU-Intermediate zone Upcountry, WL-Wet zone Low country, WM-Wet zone Mid country.
A significant interaction was observed between agro-climatic zone and soil order for EC (p < 0.05) (Fig. 5). In Dry zone Low country, Vertisols exhibited the highest EC, while Ultisols had the lowest (p < 0.05) (Fig. 5). Electrical conductivity values were largely consistent among soil orders within other agro-climatic zones.
Variation of soil pH and EC among water sources
-
Soil pH was similar among water sources within each agro-climatic zone (p > 0.05, Fig. 6). However, a significant interaction was observed between agro-climatic zone and water source for EC (p < 0.05, Fig. 6). Although EC was generally uniform across water sources within each zone (p > 0.05), an exception was observed in Dry zone Low country, where rainfed fields had significantly higher EC than irrigated fields (p < 0.05, Fig. 6).
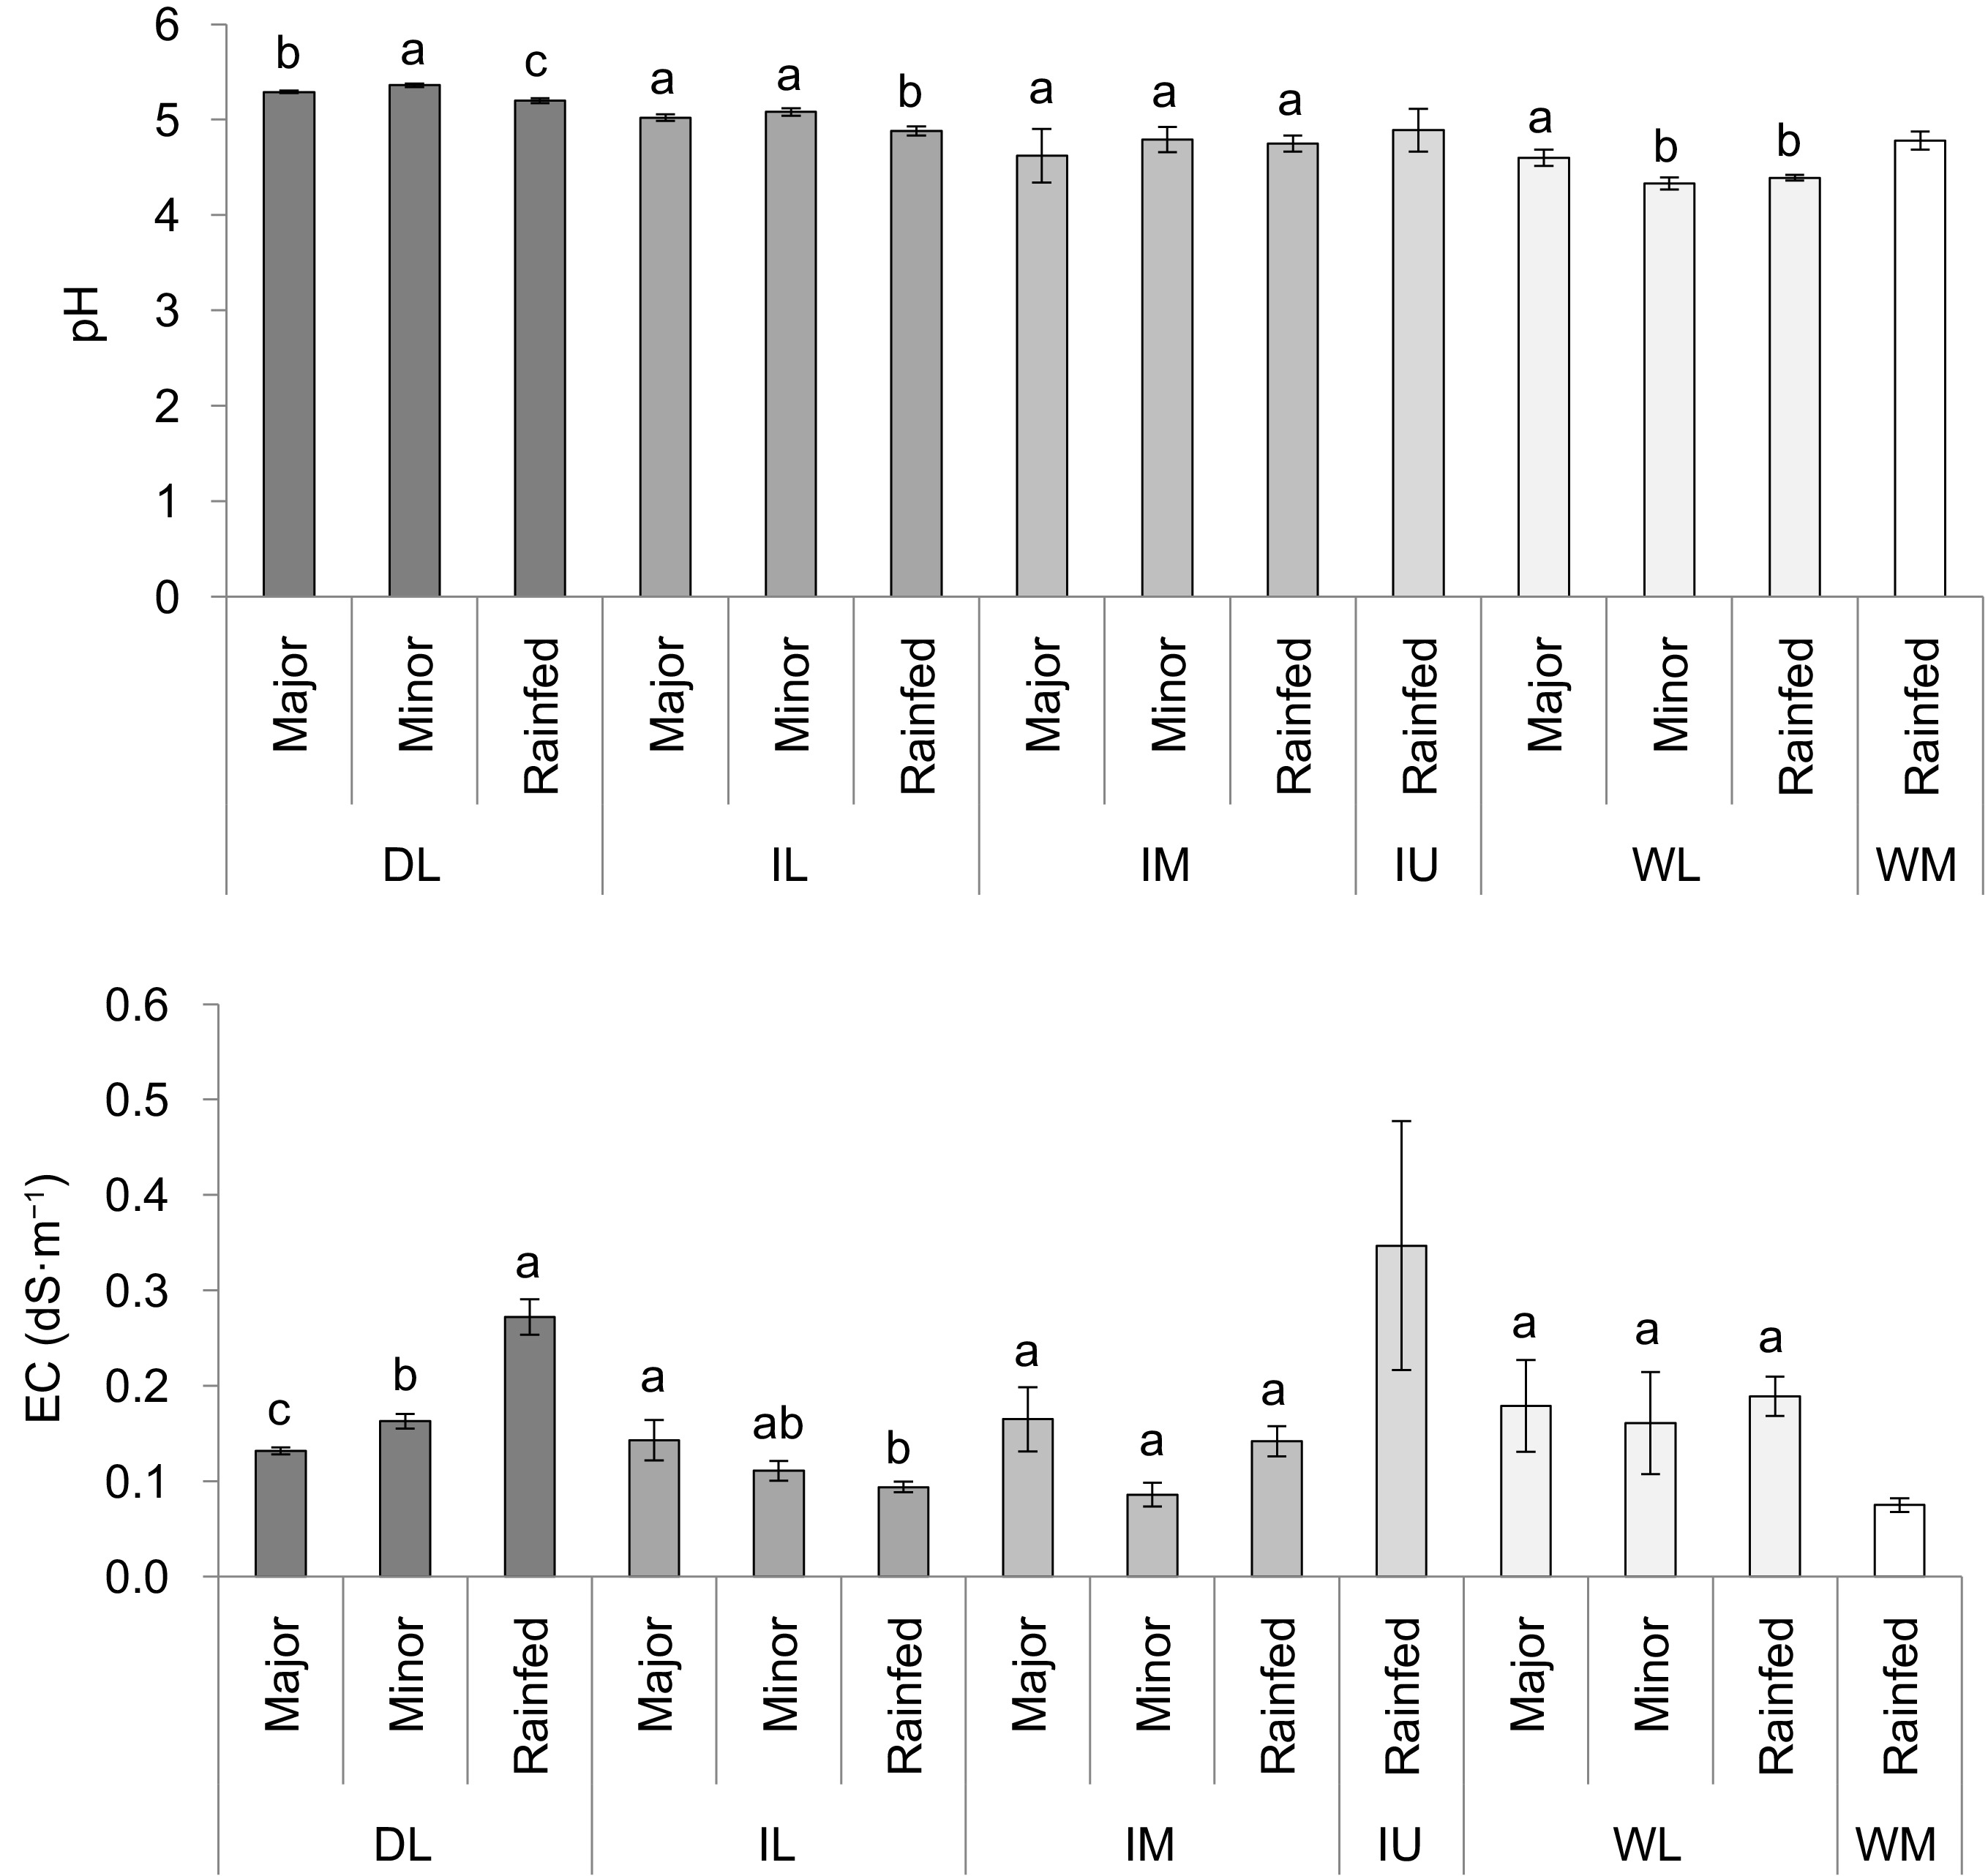
Figure 6.
Soil pH and Electrical conductivity (EC) in the paddy fields used to cultivate rice using different water sources and agro-climatic zones of Sri Lanka, DL-Dry zone Low country, IL-Intermediate zone Low country, IM-Intermediate zone Mid country, IU-Intermediate zone Upcountry, WL-Wet zone Low country, WM-Wet zone Mid country.
A weak but statistically significant correlation was observed between EC and pH (p = 0.007, R2 = 0.08, Fig. 7), indicating that a one-unit increase in pH corresponded to a rise of 0.0778 dS·m−1 in EC. Additionally, grain yield showed a significant positive correlation with pH and a negative correlation with EC (p < 0.05, Fig. 7).
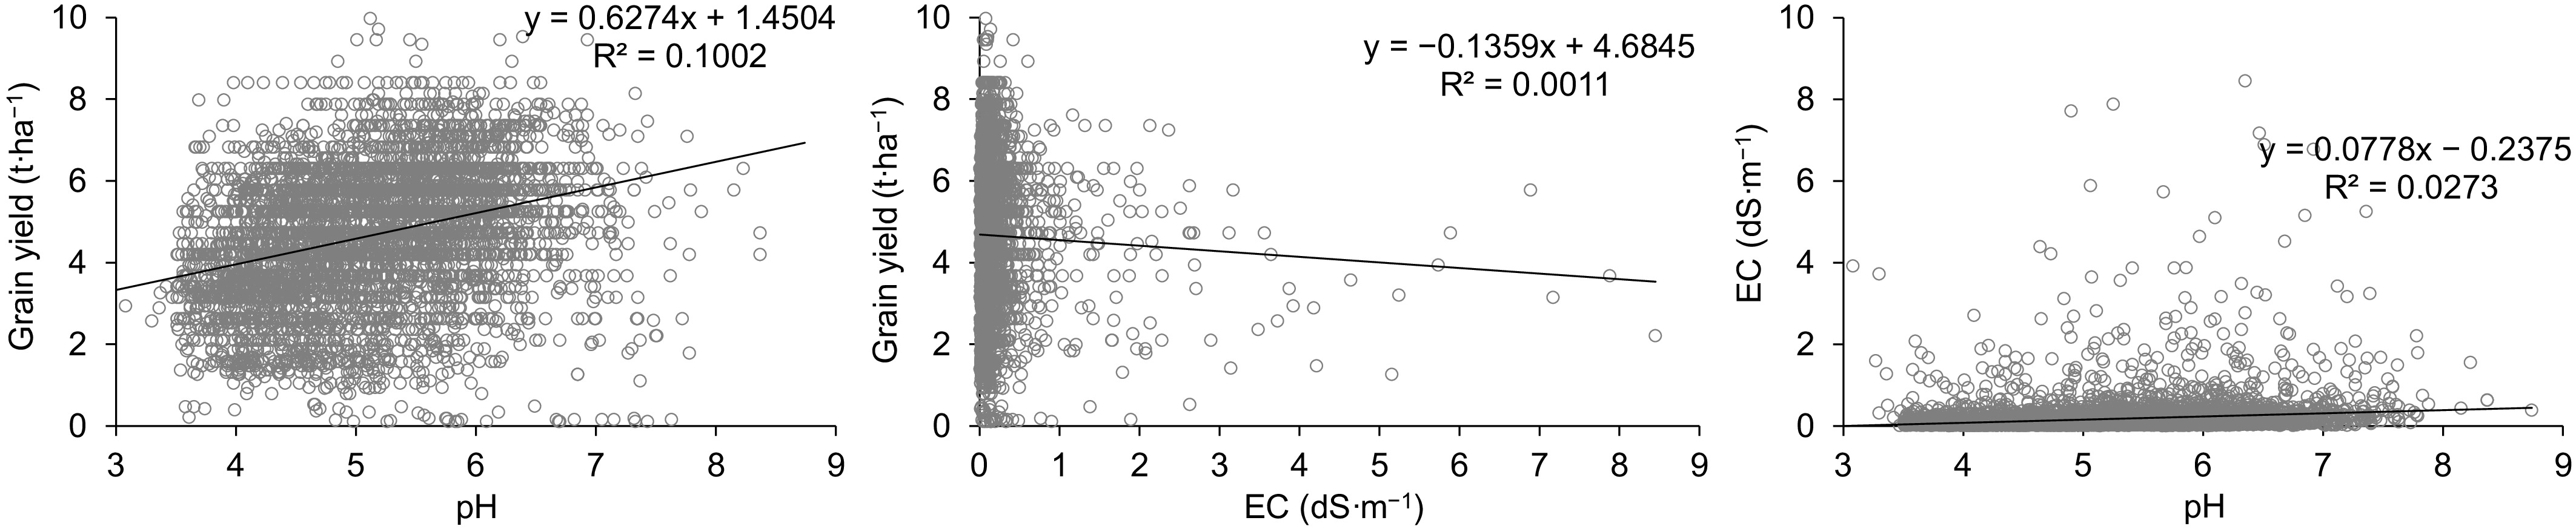
Figure 7.
Relationships between soil pH, soil EC, and grain yield of rice in Sri Lanka.
-
Rice thrives best in soil with a pH of 5.5–7.0, i.e., slightly acidic to neutral[16]. The soil pH measured in this study ranged from 2.4 to 8.7, and 64.5% of samples fell below the optimal pH range for rice. Soil pH influences nutrient solubility, ionic forms, mobility, and availability[18,30]; for instance, a lower pH tends to enhance plant uptake of B, Cu, Fe, Mn, Zn, and Cd, while reducing Mo availability[18,31,32]. Consequently, regions of Sri Lanka with low soil pH have reported frequent iron toxicity and elevated Cd uptake[13,33,34]. Soil pH also affects the use efficiency of fertilizers and agrochemicals[35−38].
Soil EC impacts yield indirectly via its association with soil factors directly tied to crop performance [15]. According to the salinity categorization by Lathiff [22], 94% of the samples collected in this study had EC levels less than 0.4 dS·m−1, which is considered highly suitable for rice. Elevated EC can disrupt mineral nutrient uptake through osmotic and ionic stress[25] and can also alter microbial processes and soil chemistry, such as ammonium volatilization [7]. Thus, deviations in pH and EC influence rice crop productivity by altering soil chemical and biological properties[10,30,39].
Influence of climate, soil orders, and water sources on pH and EC
Climate
-
Approximately 91% of Sri Lanka's paddy fields are located in the Dry Zone and Intermediate Zone, with minimal rice cultivation in the Wet Zone[40]. Soils in the Dry zone Low country derive from parent materials enriched in basic cations and are less weathered than those in the Wet zone Low country and Wet zone Mid country[41−43]. Due to lower rainfall, leaching losses are less, leading to high base saturation and consequently higher pH. In coastal Dry zone Low country areas, seawater intrusion and wind-blown salt also contribute ions[44]. High daily temperatures and evaporation further concentrate salts at the surface. In contrast, acidic soils are found in the Wet zone Low country and the Wet zone Mid country due to the presence of parent material with high silica, high intensity and amount of annual rainfall, leaching of basic cations, and sandy soil with low buffering capacity[23,45].
Soil orders
-
Soils sampled belonged to Alfisols, Entisols, Histosols, Inceptisols, Ultisols, and Vertisols[43]. Similar soil orders are used for rice cultivation in countries such as Indonesia (Alfisols, Entisols, Inceptisols, Ultisols, Vertisols), and the USA (Alfisols, Inceptisols, Mollisols, Vertisols)[46,47].
In the Dry zone Low country, Alfisols prevail from erosion deposits, coastal and flood plains, marked by clay illuviation in the B horizon and high concentrations of Ca2+ and Mg2+[43,48,49]. Vertisols in the Dry zone Low country (mainly north-west) contain high clay content (> 50%), are rich in Ca and Mg, and possess high cation exchange capacity, leading to elevated pH and EC[6,43,50].
Conversely, Ultisols dominate in the Wet zone Low country and Wet zone Mid country. These are highly weathered soils situated in high rainfall zones. As a result, intensive leaching depletes basic ions, yielding low pH (< 5) and EC[43,51,52]. They generally require lime and fertilizers to maintain productivity[43]. Entisols in the Wet zone Low country and the Wet zone Mid country are often affected by anthropogenic activities, and, therefore, originally resemble Ultisols and exhibit low pH[13,43,53]. Histosols-developed from lake, lagoon, or marine deposits-contain abundant Ca2+, Mg2+, and Na+, along with Vertisols and Entisols, tend to exhibit higher EC[43].
Water sources
-
During the major rice cultivating season, 46.5% of paddy lands relied on major irrigation, 26.6% on minor irrigation, and 26.9% were rainfed [2]. While Dry Zone and Intermediate Zone fields typically use perennial tanks, lakes, and river water for rice cultivation, fields in the Wet Zone depend mostly on rainfall [54]. Supplementary irrigation often follows 7–11-d intervals, producing wet-dry cycles that trigger oxidation–reduction dynamics, altering H+/OH– levels. As a result, flooded acidic soils tend to increase in pH while pH drops in alkaline soils[55−57]. Rainfed fields thus experience more pH fluctuation than irrigated fields. In the Dry zone Low country, and Intermediate zone Low country, some farmers also use agro-well groundwater in the dry season; this water is rich in bases, raising topsoil pH[58−61]. Salt availability and soil moisture significantly influence EC[62]. Irrigated fields leach more minerals downward, while rainfed soils in the Dry zone Low country retain more salts, resulting in higher EC than irrigated plots.
Relations between pH, EC, and grain yield
-
The study found a positive relationship between soil pH and EC, consistent with Chandrajith et al.[63]. Grain yield related positively to soil pH and negatively to EC. Hassan et al.[64] also reported positive yield-pH correlations. Low pH restricts the availability of Ca and Mg, increases the toxicity of Fe and Al, precipitates phosphorus, and diminishes microbial and nitrification processes[64,65]. Optimal nutrient cycling and biological activity occur at pH 5.0–8.0[18,64−67]. It has also been reported that elevated EC (reflecting excessive salinity) reduces yield beyond threshold levels[68,69]. Therefore, the extremes of both pH and EC may have negatively affected grain yield improvement in rice cultivation in Sri Lanka.
Possible interventions to optimize soil pH and EC
-
Besides inherent soil and climatic drivers, human activities such as land preparation, fertilizer use, organic amendments, contaminated irrigation, and improper water management influence pH and EC [13,15,23]. Practices such as the application of soil amendments, drainage, and proper tillage can adjust pH and EC [9,42]. Adding organic matter with inorganic fertilizer can raise both pH and EC [12,30,68], though intensive chemical fertilization may elevate EC while lowering pH-particularly with ammonium-based fertilizers such as urea and ammonium phosphate[30,45,69−71]. Liming acidic soils using CaCO3, CaO, or Ca(OH)2 increases pH[3,10]; biochar and manure additions also tend to alkalinize soil [72,73]. Maintaining optimal soil conditions may thus require incorporating amendments or the use of controlled-release fertilizers[9,42]. Short-term measures such as malate, glycine, or citrate application can quickly elevate pH. Controlled field trials in local agro-ecological contexts are advised to assess the effectiveness and scalability of these options.
-
This investigation explores pH and EC variation across Sri Lankan paddy soils in relation to agro-climatic zones, soil orders, and water sources. Most soils exhibited pH levels below the optimal range, while EC largely remained within suitable levels for rice. Spatial mapping revealed higher pH in the Dry zone Low country, and elevated EC in the Intermediate zone Up country, among agro-climatic zones; among soil orders, Vertisols had higher pH, whereas Entisols and Histosols showed higher EC. Rainfed fields in the Dry zone Low country, and Intermediate zone Low country tended to have higher pH and lower EC compared to irrigated systems. Although soil pH and EC were positively correlated, rice yield showed a positive relationship with pH, but a negative relationship with EC. Ensuring that both pH and EC remain within target ranges requires integrated nutrient and water management, drainage, and strategic use of soil amendments. These spatial insights can guide area-specific management aimed at narrowing the rice yield gap.
This study was supported by the World Bank through the grant AHEAD/RA3/DOR/STEM/No16. We acknowledge the technical assistance and resources provided by the Department of Crop Science, Faculty of Agriculture, University of Peradeniya.
-
The authors confirm their contributions to the paper as follows: writing original draft: Sugathas S, Chandrasekara C, Neththasinghe A, Suriyagoda L; formal analysis: Sugathas S, Chandrasekara C, Neththasinghe A, Thennakoon N, Ariyarathna M, Kadupitiya H, Thilakasiri R; data curation: Kadupitiya H, Thilakasiri R, Suriyagoda L; writing, review, and editing: Thennakoon N, Ariyarathna M, Kadupitiya H, Thilakasiri R, Suriyagoda L; funding acquisition: Ariyarathna M, Kadupitiya H, Thilakasiri R, Suriyagoda L. All authors reviewed the results and approved the final version of the manuscript.
-
Data will be made available upon a reasonable request from the corresponding author.
-
The authors declare that they have no conflict of interest.
- Supplementary Table S1 The number of soil samples collected from each climatic zone (CZ), agro-climatic zone (ACZ), and soil order to test the pH in the soil.
- Supplementary Table S2 The number of soil samples collected from each climatic zone (CZ) agro-climatic zone (ACZ), and water source to test pH in the soil.
- Supplementary Table S3 The number of soil samples collected from each climatic zone (CZ), agro-climatic zone (ACZ), and soil order to test EC in soil.
- Supplementary Table S4 The number of soil samples collected from each climatic zone (CZ), agro-climatic zone (ACZ), and water source to test EC in soil.
- Copyright: © 2025 by the author(s). Published by Maximum Academic Press, Fayetteville, GA. This article is an open access article distributed under Creative Commons Attribution License (CC BY 4.0), visit https://creativecommons.org/licenses/by/4.0/.
-
About this article
Cite this article
Sugathas S, Chandrasekara C, Neththasinghe A, Thennakoon N, Ariyarathna M, et al. 2025. Response of soil pH and electrical conductivity to climate, soil type, and water source, and their effect on rice grain yield in Sri Lankan lowlands. Circular Agricultural Systems 5: e017 doi: 10.48130/cas-0025-0014 

Response of soil pH and electrical conductivity to climate, soil type, and water source, and their effect on rice grain yield in Sri Lankan lowlands
- Received: 29 July 2025
- Revised: 01 November 2025
- Accepted: 12 November 2025
- Published online: 31 December 2025
Abstract: Soil pH and electrical conductivity (EC) are crucial determinants of rice productivity, as they influence nutrient solubility and osmotic regulation. This study assesses the spatial variability and controlling factors of pH and EC across Sri Lankan lowland paddy soils. A comprehensive dataset comprising 8,782 pH and 8,801 EC measurements obtained via a 1:5 soil-to-water extraction were used. Soil pH ranged from 2.4 to 8.7 (mean = 5.2), and EC from 0.05 to 8.45 dS·m−1 (mean = 0.166 dS·m−1). Only one-third of the samples fitted within the optimal pH range of 5.5–7.0, while approximately 6% exhibited EC values exceeding 0.4 dS·m−1, indicating medium to very high salinity. The highest pH values occurred in the Dry zone Low country and the lowest in the Wet zone Low country; whereas EC peaked in the Intermediate zone Up country and was lowest in the Wet zone Mid country. Vertisols exhibited a higher pH and EC among soil orders, while Histosols and Ultisols recorded a lower pH and EC, respectively. Irrigation source had low influence on pH; while rainfed fields displayed higher EC than irrigated counterparts, particularly in the Dry zone Low country. A positive correlation was observed between pH and EC. Grain yield was positively correlated with pH and negatively correlated with EC. Given that a substantial proportion of soils falls outside optimal chemical thresholds, site-specific management strategies based on agro-climatic zone, soil order, and irrigation regime are essential to enhance rice yields.
-
Key words:
- Leaching /
- Oxidation-reduction /
- Salinity /
- Soil reaction /
- Paddy