


-
Liquefied natural gas (LNG), widely acknowledged as the cleanest fossil fuel on earth, is extensively utilized due to its colorless, odorless, non-toxic, and non-corrosive properties. The 2023 China Liquefied Natural Gas Market Analysis Report projects that China's LNG market will expand to RMB 800 billion by 2025, representing an approximate 12% annual growth rate. As domestic LNG production facilities are predominantly located in remote regions distant from industrialized and densely populated areas, road transportation via tanker trucks is essential. However, concurrent with market expansion and increased transportation volumes, LNG road transport accident frequency has risen annually. The 2020 Wenling LNG tanker rollover and explosion accident resulted in 20 fatalities and direct economic losses of RMB 94.77 million. Consequently, preventing severe accidents—including rollovers, leaks, fires, and explosions—during LNG road transport is critical for ensuring safe delivery, sustaining LNG industry development, and supporting China's economic stability.
Primary vehicles for LNG road transport are heavy-duty tank semi-trailer trucks. Their inherent characteristics—high center of gravity, heavy payload, large volume, and wheelbase narrow relative to height—predispose them to rollover incidents. U.S. National Highway Traffic Safety Administration (NHTSA) data indicates that 80% of hazardous liquid cargo leakage accidents originate from tanker rollovers, which constitute 40%–50% of all tanker accidents and account for approximately 65% of occupant fatalities in such incidents.
Implementing practical risk assessments for hazardous chemical road transport can mitigate accident occurrence and severity. Risk assessment encompasses both qualitative and quantitative analyses. Scholars have employed qualitative methods—including checklists, Preliminary Hazard Analysis (PHA), and Fault Tree Analysis (FTA)—to identify and classify risks across diverse hazardous chemical transportation accidents. For instance, Faghri & Egyhaziova[1] applied fault trees to evaluate sensor reliability in intelligent highway systems. Rajeshwar Rao et al.[2] proposed a chemical-specific risk index method to establish scientific risk stratification. Fabiano et al.[3] developed an accident frequency assessment model using field data from an Italian pilot highway and multivariate statistical analysis. Oggero et al.[4] employed descriptive statistics to analyze common causes and hazards of hazardous chemical transport accidents. Shen et al.[5] based on the analysis of 708 hazardous goods accidents in China (2004–2011), reported high leakage probabilities and fire/explosion risks. Sarvestani et al.[6] used fault tree identifying management/organizational shortcomings and design errors as primary contributors, and domino effects occurring in a majority of cases. Chang et al.[7] used the fault tree-hierarchical analysis method (FTA-AHP) to conduct a quantitative analysis of the main causes of fires and explosions in hazardous chemical storage areas at ports and found that human factors were the direct cause. In quantitative analysis, Ona et al.[8] constructed a Bayesian network (BN) model to classify injury severity using rural highway accident data. Zhao et al.[9] utilized Bayesian networks (BNs) to identify the three highest-priority causal events in hazardous chemical transport accidents. Zhu et al.[10] constructed an accident causal chain using a Bow-tie model, and converted it into a Bayesian network, and calculated the probability of rollover/skidding at different wind speeds as conditional probabilities. Wang et al.[11] integrated Bow-tie diagrams with BN to dynamically model multi-hazard chains in hazardous chemical transport, leveraging real-time sensor data.
Currently, most risk analyses rely on large amounts of actual data. However, given the difficulty and complexity of collecting real data, fuzzy set theory is gradually being widely applied in various types of analysis. Shi et al.[12] proposed a hybrid fault tree analysis method that integrates improvements to the analytic hierarchy process (AHP) with fuzzy set theory, solving the quantitative bottleneck caused by missing basic event data in traditional methods for assessing the probability of fire and explosion accidents. Purba et al.[13] developed a fault tree analysis method based on fuzzy probability, which was verified through case studies to effectively propagate and quantify cognitive uncertainty. Li et al.[14] developed a probabilistic model that combines expert judgment and fuzzy set theory estimation to analyze causes of tanker leakage accidents. Luan et al.[15] combined fuzzy set theory with Leaky Noisy-OR theory to solve probability calculation problems in the absence of historical data, and used ALOHA software to simulate the consequences of accidents. Lee et al.[16] proposed using the fuzzy Bayesian network (FBN) method to quantify the risk reduction rate of hierarchical control measures for fire and explosion risks in the Korean chemical industry. While these studies have significantly contributed to the field, notable technical and operational gaps persist, particularly for assessing low-frequency, high-consequence events like LNG tanker rollovers. Traditional methodologies, such as FTA, provide a robust framework for mapping causal logic but are inherently limited. They are confined to static, unidirectional (top-down) inference and are heavily dependent on precise probabilistic data for basic events—data which is notoriously scarce for rare accidents. Conversely, BNs offer advanced capabilities for probabilistic inference and bidirectional reasoning but often face challenges in autonomous structure learning and the objective specification of prior probabilities, especially for under-represented events.
Building upon these foundational developments, recent research has seen the emergence of sophisticated hybrid models that push the boundaries of capability. Studies have successfully combined Bow-tie models with dynamic BNs to achieve real-time risk prediction informed by continuous monitoring data[17−19], but are contingent on continuous real-time data inputs, which are unavailable for pre-emptive risk assessment of rare events. Others have integrated FST with Bayesian methods to enhance prior probability specification under uncertainty[20], but often yield static outputs or focus on network topology rather than deriving event probabilities under uncertainty. Parallel advancements in data-driven machine learning[21] and multi-criteria decision-making frameworks[22] have further enriched the toolkit available for risk analysis, offering powerful predictive and evaluative capabilities for data-rich or qualitatively complex environments, but require vast amounts of historical training data, making them inapplicable to low-probability events with non-existent specific datasets. While these studies have profoundly contributed to the field, the challenges of assessing low-frequency, high-consequence events like LNG tanker rollovers necessitate a specific integration of capabilities. The prevailing trend in hybrid modeling often sees a focus on either enhancing uncertainty handling or enabling dynamic updating. The absence of a methodology designed to solve the problem of foundational probability quantification under deep uncertainty and data scarcity for specific, high-stakes physical events.
To address these identified limitations, this study develops an integrated FFT-BN methodology. The approach combines the structural strengths of Fault Tree Analysis (FTA) in mapping causal logic, the capability of Fuzzy Set Theory (FST) to quantify event probabilities under uncertainty through multi-source general traffic accident statistics and expert judgment, and Bayesian Network's (BN) advanced probabilistic inference for sensitivity analysis. By transforming the constructed fault tree into a Bayesian network framework informed by fuzzified priors, this research aims to: (1) establish the FFT-BN framework for assessing low-frequency, high-consequence LNG tanker rollover risks under data-scarce conditions; (2) identify and quantitatively rank critical risk contributors; and (3) derive actionable risk mitigation insights, particularly elucidating speed management's pivotal role in countering key risk factors, to provide a scientific foundation for targeted safety interventions in LNG road transportation.
-
This section outlines the proposed methodology, as illustrated in Fig. 1. First, causal factors of LNG tanker rollover accidents are identified through statistical analysis of accident data, establishing the basis for the fault tree structure. Second, probability quantification of these causal factors is achieved by applying coupled fuzzy set theory evaluated against traffic accident statistics. Building upon this foundation, a BN model is constructed. Within this model, the ratio of variation (ROV) characterizes the root nodes' contribution to the leaf node. Subsequently, the Birnbaum importance measure (BIM) and risk reduction worth (RRW) quantify both the contribution magnitude and influence intensity of root nodes on the leaf node, thereby identifying critical risk factors requiring prioritized mitigation.
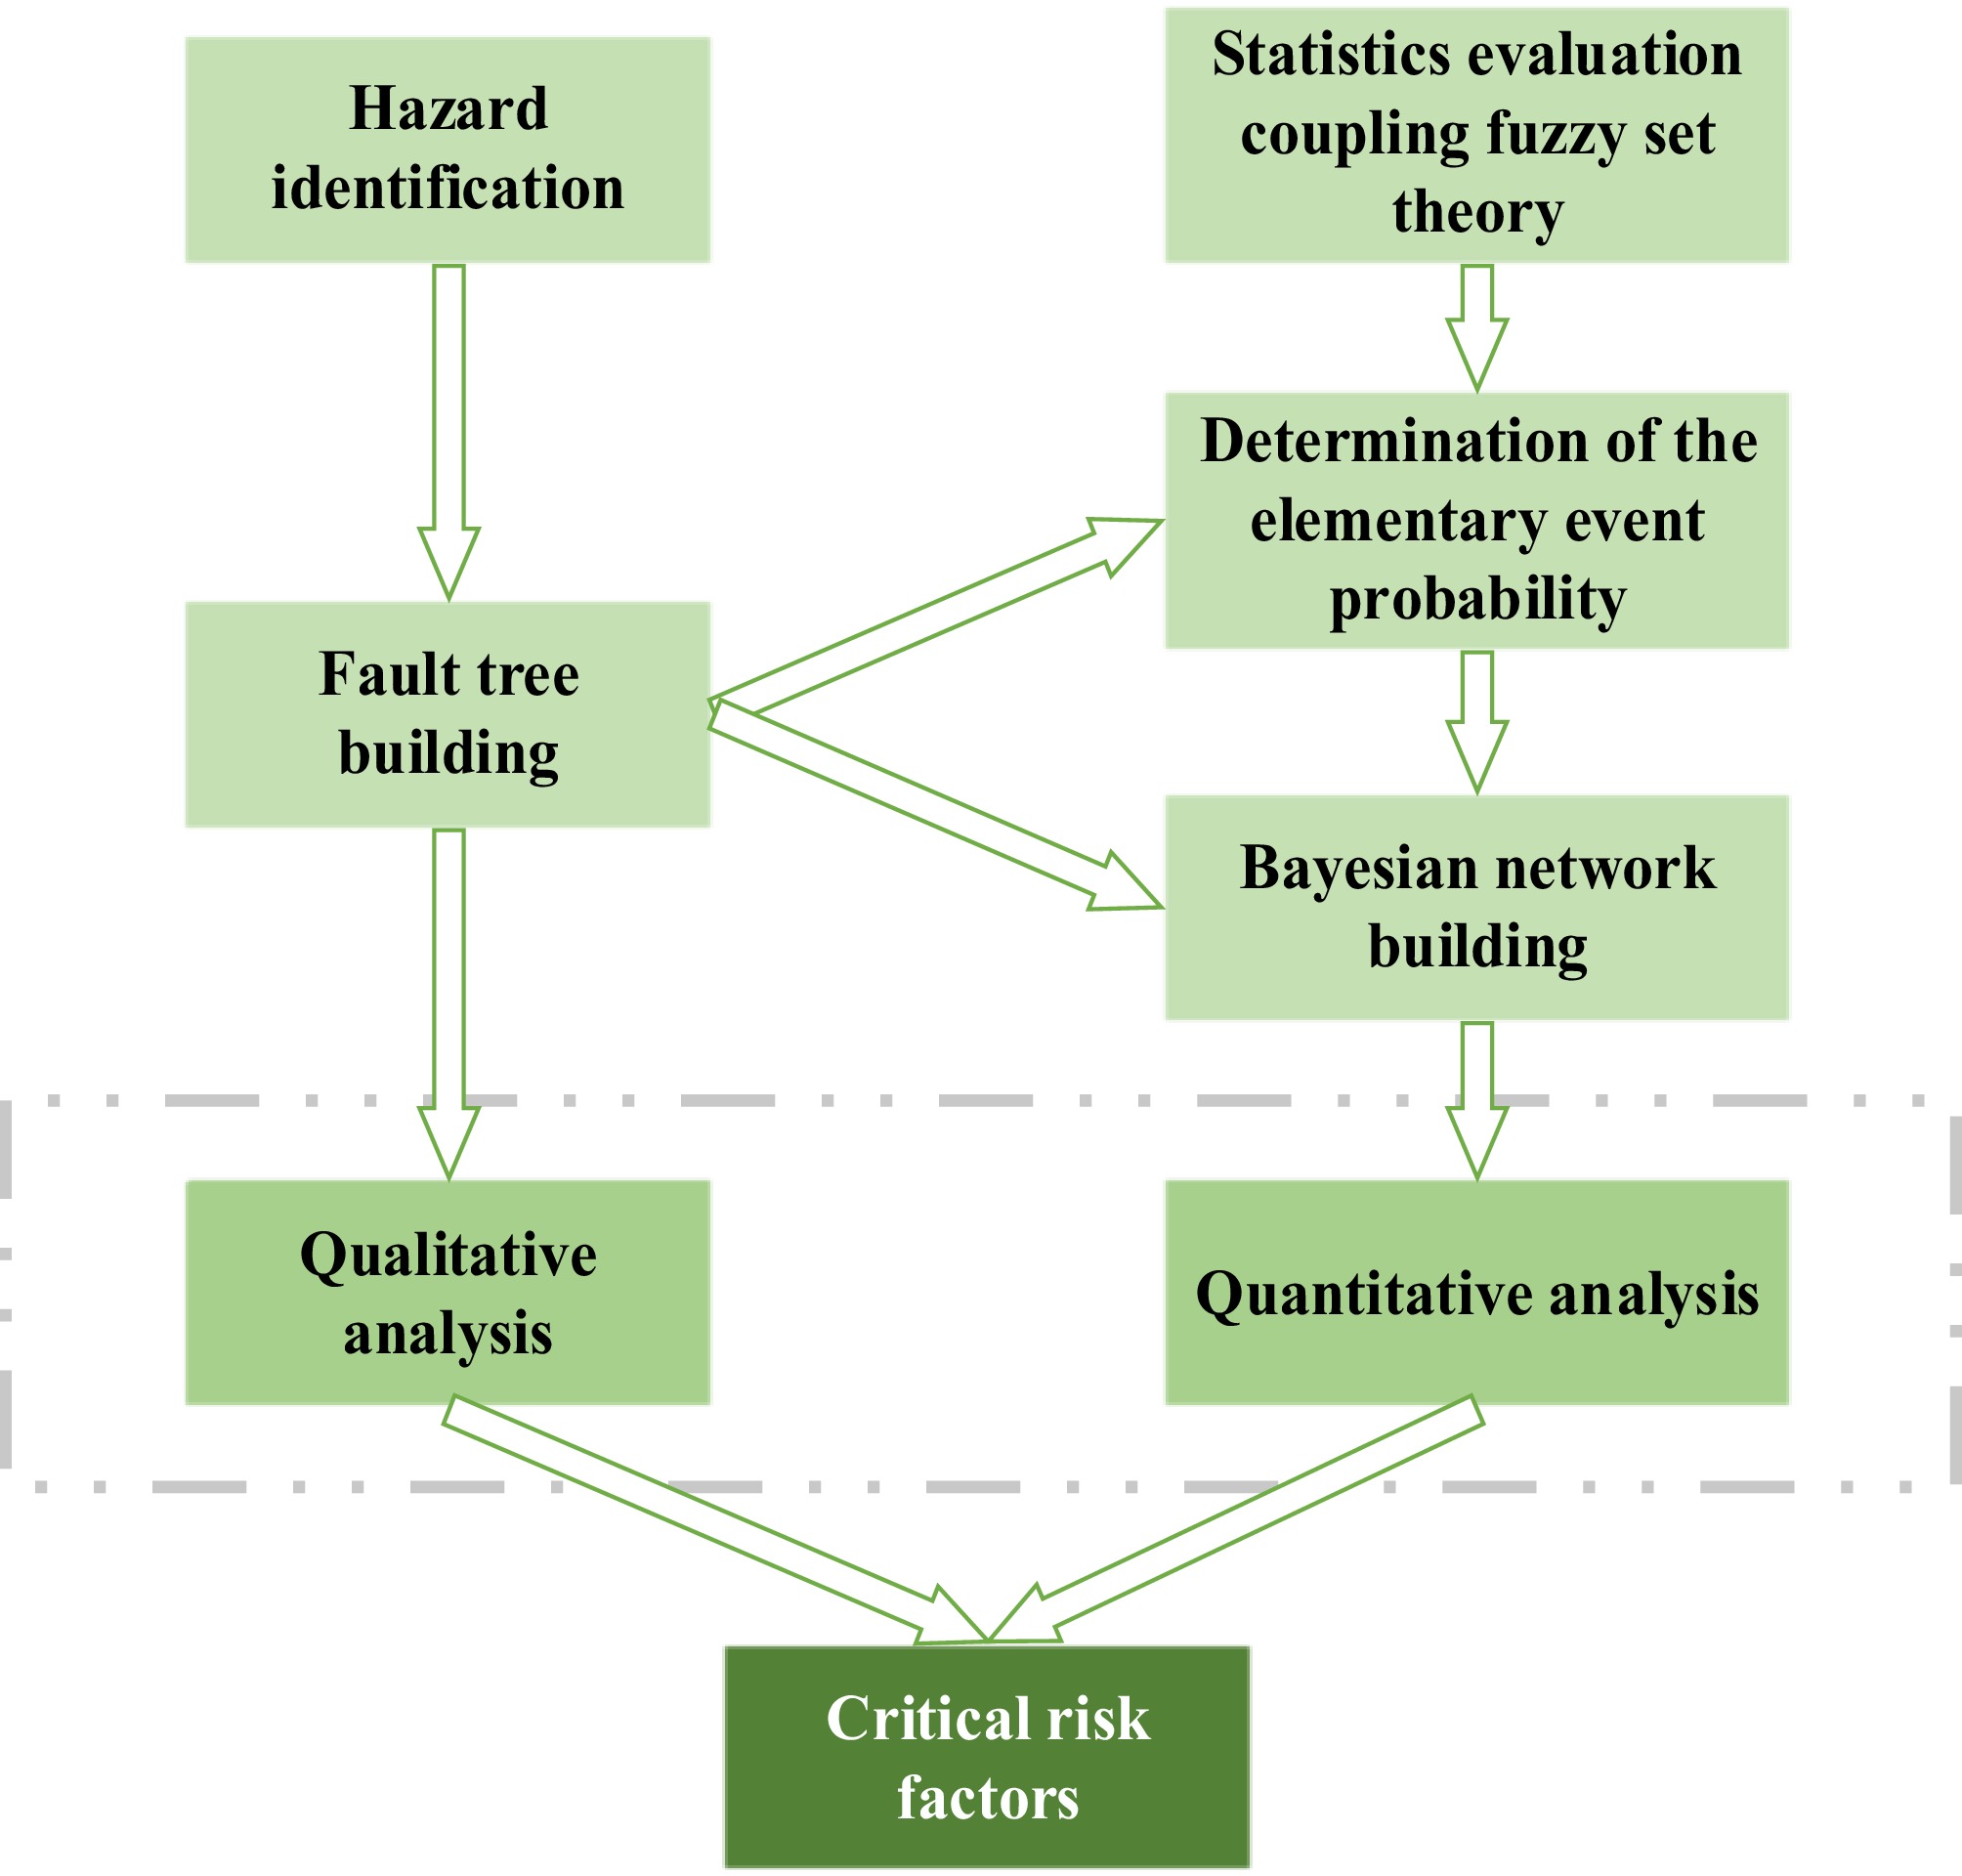
Figure 1.
The framework of the proposed method.
Fuzzy set theory
-
Fuzzy set theory was initially proposed by Professor L. A. Zadeh in 1965[23]. Traditional statistical methods for determining the occurrence probability of basic events rely heavily on extensive case data; however, detailed records are often lacking in practical engineering applications. Coupling expert assessment with fuzzy set theory enables the quantification of basic event probabilities under conditions of insufficient statistical support, simultaneously reducing subjective uncertainty inherent in data processing[24].
The membership function is fundamental to characterizing factor fuzziness. It reflects decision-makers' judgments regarding the degree of ambiguity in phenomena and constitutes the theoretical foundation of fuzzy set theory. This study employs the triangular membership function to derive fuzzy linguistic variables. Linguistic descriptors characterizing the likelihood of basic event occurrence are categorized into seven distinct levels. The specific levels, corresponding labels, and associated triangular fuzzy numbers are presented in Table 1, where
$l'$ $m'$ $u'$ Table 1. Risk level and probability expression.
Risk level Triangular fuzzy number $l'$ $m'$ $u'$ Very low (VL) 0 0 0.1 Low (L) 0 0.1 0.3 Fairly low (FL) 0.1 0.3 0.5 Medium(M) 0.3 0.5 0.7 Fairly high (FH) 0.5 0.7 0.9 High (H) 0.7 0.9 1.0 Very high (VH) 0.9 1.0 1.0 After acquiring fuzzy linguistic assessments for basic events, the evaluation results must be integrated to derive an aggregated fuzzy number
$\tilde {Z}\left( {{{X}_i}} \right)$ ${X_i}$ $\tilde {Z}\left( {{{X}_i}} \right)$ ${X_i}$ $ \tilde {Z}\left( {{{X}_i}} \right) = \sum\nolimits_{j = 1}^n {{\delta _j}} {\tilde q_{{X_i}j}} = {\delta _1}{\tilde q_{{X_i}1}} \oplus {\delta _2}{\tilde q_{{X_i}2}} \oplus \cdot \cdot \cdot \oplus {\delta _n}{\tilde q_{{X_i}n}} = \left( {{{l'_{x,i}}},{{m'_{x,i}}},{{u'_{x,i}}}} \right) $ (1) where,
${\delta _i}$ ${\tilde q_{{X_i}j}}$ ${X_i}$ The aggregated fuzzy number
$\tilde {Z}\left( {{{X}_i}} \right)$ $P\left( {{X_i}} \right)$ $P\left( {{X_i}} \right)$ $ P({X_i}) = \dfrac{{\int\limits_0^1 {Average({F_a}) \times f(a)da} }}{{\int\limits_0^1 {f(a)da} }} $ (2) where,
${F_a} = \left\{ {X\left| {F(X) \geqslant {\text{a}}} \right.} \right\}$ $a$ $f(a)$ $a$ $Average({F_a})$ $a$ $Average({F_a})$ $ Average({F_a}) = \dfrac{{{U_a} + {V_a}}}{2} $ (3) where,
${U_a}$ ${V_a}$ $a$ ${U_a}$ ${V_a}$ $ {U_a} = \left( {{{m'_{{X_i}}}} - {{l'_{{X_i}}}}} \right) \times a + {l'_{{X_i}}} $ (4) $ {V_a} = {u'_{{X_i}}} - ({u'_{{X_i}}} - {m'_{{X_i}}}) \times a $ (5) Typically,
$f(a)$ $a$ $P\left( {{X_i}} \right)$ $ \begin{split}P({X}_{i})=\;&\frac{\dfrac{1}{2}{\displaystyle \underset{0}{\overset{1}{\int }}\left[({m'_{{X}_{i}}}-{l'_{{X}_{i}}})\times 0.5+{l'_{{X}_{i}}}+{u'_{{X}_{i}}}+({m'_{{X}_{i}}}-{u'_{{X}_{i}}})\times 0.5\right]}da}{{\displaystyle \underset{0}{\overset{1}{\int }}da}}\\=\;&\dfrac{{l'_{{x}_{i}}}+2{m'_{{X}_{i}}}+{u'_{{X}_{i}}}}{4} \end{split}$ (6) Before conducting causal analysis of LNG road transport vehicle rollover accidents, the occurrence probabilities of causal factors must be established. Traditional statistical methods for determining basic event probabilities require extensive case data; however, China's current traffic accident statistics lack cargo-specific classifications. LNG tanker rollover accidents face significant limitations in available statistical data.
Since rollover accidents are a typical type of traffic accident, they share certain similarities with other accident types in terms of causal factors and retain the general characteristics of traffic accidents. Coupling expert assessment with fuzzy set theory enables the quantification of basic event probabilities under conditions of insufficient statistical support, providing a structured approach to handle the inherent subjectivity and variability in expert judgments, thereby reducing the arbitrariness often associated with unstructured data processing. Therefore, this study proposes a probability calculation methodology that evaluates traffic accident statistics (including heavy truck accidents, mountainous highway accidents, major accident reports, and hazardous chemical tanker accidents) through coupled fuzzy set theory.
By statistically analyzing relevant traffic accident data, extracting and integrating the probability of events related to accident causative factors, and converting the probability of rollover accident causative factors obtained from different traffic accident statistics into fuzzy language terms through appropriate membership functions, multiple sets of accident causative factor comment sets can be obtained.
Fault tree-Bayesian network analysis
-
Fault tree analysis (FTA) effectively shows causal logic relationships within accident pathways. Due to its simple principles and ease of operation, it is widely used in the field of accident cause analysis. However, FTA is constrained to unidirectional top-down inference, exhibiting limited reasoning efficiency and lacking backward inference capability.
Bayesian network (BN) methodology computes precise probabilistic relationships using only prior probabilities[26], offering computationally efficient inference. Conversely, this approach exhibits three principal constraints: (1) inability to autonomously identify events and indicators; (2) challenges in prior probability acquisition; and (3) complexity in model construction and conditional probability table specification.
To address these limitations, this study implements an integrated FT-BN framework for causal analysis. To overcome the above shortcomings, this study uses a fault tree and Bayesian network fusion method for causal analysis, solving problems such as the high data dependency and complex computational reasoning of ordinary fault trees and Bayesian analysis. The specific conversion process is shown in Fig. 2.
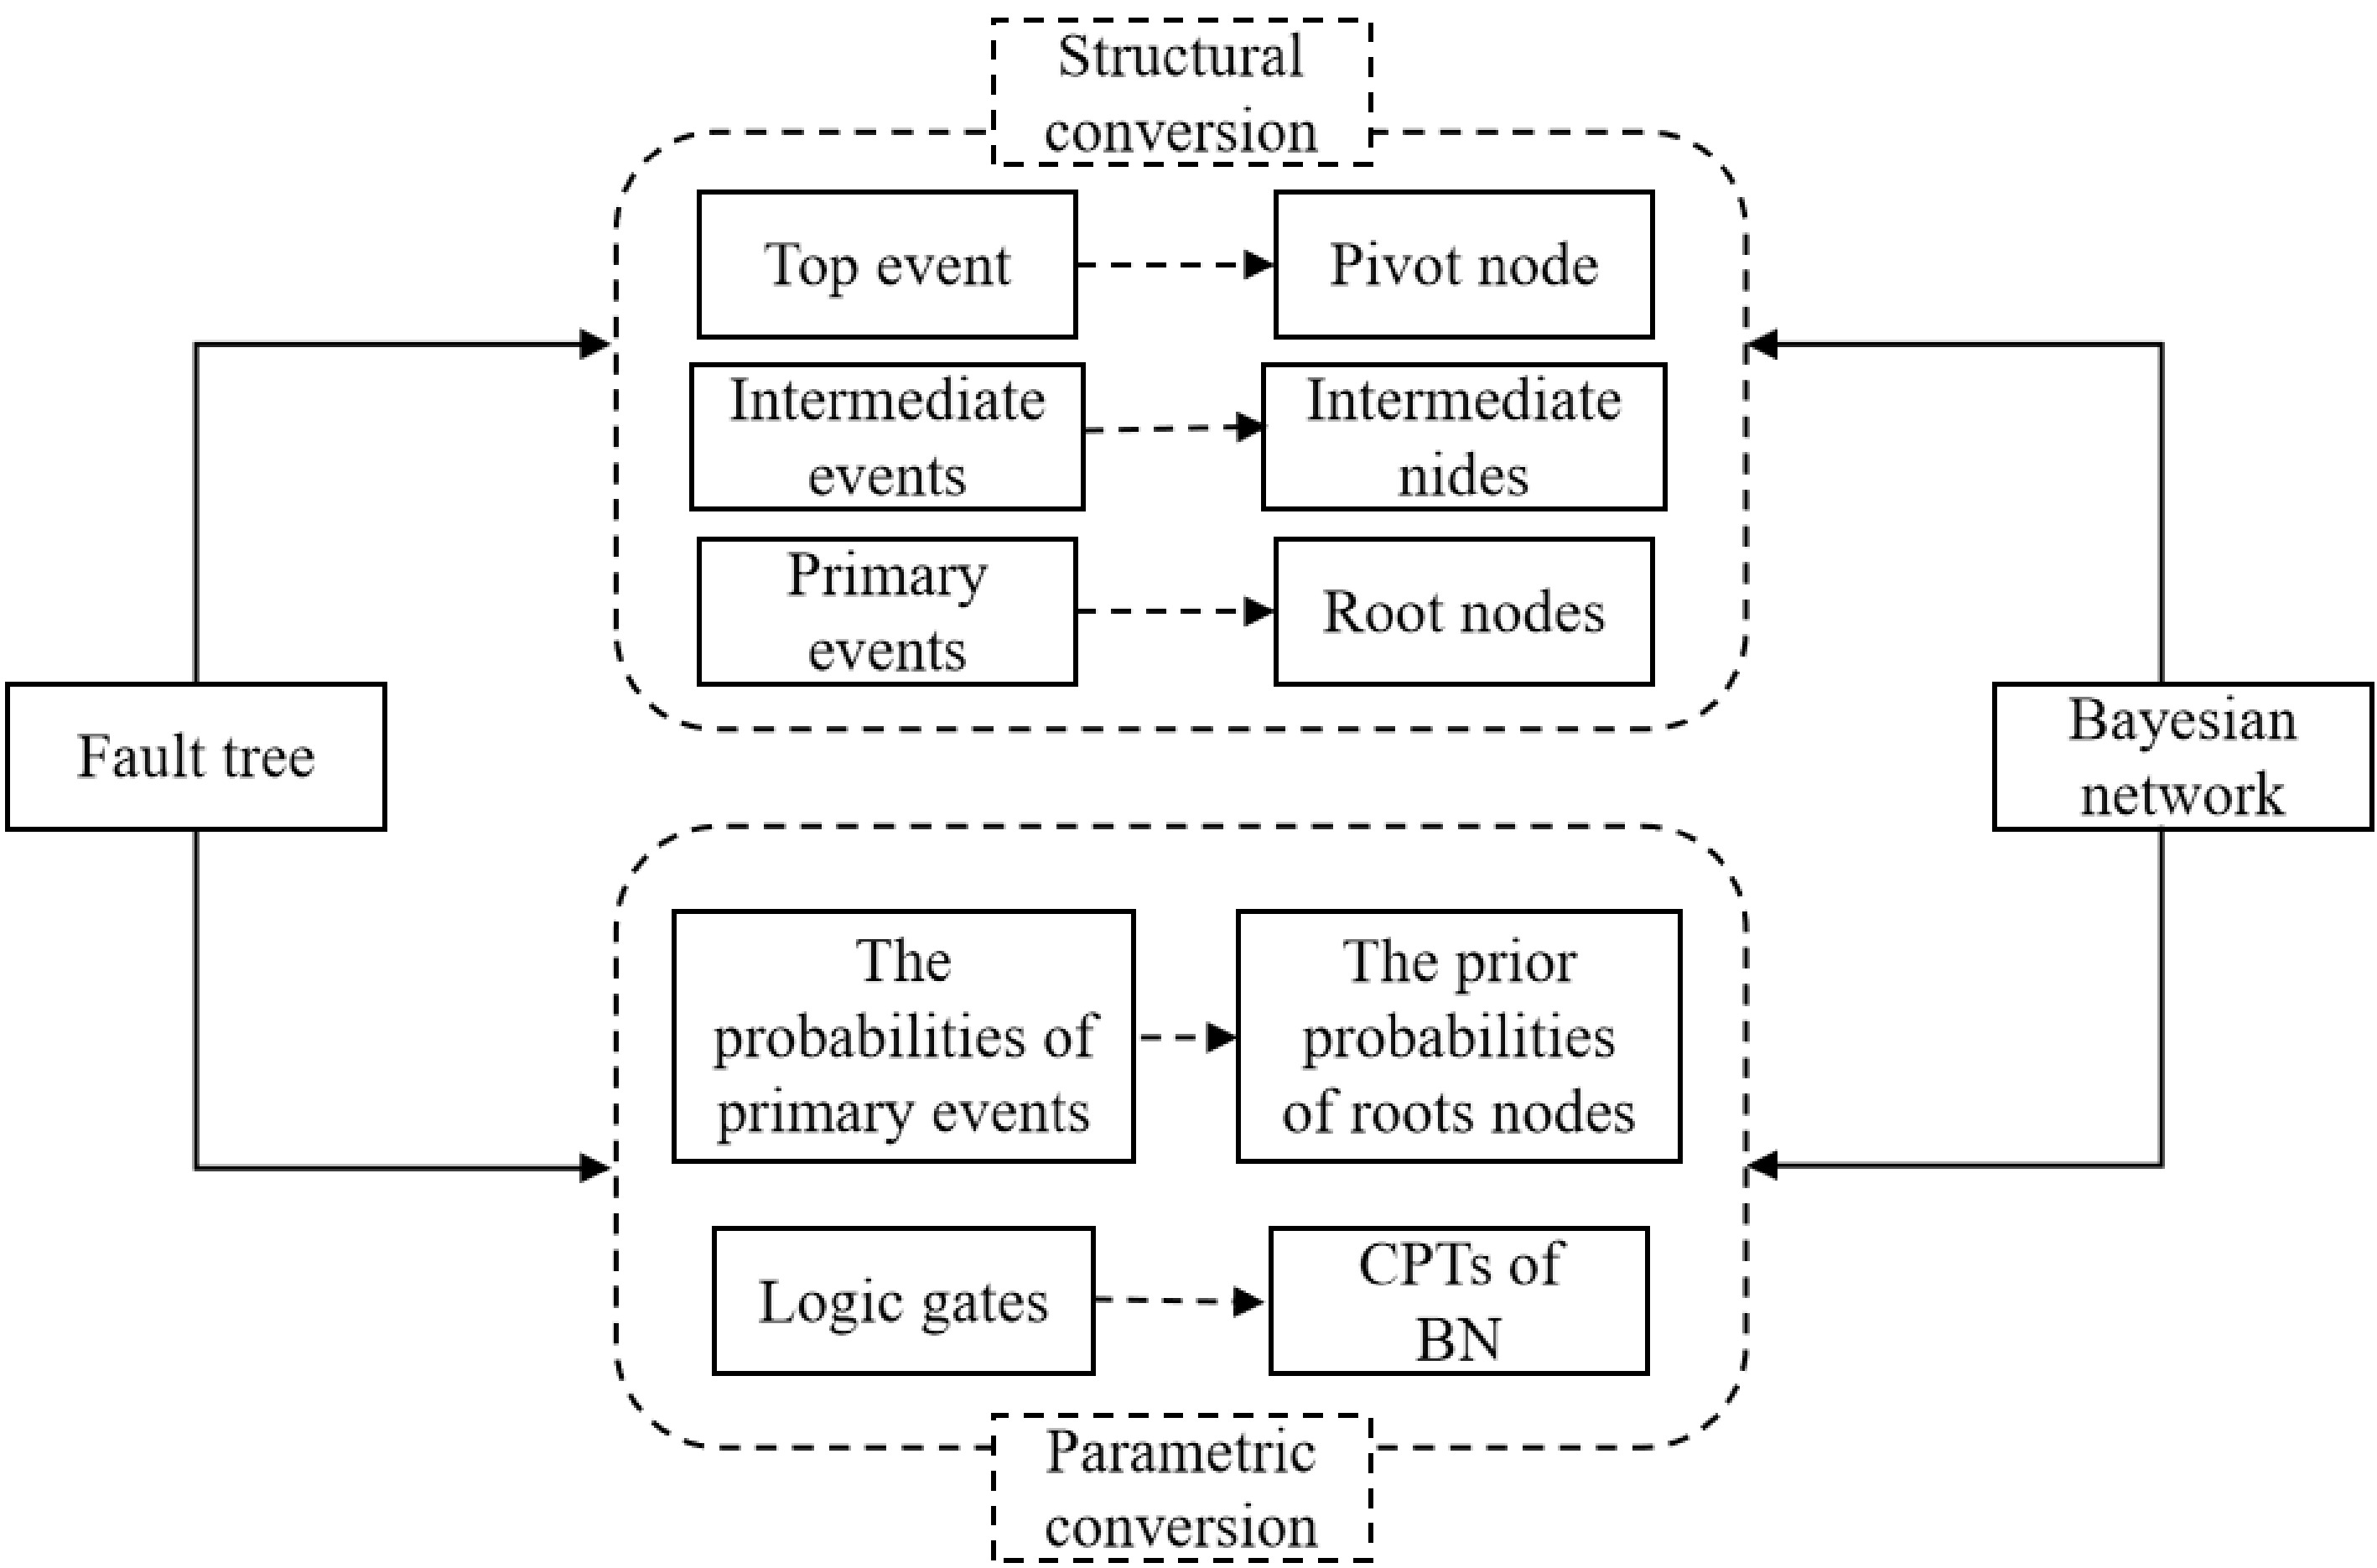
Figure 2.
FT-BN conversion diagram.
The conversion process involves several key steps. First, based on the analysis of rollover causation factors, a fault tree model is constructed. Second, the Bayesian network model is established by converting the fault tree model. The transformation from a fault tree to a Bayesian network consists of two main modules: structure transformation and parameter transformation. Structure transformation involves mapping the top event, intermediate events, and basic events of the fault tree to the leaf nodes, intermediate nodes, and root nodes of the Bayesian network, respectively. It is important to note that if different intermediate events in the fault tree share the same basic event, only one root node needs to be constructed in the Bayesian network topology without repetition. Parameter transformation converts the occurrence probabilities of basic events in the fault tree into prior probabilities of root nodes, while the logic gates are transformed into conditional probability tables for intermediate and leaf nodes. In this transformation, all nodes are discretized into binary states—'Yes' (occurrence) and 'No' (non-occurrence).
For root nodes, the prior probabilities are directly taken from the defuzzified values. For intermediate and leaf nodes, the CPTs are constructed deterministically based on the underlying FT gate logic: for an OR gate, P(Child = Yes | Parents) is 1 if any parent is 'Yes' and 0 only if all are 'No'; for an AND gate, P(Child = Yes | Parents) is 1 only if all parents are 'Yes' and 0 otherwise. This deterministic CPT construction follows standard FT semantics and is well-accepted in FT-BN integrations. Assuming all basic events are mutually independent, consistent with conventional FTA assumptions. The third step involves constructing the CPTs, converting basic event probabilities into root node prior probabilities, and performing forward predictive reasoning to obtain the prior probabilities of intermediate and leaf nodes. The fourth step conducts backward diagnostic reasoning to obtain posterior probabilities for importance analysis.
-
This work analyzes 12 domestic LNG road tanker rollover accident cases (Table 2) compiled from literature and digital sources, identifying 20 causal factors. Four traffic accident datasets were categorized according to these factors: heavy-duty truck accident statistics within a metropolitan area, mountainous highway accident statistics, major/catastrophic accident investigation reports, and hazardous materials tanker accident statistics. Considering the differences between the four sets of traffic accident statistics and LNG transport vehicle rollover accidents, as well as the limitations of the statistical scope, this work combined the characteristics of LNG road transport and data statistics to obtain a set of expert scoring evaluations to address the shortcomings in the four sets of traffic accident statistics.
Table 2. LNG road tanker rollover accident cases.
No. Accident time Accident location Accident feature Accident brief 1 November 24,
2011Sanshankou Section, 312 National Highway, Jingyuan County Winter, national highway, noon, clear The LNG tanker truck overturned due to brake failure caused by icing. 2 April 21, 2012 1,350 km + 800 m mark, 310 National Highway, Tianshui City, Gansu Spring, national highway The LNG tanker rolled over from the highway onto the Wei River beach, approximately 10 m from the roadbed. A minor leak occurred at the tank valve. 3 May 26, 2014 Entrance No. 1 Tunnel, Fuyin Expressway, Tongchuan Summer, highway, afternoon Spontaneous combustion of the rear tires of the LNG tanker caused it to overturn, resulting in the valve being burnt out and causing a leak. 4 February 3, 2015 1,020 km mark, 314 National Highway, Aksu City, Xinjiang Spring, national highway, nighttime, snowy The driver lost control due to slippery road conditions in heavy snow, leading to an overturn and leakage. A significant amount of natural gas leaked. 5 October 11, 2016 Downhill section under Liujiagou Viaduct, Qingyin Expressway, Wubu County, Yulin Autumn, expressway, morning, clear Excessive speed caused the tank to tilt due to inertia, leading to the tanker overturning. The tanker's pipeline ruptured, resulting in an LNG leak. 6 February 20, 2017 1 km from Ma'anshan Tunnel towards Nanhua, Nanshui Highway, Nanhua County, Yunnan Spring, provincial highway, morning, clear A tanker carrying 24 tons of LNG overturned into a roadside ditch. 7 May 11, 2017 Section 2,058 km, Lantian Tunnel Summer, expressway tunnel, nighttime, clear A tanker carrying 21 tons of LNG, while avoiding a vehicle ahead, had its left front tire hit the roadbed and burst, causing it to overturn and skid. 8 April 29, 2019 East of Duzhuang Natural Village, Gaoxin Village, Gaoxin Town, Suiyang District, Shangqiu City Spring, county road, morning, clear An LNG tanker carrying 21.6 tons of LNG overturned due to improper driving. 9 April 7, 2020 Huangjiashan at 2,548 km mark Spring, national highway, nighttime, clear A fully loaded 20-ton tanker overturned while navigating a U-shaped curve due to driver error, compounded by rain, darkness, and slippery road conditions. The leak originated from the rear of the storage tank. The leaked natural gas mixed with atmospheric moisture, forming a white mist. 10 June 7, 2020 Shaxi Section, Yongjin Expressway (towards Jinhua), Xinchang County, Zhejiang Summer, expressway, nighttime, clear An LNG tanker rear-ended another vehicle, overturned, and caught fire. 11 June 13, 2020 Off-ramp at Wenling West Exit (Wenzhou direction), Shenhai Expressway Summer, expressway, afternoon, clear A tanker transporting hazardous chemicals overturned on an off-ramp due to overspeeding. Subsequent impacts led to an explosion. 12 June 20, 2021 Xiajing Village Section, Qiaodong Town, Zhao'an County, Zhangzhou City, National Highway 324 Summer, national highway, early morning, clear A 26-ton tanker was involved in a rear-end collision with a vehicle, resulting in a natural gas leak. The identification of causal factors was conducted through a systematic analysis of 12 LNG tanker rollover accident cases. Each case was reviewed using a content analysis protocol based on the 'Human-Vehicle-Road-Environment' framework. This process yielded an initial set of factors, which were then consolidated to remove duplicates and refine definitions, resulting in the final 20 causal factors. The 20 causal factors were categorized under four main subsystems: human (e.g., unsafe driving, lack of experience and erroneous maneuvers), vehicle (e.g., sudden failure of brakes or steering, non-compliance with transport requirements), road (e.g., poor road alignment, slippery road surface), and Environment (e.g., visibility less than 100 m, adverse weather conditions).
Given potential evaluation discrepancies across heterogeneous data sources, dataset-specific weighting was implemented to minimize error propagation and ensure analytical robustness. For
$n$ $m$ $ {m_j} = \dfrac{{{C_j}}}{{\sum\limits_{j = 1}^n {{C_j}} }} $ (7) where,
${C_j}$ $j$ In this evaluation, five sets of causal factor assessments were conducted. Based on the rating criteria outlined in Table 3, the evaluations were scored for all five sets. Subsequently, weights were calculated for each set of evaluations, with the results presented in Table 4.
Table 3. Score allocation for the evaluation of sources of accident-causative factors.
Items Categories Score Volume < 600 1 600~1,000 2 Source Transportation department 4 Comprehensive materials 2 Urban traffic accidents 1 Subject Mountainous highway accidents 2 Major/catastrophic accidents 4 Hazardous materials tanker accidents 5 Vehicles involved All kinds of vehicles 2 Heavy-duty vehicles/tank trucks 4 Level of detail Detailed 2 Rough 4 Table 4. Weight allocation for the evaluation of five groups of accident causative factors.
Number Date source Score for volume Score for source Score for subject Score for vehicles involved Score for level of detail Total score Final weight 1 Heavy-duty truck accidents 1 4 1 4 4 14 0.19 2 Mountainous highway accidents 1 4 2 2 2 11 0.15 3 Major/catastrophic accidents 1 4 4 2 4 15 0.20 4 Hazardous materials tanker accidents 2 2 5 4 2 15 0.20 5 Expert evaluations 2 4 5 4 4 19 0.26 After evaluating the causal factors of LNG road transport vehicle rollover accidents, it is necessary to further integrate the results to obtain aggregated fuzzy numbers and defuzzification. In this study, considering the evaluation weights, the linear opinion pool method was adopted to integrate all evaluations of the basic event. Based on Eqs (1) to (6), combined with the five groups of evaluations, the occurrence probabilities for all 20 causal factors in LNG transport vehicle rollover accidents can be determined, as shown in Table 5.
Table 5. Prior probability from historical data and experts' estimation.
Symbol Description Judgment Aggregation of fuzzy numbers Defuzzification 1 2 3 4 5 X1 Traffic violation M M H FL FH (0.39, 0.59, 0.77) 0.5870 X2 Unsafe driving M M FH FL H (0.4, 0.6, 0.78) 0.5975 X3 Lack of experience and erroneous maneuvers L FL FH FL M (0.21, 0.39, 0.59) 0.3988 X4 Low visibility L L FL L L (0.02, 0.14, 0.34) 0.1600 X5 Unfavorable driving time M M M M L (0.22, 0.4, 0.6) 0.4025 X6 Poor road alignment L M M L H (0.29, 0.45, 0.62) 0.4513 X7 Poor road surface smoothness VL VL VL VL L (0, 0.03, 0.15) 0.0510 X8 Slippery road surface FL L FL L M (0.12, 0.28, 0.48) 0.2908 X9 Tire blowouts and tire failures VL VL VL VL VL (0, 0, 0.1) 0.0250 X10 Sudden failure of brakes or steering FL VL FL VL L (0.04, 0.14, 0.31) 0.1583 X11 Non-compliance with transport requirements VL VL VL VL L (0, 0.03, 0.15) 0.0510 X12 Improper loading and cargo securement VL VL VL VL FL (0.03, 0.08, 0.2) 0.0965 X13 Low-adhesion (e.g., ice/snow cover) VL VL L VL FL (0.03, 0.1, 0.24) 0.1165 X14 Road construction and obstacles VL VL VL VL L (0, 0.03, 0.15) 0.0510 X15 Absence of critical traffic facilities L L M FL L (0.08, 0.22, 0.42) 0.2350 X16 Visibility less than 100 m L L L L L (0, 0.1, 0.3) 0.1250 X17 Adverse weather conditions (e.g., heavy fog) L L L L VL (0, 0.07, 0.25) 0.0990 X18 Nighttime driving without illumination L FL VL L L (0.02, 0.11, 0.29) 0.1313 X19 visual interference VL VL VL VL VL (0, 0, 0.1) 0.0250 X20 Complex traffic flow M VL VL VL L (0.06, 0.12, 0.27) 0.1413 The 'judgment' column in the table represents five sets of accident cause factor evaluations: heavy-duty truck accident statistics within a metropolitan area, mountainous highway accident statistics, major/catastrophic accident investigation reports, hazardous materials tanker accident statistics, and expert evaluations derived from analyses of LNG road transport rollover accidents.
Structure of the fault tree
-
The construction of the fault tree hierarchy was guided by a systematic synthesis of 12 LNG tanker rollover accident cases, complemented by established frameworks from hazardous chemical transportation safety literature and domain expert consensus. The top event, LNG road tanker rollover, was decomposed into intermediate events representing four canonical causal categories—human, vehicle, road, and environmental factors—consistent with widely adopted accident causation models. Intermediate events were further refined into sub-categories based on mechanistic insights from case analysis and expert judgment. For instance, driver-related factors were divided into direct driving behaviors and judgment-impairing factors, reflecting how environmental and road conditions indirectly influence driver performance. Similarly, vehicle-related factors were specialized to account for LNG-specific phenomena such as liquid sloshing, which arises from improper loading and vehicle posture.
Building upon the preceding causal analysis, the fault tree model for LNG tanker rollover accidents was constructed as illustrated in Fig. 3.
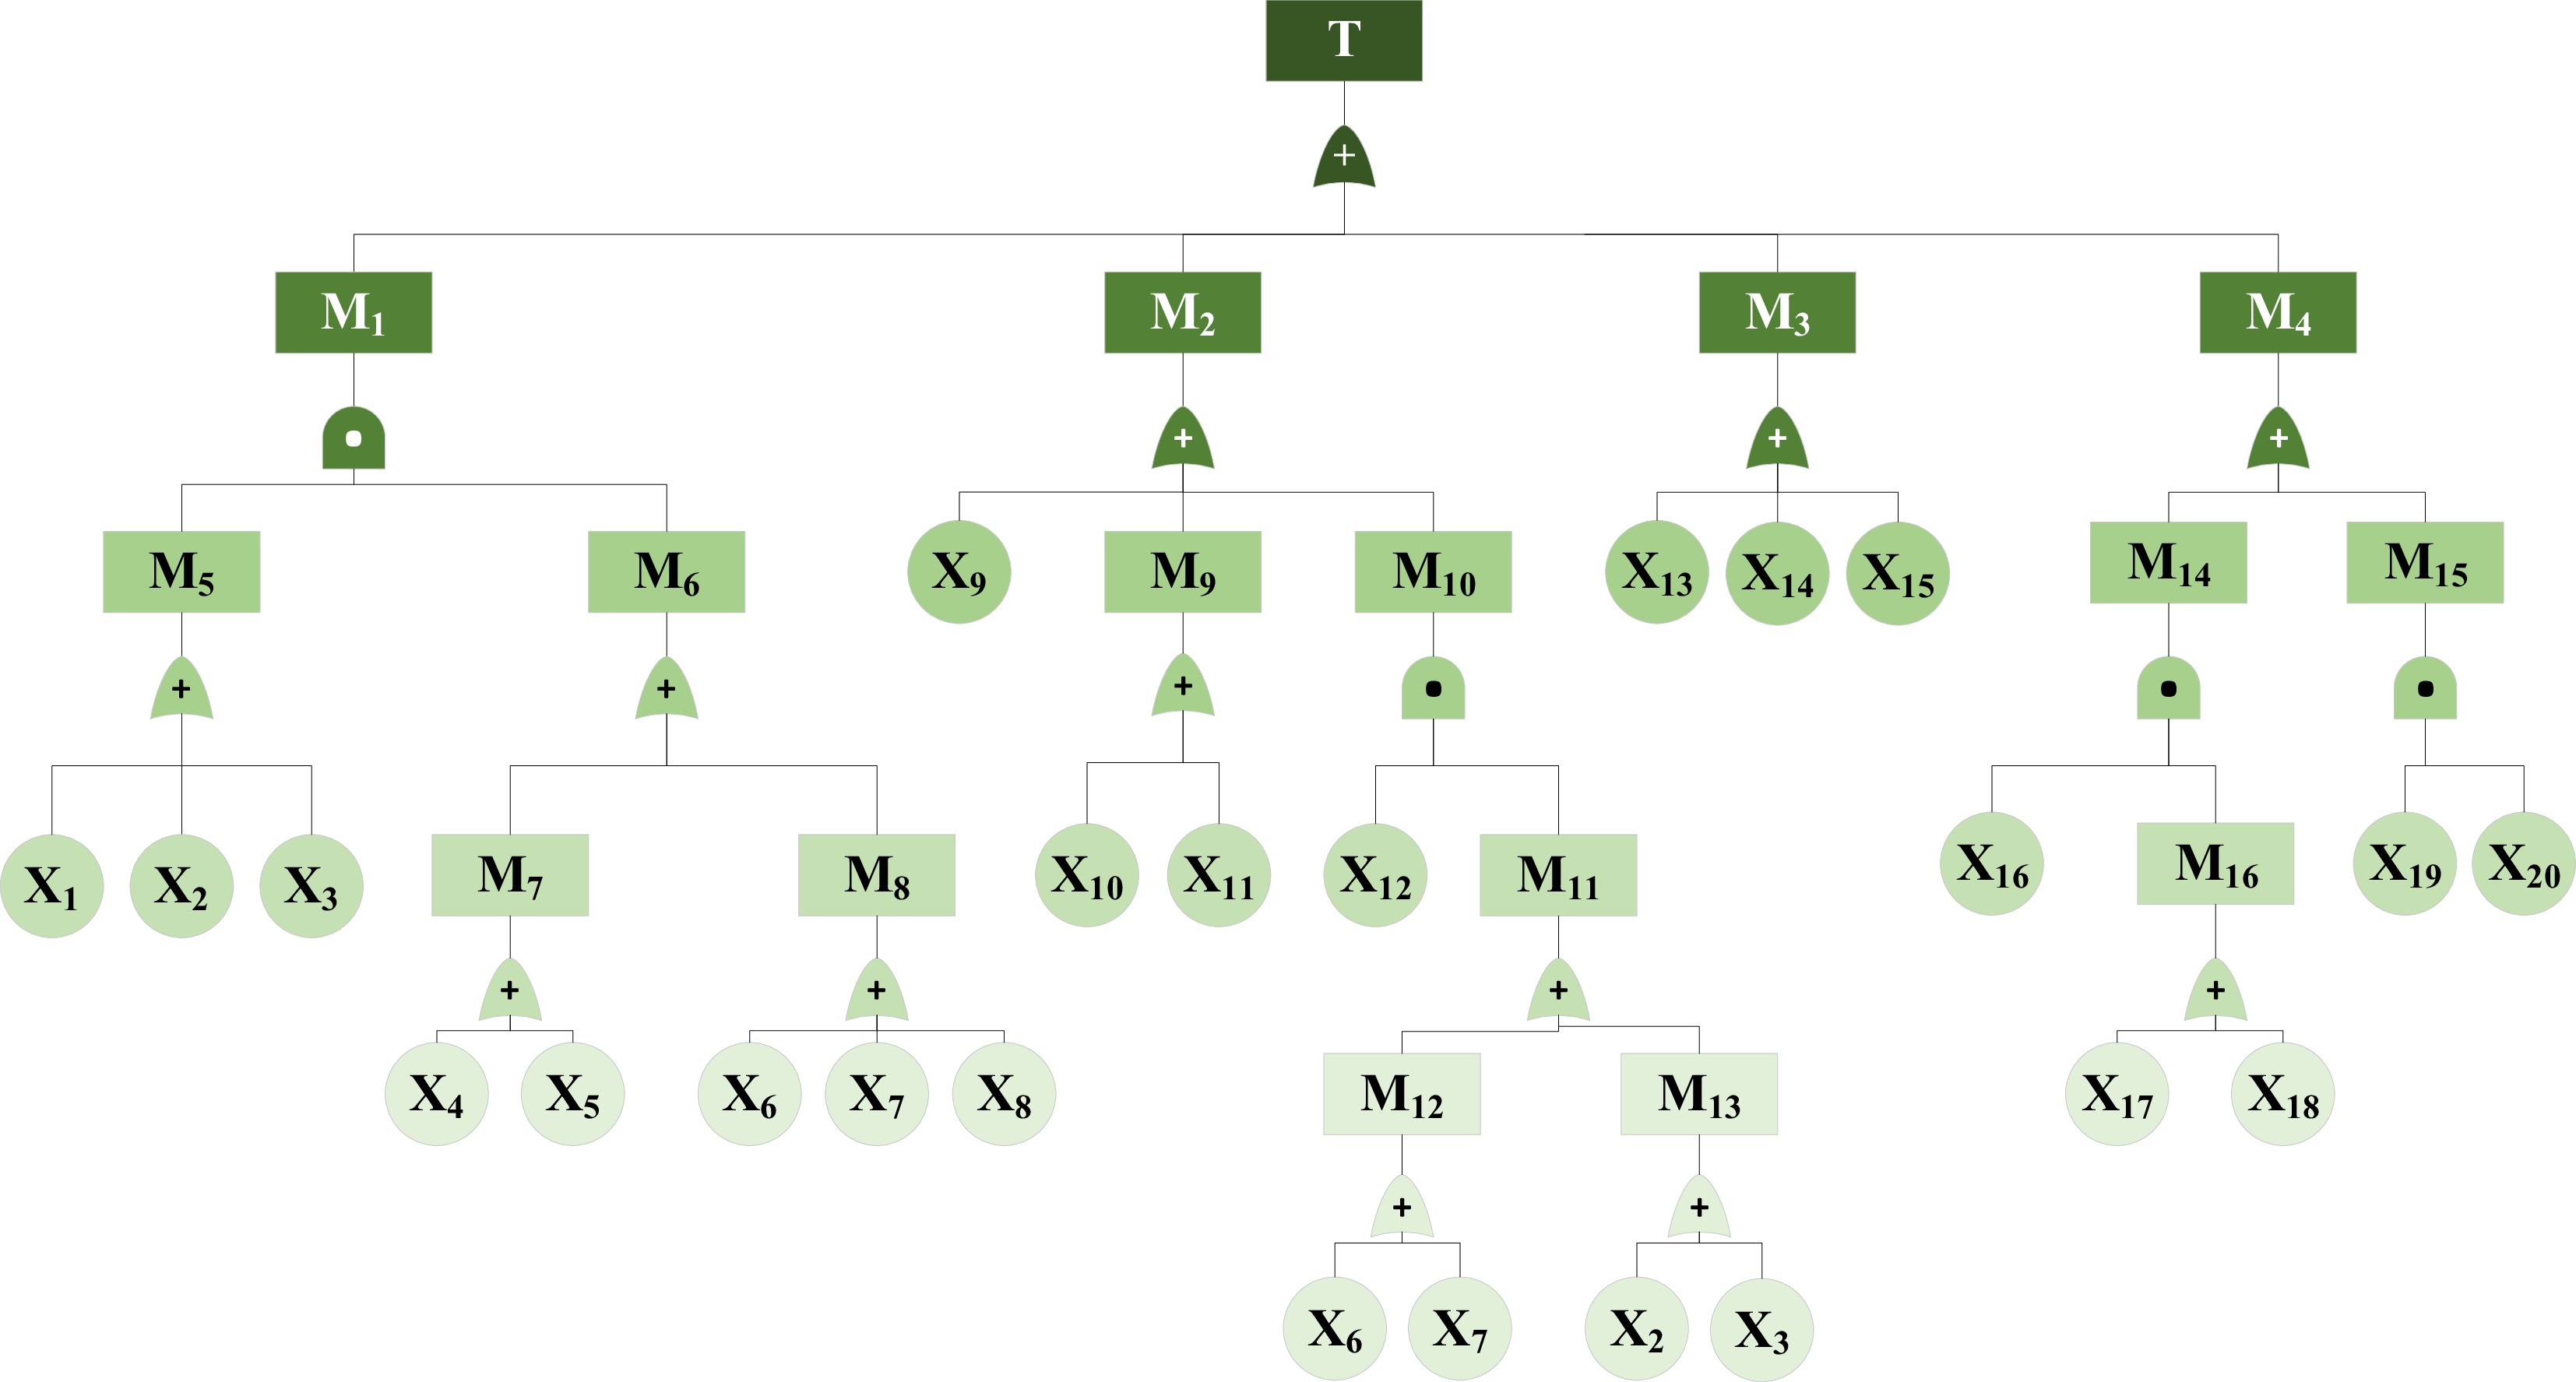
Figure 3.
The structure of the fault tree.
The basic events consist of 20 causal factors, with intermediate events categorized as follows: M1 (driver-related factors), M2 (vehicle and container-related factors), M3 (road-related factors), M4 (environmental factors), M5 (improper or illegal driving), M6 (factors interfering with judgment), M7 (human-related environmental factors), M8 (human-related road factors), M9 (vehicle malfunctions), M10 (liquid sloshing), M11 (improper vehicle posture), M12 (object-related road factors), M13 (object-related improper driving), M14 (insufficient visibility), M15 (environmental interference), M16 (insufficient time), and the top event is LNG road tanker rollover.
The intermediate events (M1–M16) were categorized based on a systematic analysis of 12 historical LNG tanker rollover accidents. The identified 20 causal factors were grouped into four major categories: human factors (M1), vehicle factors (M2), road factors (M3, and environmental factors (M4). Sub-categories such as M5 (improper or illegal driving) and M6 (factors interfering with judgment) were further refined under M1, following the HVRE system safety framework. Logical gates were determined according to the causal relationships derived from accident reports and expert judgment: OR gates were applied where any subordinate event could independently lead to the upper event, while AND gates were used only when multiple concurrent factors were necessary to cause the upper event. For instance, M16 is output from an OR gate with inputs X17 and X18. M14 is then output from an AND gate with inputs M16 and X16.
Minimal cut sets were determined, and the structural importance of basic events was analyzed employing Boolean algebra simplification. The resulting structure function is:
$ \begin{split}\rm T=\;& \rm M_{ {1}} {+M}_{ {2}} {+M}_{ {3}} {+M}_{ {4}} {=M}_{ {5}} {M}_{ {6}} {+X}_{ {9}} {+M}_{ {9}} {+M}_{ {10}} {+X}_{ {13}} {+X}_{ {14}} {+X}_{ {15}} {+M}_{ {14}} {+M}_{ {15}} \\=\;&(X_{ {1}} {+X}_{ {2}} {+X}_{ {3}} {)(M}_{ {7}} {+M}_{ {8}} {)+X}_{ {9}} {+(X}_{ {10}} {+X}_{ {11}} {)+X}_{ {12}} {M}_{ {11}} {+X}_{ {13}} {+X}_{ {14}} {+X}_{ {15}}\\&\rm +X_{ {16}} {M}_{ {16}} {+X}_{ {19}} {X}_{ {20}}\\ =\;&\rm (X_{ {1}} {+X}_{ {2}} {+X}_{ {3}} {)(X}_{ {4}} {+X}_{ {5}} {+X}_{ {6}} {+X}_{ {7}} {+X}_{ {8}} {)+X}_{ {9}} +(X_{ {10}} {+X}_{ {11}} )\\& \rm+X_{ {12}} {(X}_{ {6}} {+X}_{ {7}} {+X}_{ {2}} {+X}_{ {3}} {)+X}_{ {13}} {+X}_{ {14}} {+X}_{ {15}} {+X}_{ {16}} {(X}_{ {17}} {+X}_{ {18}}) +X_{ {19}} {X}_{ {20}}\\ =\;&\rm X_{ {9}} {+X}_{ {10}} {+X}_{ {11}} {+X}_{ {13}} {+X}_{ {14}} {+X}_{ {15}} {+X}_{ {1}} {X}_{ {4}} {+X}_{ {1}} {X}_{ {5}} {+X}_{ {1}} {X}_{ {6}}\\& \rm +X_{ {1}} {X}_{ {7}} {+X}_{ {1}} {X}_{ {8}} {+X}_{ {2}} {X}_{ {4}} {+X}_{ {2}} {X}_{ {5}} +X_{ {2}} {X}_{ {6}} {+X}_{ {2}} {X}_{ {7}} {+X}_{ {2}} {X}_{ {8}} {+X}_{ {3}} {X}_{ {4}}\\& \rm +X_{ {3}} {X}_{ {5}} {+X}_{ {3}} {X}_{ {6}} {+X}_{ {3}} {X}_{ {7}} +X_{ {3}} {X}_{ {8}} {+X}_{ {6}} {X}_{ {12}} {+X}_{ {7}} {X}_{ {12}} {+X}_{ {2}} {X}_{ {12}} {+X}_{ {3}} {X}_{ {12}} \\& \rm +X_{ {16}} {X}_{ {17}} {+X}_{ {16}} {X}_{ {18}} {+X}_{ {19}} {X}_{ {20}}\end{split} $ Analysis identified 28 minimal cut sets:
$\begin{split}&\rm K_1=\{X_9\};K_2=\{K_{10}\};K_3=\{K_{11}\};K_4=\{K_{13}\};K_5=\{K_{14}\};K_6=\{K_{15}\};\\& \rm K_7=\{K_{X_1},{X_4}\};K_8=\{K_{X_1},{X_5}\};K_9=\{K_{X_1},{X_6}\};K_{10}=\{K_{X_1},{X_7}\};\\&\rm K_{11}=\{K_{X_1},{X_8}\};K_{12}=\{K_{X_2},{X_4}\};K_{13}=\{K_{X_2},{X_5}\};K_{14}=\{K_{X_2},{X_6}\};\\&\rm K_{15}=\{K_{X_2},{X_6}\};K_{16}=\{K_{X_2},{X_7}\};K_{17}=\{K_{X_2},{X_8}\};K_{18}=\{K_{X_3},{X_6}\};\\&\rm K_{19}=\{K_{X_3},{X_7}\};K_{20}=\{K_{X_3},{X_8}\};K_{21}=\{K_{X_6},{X_{12}}\};K_{22}=\{K_{X_7},{X_{12}}\};\\&\rm K_{23}=\{K_{X_8},{X_{12}}\};K_{24}=\{K_{X_2},{X_{12}}\};K_{25}=\{K_{X_3},{X_{12}}\};K_{26}=\{K_{X_{16}},{X_{17}}\};\\&\rm K_{27}=\{K_{X_{16}},{X_{18}}\};K_{28}=\{K_{X_{19}},{X_{20}}\}\end{split}$ The fault tree comprises 21 second-order and seven first-order cut sets. The structural importance ranking of basic events X1−X20 derived from minimal cut sets is:
$\begin{split}\rm I(X_{ 15} )=\;&\rm I(X_{ 14} =I(X_{ 13} )=I(X_{ 11} )=I(X_{ 10} )=I(X_{9} ) \gt I(X_{3} )=I(X_{2} )\\& \rm \gt I(X_{1}) \gt I(X_{16} )=I(X_{12} ) \gt I(X_{20} )=I(X_{19} ) \gt I(X_{7} )=I(X_{6} )\\&\rm \gt I(X_{18} )=I(X_{17}) \gt I(X_{8} )=I(X_{5} )=I(X_{4} )\end{split} $ Through structural importance ranking, it can be seen that the three basic events related to road factors are ranked first, followed by the three basic events related to vehicle and tank container factors, and then the three basic events related to driving behavior.
Structure of the Bayesian network
-
Utilizing the constructed LNG road transport tanker rollover fault tree model and the transformation method in Fig. 2, the Bayesian network for LNG tanker rollovers was developed employing GeNIe, as presented in Fig. 4. The prior probabilities for the 20 root nodes correspond to the defuzzified values in Table 5. Unlike the determination of probability distributions for root nodes, non-root nodes require the specification of conditional probabilities. Using intermediate nodes M15 and M9 as representative examples of 'AND' and 'OR' logic, respectively, Tables 6 and 7 show examples of conditional probability representations in the Bayesian network based on fault tree logic gates, defining 'occurrence' as 'yes' and 'non-occurrence' as 'no'.
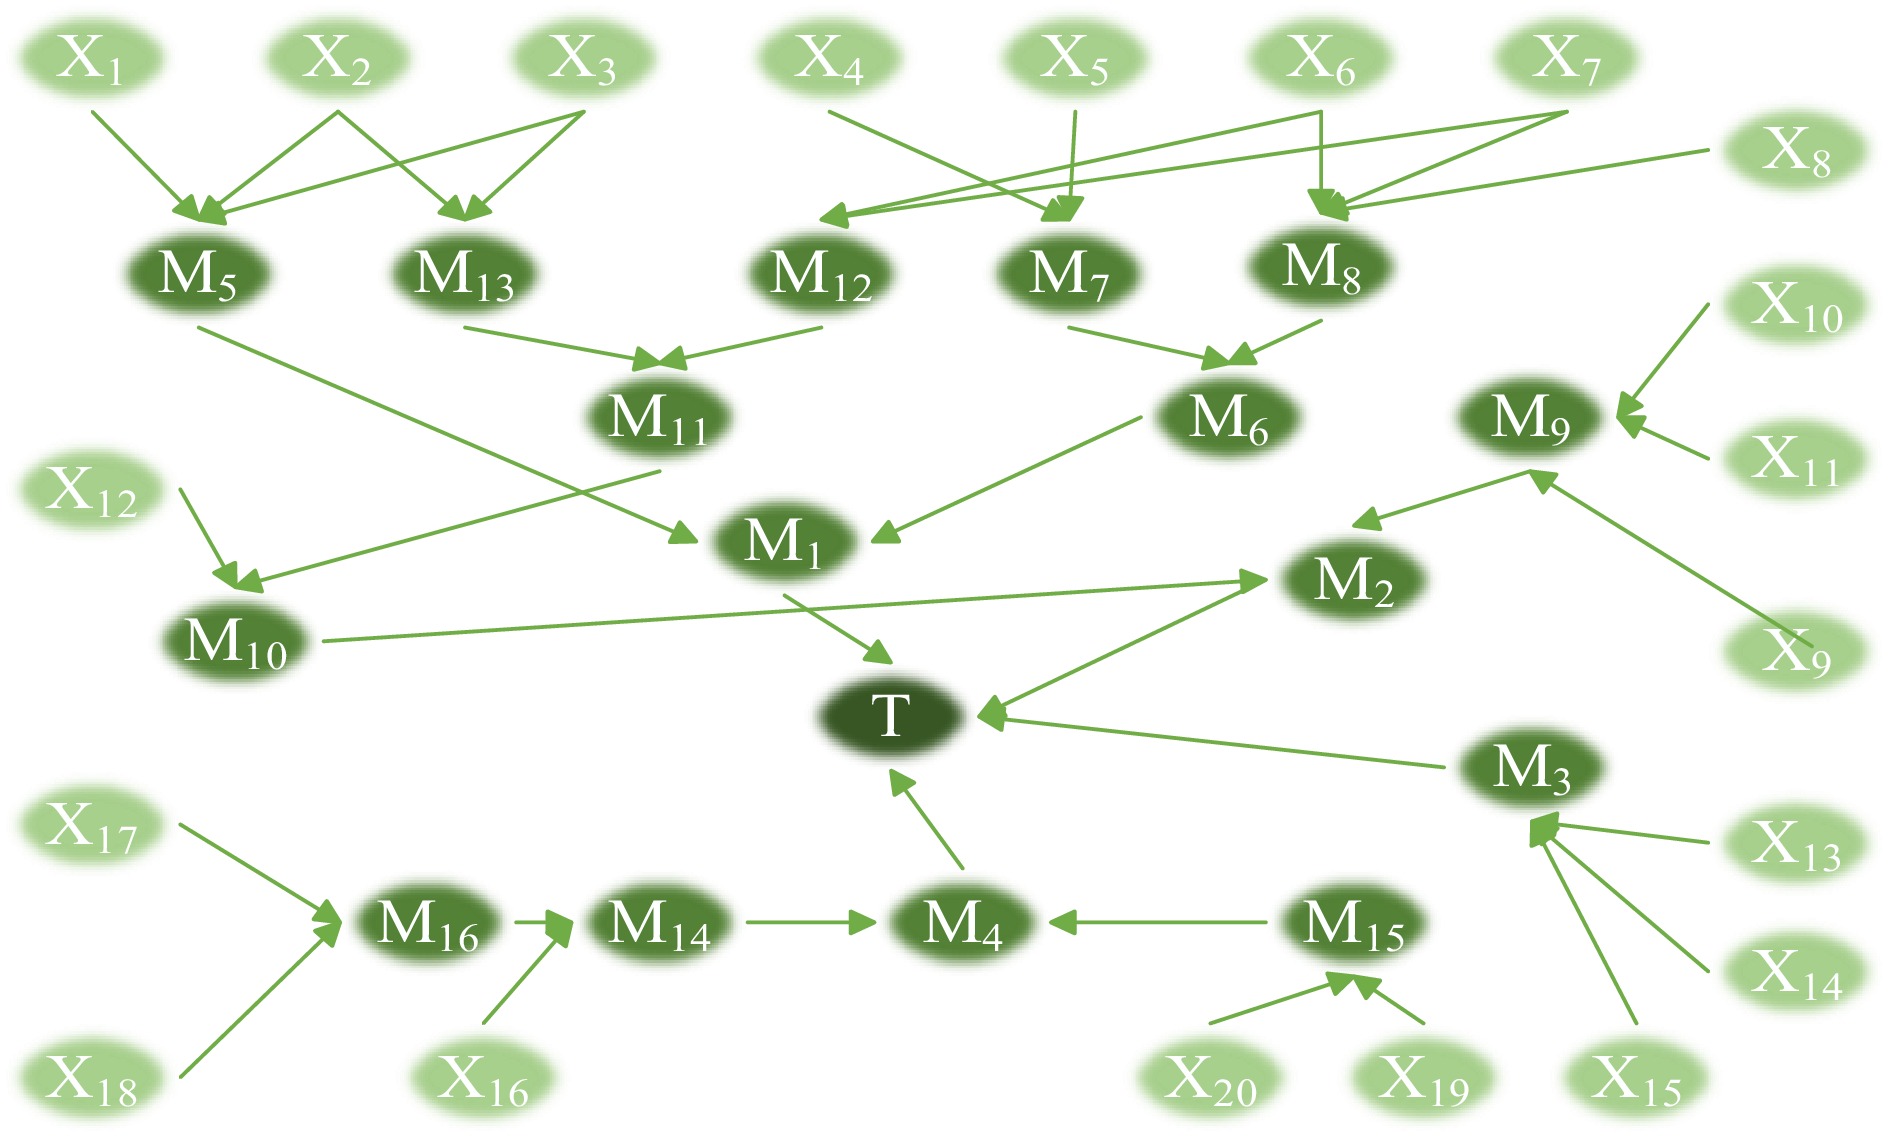
Figure 4.
The structure of the Bayesian network.
Table 6. The CPT of the node M15.
X19 X20 P(M15 = yes|X19,X20) P(M15 = no|X19,X20) No No 0 1 No Yes 0 1 yes No 0 1 Yes Yes 1 0 Table 7. The CPT of the node M9.
X10 X11 P(M9 = yes|X10,X11) P(M9 = no|X10,X11) No No 0 1 No Yes 1 0 Yes No 1 0 Yes Yes 1 0 Bayesian networks feature bidirectional inference capabilities comprising:
(1) Predictive inference: Propagating probabilities from root nodes along directed edges to compute prior probabilities of target nodes
${B_i}$ $ P(U) = \prod\limits_{i = 1}^n {P({B_i}\left| {Pa({B_i}))} \right.} $ (8) $ P({B_i}) = \sum\limits_{U\backslash {B_i}} {P(U)} $ (9) where,
$P(U)$ $U = \left\{ {{B_1},{B_2}, \cdots {B_n}} \right\}$ $Pa({B_i})$ ${B_i}$ $P({B_i})$ ${B_i}$ 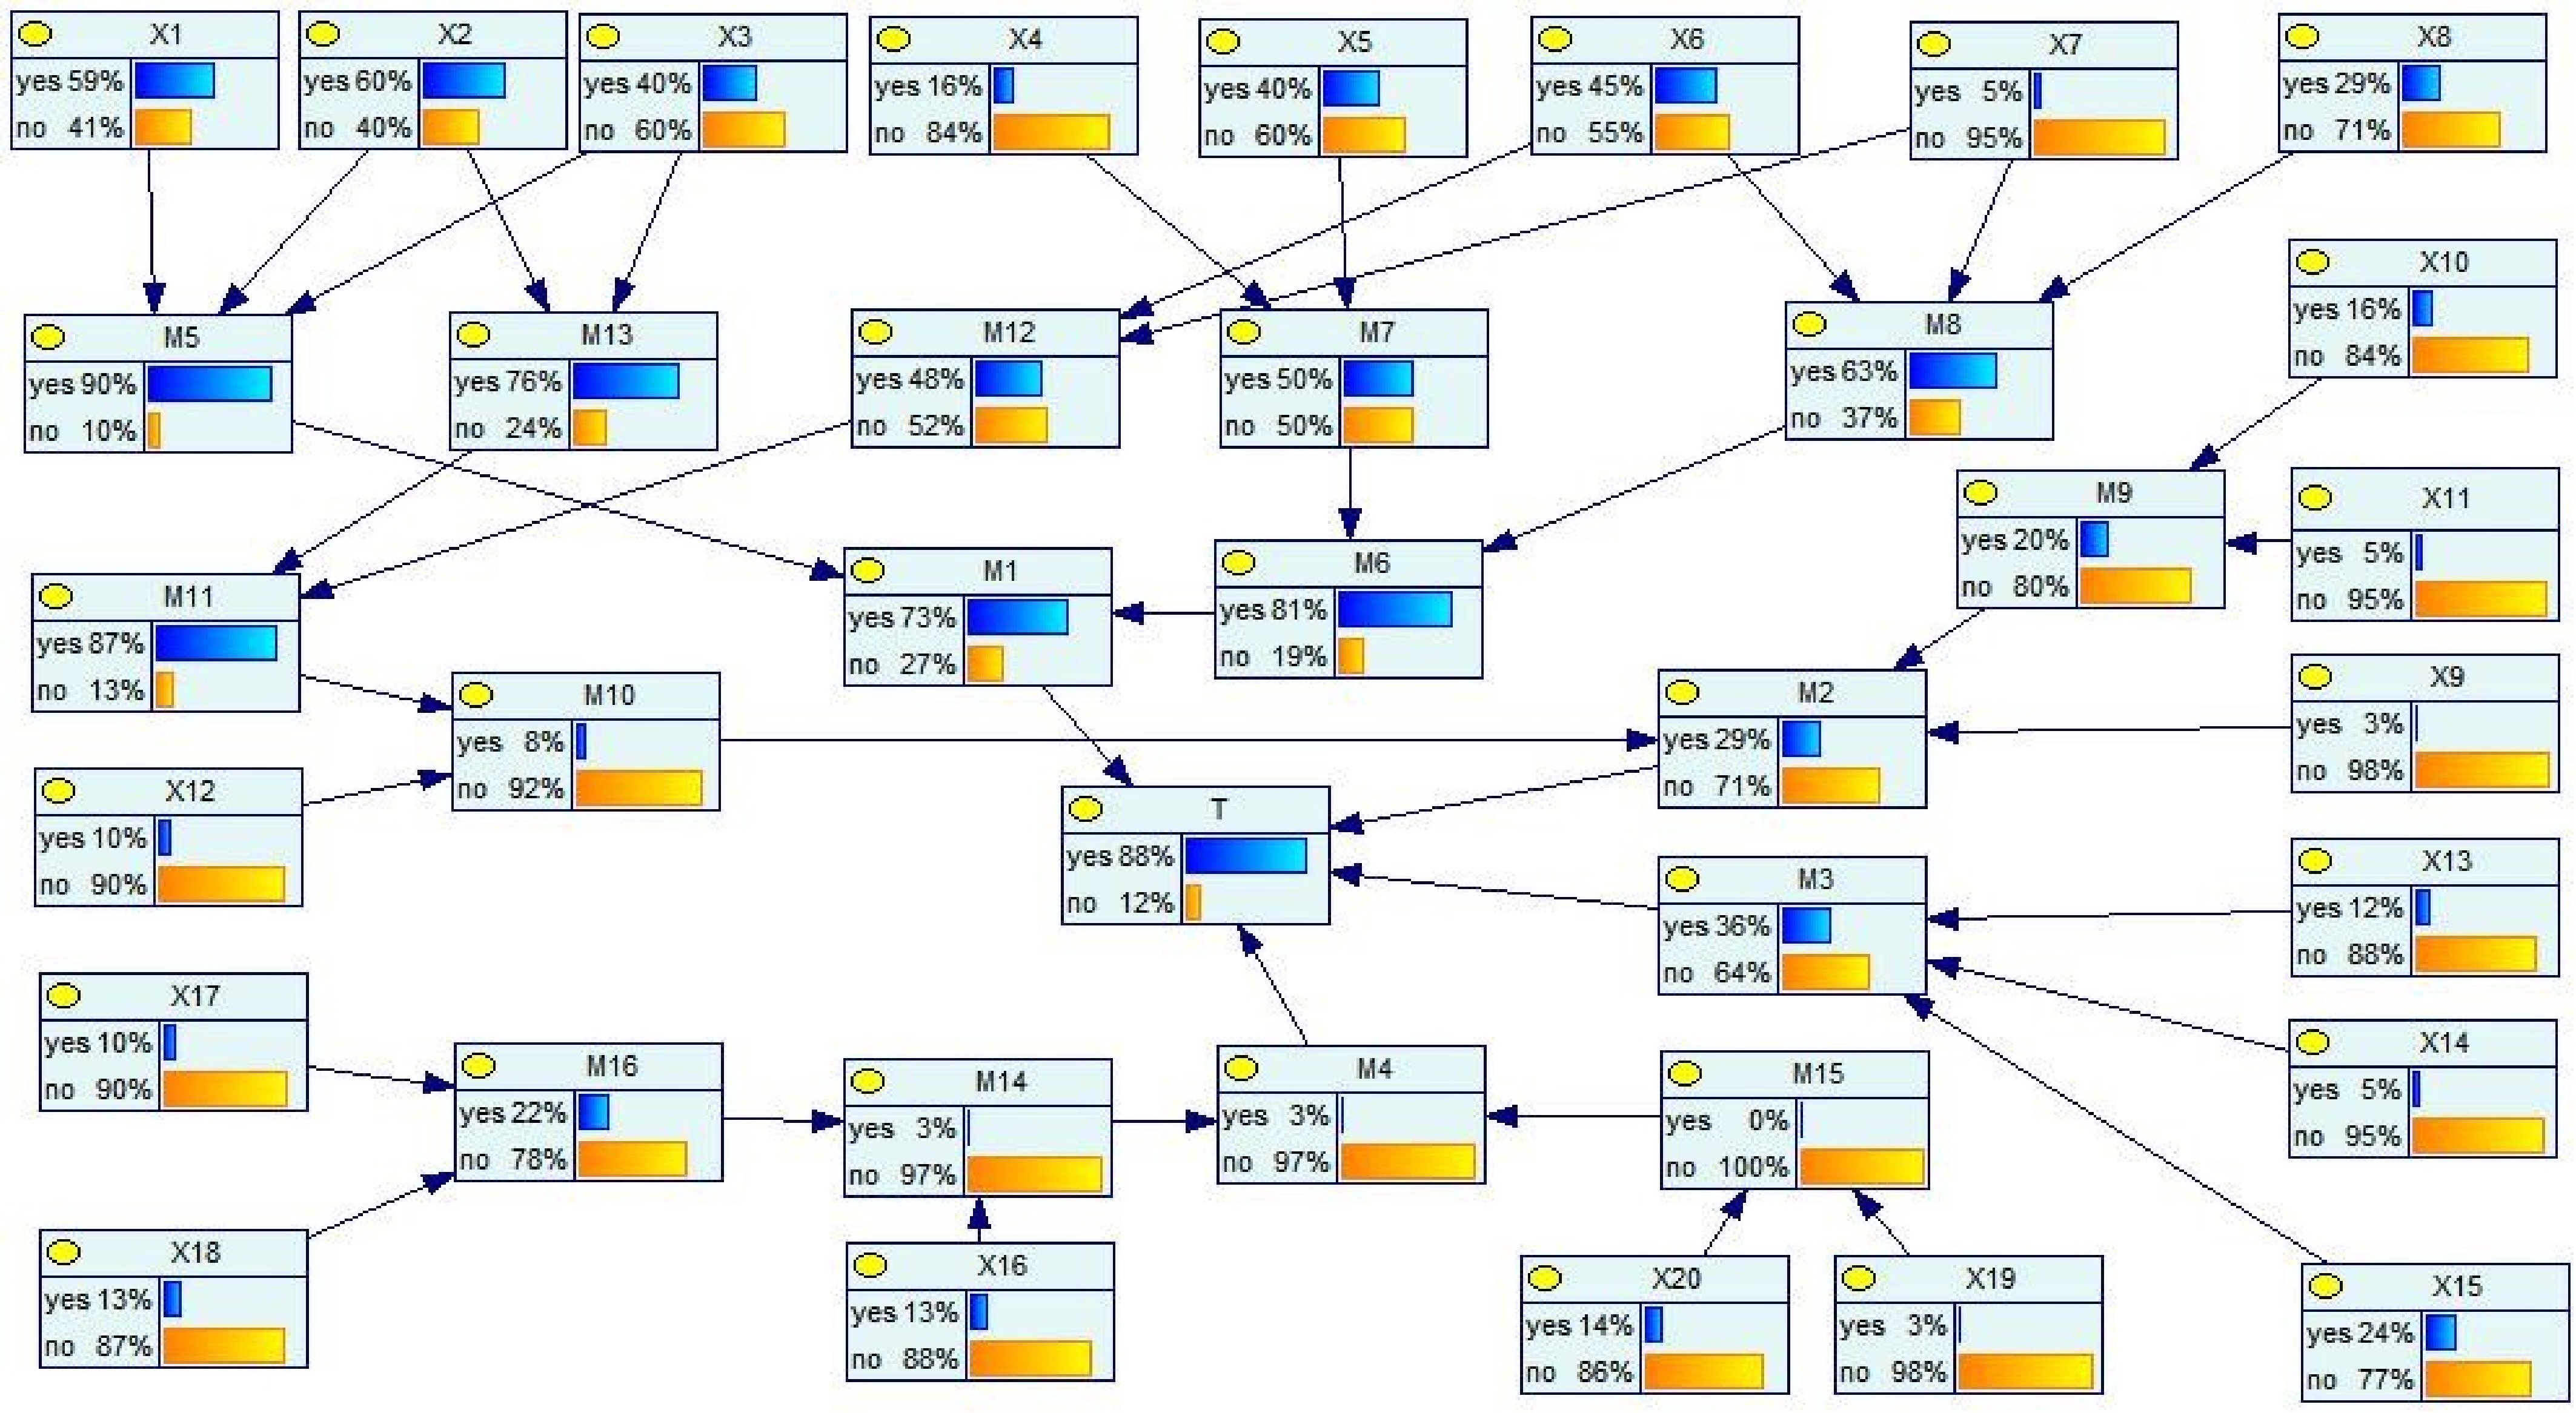
Figure 5.
Predictive inference of the BN.
(2) Diagnostic inference: Incorporating evidence through Bayes' theorem (Eq. 10) updates prior to posterior probabilities. Unlike priors, posteriors dynamically reflect real-time system states, enabling continuous risk assessment.
$ P(U{\text{|}}E) = \dfrac{{P(U,E)}}{{P(E)}} = \dfrac{{P(U,E)}}{{\sum\nolimits_U {P(U,E)} }} $ (10) where,
$P(U|E)$ $U$ $E$ $P(U,E)$ $E$ $U$ $P(E)$ $E$ Within GeNIe, diagnostic inference was performed by setting the leaf node 'LNG road tanker rollover' as an evidence variable with 100% probability (occurred). Inputting evidence E yielded posterior probabilities for all root nodes, as depicted in Fig. 6.
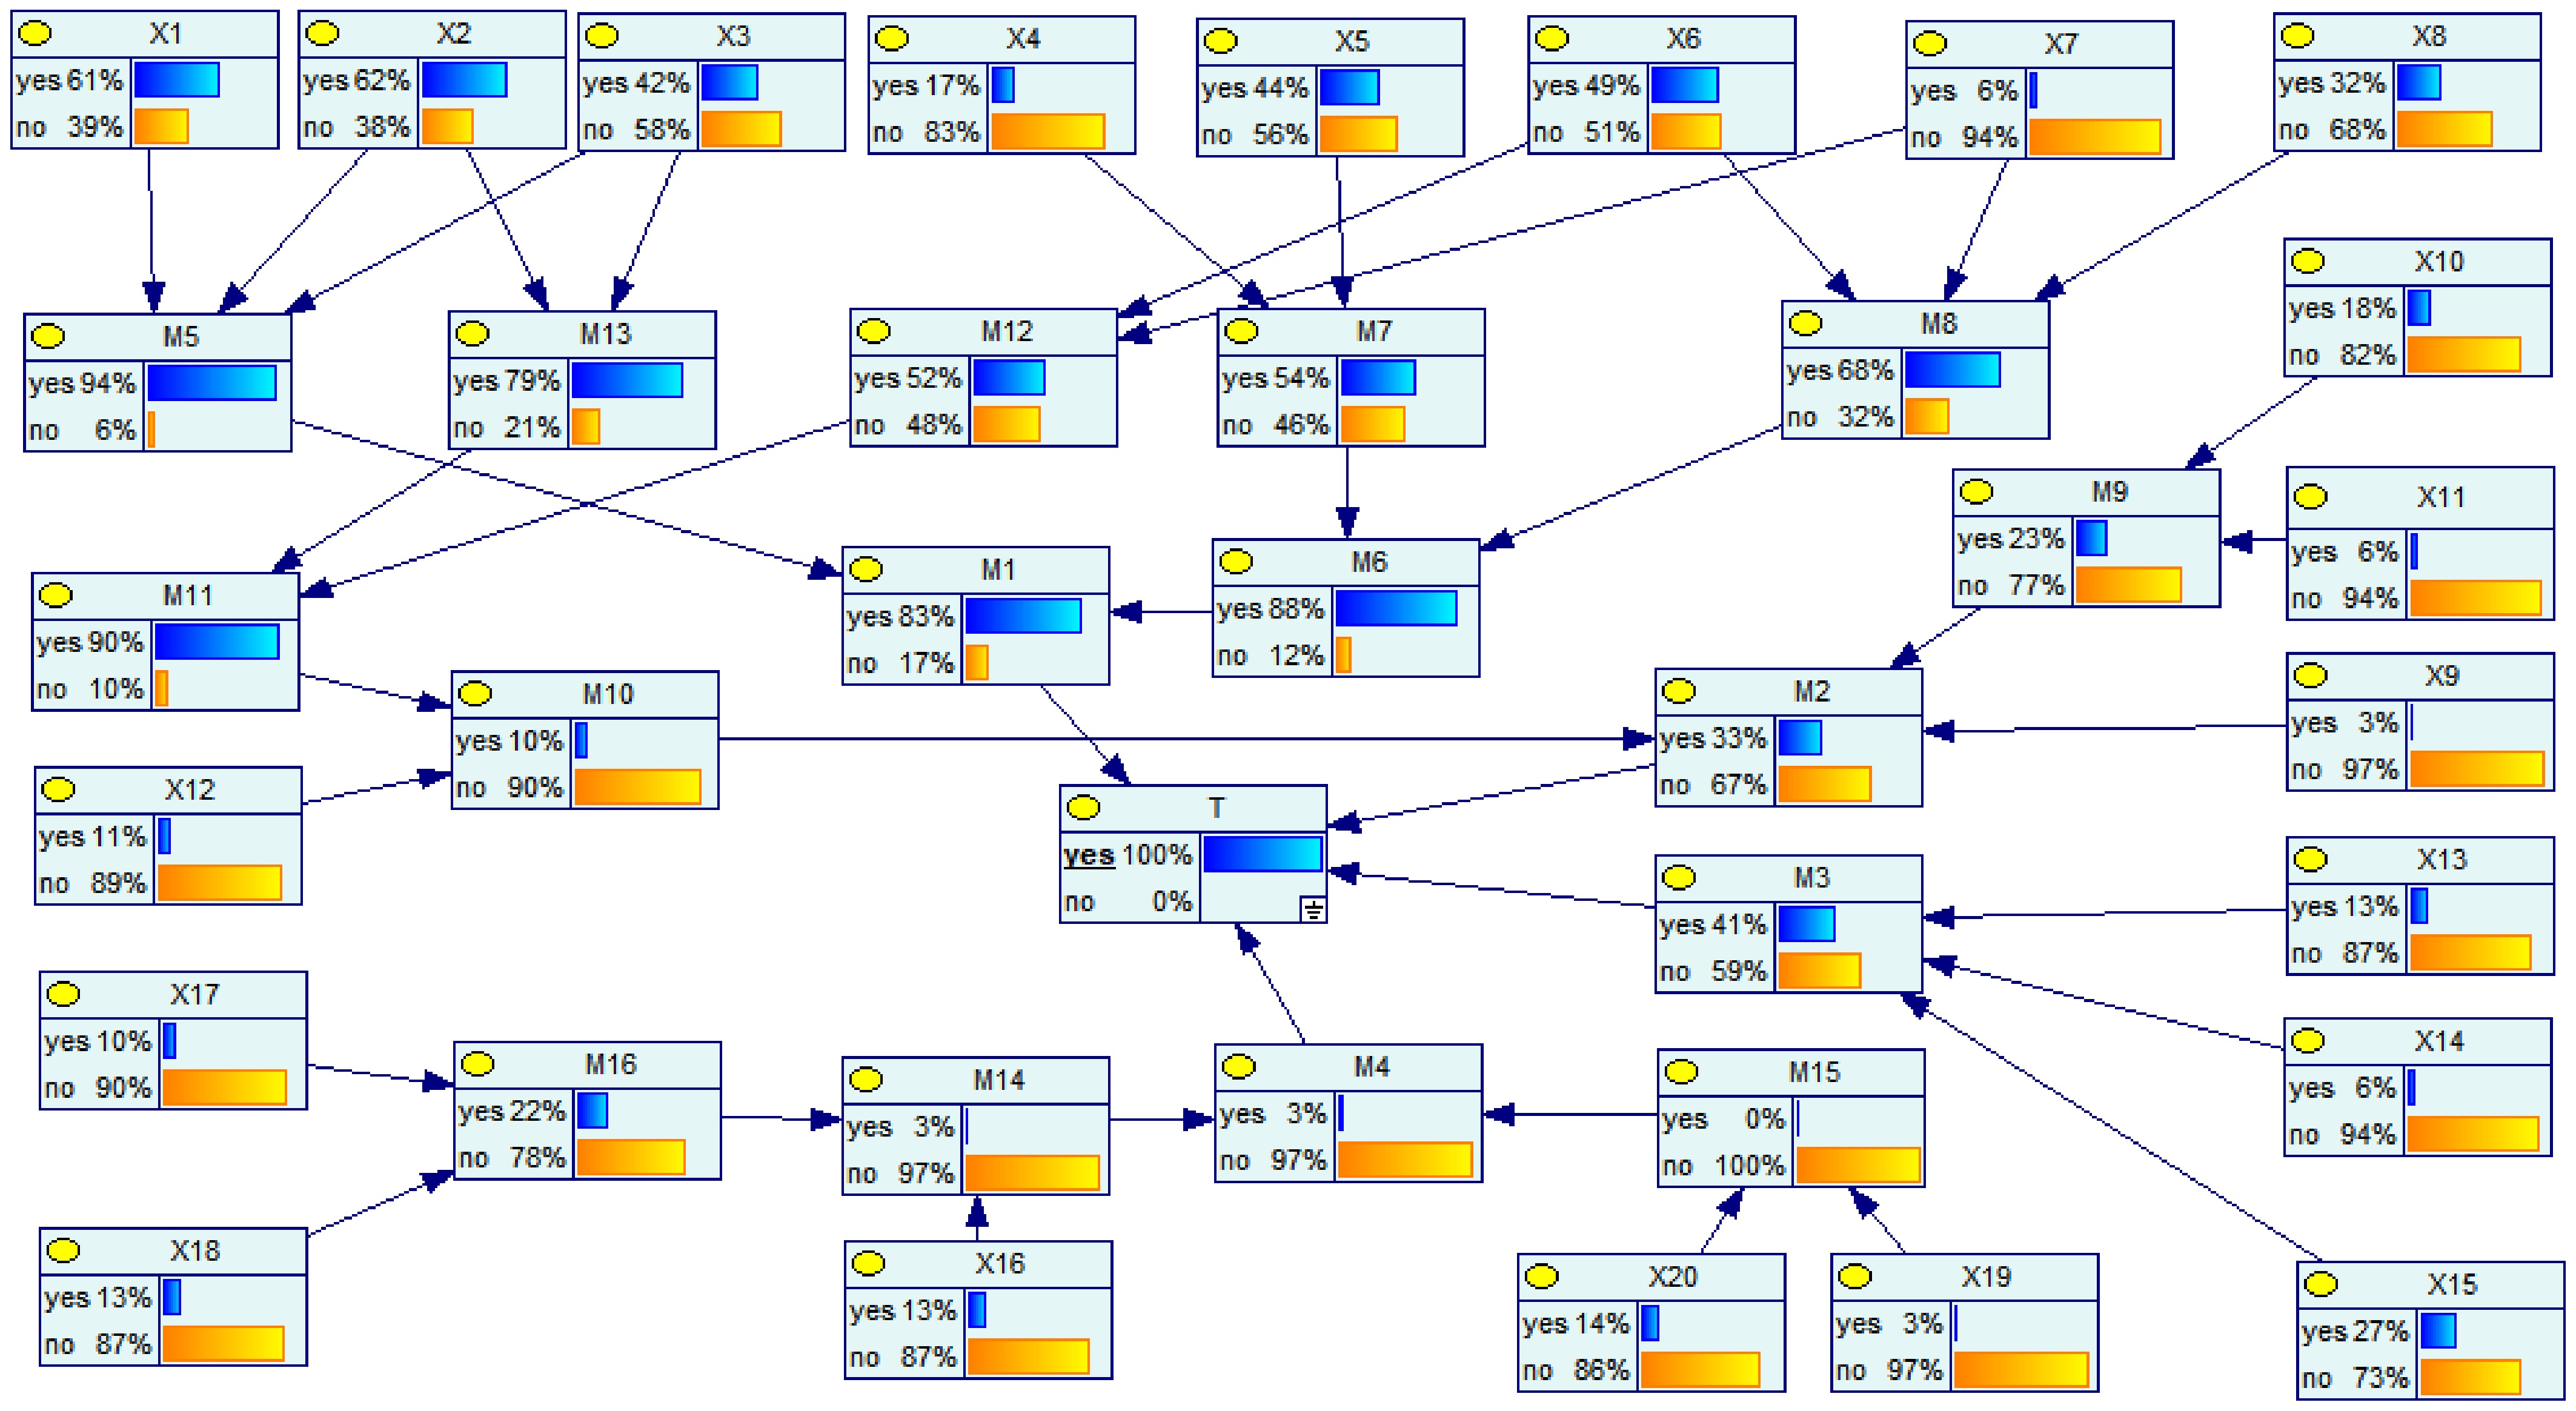
Figure 6.
Diagnostic inference of the BN with 100% probability of the leaf node.
To quantitatively characterize posterior probability deviations relative to prior probabilities during diagnostic analysis, this study employs the ROV[27]. ROV measures the magnitude of posterior probability variation at root nodes compared to their priors, where higher values indicate a greater contribution to the leaf node. The metric is calculated as follows:
$ {I}_{RO}({X}_{i})=\dfrac{P({X}_{i}=yes\text{|}T=\text{yes})-P({X}_{i}=yes)}{P({X}_{i}=yes)} $ (11) where,
${I_{RO}}({X_i})$ ${X_i}$ $P({X_i} = yes)$ ${X_i}$ $ P({X}_{i}=yes\text{|}T\text{=yes}) $ ${X_i}$ $T$ The ROV ranking for the 20 root nodes is shown in Fig. 7. The ROV ranking demonstrates that the top five positions comprise events within 'road-related factors' and 'vehicle and container-related factors', with sudden failure of brakes or steering ranked first, which implies that maintaining a safe speed while driving is crucial.
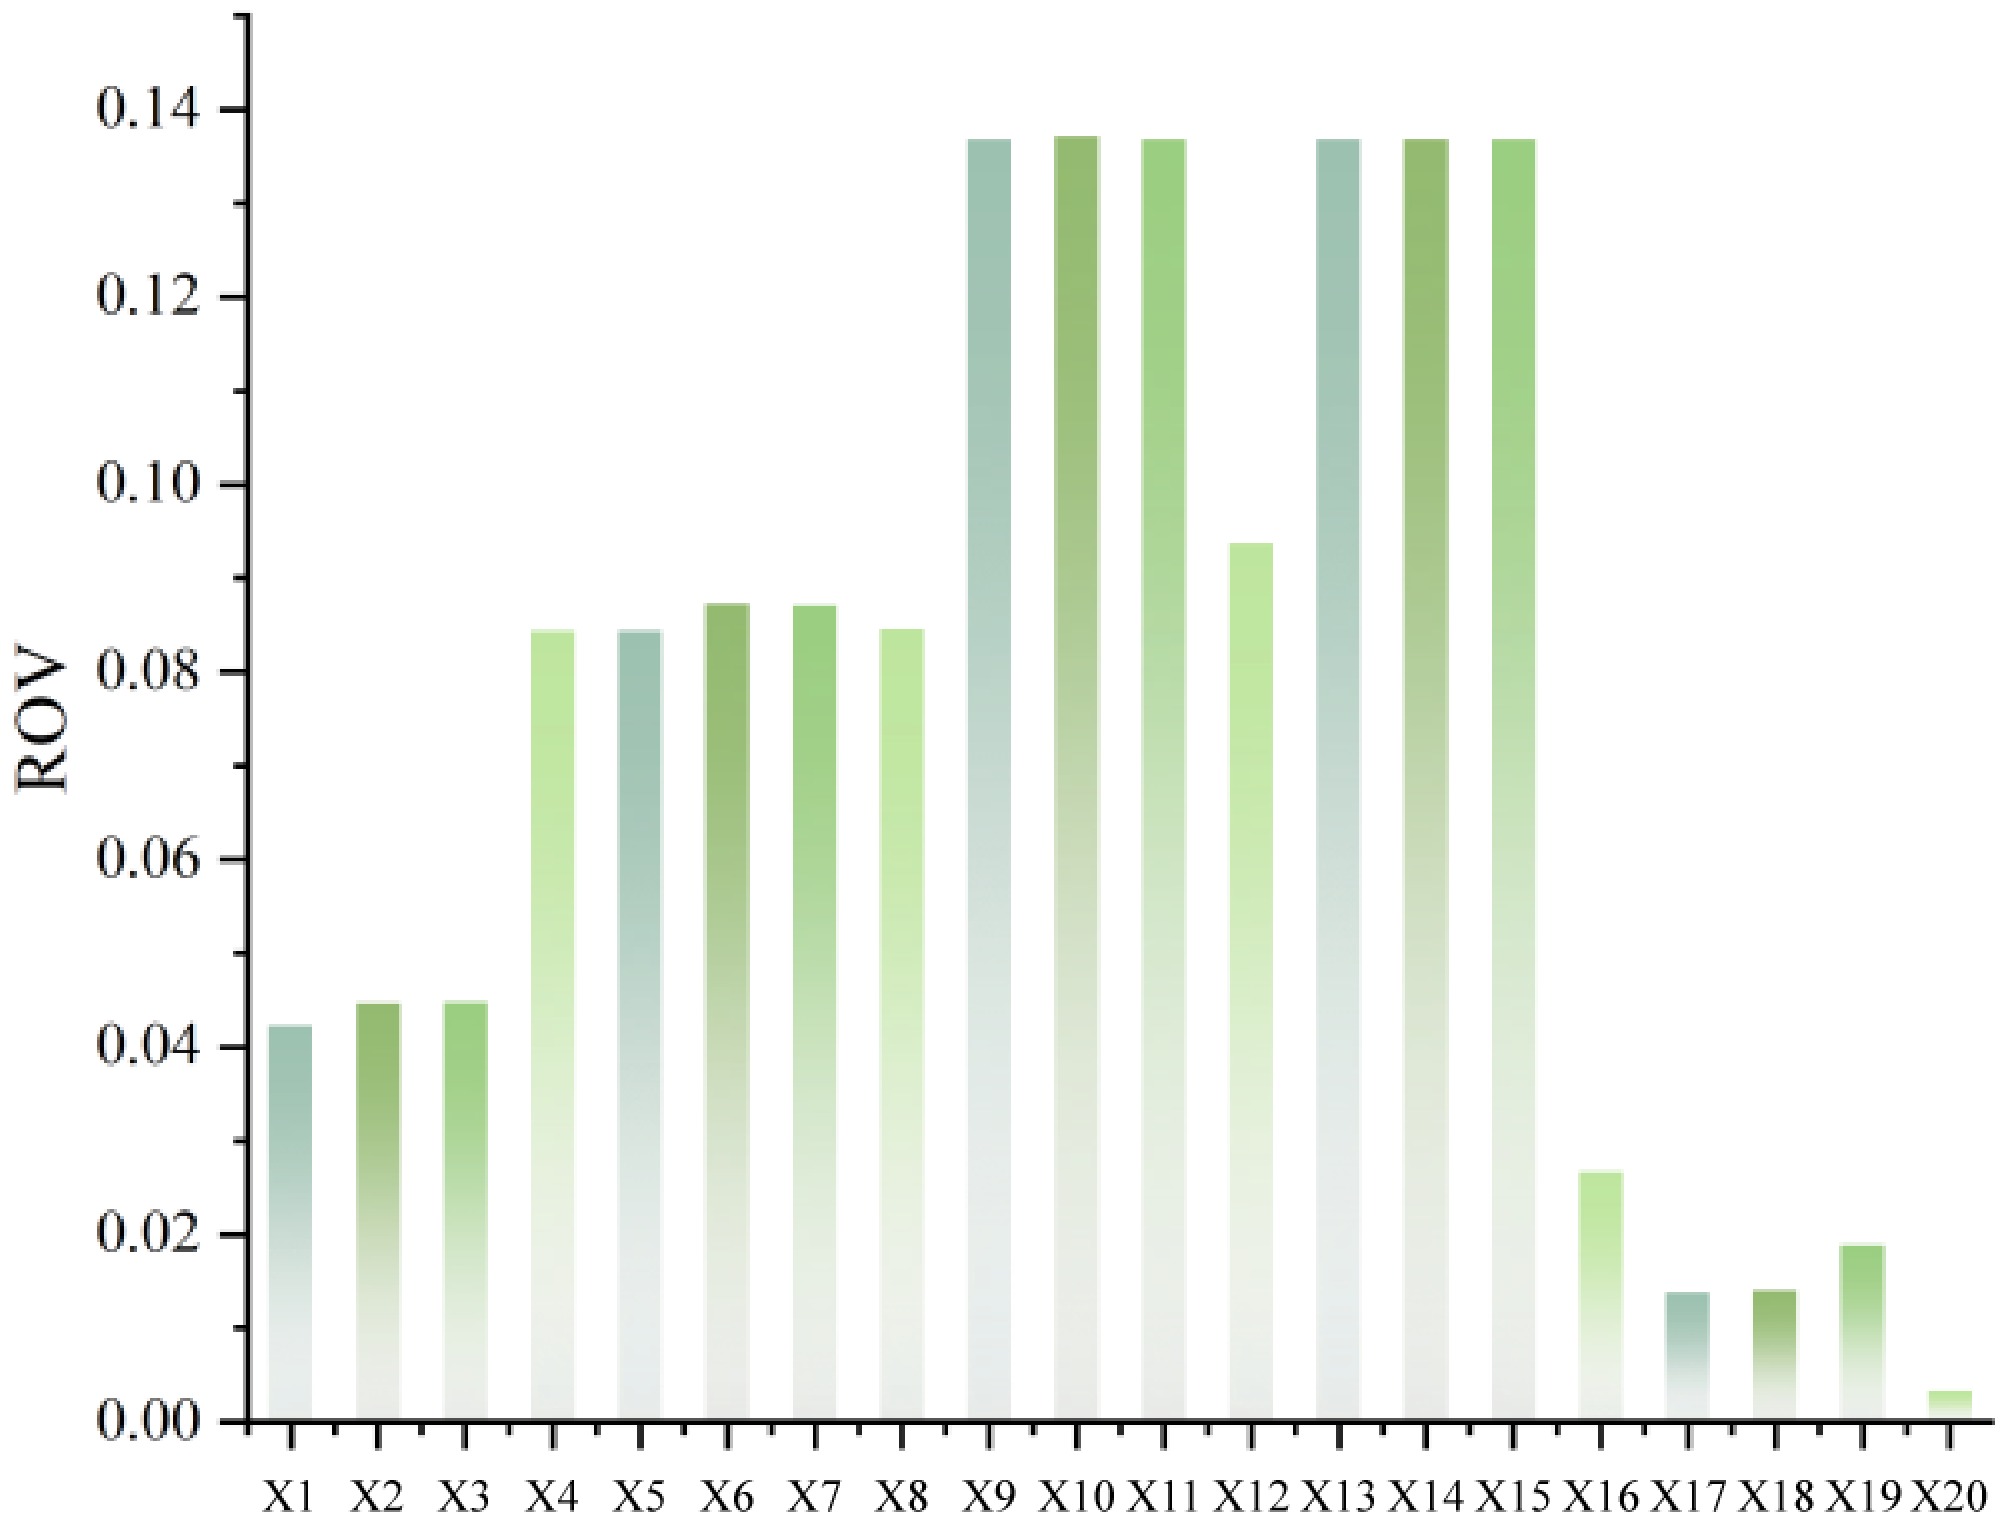
Figure 7.
The ROV ranking for the 20 root nodes.
To further validate critical risk factors identified through ROV, this study employs the Birnbaum importance measure (BIM) and risk reduction worth (RRW)[27] as commonly used indicators in importance analysis. These can be used to quantify the contribution and influence of root nodes on leaf nodes, thereby determining the risk factors that need to be prioritized for prevention and control.
BIM, alternatively termed reliability importance, is calculated as the difference in leaf node occurrence probability when the root node Xi is set to 'yes' vs 'no' states. Higher BIM values indicate a greater contribution of Xi to the leaf node. The BIM formula is:
$ {I_B}({X_i}) = P(T = yes|{X_i} = yes) - P(T = yes|{X_i} = no) $ (12) where,
${I_B}({X_i})$ ${X_i}$ $P(T = yes|{X_i} = yes)$ $T$ ${X_i}$ $P(T = yes|{X_i} = no)$ $T$ ${X_i}$ The BIM ranking for the 20 root nodes, computed via this formula, is shown in Fig. 8. The BIM ranking reveals that the top ten positions remain dominated by basic events within 'road-related factors' and 'vehicle and container-related factors'. Driver-related factors occupy four rankings: poor road alignment (3rd), unfavorable driving time (7th), slippery road surface (9th), and unsafe driving (10th).
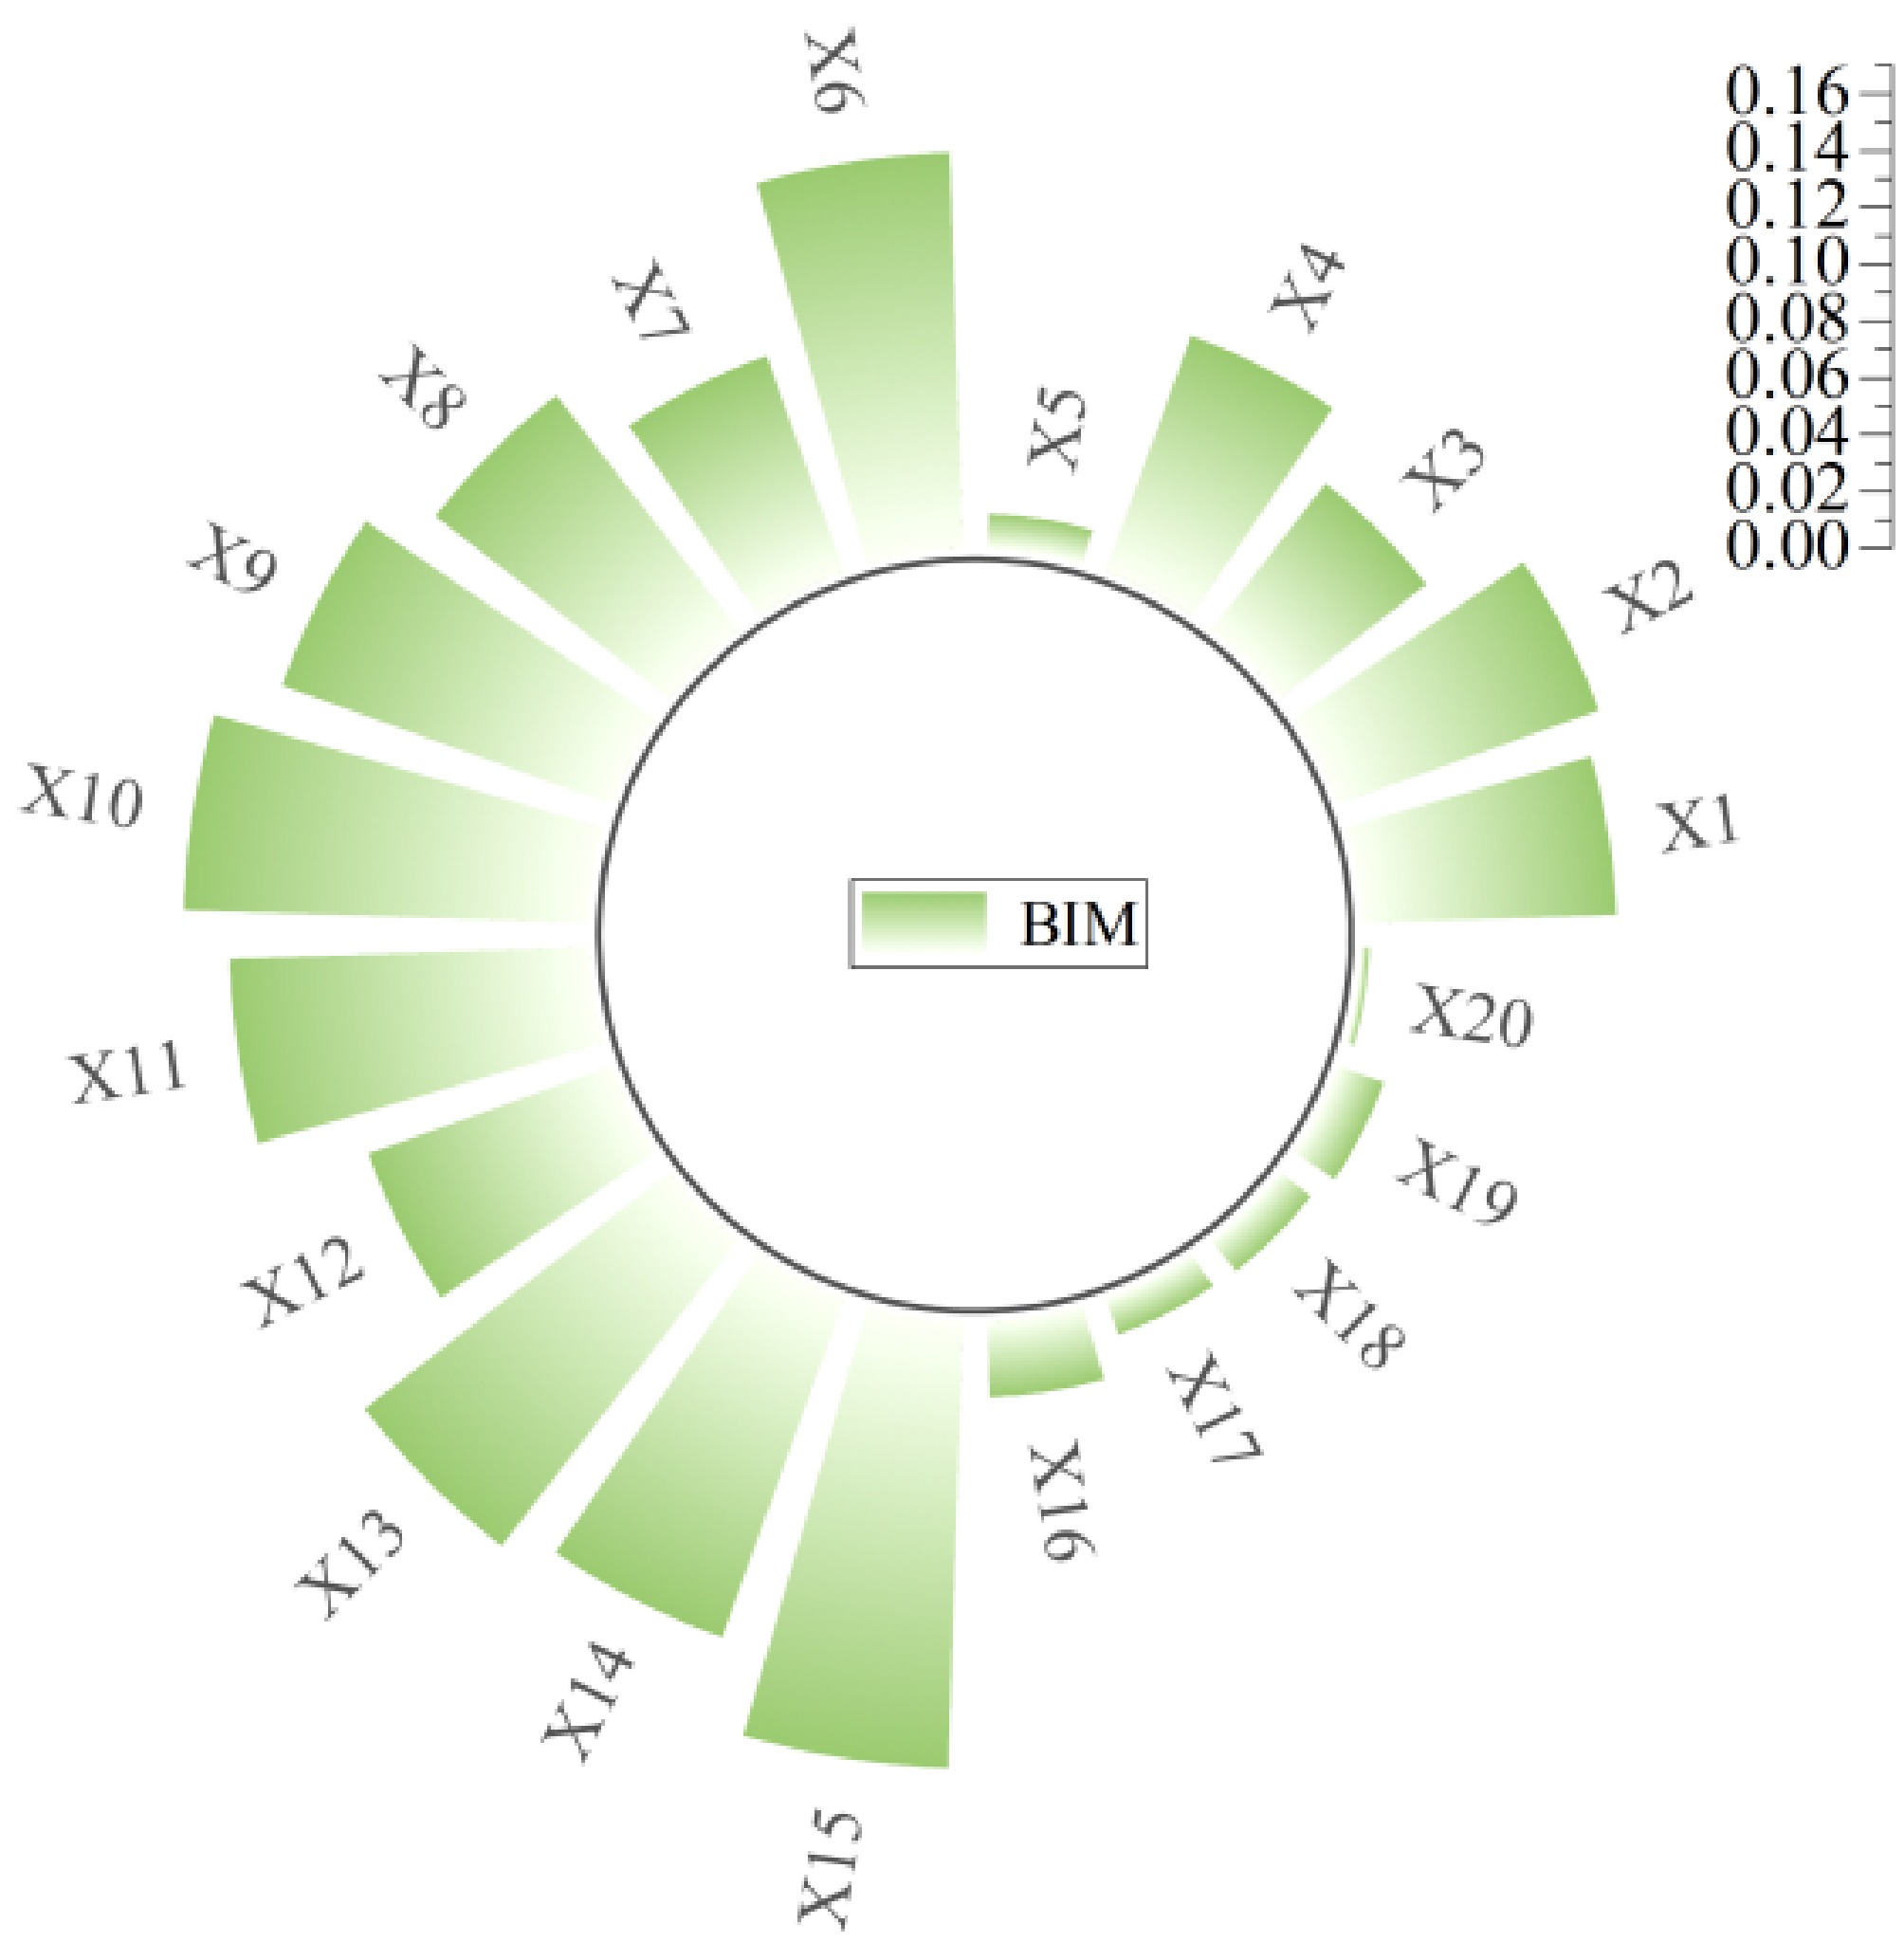
Figure 8.
The BIM ranking for the 20 root nodes.
RRW quantifies the reduction in leaf node occurrence probability when root node Xi is in the 'no' state. Higher values denote a greater contribution of Xi to leaf node T. The formal calculation is:
$ {I_{RR}}({X_i}) = P(T) - P(T = yes|{X_i} = no) $ (13) The RRW ranking for the 20 root nodes is shown in Fig. 9. The RRW prioritization reveals driver-related and road-related basic events dominate the top ten positions, with sudden failure of brakes or steering—vehicle and container-related factor—appearing in eighth place.
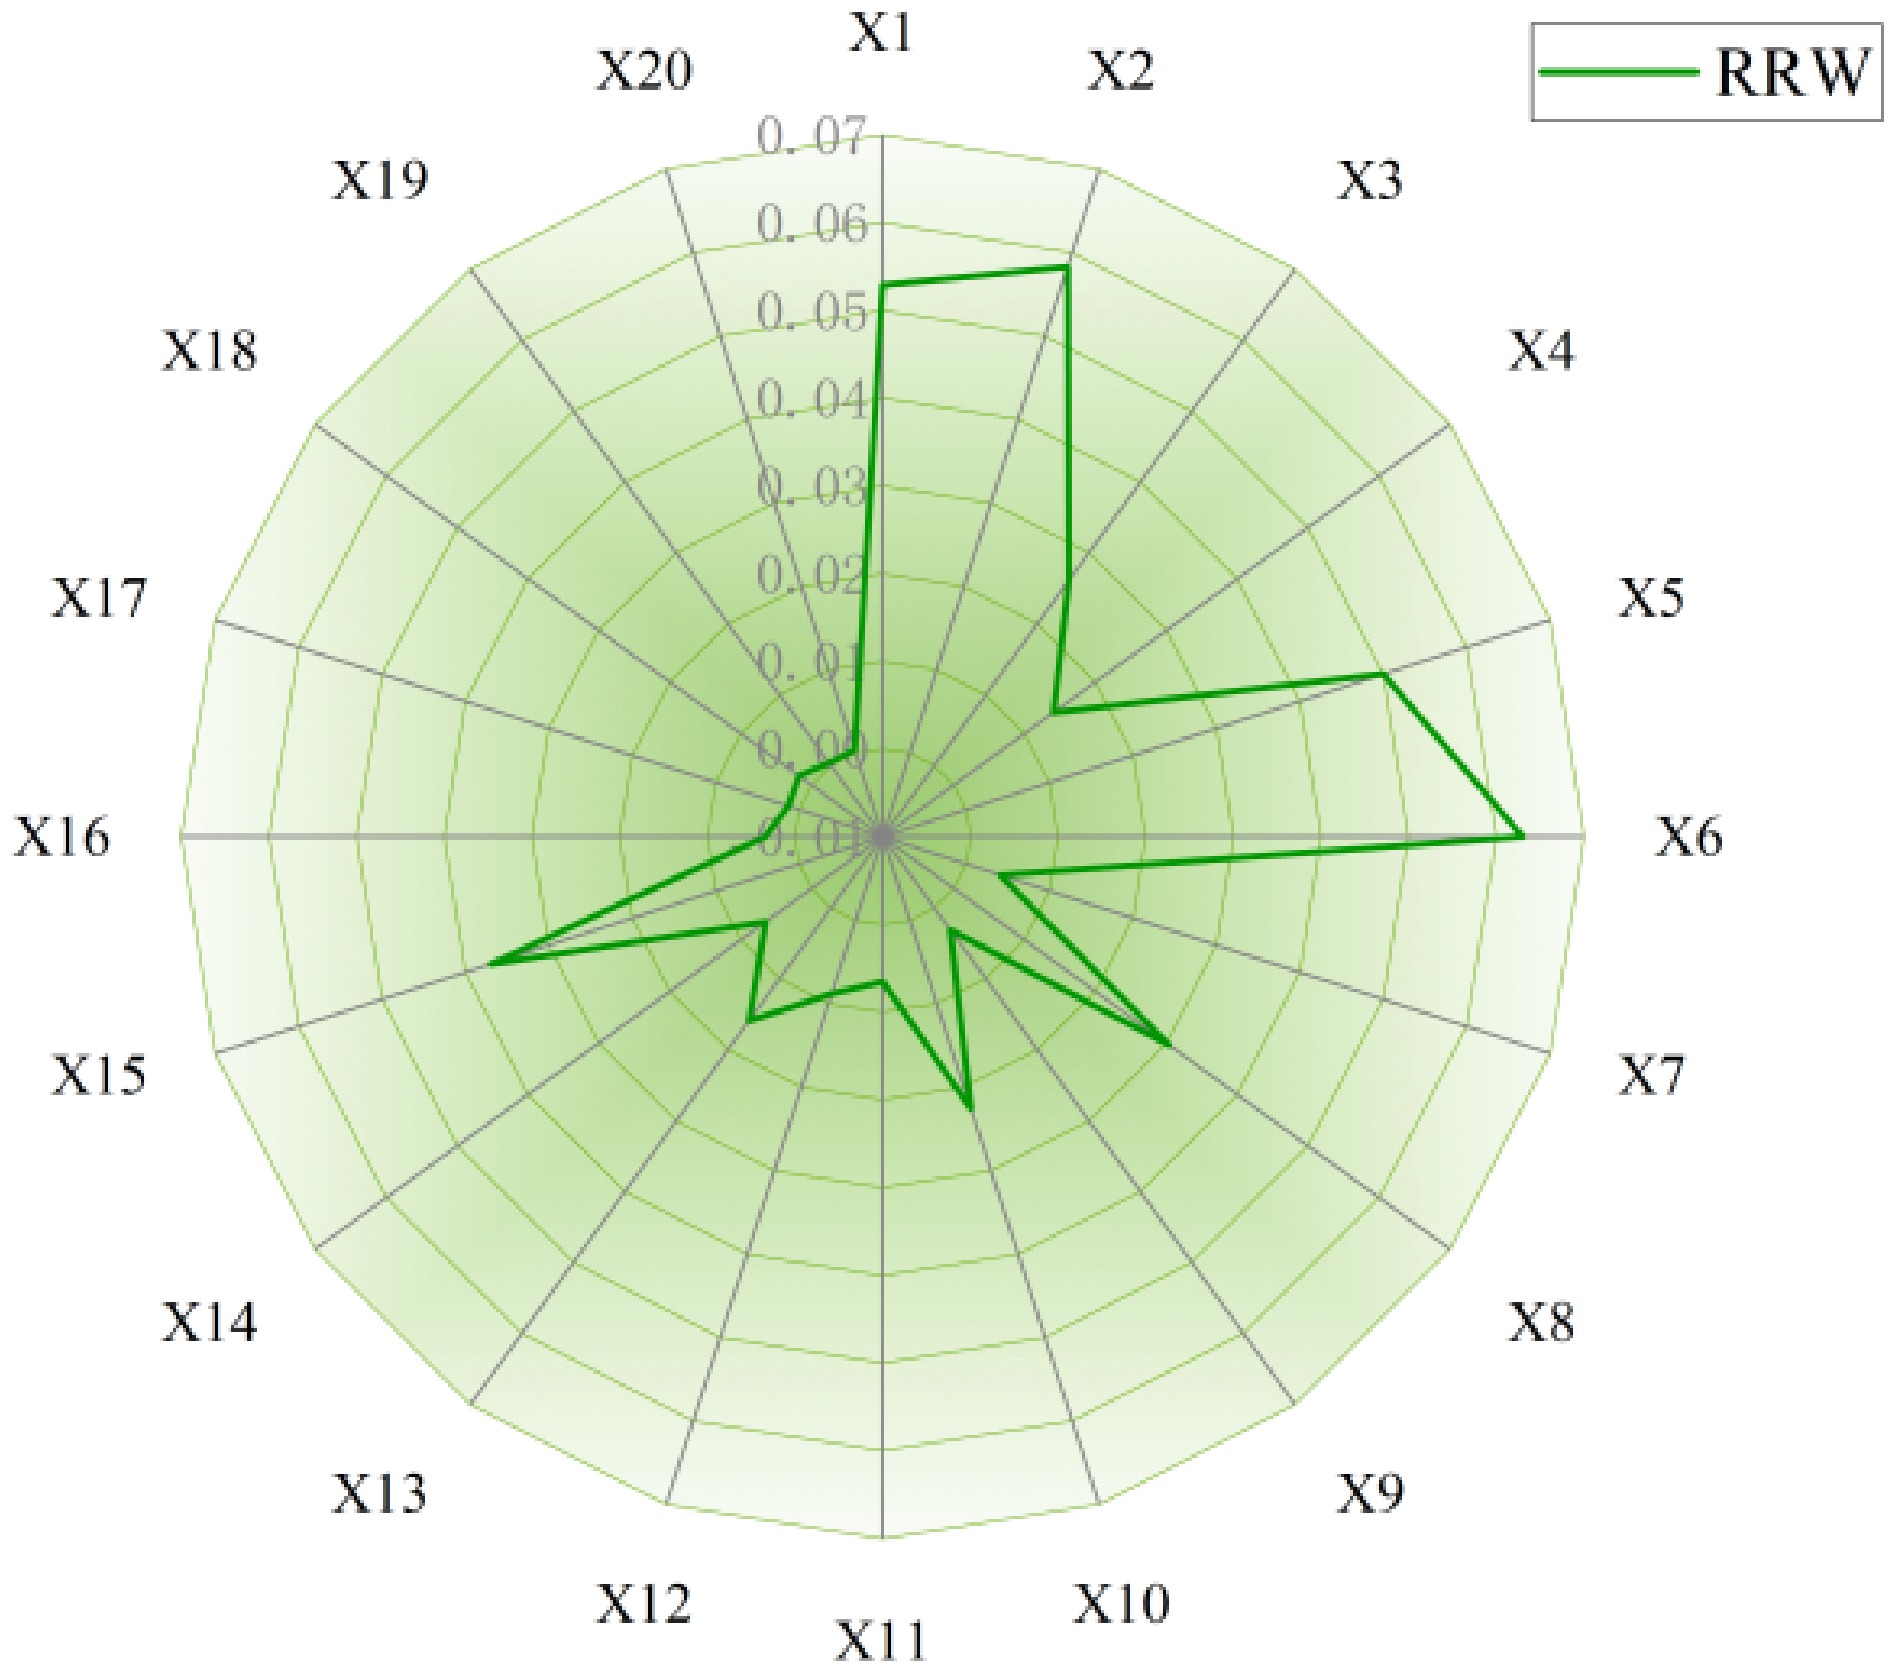
Figure 9.
The RRW ranking for the 20 root nodes.
-
Since the structural importance ranking derived from the qualitative analysis of the fault tree is more significantly influenced by the fault tree structure and less accurate compared to quantitative Bayesian network analysis, this study comprehensively analyzes and compares three metrics: ROV, BIM, and RRW. The ranking comparison of all root node metrics is shown in Fig. 10.
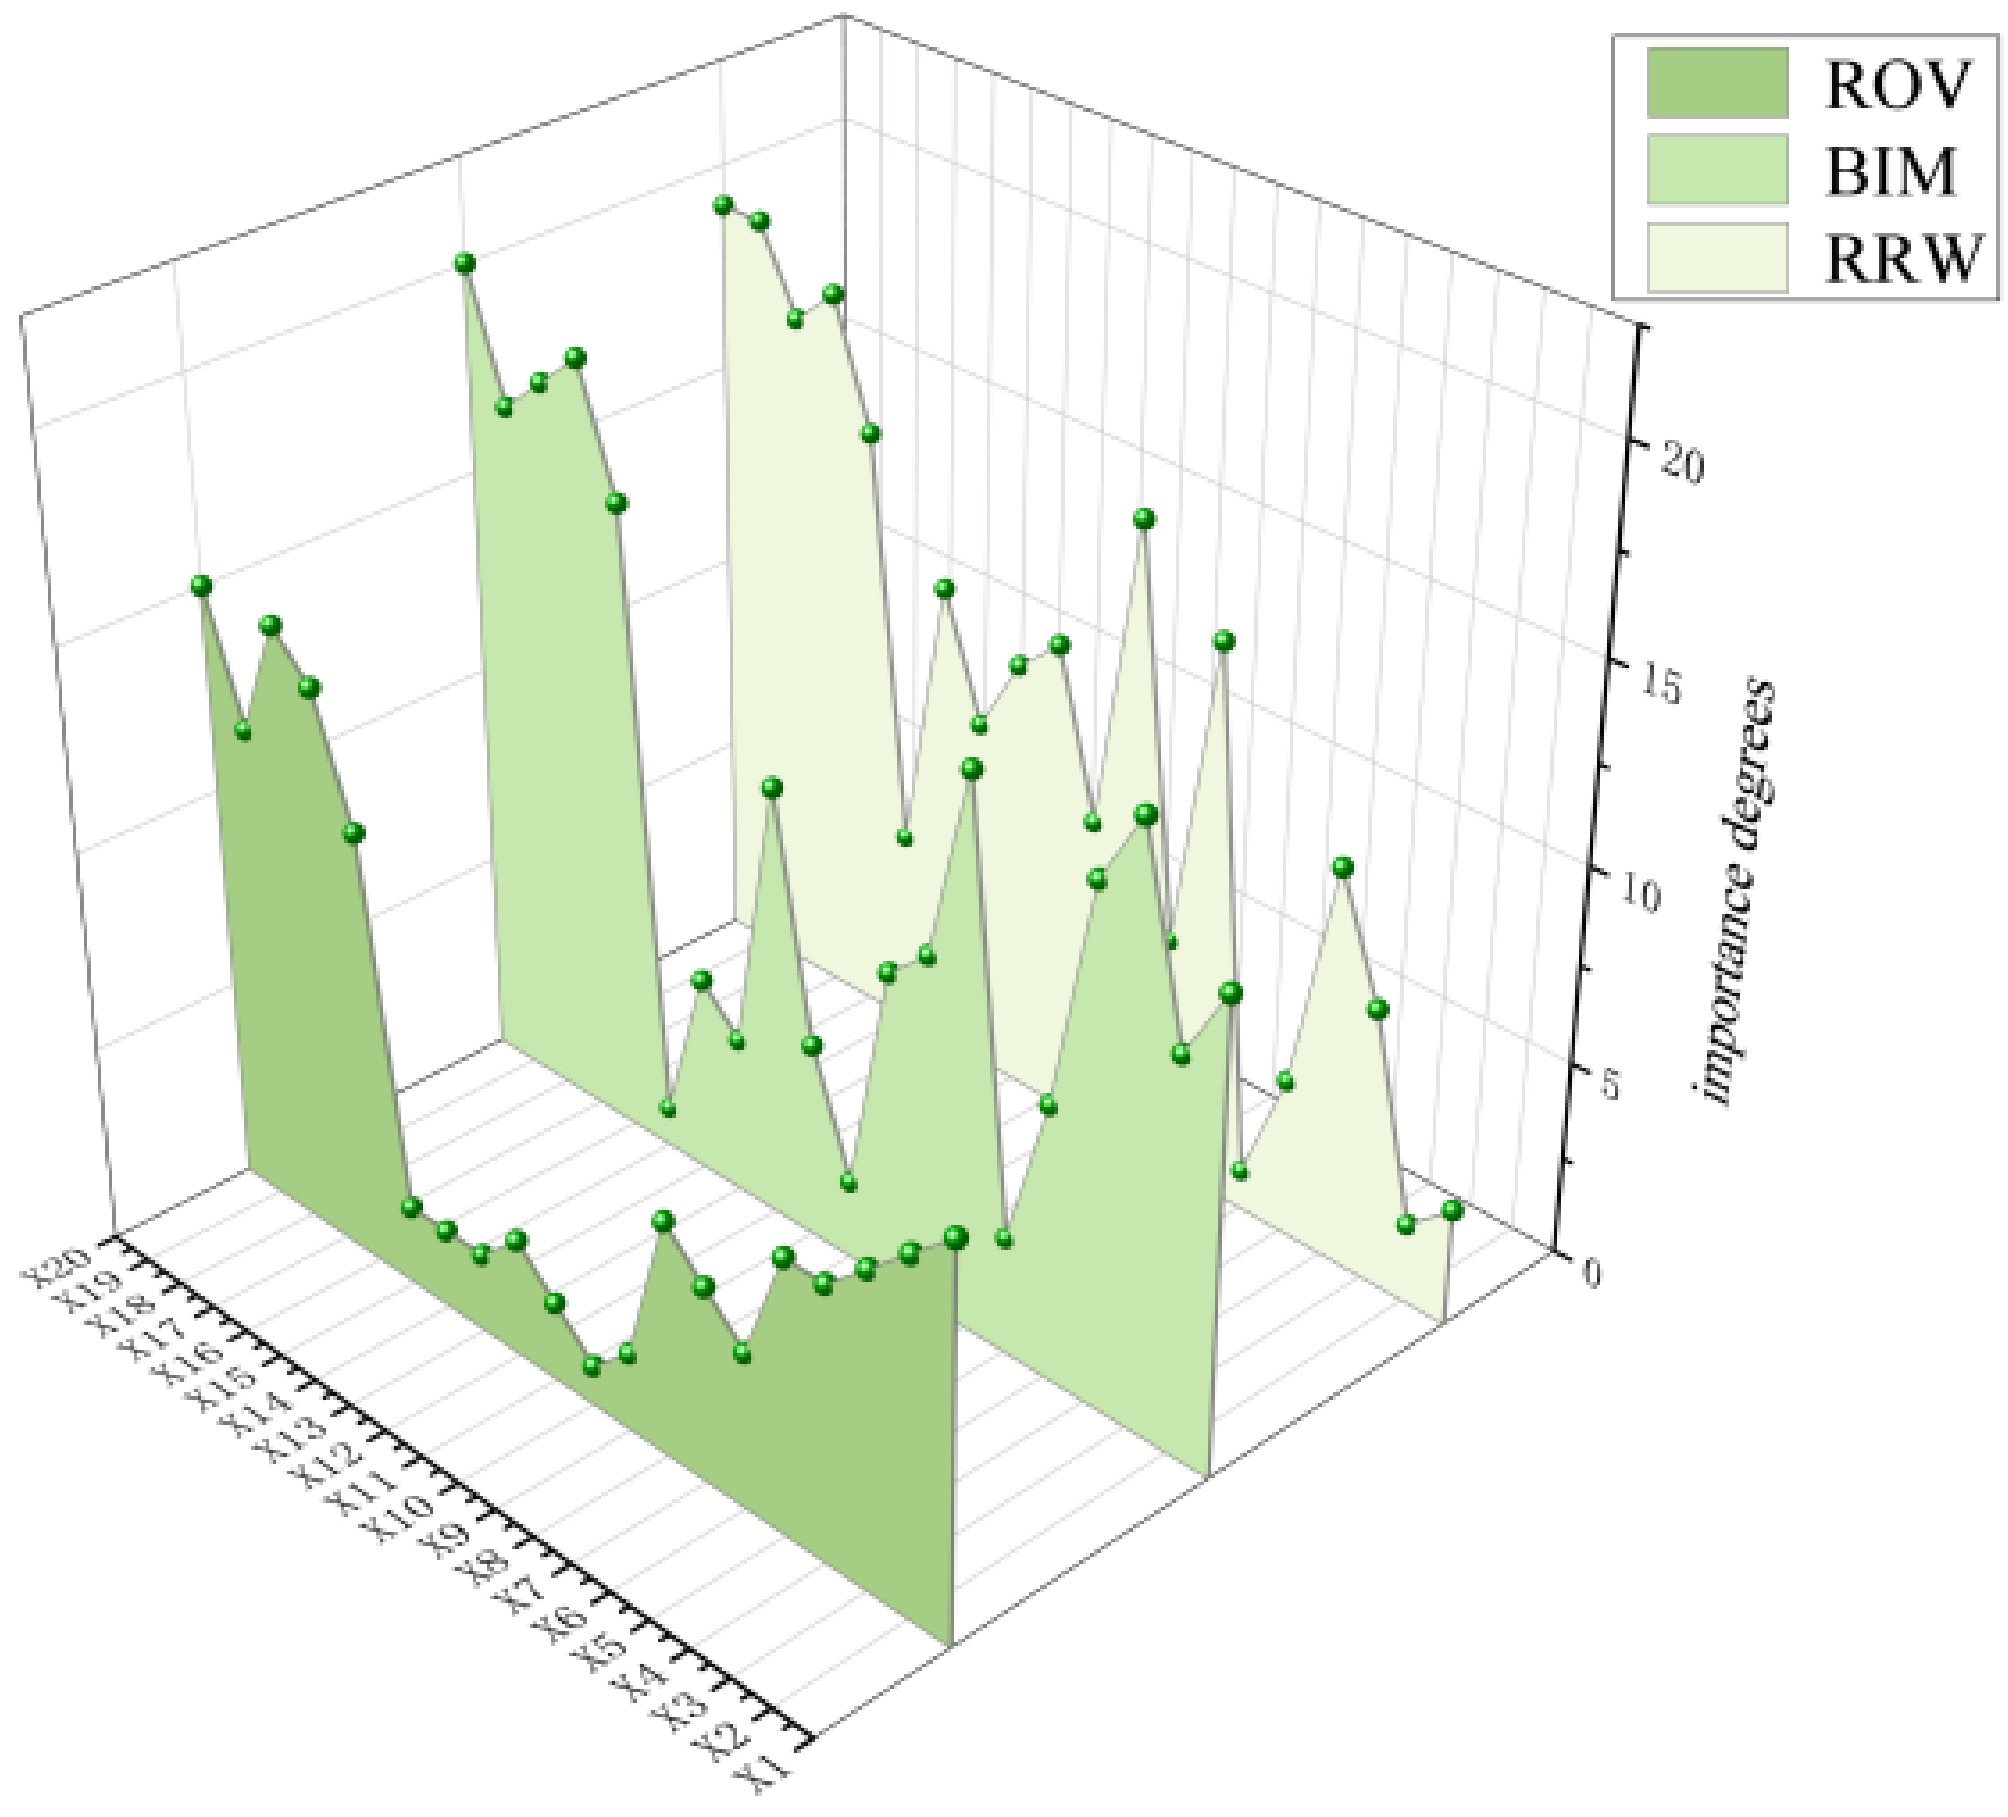
Figure 10.
The ranking comparison of all root node metrics.
Within the RRW results, basic events categorized under 'driver-related factors' ranked relatively high. In contrast, the ROV and BIM results showed higher rankings for basic events within 'vehicle and container-related factors' and 'road-related factors'. Integrating the rankings from all three metrics, two basic events consistently appeared within the top five across all three sets of results: X6, X15. This indicates that these two events are the primary contributing causes.
These findings are corroborated by real accident outcomes. For instance, the 2020 Wenling LNG tanker rollover accident, which resulted in 20 fatalities and significant economic losses, occurred on a section with reported inadequate road signage and challenging alignment, highlighting the critical role of these factors in severe accidents. X6 is particularly dangerous for LNG tank trucks with a high center of gravity and liquid cargo sway characteristics, as it significantly increases centrifugal force during driving, alters the effect of gravitational components on stability on slopes, and generates dynamic lateral forces due to liquid cargo sway, all of which together drastically reduce the vehicle's roll stability margin. The hazard of X15 lies in depriving drivers of the ability to timely perceive risks and effectively avoid hazards (e.g., missing delineators, reflective road studs for guidance, or appropriate speed reduction facilities). This results in drivers being unable to take critical actions, especially deceleration, before entering hazardous sections.
To address the potential uncertainty associated with expert-derived probabilities, a local sensitivity analysis was conducted. The probabilities of the basic events were perturbed by ± 20% individually, and the subsequent changes in the importance measure rankings (ROV, BIM, RRW) were observed. The results demonstrated that the top-five ranking critical factors remained stable without any change in their composition, although minor fluctuations in the order were noted. This indicates that the identification of the paramount risk contributors, particularly X6 and X15, is robust and not overly sensitive to variations in the input probabilities within a plausible range.
Furthermore, while the Bayesian network did not include 'vehicle speed' as an explicit mediator due to data constraints, the diagnostic inference and importance measures consistently highlighted factors that directly influence speed behavior. Posterior analysis of the Bayesian network further confirmed that speed management is the core mechanism connecting and mitigating these two major risks. Reducing speed effectively decreases centrifugal force, suppresses the intensity of liquid cargo sloshing, and increases reaction time, thereby partially compensating for the risks arising from road defects and inadequate warning.
While this study innovatively applied fuzzy set theory to integrate multi-source general traffic accident data to address the challenge of scarce LNG-specific accident data and constructed a quantitative assessment framework integrating FT-BN, the precision of the results is still constrained by the representativeness of the adopted baseline data and the inherent subjectivity of expert assessments. Furthermore, the current model incorporates necessary simplifications regarding the complex coupling effects of liquid cargo sloshing with vehicle dynamics and road geometry.
Therefore, future research should focus on: 1) accumulating LNG tanker truck-specific accident data to validate and optimize model parameters; 2) formulating and implementing specific engineering interventions targeting the identified X6 and X15. For example: deploying enhanced warning signs, locating speed limit signs, and improving delineation facilities. These measures aim to compel or guide drivers to reduce speed to within safe limits, thereby fundamentally mitigating rollover risk.
-
Preventing LNG tanker rollovers is vital for safety and economy. This study developed an integrated FFT-BN model to overcome probabilistic data scarcity and accurately assess rollover risk. Analysis identified and quantified 20 causal factors.
Comprehensive Bayesian Network importance analysis (ROV, BIM, RRW) pinpointed poor road alignment (X6) and the absence of critical traffic facilities (X15) as paramount risk factors. Crucially, vehicle speed was established as the central mechanism linking these critical factors to rollovers. Poor road alignment demands precise speed control, while missing facilities impairs drivers' ability to anticipate hazards and reduce speed proactively; unsafe speeds on high-risk sections dramatically increase rollover probability.
While the current model does not explicitly include vehicle speed as a node, the identified critical factors (X6 and X15) are known to influence driver speed choices. Therefore, controlling speed through engineering and enforcement measures remains a pragmatically effective strategy to mitigate rollover risk. Future work should integrate real-time speed data to enhance the model's predictive capability.
Based on these critical insights, targeted mitigation strategies are strongly recommended: Implementing enforced speed management measures (e.g., context-sensitive speed limits, speed feedback systems, intelligent speed assistance) on identified high-risk road sections is essential. Concurrently, auditing and enhancing critical traffic warning and guidance facilities is vital to empower drivers to make safe speed adjustments proactively.
Future work should focus on developing physics-based safety speed models incorporating road alignment parameters, vehicle dynamics, and liquid sloshing effects to guide precise speed control strategies for LNG tankers on specific high-risk segments, and exploring real-time risk assessment systems leveraging the identified key factors and pathways is also a promising direction. While the fuzzy linguistic assessment effectively handled data scarcity, future efforts to incorporate more objective data for probability refinement would further enhance model accuracy.
This work is supported by the National Key Research and Development Program of China (Grant No. 2023YFC3008802).
-
The authors confirm contributions to the paper as follows: study conception and design: He Q, Lv Z; data collection: Yang L, He Q; analysis and interpretation of results: Yang L, Zhang Y; draft manuscript preparation: Yang L, Zhang Y, He Q, Lv Z, Qiu D, Chen S. All authors reviewed the results and approved the final version of the manuscript.
-
All data generated or analyzed during this study are included in this published article.
-
The authors declare that they have no conflict of interest.
- Copyright: © 2025 by the author(s). Published by Maximum Academic Press on behalf of Nanjing Tech University. This article is an open access article distributed under Creative Commons Attribution License (CC BY 4.0), visit https://creativecommons.org/licenses/by/4.0/.
-
About this article
Cite this article
Yang L, Zhang Y, He Q, Lv Z, Qiu D, et al. 2025. Integrated fuzzy fault tree-Bayesian network modeling for rollover risk assessment of LNG road tankers. Emergency Management Science and Technology 5: e019 doi: 10.48130/emst-0025-0016 

Integrated fuzzy fault tree-Bayesian network modeling for rollover risk assessment of LNG road tankers
- Received: 04 July 2025
- Revised: 15 September 2025
- Accepted: 09 October 2025
- Published online: 31 October 2025
Abstract: Liquefied natural gas (LNG) road tanker rollover accidents, though infrequent, often lead to catastrophic consequences. Quantitative risk assessment is significantly challenged by the scarcity of probabilistic data specific to these complex, low-frequency events. To address this data limitation and enhance assessment accuracy, this study develops an integrated fuzzy fault tree-Bayesian network (FFT-BN) methodology. Fuzzy set theory is applied, leveraging multi-source general traffic accident statistics and expert judgment, to quantify the occurrence probabilities of basic causal factors under uncertainty. A Bayesian network is then constructed from the fault tree structure to enable comprehensive probabilistic inference. Critical risk factors were rigorously identified using multiple importance measures (ROV, BIM, RRW). The analysis consistently pinpointed poor road alignment and the absence of critical traffic facilities as the two paramount contributors. Crucially, vehicle speed management emerged as the central mitigation mechanism linking these factors; controlling speed effectively counters the destabilizing effects of poor alignment and compensates for the lack of timely hazard perception. The results demonstrate that implementing targeted speed control measures on identified high-risk road sections is essential for reducing the probability of LNG tanker rollovers.