


-
Since the energy and resource acquisition of plants is always limited, plants have to make trade-offs in energy utilization for various life activities such as growth, survival, reproduction and resistance to environmental disturbances. The growth strategy of plants often changes with age to ensure survival in different environments, with seedlings continuously balancing their 'survival-growth' and adapting their life strategy[1]. Thus, both environmental factors and age play an important role in influencing the ecological adaptation strategies of seedlings[2].
Functional traits of plants refer to morphological and physiological characteristics that influence plant survival, growth and reproduction. In response to different environmental conditions, plants often change their functional traits to adapt[3]. For example, in low-light environments, some plants enlarge certain leaf areas to improve photosynthetic efficiency[4]. Each plant organ has a specific function in acquiring resources, providing transport pathways for assimilates and providing mechanical support[1,5]. It is generally assumed that plants are able to adjust the relative size and biomass distribution of organ systems (e.g. shoot canopy, root system) in response to changes in the external resource supply[6]. The distribution of biomass among different plant organs reflects the plant's ability to adapt to different environmental conditions. Previous studies have shown that both light and seed quality are the most important factors influencing biomass accumulation in the early growth stages of oak seedlings[7]. Plants growing under strong light environment tend to invest more biomass in the near-soil part to develop a developed root system that ensures water and nutrient uptake[8,9]. Non-structural carbohydrates (NSC), mainly composed of mobile soluble sugars (SS) and non-mobile starch (ST)[10], are important nutrients stored in various plant organs and play a crucial role in daily metabolism and resistance to environmental stress[11]. Fluctuations in NSCs are related to the intensity and efficiency of photosynthesis, as well as to the age stage, life form and growth environment of plants[11,12]. The NSCs stored in plants indicate the balance between photosynthetic uptake of carbon (C) and growth investment. The conversion of SS and ST under certain environmental conditions shows the relationship between plant C uptake (photosynthesis) and C consumption (growth and respiration) and reflects the ecological strategy for plant growth and defence.
Quercus mongolica Fisch.ex Ledeb. is an important species in the deciduous forests of northern China, and also serves as an important secondary species in temperate forests[13]. It has high economic and ecological value and plays an important role in wind and fire protection, as well as water and soil conservation. In addition, Q. mongolica is a heliophilous species, and many researchers have observed an extremely high mortality rate of Q. mongolica seedlings in low-light environments[7,14]. The tree height, leaf density, and canopy closure in a forest stand have a significant influence on the light intensity in the area below the tree canopy. Changes in light intensity often lead to shifts in the microclimate of the region. Therefore, the heterogeneity of the tree canopy structure often leads to differences in the light environment of the forest. Forest edges, i.e. the interfaces between forested and non-forested areas, are integral components of forested landscapes[15]. The forest edge is a unique microhabitat that differs from the forest interior due to different climatic factors and canopy structure. Therefore, forest edge and forest interior often differ in species composition and community structure[16]. Natural boundaries between neighbouring ecosystems are ecologically important as they can harbour greater species diversity and functional diversity than neighbouring ecosystems[17]. However, few studies have investigated the effects of forest edges on Q. mongolica.
It is well known that seedlings are a critical stage in forest regeneration and that their adaptability to different environments strongly influences the recovery and reestablishment of forest vegetation[18]. Many studies have investigated the effects of light on Q. mongolica seedlings using laboratory simulations of the light environment[14,19]. However, these simulations do not fully reflect the complex light environment that exists under natural conditions in the field. In addition, few studies have investigated whether Q. mongolica seedlings change their functional traits and NSC allocation strategies with age, although the intensity of survival stress usually changes during tree growth[20]. To answer the above questions, simultaneous measurements of NSC concentration and functional traits in each organ at different ages are required.
For this study, four mixed Q. mongolica plantations within the Urban Forestry Demonstration Base in Harbin City were selected as experimental plots. In each of these plantations, Q. mongolica seedlings from three different age classes were collected from both the forest edge and the understory. At the same time, the NSC concentration and functional properties of the seedlings were measured. We asked ourselves two questions: (1) Are there obvious differences in growth adaptation strategies between Q. mongolica seedlings of different age classes? (2) What are the growth adaptation strategies of Q. mongolica seedlings of different age classes?
-
The study area was located in the Urban Forestry Demonstration Base in the city of Harbin, Heilongjiang Province, China. It was established in 1948 and covers an area of 43.95 hm2, with 62.6% of the total area being forested. The geographical coordinates are 45°43'10" N and 126°37'15" E, and the altitude ranges from 136 to 148 m. The climate is described as a temperate monsoon climate with warm and humid summers and cold and dry winters. Rainfall occurs mainly in July and August, with an average annual rainfall of 569 mm. The average relative humidity was 67% and the average annual temperature was 3.5 °C. The area has mainly dark, calcareous soil, soils that provide a good moisture environment. The main tree species are Quercus mongolica Fisch. ex Ledeb., Juglans mandshurica Maxim., Phellodendron amurense Rupr., Salix matsudana Koidz., Fraxinus mandshurica Rupr., Betula platyphylla Suk., Pinus sylvestris var. mongholica Litv., Pinus tabuliformis var. Mukdensis, Betula platyphylla Suk., Pinus sylvestris var. mongholica Litv., Fraxinus chinensis subsp. Rhynchophylla (Hance) E. Murray, and Ulmus pumila Linn. et al.
Plot survey and sampling
-
The experiment was conducted during the strong growth phase of the forest trees in July 2022. Four plantations, namely the Q. mongolica plantation, the F. chinensis plantation, the B. platyphylla plantation and the P. sylvestris plantation, were selected as experimental plots in the Urban Forestry Demonstration Base, Harbin City, China. Q. mongolica seedlings were abundant in all four plots. Three different age classes of Q. mongolica seedlings were collected from the forest edge and understory of each sample plot, and three well-grown Q. mongolica seedlings of similar height and size were taken from each age class. The sun-exposed habitats were located at the forest edges, while the shaded habitats were in the forest understory. The canopy closure is closely related to light under the canopy[21]. Moreover, the effect of forest edges in plantations changes with the distance from the border to the neighbouring plantation[22]. Therefore, in our work, we define the light environment based on canopy closure and distance from the boundary. (1) Forest edge, within 10 m of the boundary, the canopy closure is about 50%. (2) Forest understory, more than 10 m from the boundary, the canopy closure is about 80%.
We measured the height (H) and basal diameter (BD) of the Q. mongolica seedlings, and recorded the number of bud scale scars (BLN) on the main stems, and categorized the seedlings into three different age classes based on these indicators. Age class I (1−2 years): H ≤ 30 cm, BD ≤ 4 mm, 1 ≤ BLN ≤ 2; age class II (3−4 years): 30 < H ≤ 50 cm, 4 < BD ≤ 6 mm, 3 ≤ BLN ≤ 4; age class III (5−6 years): 50 < H ≤ 70 cm, 6 < BD ≤ 8 mm, 5 ≤ BLN ≤ 6. Our research has focused on the growth of seedlings under 6 years of age because we believe that seedlings are more sensitive to the environment. In contrast, older plants may be relatively slow to adapt to environmental changes. The seedlings were divided into roots, stems and leaves, individually packed and labeled. They were placed in insulated boxes with cold packs and transported to the laboratory to measure the relevant indicators. As there are no seedlings older than five years in the Q. mongolica plantation, only class I and II seedlings were collected. The basic characteristics of the plots and the information on the samples are listed in Tables 1 & 2, respectively.
Table 1. Plantations from which seedlings were collected, the area of each plantation, the average tree height and the average diameter at breast height (DBH).
Plantation Area
(hm2)Average
DBH (cm)Average tree
height (m)Stand density
(plant/hm2)Q. mongolica 1.2526 15.03 12.99 2,050 F. chinensis 0.8904 25.16 17.33 375 B. platyphylla 1.2722 9.88 10.26 1,675 P. sylvestris 1.2259 14.74 13.10 1,600 Species included Quercus mongolica Fisch. ex Ledeb., Fraxinus chinensis subsp. rhynchophylla (Hance) E. Murray, Betula platyphylla Sukaczev and Pinus sylvestris var. mongholica Litv. Table 2. Average height and basal diameter (± SD) of Q. mongolica seedlings of all age classes in the forest understory and at the forest edge in four plantations.
Plantation Light environment Age class Height
(cm) ± SDBasal diameter
(mm) ± SDF. chinensis Understory 1−2a 20.83 ± 3.13 2.99 ± 0.52 3−4a 41.51 ± 4.08 4.87 ± 0.69 5−6a 66.33 ± 1.69 6.82 ± 0.49 Forest edge 1−2a 16.15 ± 1.63 2.52 ± 0.29 3−4a 43.13 ± 5.78 4.95 ± 0.65 5−6a 66.29 ± 3.55 6.93 ± 0.86 P. sylvestris Understory 1−2a 20.58 ± 4.53 2.98 ± 0.61 3−4a 39.56 ± 4.91 5.06 ± 0.42 5−6a 62.33 ± 5.39 6.94 ± 0.11 Forest edge 1−2a 21.67 ± 2.19 2.94 ± 0.30 3−4a 42.75 ± 4.76 4.48 ± 0.42 5−6a 65.71 ± 2.94 6.63 ± 0.44 B. platyphylla Understory 1−2a 26.53 ± 3.98 3.31 ± 0.36 3−4a 45.09 ± 4.52 5.21 ± 0.56 5−6a 65.26 ± 3.40 6.23 ± 0.19 Forest edge 1−2a 23.16 ± 5.63 3.52 ± 0.22 3−4a 37.52 ± 2.53 4.89 ± 0.45 5-6a 61.73 ± 1.79 6.61 ± 0.44 Q. mongolica Understory 1−2a 20.16 ± 4.74 2.94 ± 0.56 3−4a 40.75 ± 6.64 4.94 ± 0.73 5−6a — — Forest edge 1−2a 19.16 ± 2.73 2.86 ± 0.59 3−4a 40.01 ± 4.94 4.47 ± 0.26 5−6a — — Species included Quercus mongolica Fisch. ex Ledeb., Fraxinus chinensis subsp. rhynchophylla (Hance) E. Murray, Betula platyphylla Sukaczev and Pinus sylvestris var. mongholica Litv. Light intensity was measured under the forest canopy of the forest and at the forest edge of each plantation. These measurements were carried out on three consecutive sunny days from 11:00 to 13:00. An illuminance metre (ST-85) was used for these measurements. Along the edge of the forest, we laid a 100-meter-long line, positioned 5 m from the plantation edge, and established measurement points every 20 m — a total of five points. under the forest canopy, we chose five measurement points with a completely closed canopy for the evaluation of light intensity. In addition, we simultaneously measured the light intensity in open areas that were considered equivalent to the environment under full illumination. Relative light intensity (RLI) was used to indicate the variation in light intensity at the different sites. The lighting conditions at the study sites are shown in Table 3.
Table 3. Relative light intensity of the sample plot.
Plantation Relative light intensity (%) Forest understory Forest edge Q. mongolica 1.4 10.2 F. chinensis 2.0 30.5 B. platyphylla 2.8 14.1 P. sylvestris 6.3 27.0 Measurements of NSC and functional traits
-
Excess soil on the surfaces of the seedlings was washed off with running water. All leaves were scanned with an Epson V700 scanner and the projected area of the leaves was measured with analysis software (WinRhizo). The roots, stems and leaves were placed in labelled paper envelopes, microwaved at 105 °C for 10 min and then oven dried at 65 °C for 48 h until a constant weight was achieved. The dry weights of the roots, stems and leaves of the seedlings were measured using an electronic balance (with an accuracy of 0.01 g). A ball mill (MM400, Retsch, Germany) was used to grind the plant tissue into powder, which was then sieved through an 80-mesh sieve and stored for further analysis. The soluble sugar and starch concentrations of the samples were determined using the colourimetric sulphuric acid anthrone method[23]. Total non-structural carbohydrates (TNC) were defined as the sum of soluble sugar and starch concentrations[24]. Abbreviations and their definitions for various indicators in this paper are provided in Table 4.
Table 4. Abbreviations used in this article together with their definitions and units.
Abbreviation Full name Definition Units US Forest understory Under the forest canopy, beyond 10 meters from the boundary, the canopy closure is around 80%. − FE Forest edge At the edge of the forest, within 10 meters from the boundary, the canopy closure is around 50%. − RLI Relative light intensity The light intensity at the observation point / full light intensity. g/g SLA Specific leaf area Specific leaf area / leaf dry mass. cm2/g LMF Leaf mass fraction Leaf dry mass / total plant dry mass. g/g SMF Stem mass fraction Stem dry mass / total plant dry mass. mg/g RMF Root mass fraction Root dry mass / total plant dry mass. g/g S/R ratio Shoot to root ratio (leaf + stem dry mass) / root dry mass. g/g SS Soluble sugar − g/g ST Starch − mg/g TNC Total non-structural carbohydrates Startch +Soluble sugar concentration. mg/g Statistical analysis
-
Data were statistically analysed and organised using Excel 2020. A linear mixed effects model (LMM)[25]was used to analyse whether there were significant fixed effects and interaction effects on NSC concentration and functional traits. NSC concentration and functional traits were used as dependent variables, while light environment and seedling age were used as fixed factors. Different plantations were used as random factors. Pearson's correlation analysis[26] was used to evaluate the correlations between NSC traits for seedlings in different age classes and to evaluate the correlations between relative light intensity and different traits for all seedlings. All statistical analyses and graphical representations were performed out in R version 4.3.1 and Origin version 2021.
-
Light environment had a significant effect on the SLA of Q. mongolica seedlings (p < 0.01) (Table 5). We observed a significant reduction in SLA in age classes I and II seedlings at higher light intensity at the forest edge (Fig. 1). No significant difference in SLA was observed in age class III seedlings (Fig. 1), which could be due to the interaction between seedling age and light environment (Table 5).
Table 5. p-values of linear mixed-effects models assessing the significance of fixed and interaction effects of light environment and seedling age on the functional traits of Q. mongolica seedlings, as well as the model conditional R2 and the marginal R2 of the model.
Functional traits Seedling
ageLight environment Light environment
* seedling ageMarginal R2/
Conditional R2SLA 0.11 <0.01** <0.01** 0.081/0.123 RMF <0.01** 0.12 0.87 0.095/0.324 SMF <0.01** 0.85 0.54 0.167/0.224 LMF <0.01** 0.09 0.63 0.233/0.398 S/R ratio <0.01** 0.1 0.92 0.086/0.296 SLA (specific leaf area), RMF (root mass fraction), SMF (stem mass fraction), LMF (leaf mass fraction) and S/R ratio (shoot-to-root ratio). Significance levels: * p < 0.05, ** p < 0.01. 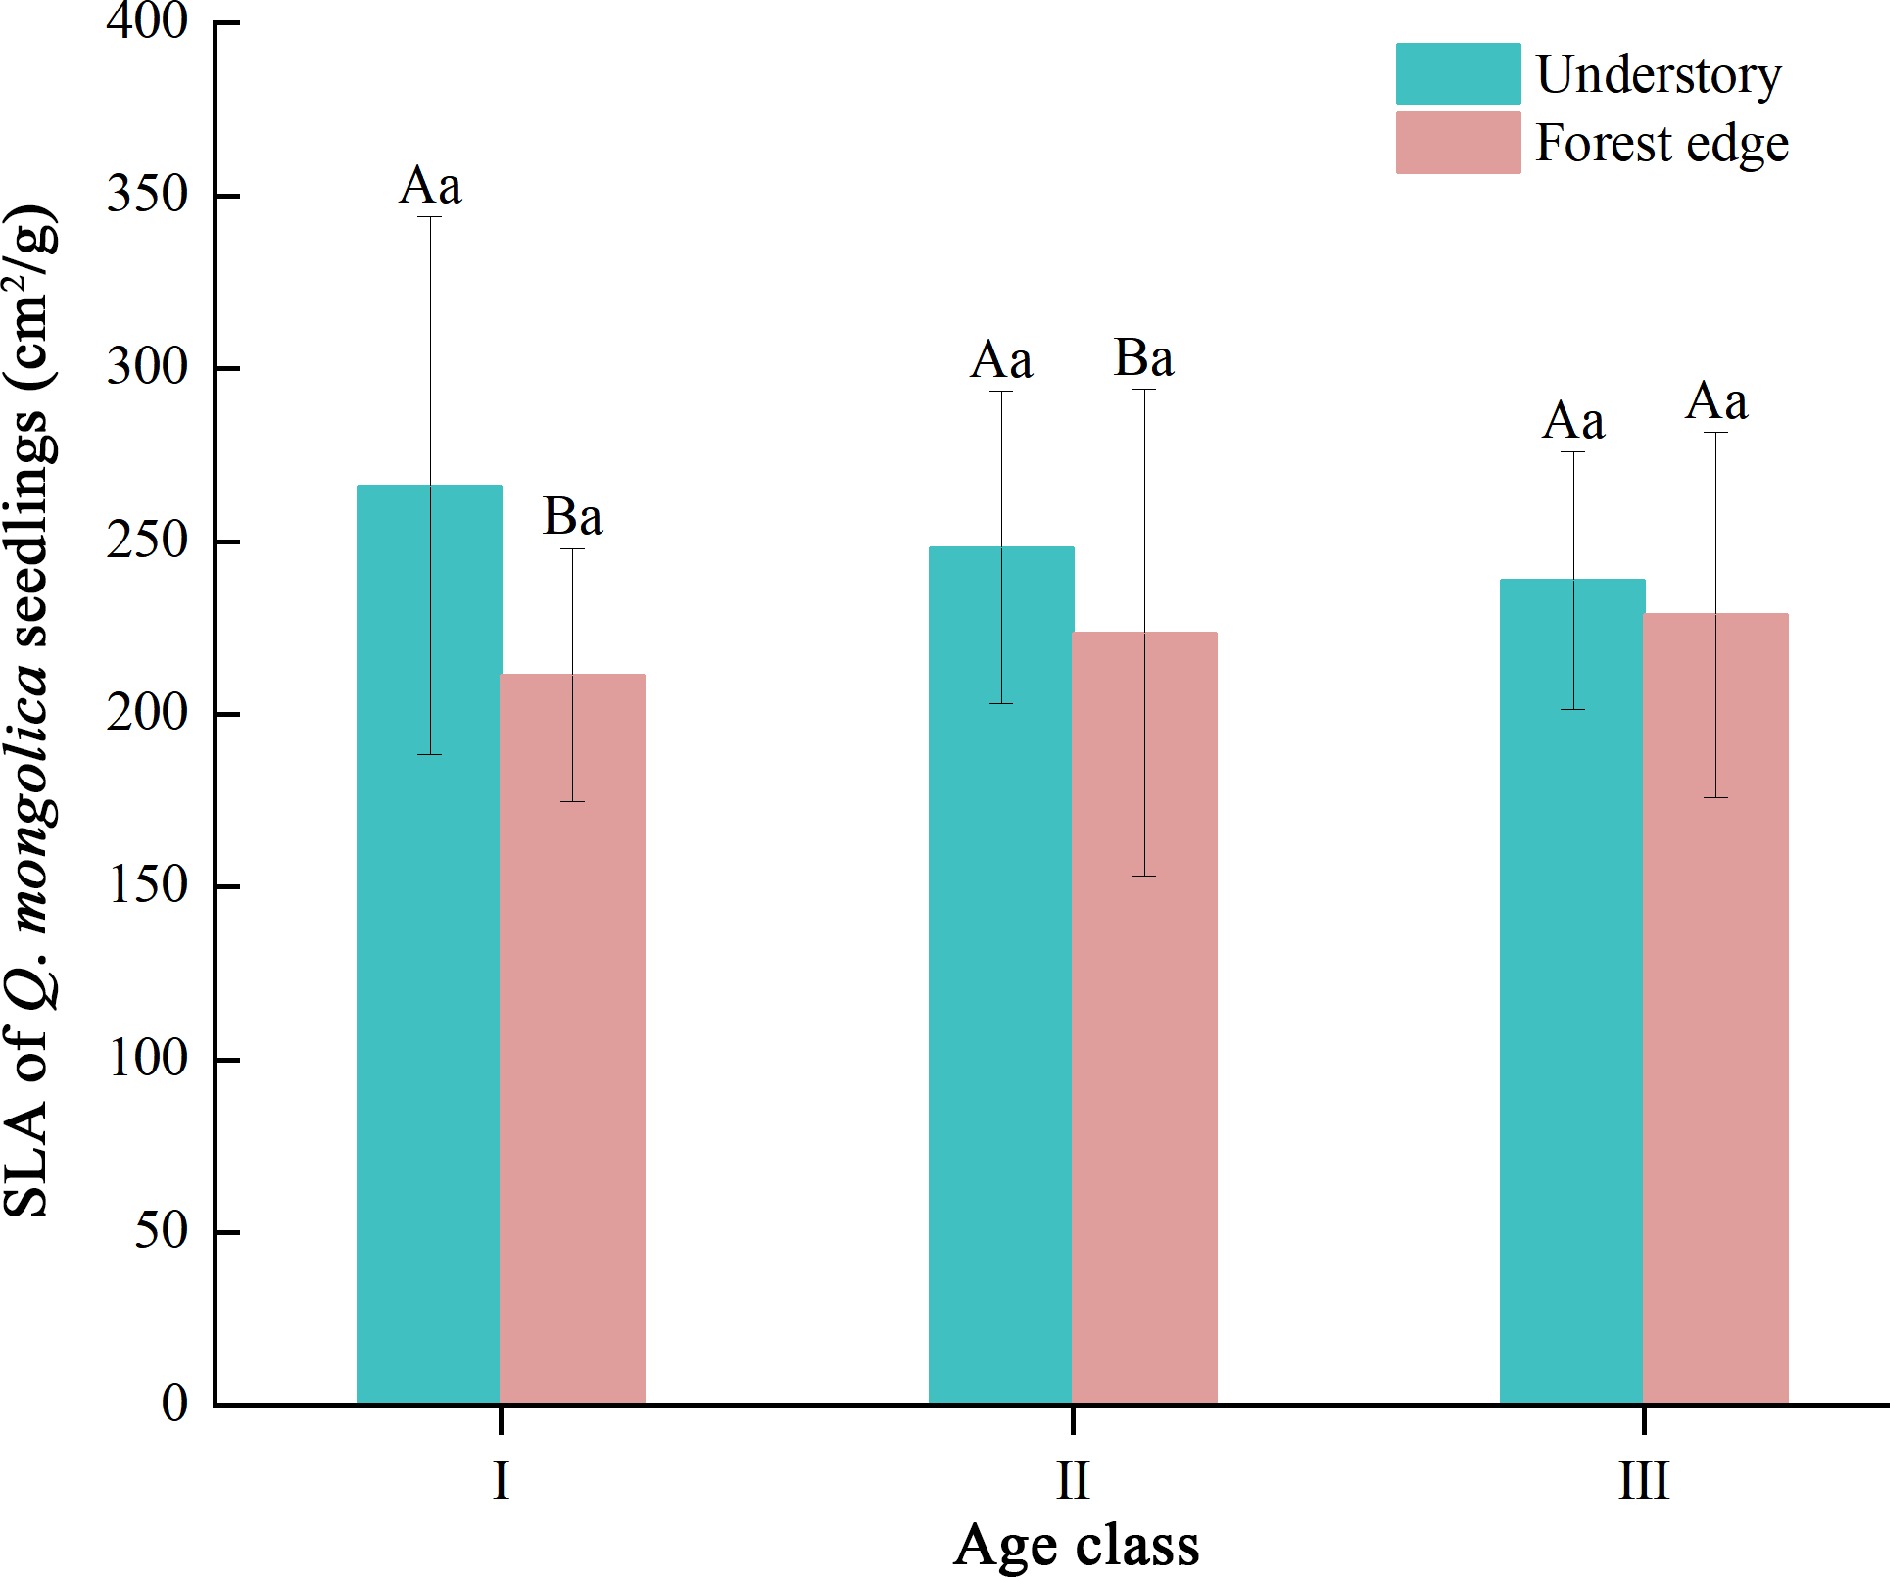
Figure 1.
SLA of Q. mongolica seedlings. SLA indicates the specific leaf area of the plant, while Roman numerals (I, II, III) represent different age classes. Different upper case letters indicate significant differences in indicators between different light environments at the same age (p < 0.05); different lower case letters indicate significant differences in indicators between age classes at the same light environment (p < 0.05).
Patterns of biomass distribution
-
First, we found that the S/R ratio of Q. mongolica seedlings was lowest at age class II, while the RMF of seedlings at this age class peaked (Fig. 2). RMF at the seedling stage of Q. mongolica had the highest values (0.46−0.56), followed by SMF (0.25−0.31), while LMF was the lowest (0.18−0.26) (Fig. 3). In addition, seedling age had a significant effect on the distribution of biomass of Q. mongolica (p < 0.01) (Table 5). Significant decreases in LMF and significant increases in SMF were observed with increasing seedling age (Fig. 3).
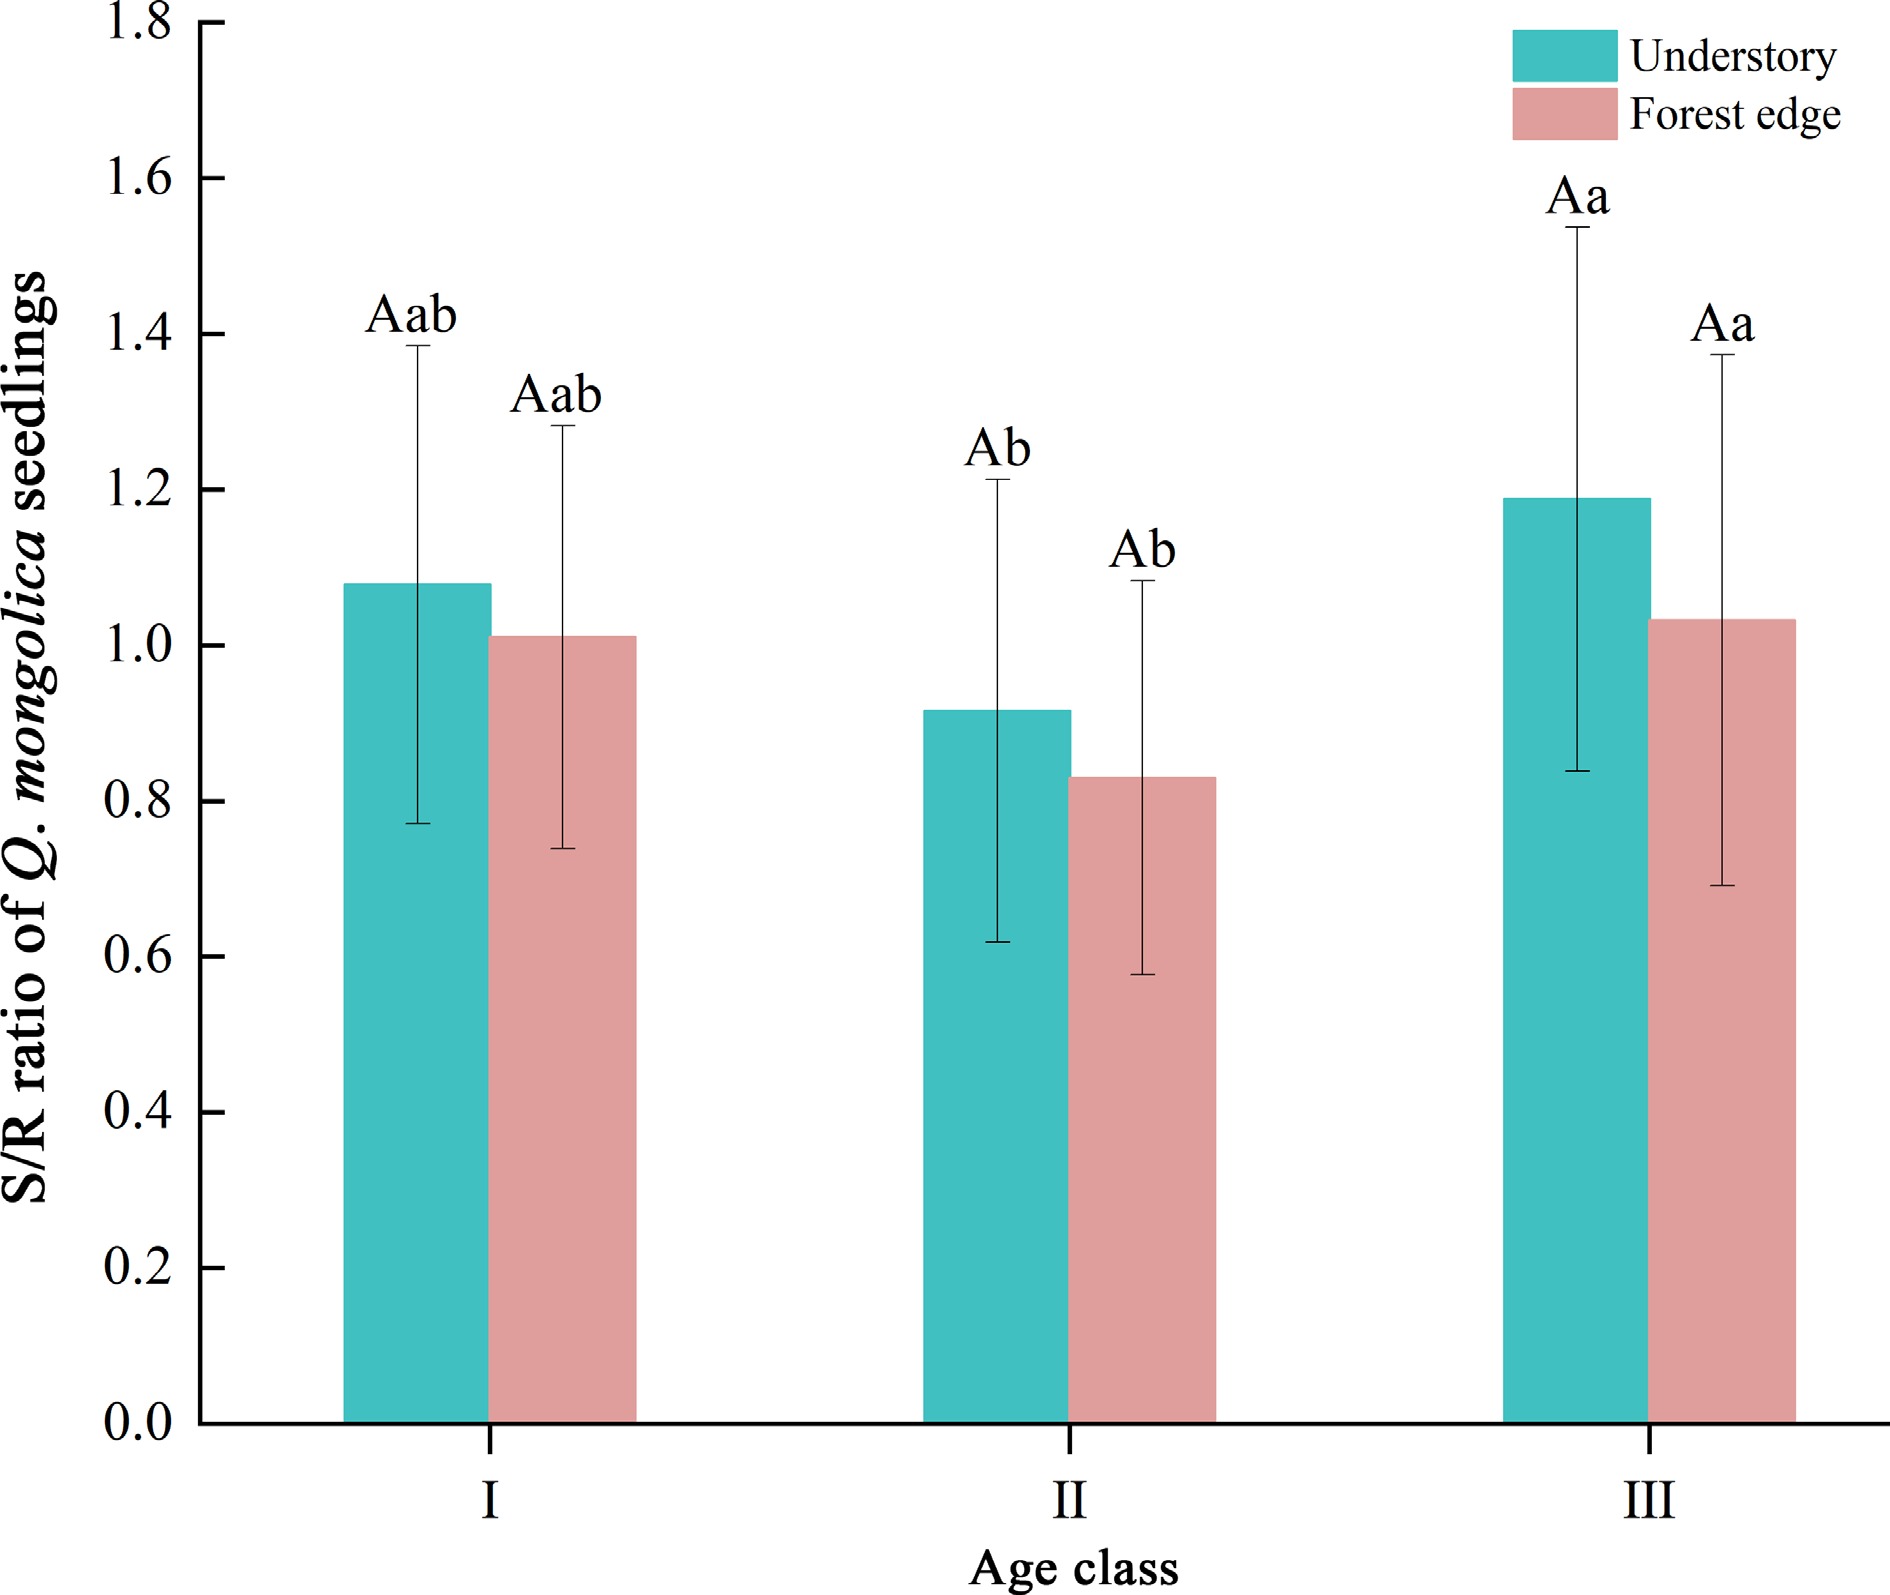
Figure 2.
S/R ratio of seedlings of Q. mongolica. The S/R ratio indicates the ratio of shoot to root of the plant, while Roman numerals (I, II, III) represent different age classes. Different upper case letters indicate significant differences in indicators between different light environments at the same age (p < 0.05); different lower case letters indicate significant differences in indicators between age classes at the same light environment (p < 0.05).
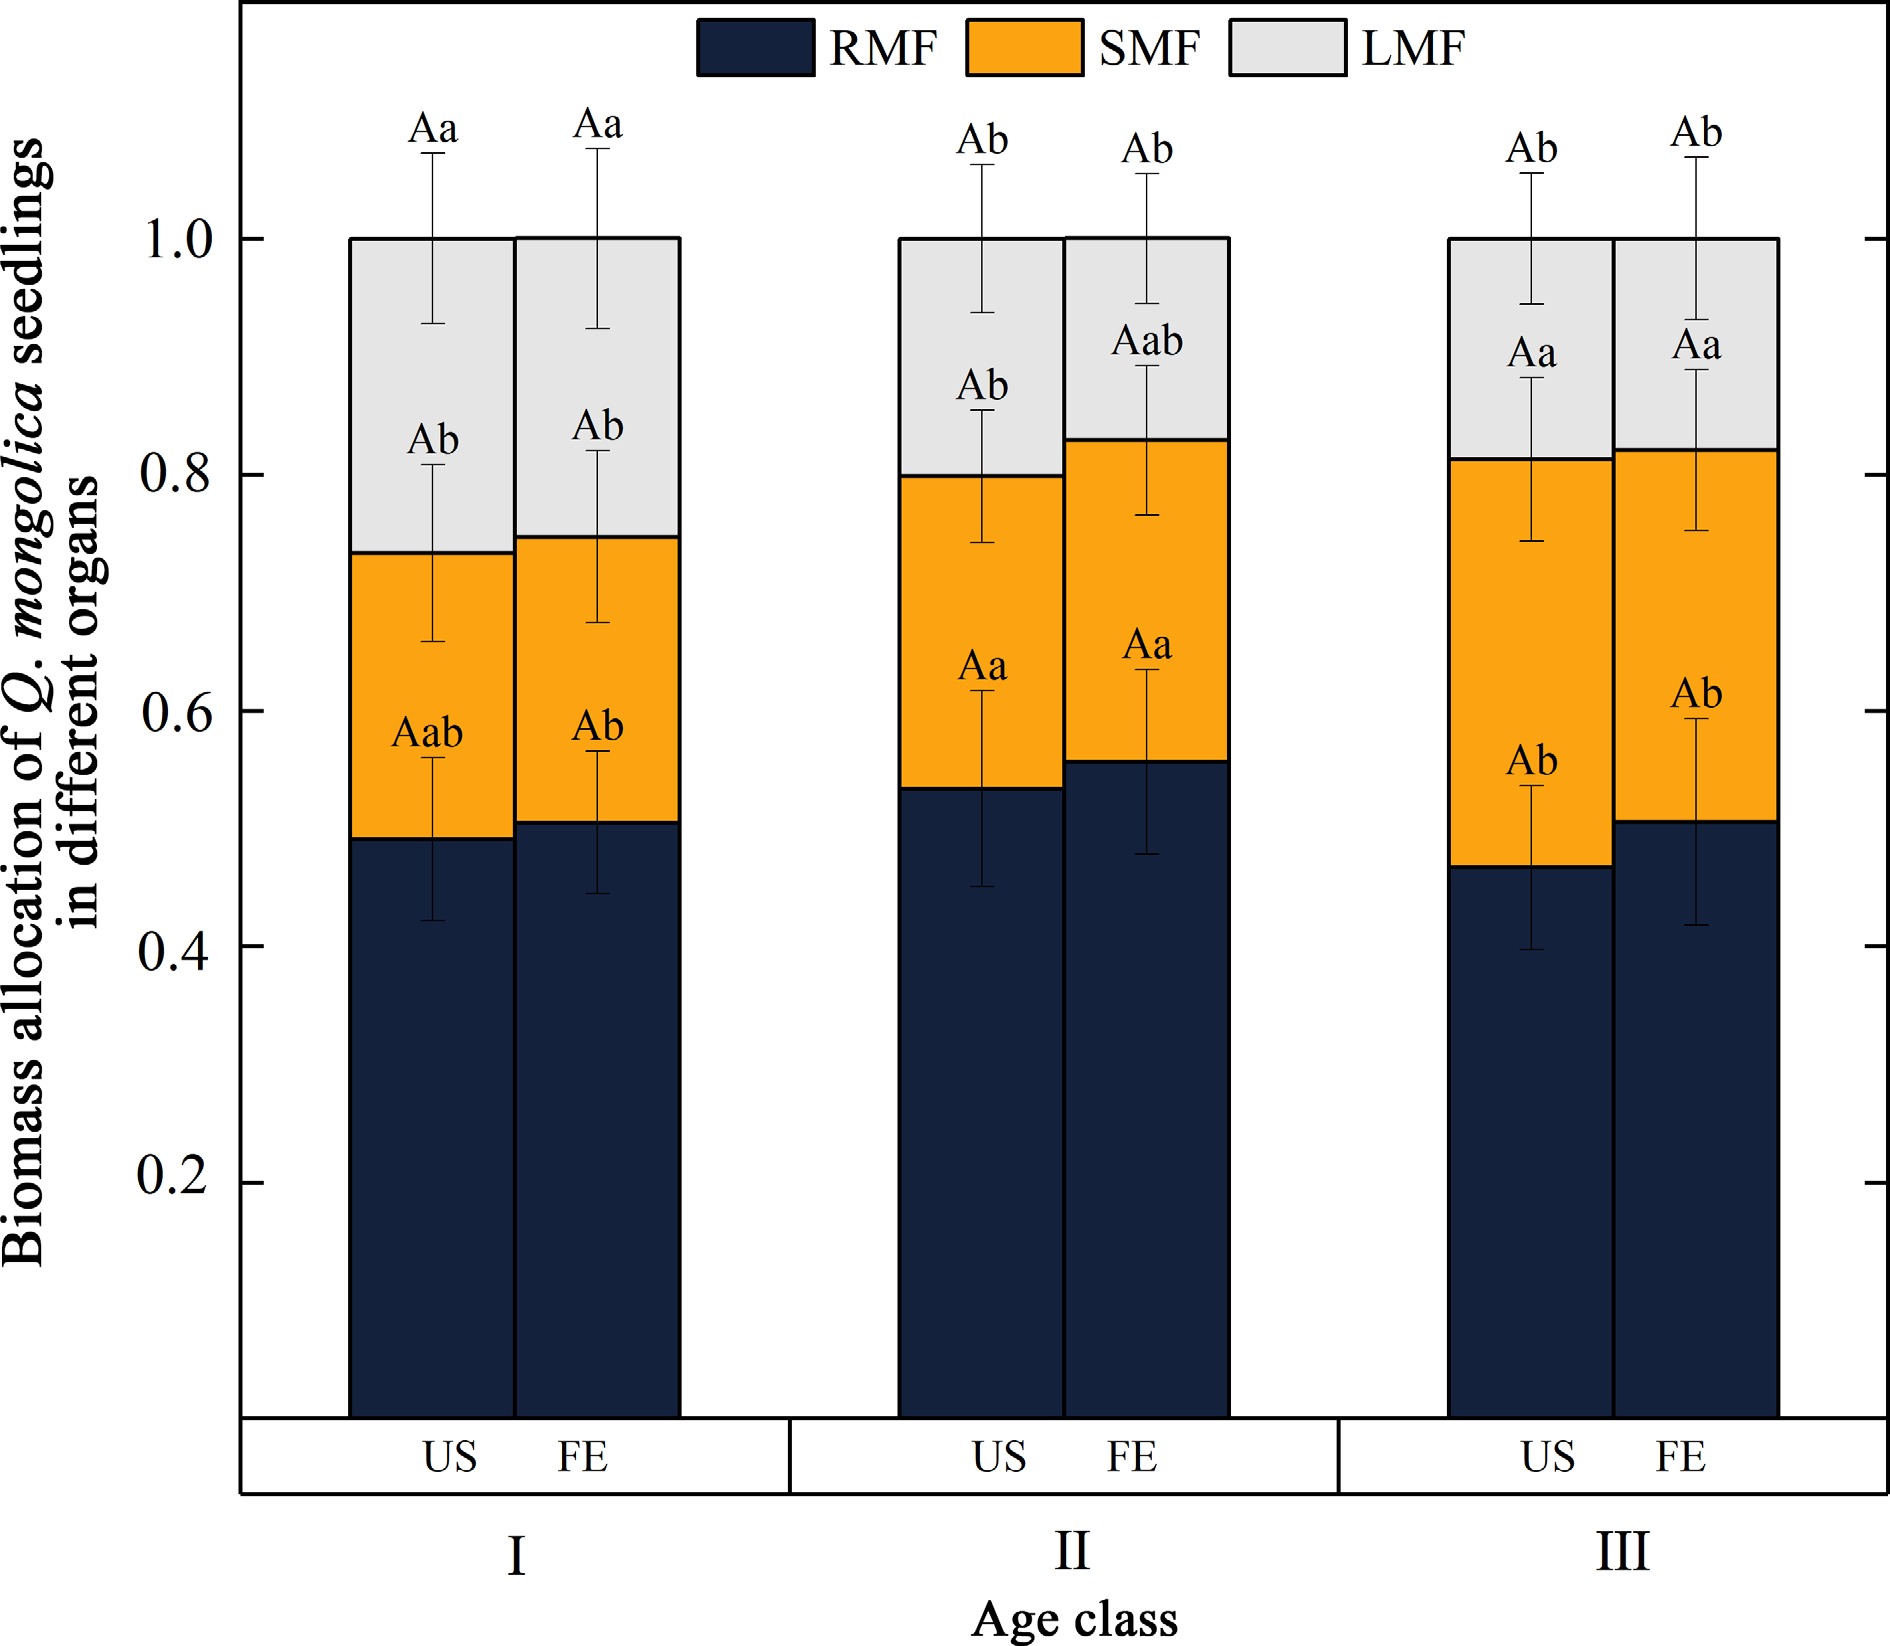
Figure 3.
Pattern of biomass allocation in Q. mongolica seedlings. (RMF) represents root mass fraction, (SMF) represents stem mass fraction, and (LMF) represents leaf mass fraction. (I, II, and III) stand for different age classes. Light environments include US (forest understory) and FE (forest edge). Different capital letters indicate significant differences in the indicators between different light environments at the same age (p < 0.05); different lower case letters indicate significant differences in the indicators between age classes at the same light environment (p < 0.05).
Non-structural carbohydrates
-
As can be seen in Fig. 4, the leaves had the highest concentration of SS, followed by the stems, while the roots had the lowest concentration of SS. SS concentrations in both roots and leaves of Q. mongolica seedlings at the forest edge were significantly lower than those of seedlings under the forest canopy (p < 0.01) (Fig. 4a, c).
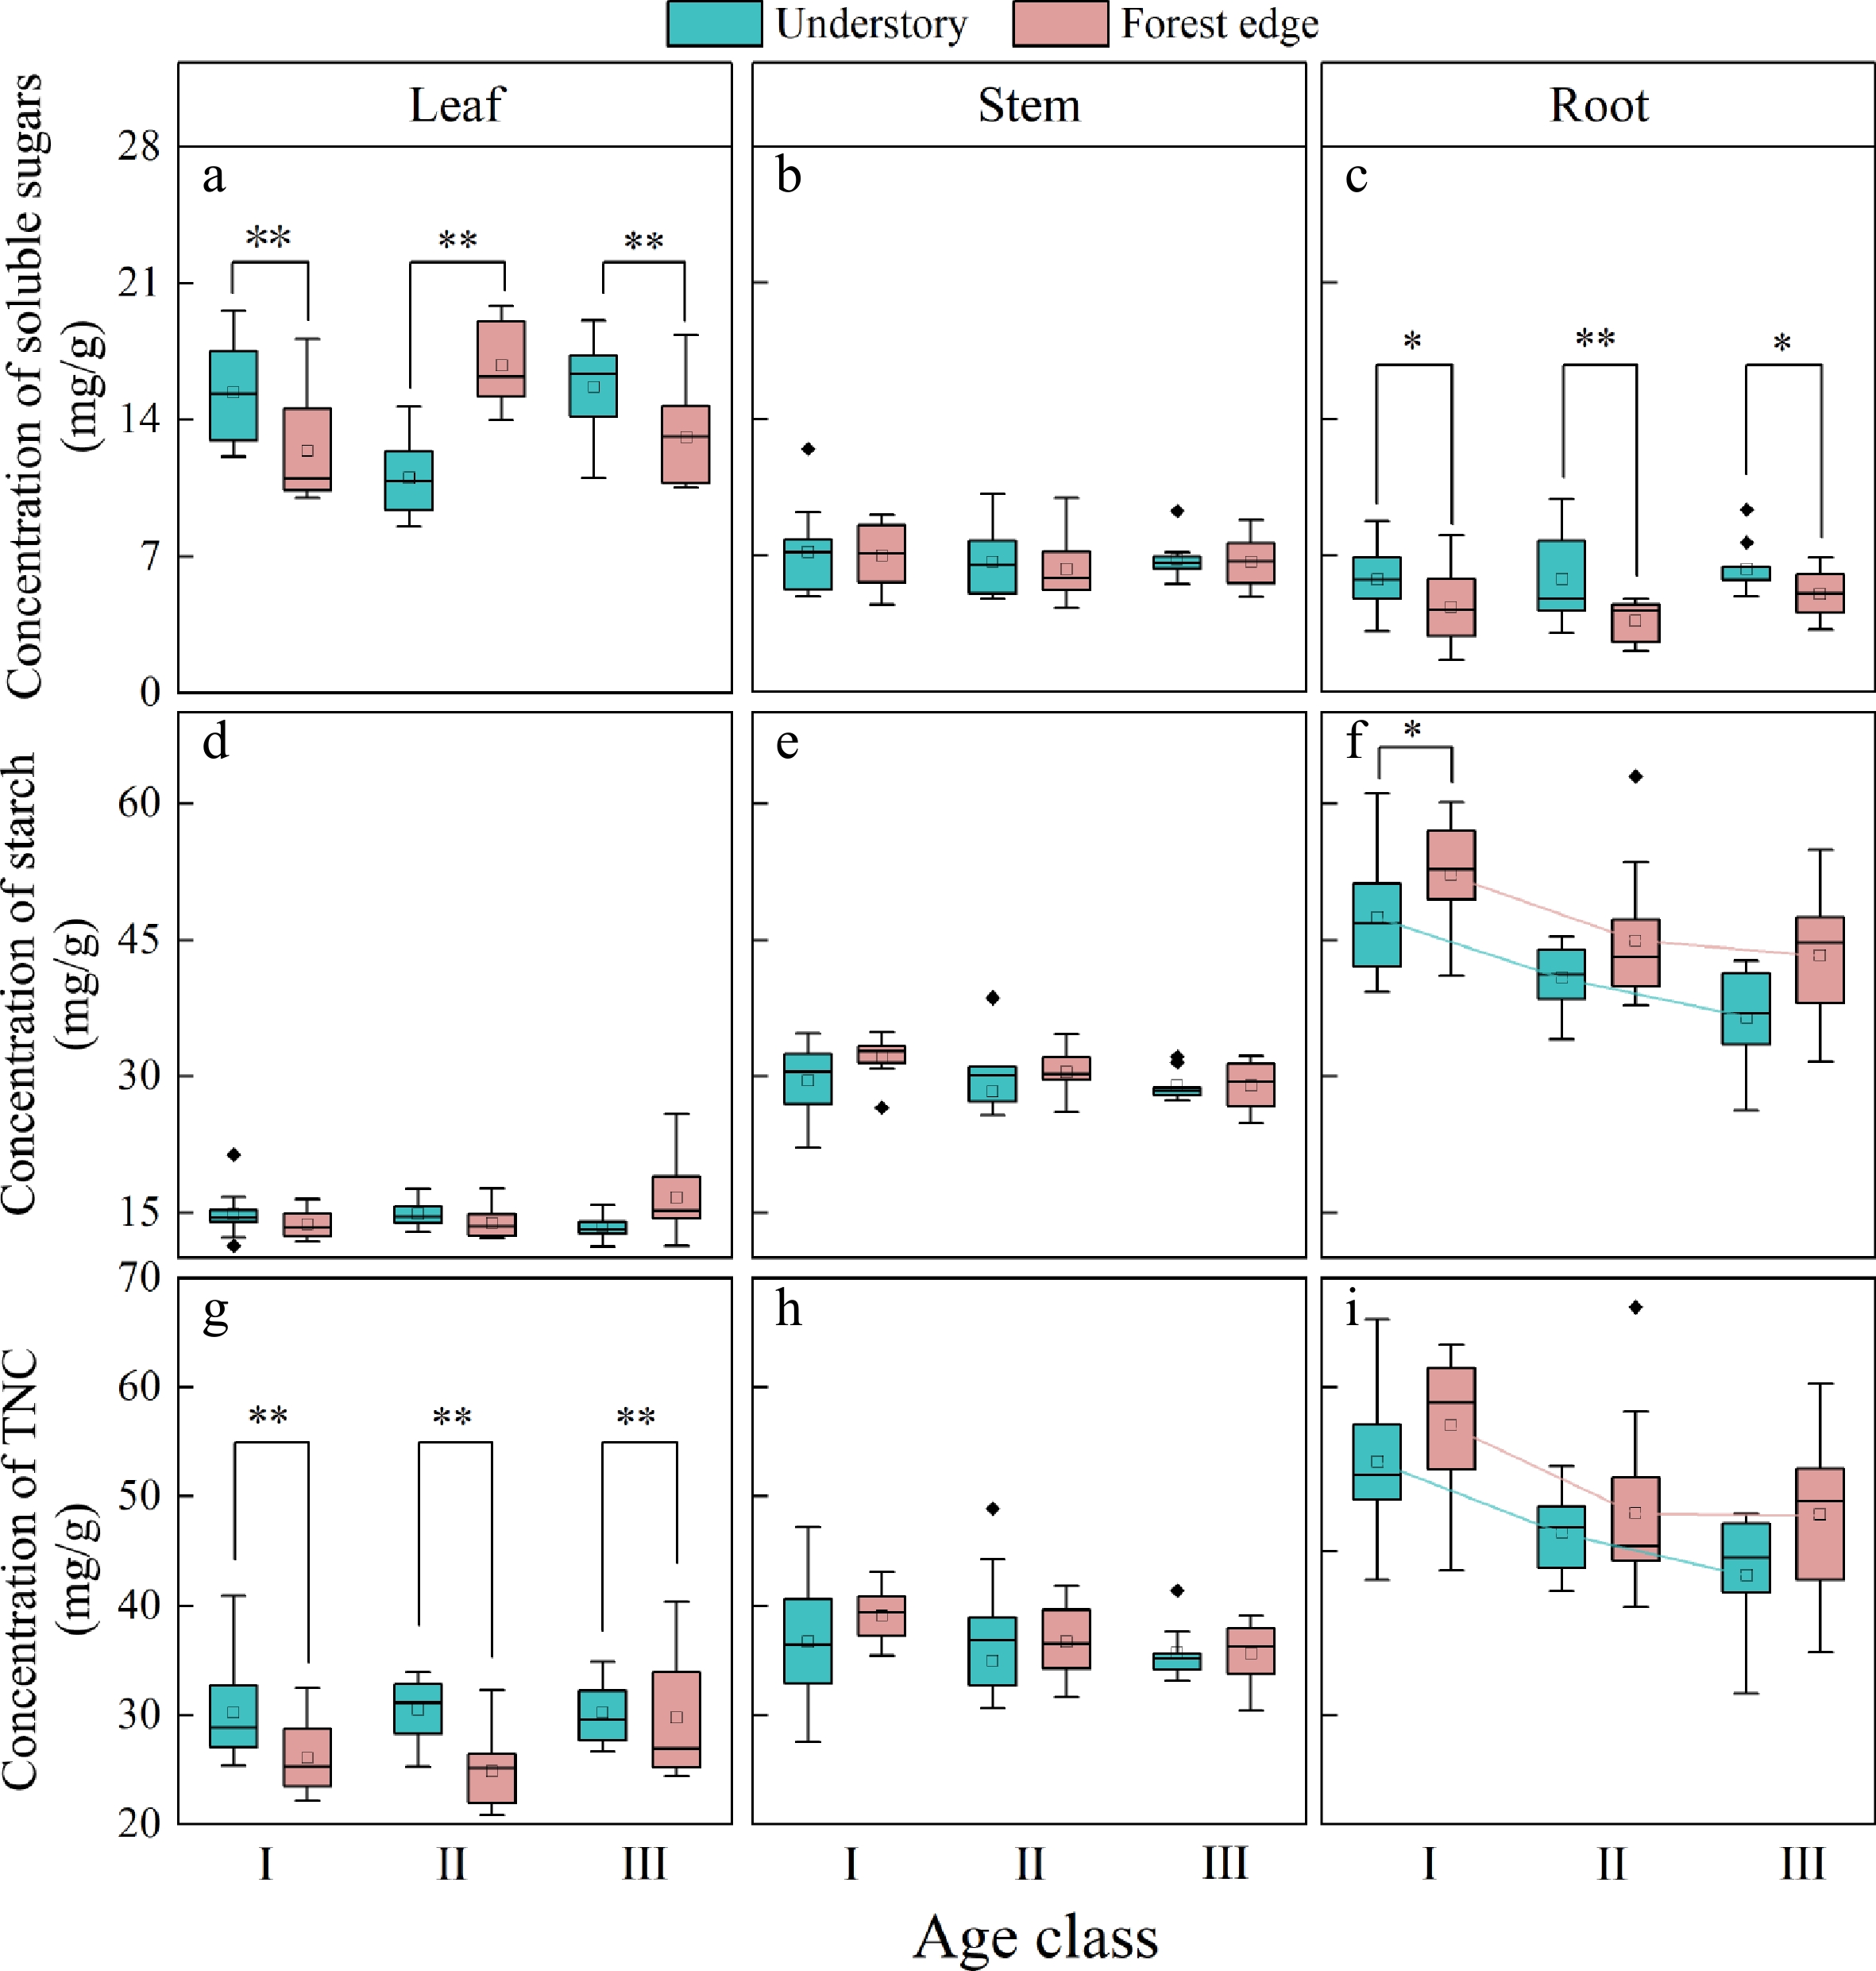
Figure 4.
NSC concentration of the individual organs in Q. mongolica seedlings. (a) Soluble sugar concentration in the leaves, (b) soluble sugar concentration in the stems, (c) soluble sugar concentration in the roots, (d) starch concentration in the leaves, (e) starch concentration in the stems, (f) starch concentration in the roots, (g) TNC concentration in the leaves, (h) TNC concentration in the stems, (i) TNC concentration in the roots. I, II, and III represent age classes. * stands for significance at a level of 0.05; **stands for significance at a level of 0.01.
Both the light conditions and the age of the seedlings had a significant influence on the ST concentration in the roots of the Q. mongolica seedlings (Table 6). Firstly, the seedlings at the forest edge showed a higher ST concentration in their root system than the seedlings under the forest canopy (Fig. 4f). In addition, significant differences were found in the ST concentration of the roots of Q. mongolica seedlings of age class I in different light environments (p < 0.05) (Fig. 4f). With increasing age of the seedlings, both the seedlings under the forest canopy and those at the forest edge showed a significant decrease in ST concentration in the roots (p < 0.01) (Fig. 4f).
Table 6. p-values of the linear mixed-effects models assessing the significance of the fixed and interaction effects of light environment and seedling age on NSC in Q. mongolica seedlings, as well as the model conditional R2 and the marginal R2 of the model.
Organs NSC Seedling age Light environment Light environment * seedling age Marginal R2/
Conditional R2Root SS 0.282 <0.01** <0.01** 0.221/0.414 ST <0.01** <0.01** <0.01** 0.362/0.458 TNC <0.01** 0.08 <0.01** 0.288/0.414 Stem SS 0.38 0.5 0.97 0.028/0.186 ST 0.33 0.15 0.61 0.069/0.133 TNC 0.24 0.28 0.7 0.058/0.175 Leaf SS 0.33 <0.01** 0.31 0.373/0.609 ST 0.08 0.86 <0.01** 0.143/0.419 TNC 0.12 <0.01** 0.08 0.262/0.402 SS (soluble sugars), ST (starch), TNC (total non-structural carbohydrates). Significance levels: * p < 0.05, ** p < 0.01. The TNC concentration in the leaves of Q. mongolica seedlings is significantly influenced by the light environment, whereas the TNC concentration in the roots mainly depends mainly on the age of the seedlings (Table 5). Moreover, the TNC concentration in the leaves of the seedlings at the forest edge is significantly lower than in the leaves of the seedlings under the forest canopy (p < 0.01) (Fig. 4g). In addition, the TNC concentration in the roots of Q. mongolica seedlings decreases significantly with increasing age of the seedlings in both light environments (p < 0.01) (Fig. 4i).
Effects of light environment on Q. mongolica seedlings of different age classes
-
As shown in Table 7, changes in the light environment mainly affected the NSC (non-structural carbohydrates) of the plants, with no significant effects on other functional traits, except for specific leaf area (SLA). The effects of light environment on NSC were mainly observed in the roots and leaves, with minimal effects on the stems. Leaf soluble sugar (SS) was significantly affected by light environment in seedlings of all three age classes. In particular, there were significant differences between the seedlings of the different age classes in the response of NSC in the roots to the light environment. The light environment significantly affected SS in the roots of seedlings of age class I, starch in the roots of seedlings of age class II, and both soluble sugars and starch in the roots of age class III. We also observed that the the seedlings of age class II were more sensitive to changes in light conditions, which is reflected in their higher significance level.
Table 7. p-values for linear mixed-effects models measuring the effects of light environment on functional traits and NSC concentrations in seedlings of different age classes, and conditional R2 and marginal R2 for the models.
Indicators Age class I Marginal R2/
Conditional R2Age class II Marginal R2/
Conditional R2Age class III Marginal R2/
Conditional R2SLA <0.01** 0.208/0.229 0.42 0.003/0.018 0.77 0.006/0.206 RMF 0.35 0.011/0.157 0.43 0.011/0.402 0.74 0.001/0.659 SMF 0.61 0.003/0.262 0.57 0.006/0.281 0.28 0.048/0.148 LMF 0.73 0.001/0.338 0.10 0.051/0.371 0.79 0.001/0.461 S/R ratio 0.29 0.013/0.143 0.36 0.015/0.373 0.61 0.005/0.496 Root SS 0.02* 0.132/0.443 0.07 0.248/0.704 0.03* 0.216/0.216 Root ST 0.14 0.128/0.458 <0.01** 0.106/0.354 0.04* 0.137/0.477 Root TNC 0.10 0.053/0.578 0.03* 0.021/0.282 0.12 0.093/0.336 Stem SS 0.77 0.026/0.334 0.57 0.011/0.215 0.39 0.024/0.422 Stem ST 0.06 0.131/0.362 0.46 0.023/0.023 0.86 0.001/0.288 Stem TNC 0.14 0.064/0.385 0.58 0.013/0.056 0.85 0.001/0.335 Leaf SS 0.04* 0.202/0.698 <0.01** 0.532/0.590 0.03* 0.395/0.841 Leaf ST 0.18 0.076/0.076 0.10 0.091/0.298 0.15 0.015/0.876 Leaf TNC 0.02* 0.214/0.395 <0.01** 0.462/0.462 0.01* 0.061/0.855 SLA (specific leaf area), RMF (root mass fraction), SMF (stem mass fraction), LMF (leaf mass fraction), S/R ratio (shoot-to-root ratio), SS (soluble sugars), ST (starch) and TNC (total non-structural carbohydrates). Significance levels: * p < 0.05, ** p < 0.01. Correlation analysis of Q. mongolica seedlings of different age classes
-
As shown in Fig. 5, in age class I, we observed a strong positive correlation between SS in all organs. In particular, SS in roots showed a significant positive correlation with SS in both stems and leaves (p < 0.01) (Fig. 5a). In the age class II, a significant negative correlation was observed between root ST and leaf SS (p < 0.05) (Fig. 5b). In the seedlings of age class III, a significant positive correlation was observed between stem SS and leaf SS (p < 0.05). In addition, stem ST correlated significantly with root ST and TNC (p < 0.01) (Fig. 5c).
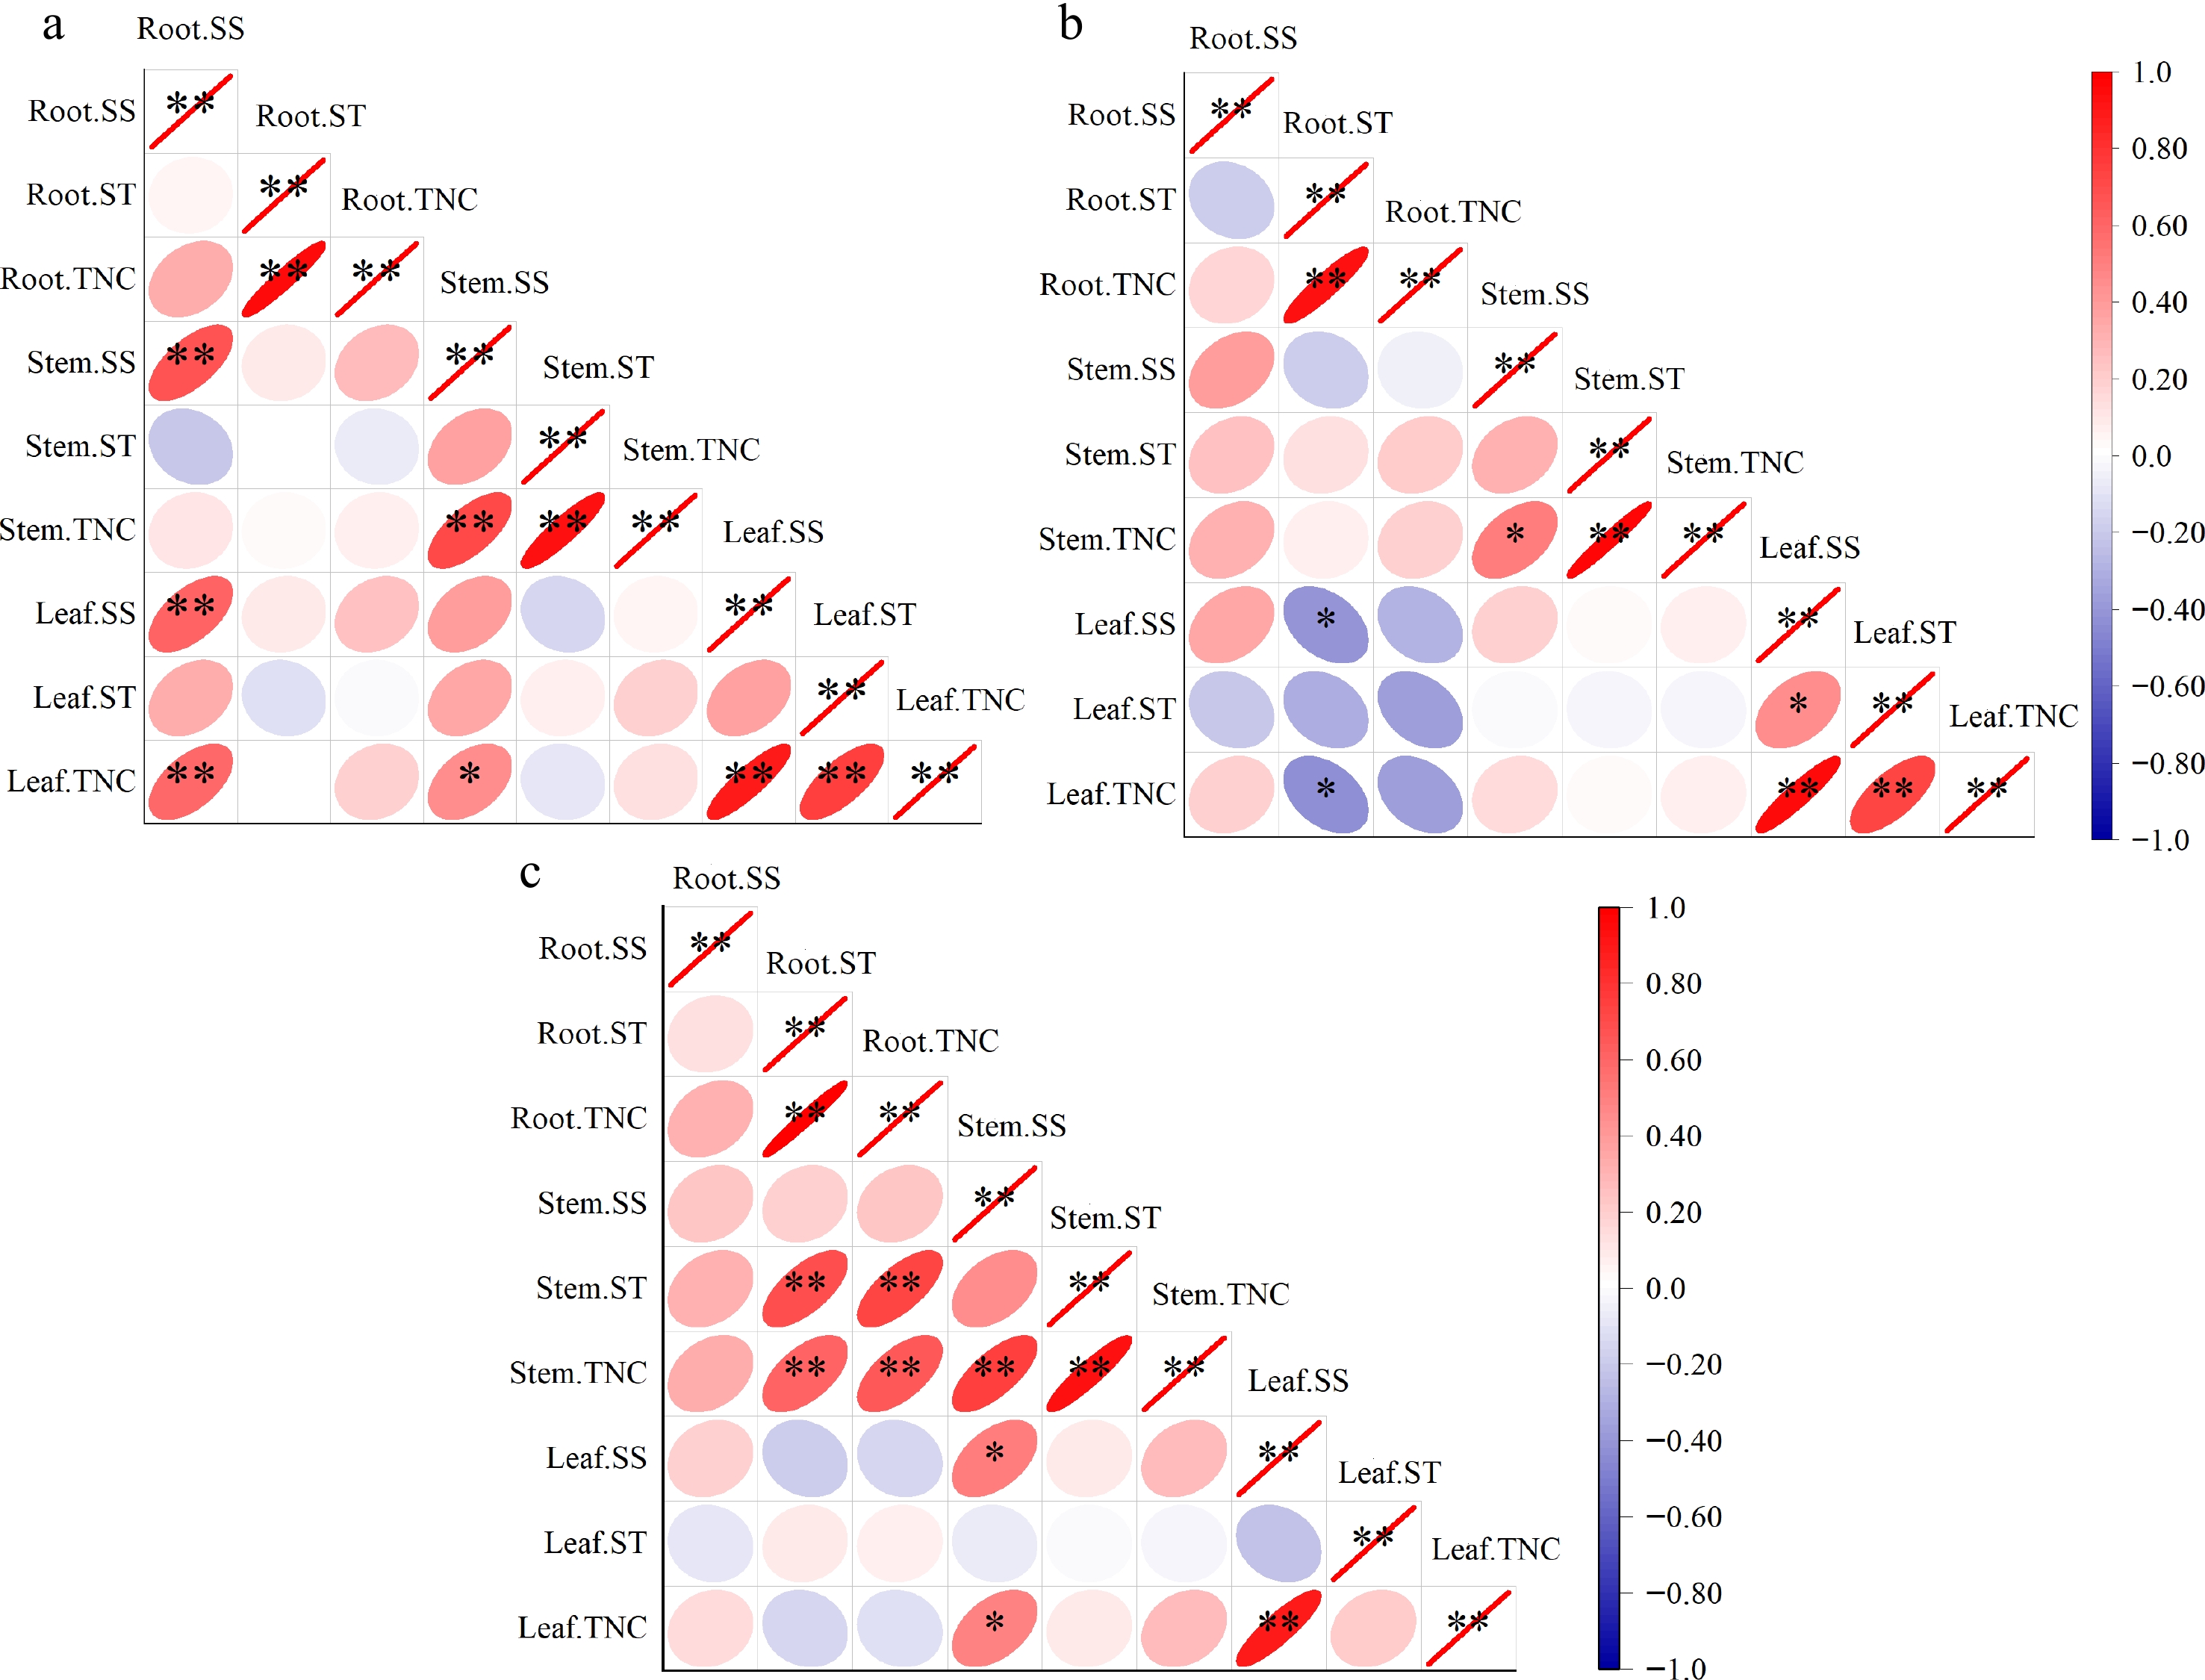
Figure 5.
Correlation analysis between the NSC concentrations of Q. mongolica seedlings in different age classes (Pearson). (a) 1−2 years old, (b) 3−4 years old, (c) 5−6 years old. Red stands for a positive correlation and blue for a negative correlation. The darker the colour, the higher the correlation. * stands for significance at a level of 0.05; ** stands for significance at a level of 0.01.
The relationship between relative light intensity and seedling traits
-
Combining all age classes and performing a linear regression analysis between relative light intensity (RLI) and seedling traits, as shown in Fig. 6, reveals several remarkable results. We found a statistically significant negative linear relationship between the RLI and the SS and TNC in the leaves of Q. mongolica seedlings (p < 0.01) (Fig. 6a, b). Conversely, a significant positive linear relationship was observed between the RLI and the ST values in the roots (p < 0.01) (Fig. 6c). In our study, we also analyzed possible correlations between RLI and other seedling traits. However, we found that these correlations were not significant (p > 0.05) and are therefore not presented in detail in this article.
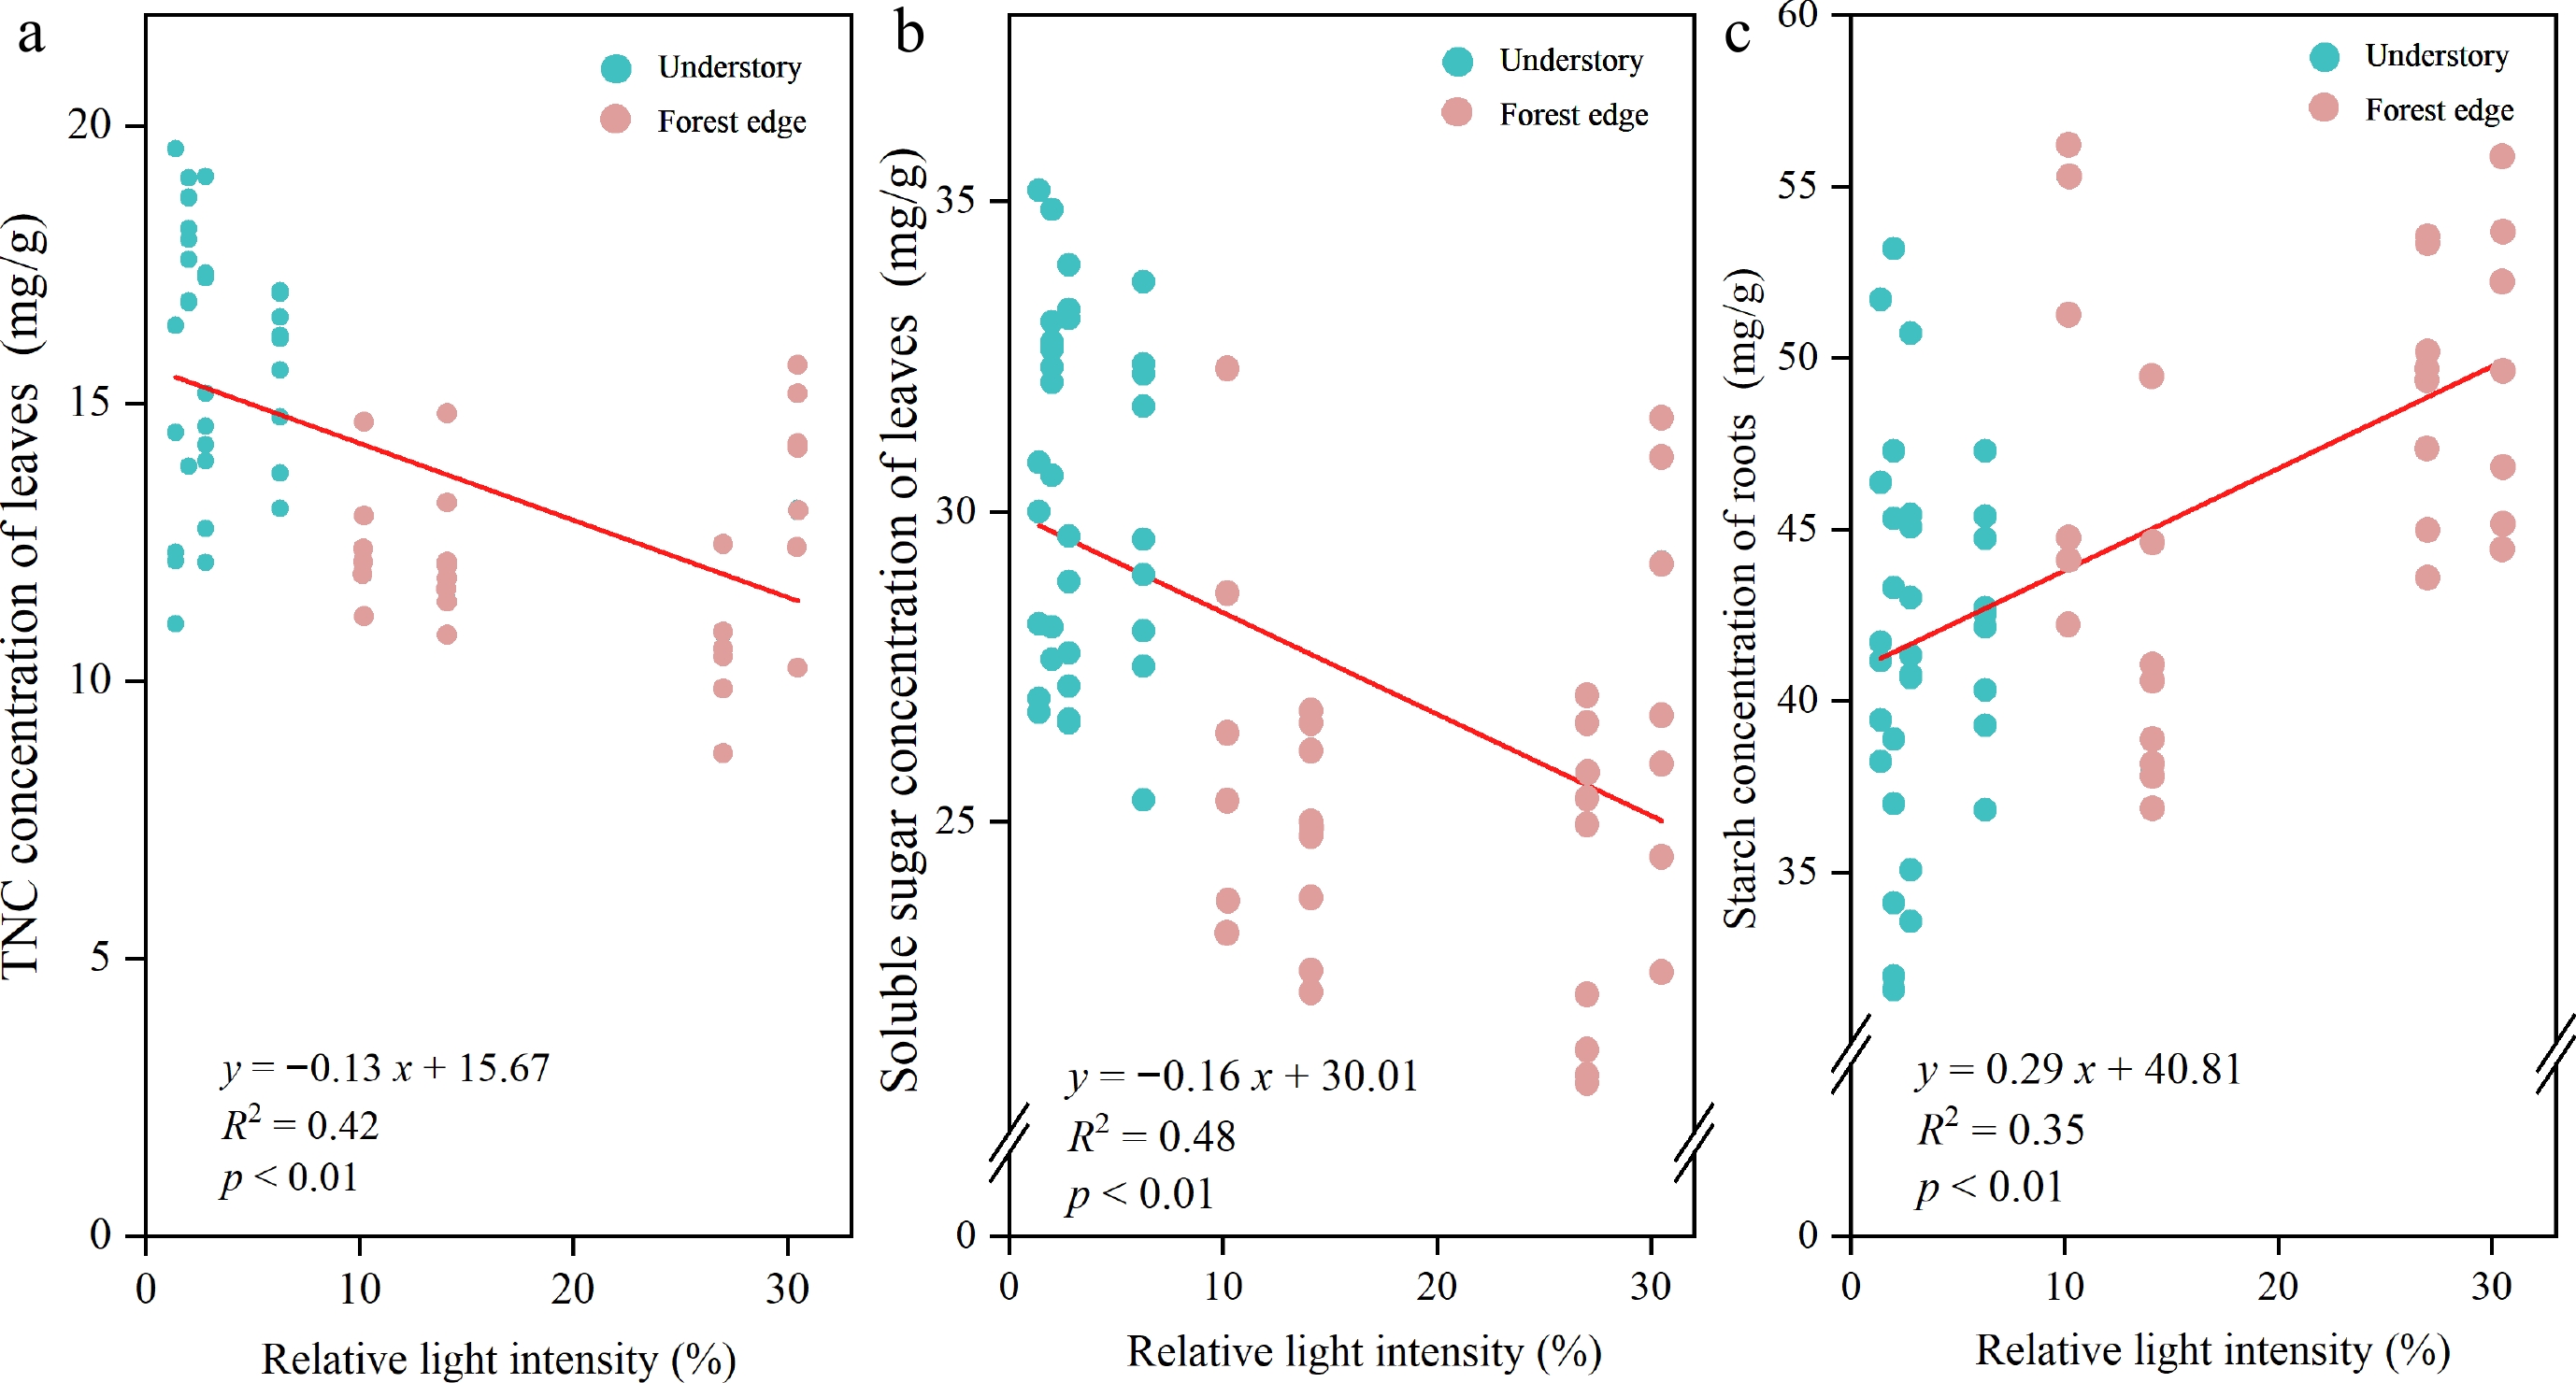
Figure 6.
The correlation relationships between the relative light intensity and the (a) TNC concentration in the leaves, (b) the soluble sugar concentration in the leaves and (c) the starch concentration in the roots. The equation of the linear regression, the r-square and the p-values are also shown in the graph.
-
Specific leaf area (SLA) reflects a plant's ability to convert and utilize light energy, making it an important functional trait for plant adaptation to different environments[27]. In this study, the SLA of Q. mongolica seedlings was higher under the forest canopy than at the forest edge (Fig 1), which is consistent with the results of previous studies[28,29]. This could be due to the fact that SLA is closely related to the light environment to which the plant is exposed. When the plant is exposed to low light for a prolonged period of time, it tends to increase the surface area of its leaves to increase its photosynthetic capacity[30]. In general, the SLA of woody plants decreases with age[31]. The leaves of older plants usually need to increase their biomass per unit area to withstand external stresses. The decrease in SLA and the increase in leaf dry matter concentration corresponded to a shift towards more conservative foliar strategies in older plants[32]. However, in this study, the effect of age on SLA was not statistically significant, probably due to the relatively narrow age range of the seedlings used.
In addition to expanding the crown structure to increase resource acquisition capacity, plant seedlings adapt the allocation of resources to different organs in response to their environment[30]. Our study confirmed that age significantly affects biomass distribution in woody plants[2]. It was found that biomass at the young plant stage of Q. mongolica was predominantly distributed between leaves and stems, with SMF increasing and LMF decreasing with age (Fig. 3). Studies by Poorter et al.[1] have shown that larger plants generally allocate proportionally more resources to the stems to support the sunlight-exposed position of the leaves. In addition, stems, as organs that support leaf growth, were found to significantly influence leaf distribution and light resource acquisition, which is consistent with our findings on the effects of age on SMF. In addition, LMF gradually decreased with age, probably due to the leaf area reaching a certain value at which further increase in leaf biomass no longer leads to more photosynthesis and thus more energy production for the plant. The shoot-to-root ratio (S/R ratio) reflects the trade-off between the belowground and aboveground growth strategies of plants[33]. We found that the S/R ratio of Q. mongolica reached its minimum at age class II (Fig. 2), indicating a greater allocation of resources to root biomass at this stage. Liu et al.[34] found that Quercus variabilis invested more in the root system at the early seedling growth stage, which was an ecological strategy to counter abiotic stress. Similarly, Krasowski & Caputa[35] observed that more biomass was invested in the root system to increase water and nutrient uptake capacity and to preserve resources for growth and development in the early stages. Taken together, these results suggest that increased investment in the root system is an important adaptive strategy for early plant responses to environmental stress. However, the aboveground biomass ratio of perennial woody plants generally increases with age, accompanied by an increase in the S/R ratio[36]. This could be due to the fact that seedlings have to devote more resources to shoot development in order to achieve a height advantage[37]. These results are consistent with our own findings, as we also observed a significant increase in the S/R ratio in 5−6 year old Q. mongolica seedlings compared to 1−4 year old seedlings (Fig. 2).
Effect of light environment and seedling age on the NSC of Q. mongolica seedlings
-
The leaves are important organs of plants for photosynthesis. Our study showed that the leaves of Q. mongolica seedlings at the forest edge, where light intensity was higher, had lower SS concentrations (Fig. 4a). In contrast, some studies indicated that increasing light intensity leads to higher concentrations of soluble sugars in plant leaves[38−40]. This discrepancy could be related to the tree species, the age of the plants, the light gradient and the light sensitivity of the plants. Another possible explanation is that plants are better able to utilize soluble sugars better under higher light conditions, allowing them to convert these sugars into energy to support growth and metabolism, which reduces their accumulation in leaves and roots[30] (Fig. 4a, c). Moreover, we observed no significant changes in ST concentrations in leaves under different light conditions and seedling age, which is consistent with the results of Chantuma et al.[41]. These results also showed that SS is the most important component affecting the dynamic changes of TNC in leaves[42,43]. The similar changes in SS concentration and TNC concentration support this conclusion (Fig. 4a, g).
As the organ connecting roots and leaves, stems have a stable tissue structure. Our analyses showed that the light environment and the age of the plant had no significant effect on the NSC of the stems of Q. mongolica (Fig. 4b, e, h). Compared with the adjustment of the concentrations of NSC components in response to environmental stress, the stem tends to increase biomass for rapid vertical growth while avoiding being shaded by the forest canopy[44].
While the roots are the main energy storage organ of a plant, the ST is the main energy store of Q. mongolica seedlings[20]. Moreover, in this study, ST concentration in roots was about 8−10 times higher than SS concentration (Fig. 4c, f), suggesting that ST is the major determinant affecting TNC in roots. The concentrations of ST and TNC in the roots of Q. mongolica seedlings decrease significantly with age (Fig. 4f, i). These results may be due to the fact that the younger Q. mongolica plants are relatively sensitive to environmental stress compared to the older plants. Therefore, the former require much higher concentrations of ST to maintain biomembrane stability through osmotic adaption in cold or low-light environments and survival through winter[45].
Light adaptation strategies of Q. mongolica seedlings at different ages
-
The dynamic characteristics of NSCs at different growth stages of plants may reflect the growth patterns of plants and their adaptation strategies to environmental changes[46]. Moreover, the NSCs of the roots and the leaves of Q. mongolica seedlings were significantly affected by the interaction between the age of the seedling and the light environment (Table 6). Therefore, we will treat the Q. mongolica seedlings of different age classes separately. In age class I (1−2 years old), we observed a significant positive correlation between the SS in the roots and the SS in the stems and leaves (p < 0.01) (Fig. 5a). This indicates a high level of functional coordination between these organs, which contributes to overall plant growth and survival[47]. In addition, SS is an agent substance that can flow between the organs of the plant to meet the energy requirements of the different organs[48]. In our study, the significant positive correlations between the soluble sugars in different organs indicate that the seedlings in this age class can efficiently allocate carbon resources among organs according to their needs. At the same time, we found that the light conditions had no significant effect on the ST of the seedlings in age class I (Table 7). We believe that this is due to the fact that the seeds of Q. mongolica are characterised by abundant biomass and high starch content[7]. The abundant energy reserves of the seeds may provide the energy for the initial growth of Q. mongolica and reduce its light requirement. In addition, studies by Gang et al.[7] have shown that the main energy sources for the growth of annual Q. mongolica seedlings are the photosynthetic products of the annual leaves and storage materials such as NSC and large seeds. Gao et al.[49] have shown that after germination of oak seeds, the nutrients from the cotyledons are transferred to the root system so that the main root has sufficient nutrients to sustain the life and further growth of the seedlings.
Our study revealed a significant negative correlation between roots ST and leaves SS (p < 0.05) in the age class II Q. mongolica seedlings, indicating the conversion of various non-structural carbohydrates (Fig. 5b). With increasing relative light intensity, we observed an increase in roots ST and a decrease in leaves SS (Fig. 6b, c). This could reflect the plant's strategy to redistribute carbon resources in response to different light conditions. Higher light conditions could promote the transfer of SS from the leaves to the roots, where they are further converted into starch to support root development. Such a strategy improves the adaptation of seedlings to different environmental conditions and thus their ability to survive. Similar conclusions have been drawn by some researchers who indicated that plants under strong light conditions invest more in their root system to promote well-developed roots[9,50]. It has also been shown that plants transfer sugars from photosynthetic leaves to food storage cells, which determines the physical health of plants[51]. In terms of plant genetic characteristics, Q. mongolica is found in nature mainly on mountain ridges, slopes and other steep areas. Due to the poor soil and unfavourable terrain, Q. mongolica requires a strong root system to complete the planting process, maintain stable branches and facilitate the uptake of nutrients from the soil. As a result, 3−4 year old Q. mongolica seedlings may tend to strengthen their roots to adapt to more difficult environmental conditions in the future instead of supporting current growth.
In age class III, a significant positive correlation is observed between the NSC of the roots and the NSC of the stems (p < 0.01) (Fig. 5c). This indicates an interaction of carbon flux between roots and stems that enables efficient nutrient allocation between the above- and below-ground parts of the plant. In addition, the S/R ratio of age class III seedlings increases significantly compared to age class II seedlings (Fig. 2), indicating an increased investment in aboveground biomass. These results indicate that after the initial root colonisation, Q. mongolica began to focus on the simultaneous development of roots and stems, and gradually shifted the emphasis to the aerial parts. We therefore assume that the adaptation strategy of Q. mongolica in age class III gradually shifts from the underground to the aboveground parts. On the one hand, seedlings rely on high stem growth to maximize the use of light resources for photosynthesis to promote growth, and on the other hand, plants invest more in root biomass to maximize nutrient uptake from the soil and survive periods of stress[52]. We also found that the previously significant negative correlation between leaf SS and root ST is no longer present in age class III seedlings. This suggests that the synthesis of ST in the roots of age class III seedlings is less dependent on the transfer of SS from the leaves. The root system relied on its own growing fine roots and the root surface to take up nutrients from the soil and promote root and stem development, reducing the pressure on leaf photosynthesis to some extent.
-
Our study reveals non-structural carbohydrate allocation strategies and functional traits in Q. mongolica seedlings under different light conditions and ages. We observed significant differences in the adaptation strategies of Q. mongolica seedlings at different ages. Firstly, our study showed a strong coordination of soluble sugars between roots, stems and leaves of 1−2 year old Q. mongolica seedlings, suggesting an efficient distribution of carbon between organs at this age stage. In addition, the abundant energy reserves in the oak seeds appear to reduce their dependence on light conditions in the early growth stages. For 3−4 year old Q. mongolica seedlings, a significant negative correlation between root starch and leaf soluble sugar was observed. With increasing light intensity, root starch increased while leaf soluble sugar decreased. This indicates that plants allocate more resources to the root system, promoting robust root growth to adapt to diverse environmental conditions and enhance survival capabilities. Moreover, 5−6 year old Q. mongolica seedlings begin to invest more in aboveground growth to gain a height advantage. The above results also indicate that the effects of light on the growth of Q. mongolica seedlings change with age. In conclusion, our study improves the understanding of light adaptation strategies of Q. mongolica seedlings and provides valuable insights for supporting natural regeneration and management of forest vegetation.
-
The authors confirm contribution to the paper as follows: conceptualization: Yang L; methodology: Tang G; software: Tang G; validation: Yang L, Tang G; formal analysis: Tang G; investigation: Tang G, Zhang H, Xing H, Yuan T; resources: Tang G; data curation: Tang G, Zhang H, Xing H, Yuan T; writing - original draft preparation: Yang L, Tang G; writing - review and editing: Gontcharov AA, Yang L, Tang G. All authors reviewed the results and approved the final version of the manuscript.
-
All data generated or analyzed during this study are included in this published article.
This work was supported by grants from the Fundamental Research Funds for Central Universities of China (2572022AW14 and 2572022DS01). The authors would like to thank TopEdit (
www.topeditsci.com ) for its linguistic assistance during the preparation of this manuscript. The authors would also like to thank to Dr. Kombi Kaviriri David for proofreading the English expression of this manuscript.-
The authors declare that they have no conflict of interest.
- Copyright: © 2024 by the author(s). Published by Maximum Academic Press, Fayetteville, GA. This article is an open access article distributed under Creative Commons Attribution License (CC BY 4.0), visit https://creativecommons.org/licenses/by/4.0/.
-
About this article
Cite this article
Tang G, Zhang H, Xing H, Yuan T, Gontcharov AA, et al. 2024. Light adaptation strategies of Quercus mongolica at different ages in four plantations. Forestry Research 4: e005 doi: 10.48130/forres-0024-0002 

Light adaptation strategies of Quercus mongolica at different ages in four plantations
- Received: 20 June 2023
- Revised: 27 December 2023
- Accepted: 25 January 2024
- Published online: 27 February 2024
Abstract: This study investigated the allocation strategies of non-structural carbohydrates and functional traits in Quercus mongolica seedlings of different ages under different light conditions. The study took place at the Urban Forestry Demonstration Base in Harbin City, Heilongjiang Province, China. Seedlings of three age classes were collected in two light environments, the forest edge and the forest understory. By measuring specific leaf area, biomass, soluble sugar concentration and starch concentration, we revealed the growth adaptation strategies and responses to different light conditions in Q. mongolica seedlings of different age classes. Our results show that the adaptation strategies of seedlings of different age classes are very different. First, our study showed a strong coordination of soluble sugars between roots, stems, and leaves of 1−2 year old Q. mongolica seedlings, indicating an efficient partitioning of carbon between organs at this age. In 3−4 year old Q. mongolica seedlings, a significant negative correlation was observed between starch in the roots and soluble sugars in the leaves, indicating the transformation of various non-structural carbohydrates. In addition, 5−6 year old seedlings start to increase their investment in the above-ground part to achieve a height advantage. In conclusion, this study improves our understanding of the light adaptation strategies of Q. mongolica seedlings and provides valuable insights for the natural regeneration and management of Q. mongolica forest vegetation.