


-
Most plants cannot survive under alkalinity stress. Alkalinity stress can strongly inhibit plant growth[1−3]. Citrus is one of the most important economic fruit crops worldwide. Alkalinity stress has serious negative effects on citrus plant growth, fruit quality and yield. Ziyang xiangcheng (Citrus junos Sieb. ex Tanaka) (Cj) is a citrus rootstock that is tolerant to alkalinity stress[4]. Thus, in depth study of the mechanism of its alkalinity stress tolerance is warranted.
Lateral root (LR) formation is important for the root system to cope with the uptake and transport of water and nutrients and various abiotic stresses[5,6]. Auxin acts as an integrator of numerous endogenous and exogenous LR development regulation signals, including abscisic acid (ABA), jasmonate (JA), cytokinin (CK) and nutrients[6−9]. For instance, the Arabidopsis slr-1/iaa14 mutant completely lacked lateral roots[10]. Overexpression of GH3.6, which functions in conjugating amino acids to IAA, in Arabidopsis severely reduces the number of prebranch sites and LRs[11]. ABA and CK inhibit LR formation by upregulating the ABI4 transcription factor through the reduction of polar auxin transport[12].
JA is a significant phytohormone that is involved in plant responses to drought stress, salt stress, alkalinity stress, wounding and so on[4,13]. Many studies have shown that JA plays a positive role in salt and alkalinity stress responses in plants[4,14−20]. However, fewer studies have examined the role of JAs in response to alkalinity stress than in response to salt stress. Several studies have shown that JAZ proteins, such as TIFY10[21] and GsJAZ2[22], play positive roles in the response to alkalinity stress. Overexpression of GsJAZ2 in Arabidopsis was found to enhance tolerance to salt and alkalinity stress[22]. Moreover, JAs are involved in regulating plant root growth. Chen et al.[23] reported that JA reduced both the cell number and cell length of the root through MYC2 by repressing the expression of PLT1 and PLT2. Several studies have shown that low concentrations of JA inhibit primary root growth and promote LR formation in Arabidopsis[24,25]. In addition, JA plays roles in regulating lignin biosynthesis. Denness et al.[26] showed that lignin biosynthesis is regulated by an ROS- and JA-dependent process. In cultured Arabidopsis thaliana cells, JAs are involved in repression of the cell cycle and the biosynthesis of phenylpropanoids[27].
Under alkalinity stress, a high environmental pH is the main factor that affects root growth and development. Some studies have shown that plasma membrane H+-ATPase plays an important role in the adaptation of roots to alkalinity stress by mediating proton secretion[28,29]. For instance, the protein kinase PKS5 functions in inhibiting the expression of plasma membrane H+-ATPase, and thus, loss-of-function PKS5 mutant Arabidopsis plants are more tolerant to high pH stress due to the extrusion of protons into the extracellular space. In addition, chaperone J3 promotes the expression of plasma membrane H+-ATPase by repressing PKS5, and J3. Arabidopsis plants are hypersensitive to alkalinity stress. Under abiotic stress, numerous factors are involved in the regulation of plasma membrane H+-ATPase[30]. Auxin is one of these factors, and it also plays a role in regulating the activity of plasma membrane H+-ATPase. For example, PIN2, an auxin efflux transporter, is required for the acclimation of roots to alkalinity stress by regulating H+ secretion in the root tip and maintaining primary root elongation[2].
Abiotic stress is known to induce oxidative stress. The formation of reactive oxygen species (ROS), such as superoxides and hydroxy and peroxy radicals, in excess can disturb normal metabolism through oxidative damage to lipids, proteins, and nucleic acids. To defend against oxidative stress, plants detoxify ROS by the induction of antioxidative enzymes, such as peroxidase (POD), glutathione (GSH), ascorbate peroxidas (APX), catalase (CAT) and superoxide dismutase (SOD). The positive role of ROS scavengers in environmental stress tolerance has been reported in several plant species, such as citrus[31], wild tomato[32,33], rice[34,35], cotton[36], wheat[37], sesame[38] and purslane[39]. Recent reports have shown that the application of exogenous reduced GSH or increasing endogenous GSH confers tolerance to both drought and salt stress in Arabidopsis[40,41].
Grafting is the most important reproductive mode for citrus cultivation. Rootstocks can influence multiple aspects of scions in citrus (such as fruit quality, canopy size, and resistance)[42]. Cj is widely used as an alkalinity-tolerant citrus rootstock in areas of China with calcareous soils. However, Pt, the most widely used rootstock in China, is sensitive to alkalinity stress. Scions grafted onto Pt show nutritional deficiency and growth retardation phenotypes in calcareous soil. In this study, the scion cultivar Lane Late navel orange was grafted onto Cj and Pt, respectively. The grafted materials Cj + LL and Pt + LL planted in calcareous soil were used to perform comparative analyses, including assessments of the transcriptome and metabolites.
-
Two citrus rootstocks, Ziyang xiangcheng (Citrus junos Sieb. ex Tanaka) (Cj) and Poncirus trifoliata (Poncirus trifoliata (L.) Raf.) (Pt), and one navel orange scion, 'Lane Late' navel orange (Citrus sinensis (L.) Osb.) (LL), were used in this study. LL was grafted separately onto Cj and Pt. The grafted materials Cj + LL and Pt + LL (rootstock + scion) were planted in 2009, a total of approximately 1,520 trees (approximately 800 Cj + LL trees and approximately 720 Pt + LL trees, of which 80 trees died) were alternately planted in the orchard (Fig. 1a). The 'Lane Late' navel orange orchard located in Yuxiakou Town, Changyang City, Hubei Province, China, situated 1,500 meters below sea level in the Qingjiang River Basin, with a subtropical monsoon climate and an average annual sunshine duration of over 1,500 h. The spacing between single plants and rows was 3 m × 4 m, materials in the same column were consistent, Cj + LL and Pt + LL were planted alternately. For the experiments, we first evaluated the growth status of two materials, which represented consistency, the Cj + LL showed stronger nutritional growth ability than Pt + LL. Thirty trees were selected from the central sunny area and every five trees constituted one biological replicate, three biological replicates were considered sufficient. Fruits of the same size without pests and diseases was collected from the middle and lower parts of the tree. All samples were harvested in 2015, which was the third year these trees bore fruits. Root, stem and leaf samples were harvested at 140 DAF (days after flowering). After harvesting, these samples were separated into two portions. One portion was packaged in a Kraft envelope for mineral element measurements; the other portion was frozen rapidly in liquid nitrogen and kept at −80 °C for RNA sequencing and measurement of biochemical indices. The fruit samples were harvested at 140, 210, 240, 270 and 300 DAF. Two representative fruits were sampled from each tree at each developmental stage. Hence, 30 fruits were sampled for each grafted material at each developmental stage.

Figure 1.
The planting mode and different performance of (a) trees and (b) fruits of Cj + LL and Pt + LL, and (c) the fruit quality data of peel color parameters, single fruit weight, total soluble solid and titratable acid of Cj + LL and Pt + LL at five different development stages. Cj + LL: Ziyang xiangcheng + Lane Late navel orange; Pt + LL: Poncirus trifoliate + Lane Late navel orange. DAF: days after flowering. Bars represent the standard error (n = 3). A single asterisk (*) represents statistically significant differences (p < 0.05). Analyzed using t test.
A laboratory simulation experiment was designed and performed. Seeds of Cj and Pt were used in this experiment. According to the method described in our previous study[4], the plants were cultured with nutrient solution for 8 weeks. The pH values of the nutrient solutions were adjusted with 0.1 M NaOH and HCl. Three different pH gradients (6.5, 8.0 and 9.5) were set up. The roots, stems and leaves of the seedlings were sampled.
Measurement of mineral element concentrations
-
The plant mineral element concentrations were measured as described in previous studies[43,44] with some modifications. Briefly, fresh samples were placed into a forced air oven at 105 °C for 30 min and then at 75 °C until a constant weight was reached to determine the sample dry weight. All the dried samples were ground into fine powder. Then, 0.50 g of each sample was dry-ashed in a muffle furnace at 200 °C for 1 h, 300 °C for 1 h and 500 °C for 8 h, followed by dissolution in 10 mL 0.1 N HCl, and the mineral elements (except nitrogen) were determined using inductively coupled plasma atomic spectroscopy (ICP‒AES; Thermo, Inc., IRIS Advan, USA). The total nitrogen content of the plant samples, the pH of the soil samples and the soil mineral element concentrations were measured using the methods described by Bao[45]. Each sample was assayed using three replicates.
Quantification of ABA, JA and IAA
-
The root, stem and leaf tissues of Cj + LL and Pt + LL were used for hormone assays as described by Pan et al.[46] with slight modifications and each sample was characterized using four replicates[4,47]. The experimental method is as follows: Weigh approximately 0.2 g of fresh samples and grind with liquid nitrogen. After grinding, transfer the powder into a 10 mL centrifuge tube. Add 2 mL of prechilled buffer and mix thoroughly. Sequentially add 10, 0.2, 0.2 μL of ABA, IAA, and JA internal standard working solutions (d6-ABA (Icon Isotopes, cat. no. ID1001), d5IAA (Aldrich, cat. no. 492817), and H2JA (dihydrojasmonic acid, OlChemim, cat. no. 0145324, Sigma). Stir at 200 rpm on ice for 30 min. Then, add 4 mL of dichloromethane and stir at 200 rpm on ice for another 30 min. Centrifuge at 4 °C, 2,500 rpm for 15 min, and carefully extract the supernatant to a total volume of 10 mL in a centrifuge tube. Dry it with nitrogen gas. Resuspend the sample in 200 μL of methanol, filter it through a 0.22 μm organic membrane filter, and transfer it into a sample vial for HPLC – ESI – MS / MS analysis (ABI 4000 QTRAP, Applied Biosystems).
RNA-seq, data processing and gene annotation
-
Total RNA isolation was performed as described previously[48]. The root, stem and leaf samples of Cj + LL and Pt + LL were subjected to RNA-seq analysis using BGISEQ-500 at Beijing Genomics Institute (Shenzhen) in 2015. Each sample included two biological replicates. The sequencing data have been submitted to NCBI Gene Expression Omnibus (GEO), and the accession number is GSE98996. Briefly, 6 μg of the total RNA of each sample was used to enrich mRNA, to construct cDNA libraries and sequencing analysis. Clean reads (high-quality reads) were filtered from raw reads by removing low-quality reads with ambiguous nucleotides and adaptor sequences, and Bowtie2[49] and HISAT[50] were used to map clean reads to reference genes and the reference genome, respectively (Supplemental Table S1). The Citrus sinensis genome[51] was used as the reference genome; gene expression levels were calculated by the fragments per kilobase of transcript per million mapped reads (FPKM) method using the RSEM tool[52]. Differential expression analysis was performed using the NOISeq R package[53,54]. Fold change and probability (Prob.) were combined to determine the significance of the final transcript expression. An absolute fold change value ≥ 1.0 with a Prob. > 0.8 was defined as a significant difference.
Gene annotation was conducted using the Blastp search against the nr database in NCBI, and Blast KOALA was used to annotate the KOs of the KEGG ORTHOLOGY database. The protein sequences of genes were aligned against the GO database(Gene Ontology database)and KEGG(Kyoto Encyclopedia of Genes and Genomes) pathway database using KOBAS 2.0 (
http://kobas.cbi.pku.edu.cn/ )[55] to perform the enrichment analysis. A corrected p value < 0.05 was set as a cutoff for enrichment. REVIGO[56] was used to visualize and summarize the biological process, cell component and molecular function terms identified by KOBAS 2.0.Real-time quantitative PCR verification
-
Real-time quantitative PCR was performed to confirm the expression of candidate genes with three biological replicates according to our previous study[47], and CsActin was used as the endogenous reference gene[57]. The primers are listed in Supplemental Table S2. Data are presented as the means ± standard errors (SE) (n = 3).
Physiological analyses and histochemical staining of ROS
-
The vitamin E, GSH, malondialdehyde (MDA) and H2O2 contents were measured using the vitamin E assay kit (colorimetric method), reduced GSH assay kit (spectrophotometric method), MDA assay kit (TBA method) and hydrogen peroxide assay kit (Nanjing Jiancheng Bioengineering Institute, China), respectively. Sample processing was performed in accordance with the kit instructions. Anti-O2·– measurement and total protein concentration measurement were performed according to Geng and Liu[58]. Histochemical staining with 3,3'-diaminobenzidine (DAB) and nitroblue tetrazolium (NBT) was used to examine the in situ accumulation of H2O2 and O2·–, respectively[59]. Chlorophyll fluorescence imaging was performed using an IMAGINGPAM chlorophyll fluorimeter, and Fv/Fm ratios were calculated using Imaging WinGigE software (Walz, Germany)[60].
Determination of lignin content
-
The lignin content was as determinated by Dence[61] with slight modification. The Klason and ultraviolet spectrophotometry methods were combined to determine the content of lignin. In short, the sample tissues used for determining the lignin content were dried in a lyophilizer (Heto Lyolab 3000, Thermo Scientific, Laughborough, UK). The lignin content was calculated using the following formula: Lignin % = Abs × Liters × 100% / (Wsample × Astandard). Each sample was assayed using four replicates.
Exogenous hormone and JA biosynthesis inhibitor treatment of Cj seedlings
-
Cj and Pt seedlings of a uniform size were cultured with 4 L nutrient solution in a phytotron. The seedlings of Cj were cultured in nutrient solutions at pH 8.0 and pH 8.5. For the Cj group (pH 8.0), three final treatment concentrations of JA (0.5, 2 and 5 μM) in the nutrient solution were set up, and the seedlings were cultured for 8 weeks. For the Cj group (pH 8.5) seedlings cultured at pH 8.5, we set up the MeJA (1 μM), naphthylacetic acid (NAA) (2.69 μM), salicylhydroxamic acid (SHAM, a JA biosynthesis inhibitor) (100 μM), MeJA + NAA (1 μM + 2.69 μM) and SHAM + NAA (100 μM + 2.69 μM) five treatment groups, and the seedlings were cultured for 10 weeks. The solution was replaced every week.
-
The grafted materials Cj + LL and Pt + LL were alternately planted in the same orchard (Fig. 1a). The soil of this orchard is calcareous soil. Therefore, in this orchard, the calcium level (7,075.27 mg/kg) and pH value (7.88) of the soil were higher than in the control orchard, and the levels of mineral elements (Fe, Zn, Cu, Mg and Mn) in the soil were lower than in the control orchard soil (Supplemental Table S3). In particular, the content of Fe was very low at only approximately 1/22 of that in the control orchard. In calcareous soil, there were large differences in phenotype between Cj + LL and Pt + LL. As shown in Fig. 1a & Supplemental Table S4, the tree height and canopy volume of Cj + LL were much larger than those of Pt + LL by approximately 1.5 times and 3.8 times, respectively. In addition, the yield of Cj + LL was 3 times higher than that of Pt + LL. In addition, the fruit performance also differed between Cj + LL and Pt + LL. As shown in Fig. 1b & c, the coloring time, single fruit weight and TSS (total soluble solid) were different between Cj + LL and Pt + LL. The color transition time of the fruits of Cj + LL occurred approximately 20 d later than that of Pt + LL. In addition, the fruit size of Cj + LL was much larger than that of Pt + LL. The single fruit weight of Cj + LL was approximately 1.5 times heavier than that of Pt + LL. However, the fruit of Pt + LL tasted better than that of Cj + LL due to its higher TSS content.
It is known that mineral elements and plant hormones are important for plant growth and fruit development. Therefore, the contents of mineral elements in the root, stem and leaf of Cj + LL and Pt + LL were determined. As shown in Fig. 2a & Supplemental Table S5, we observed that the contents of macroelements (including N, P, K, S and Ca) showed little difference between Cj + LL and Pt + LL. However, the contents of microelements (including Fe, Cu, Zn and B) and Mg showed significant differences in some tissues between Cj + LL and Pt + LL. Overall, the contents of mineral elements in the root, stem and leaf of Cj + LL were higher than those in the root, stem and leaf of Pt + LL (Fig. 2a & Supplemental Table S5). Notably, the Cu content in Cj + LL was higher than that in Pt + LL in all measured tissues. In one-year-old branch and new leaf samples, the content of Fe in Cj + LL was higher than that in Pt + LL.
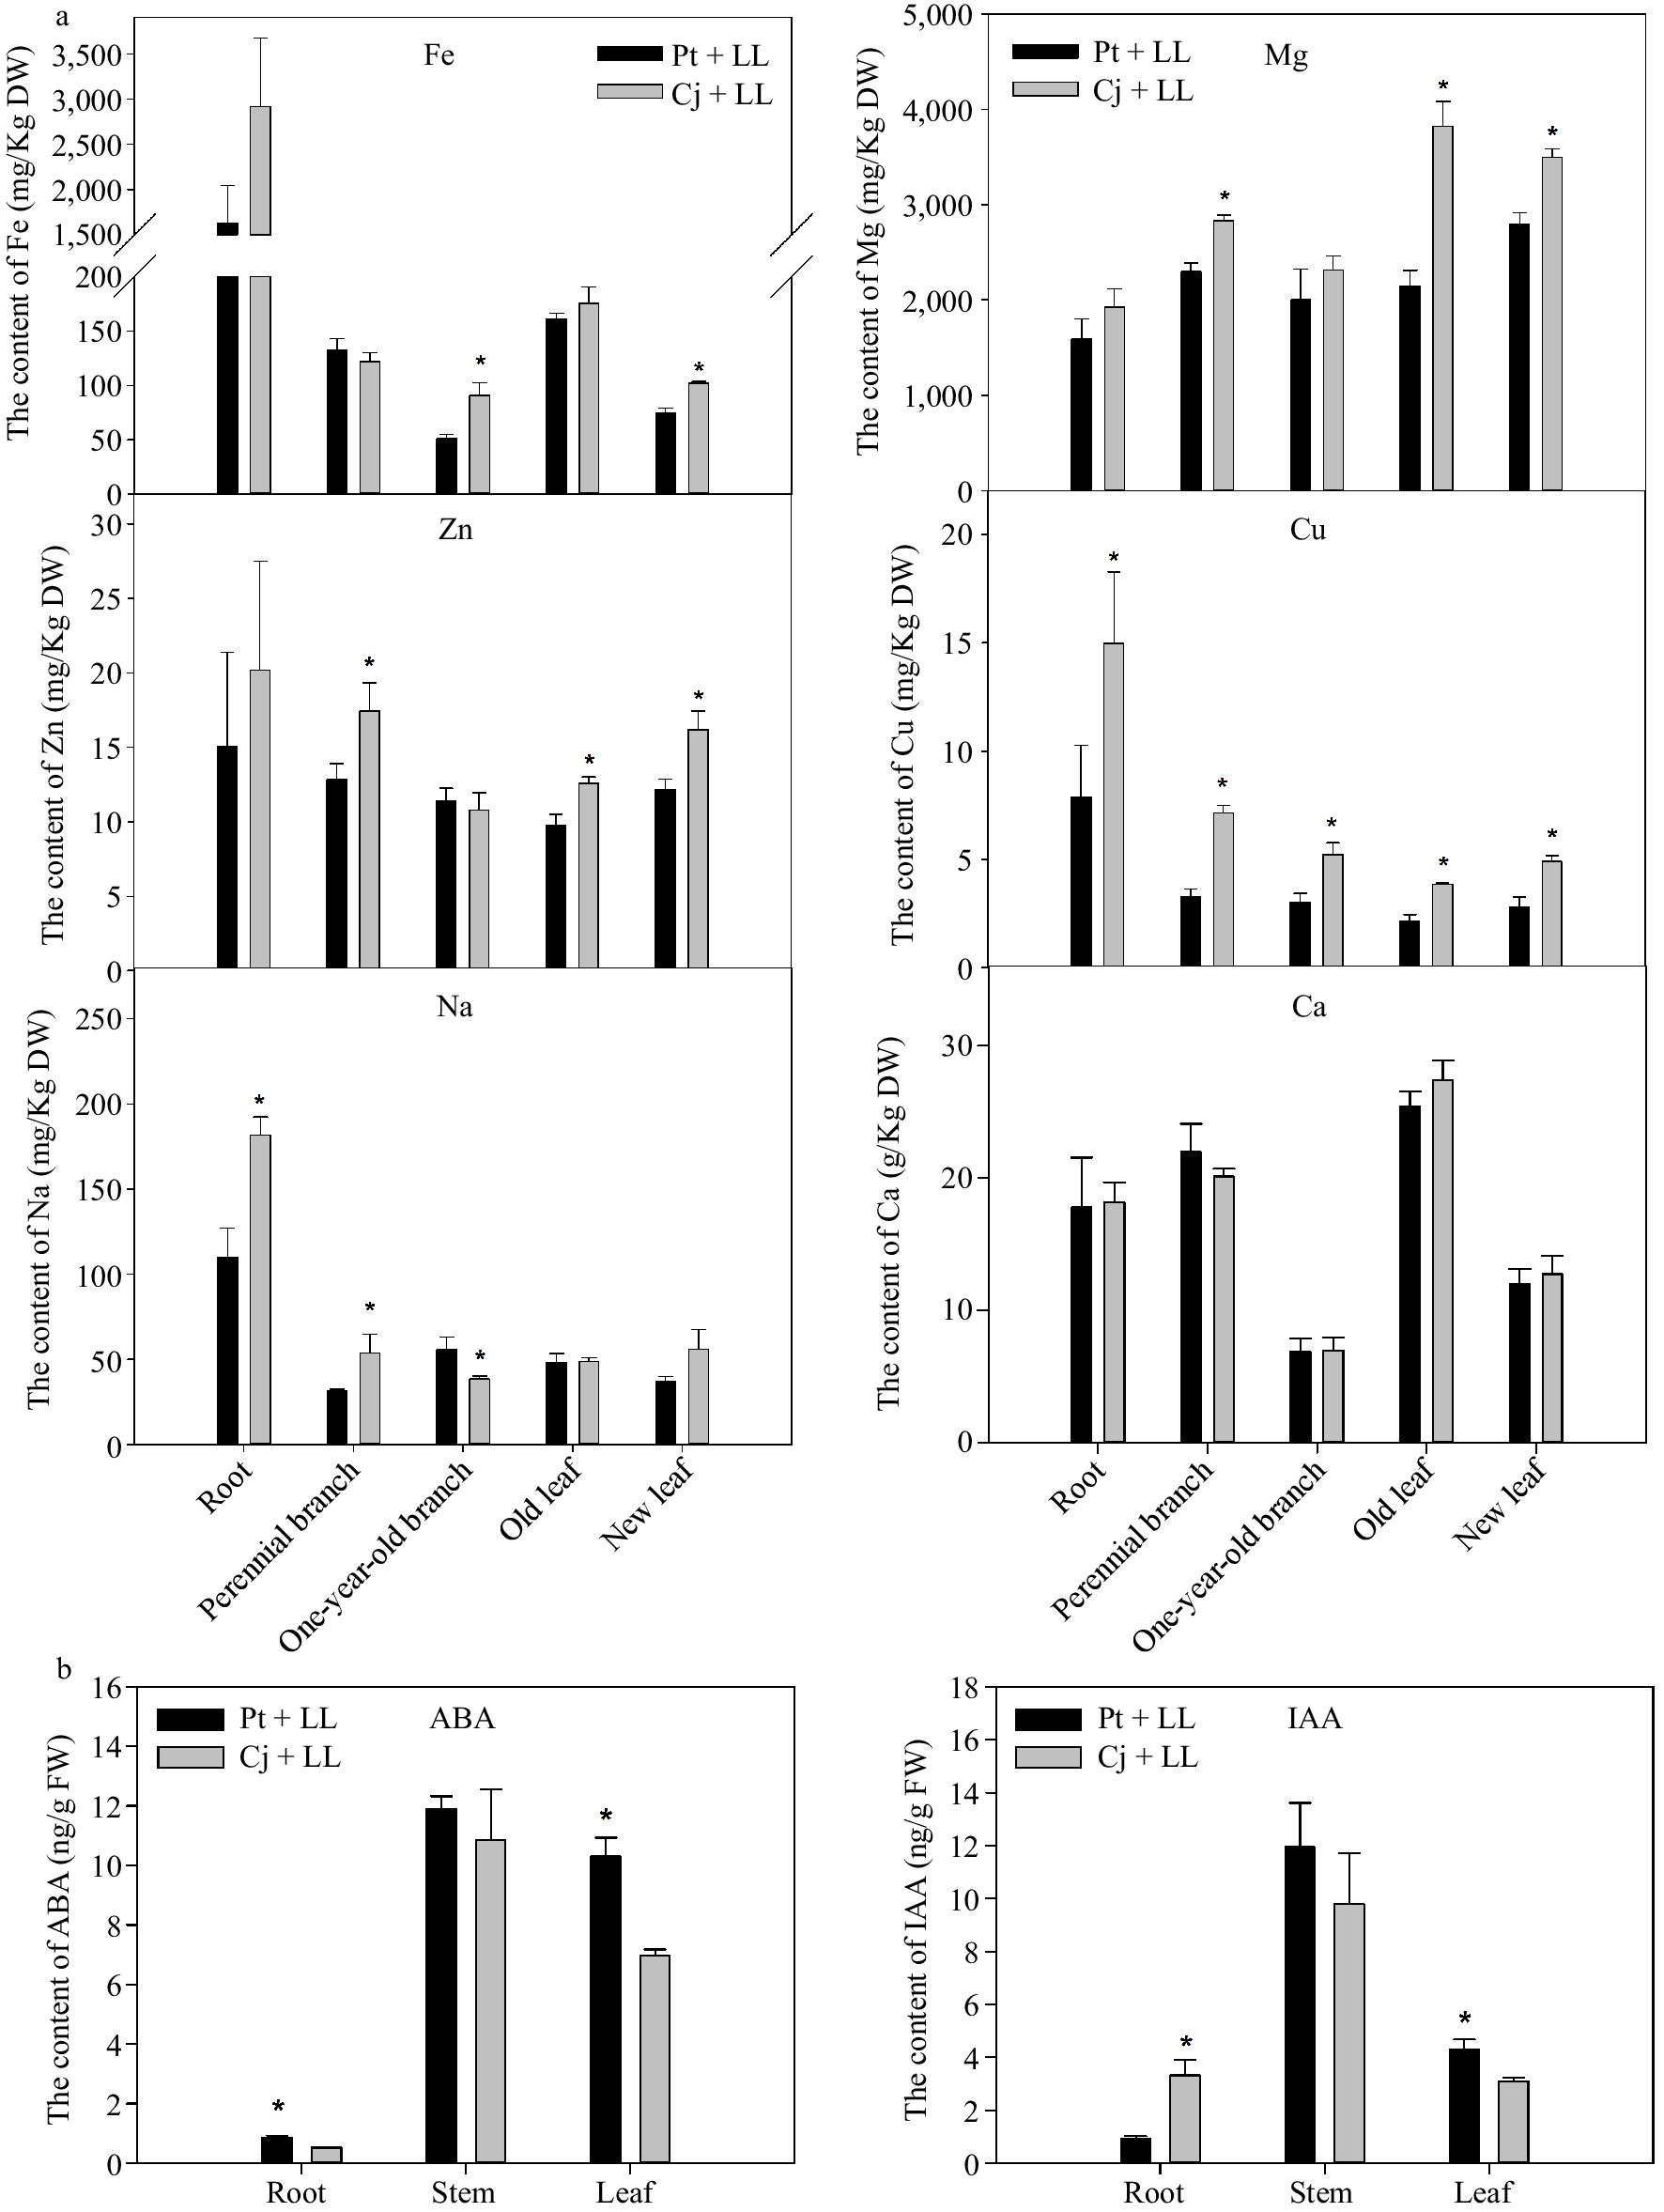
Figure 2.
The content of several mineral elements in different tissues of (a) Cj + LL and Pt + LL and (b) the content of ABA and IAA in the root, stem and leaf tissues of Cj + LL and Pt + LL. Cj + LL: Ziyang xiangcheng + Lane Late navel orange; Pt + LL: Poncirus trifoliate + Lane Late navel orange. Bars represent the standard error (n = 3). A single asterisk (*) represents statistically significant differences (p < 0.05). Analyzed using Student's t test.
Due to the differences in tree size and fruit development between Cj + LL and Pt + LL, the contents of ABA and IAA were measured (Fig. 2b). In the stem tissue, there was no significant difference in the contents of ABA and IAA between Cj + LL and Pt + LL. In the root and leaf tissues, the ABA content was significantly higher in Pt + LL than in Cj + LL. Compared with Pt + LL, the content of IAA in Cj + LL was higher in the root and lower in the leaf. This result indicated that plant hormones may play important roles between the rootstock and scion.
Global analysis of root, stem and leaf transcriptomes
-
To investigate the underlying molecular changes that accompany the morphological and physiological changes described above, we used RNA-seq to generate transcriptome profiles for the root, stem and leaf tissues of Cj + LL and Pt + LL. In the root tissue, 3,431 DEGs (differentially expressed genes) were identified between Cj + LL_root and Pt + LL_root (Fig. 3a & Supplemental Table S6). For the stem and leaf tissues, only 274 and 403 DEGs were identified, respectively (Fig. 3a & Supplemental Table S6). A Venn diagram was used to reveal unique or commonly differentially expressed genes among the root, stem and leaf tissues (Fig. 3b). Only 20 DEGs were common among all three tissues (Fig. 3b). Most of these 20 DEGs were upregulated in the root of Cj + LL and downregulated in the leaf of Cj + LL compared with Pt + LL (Fig. 3c & Supplemental Table S7). This result indicates that the difference between Cj + LL_root and Pt + LL_root is the major differential resource for Cj + LL and Pt + LL.
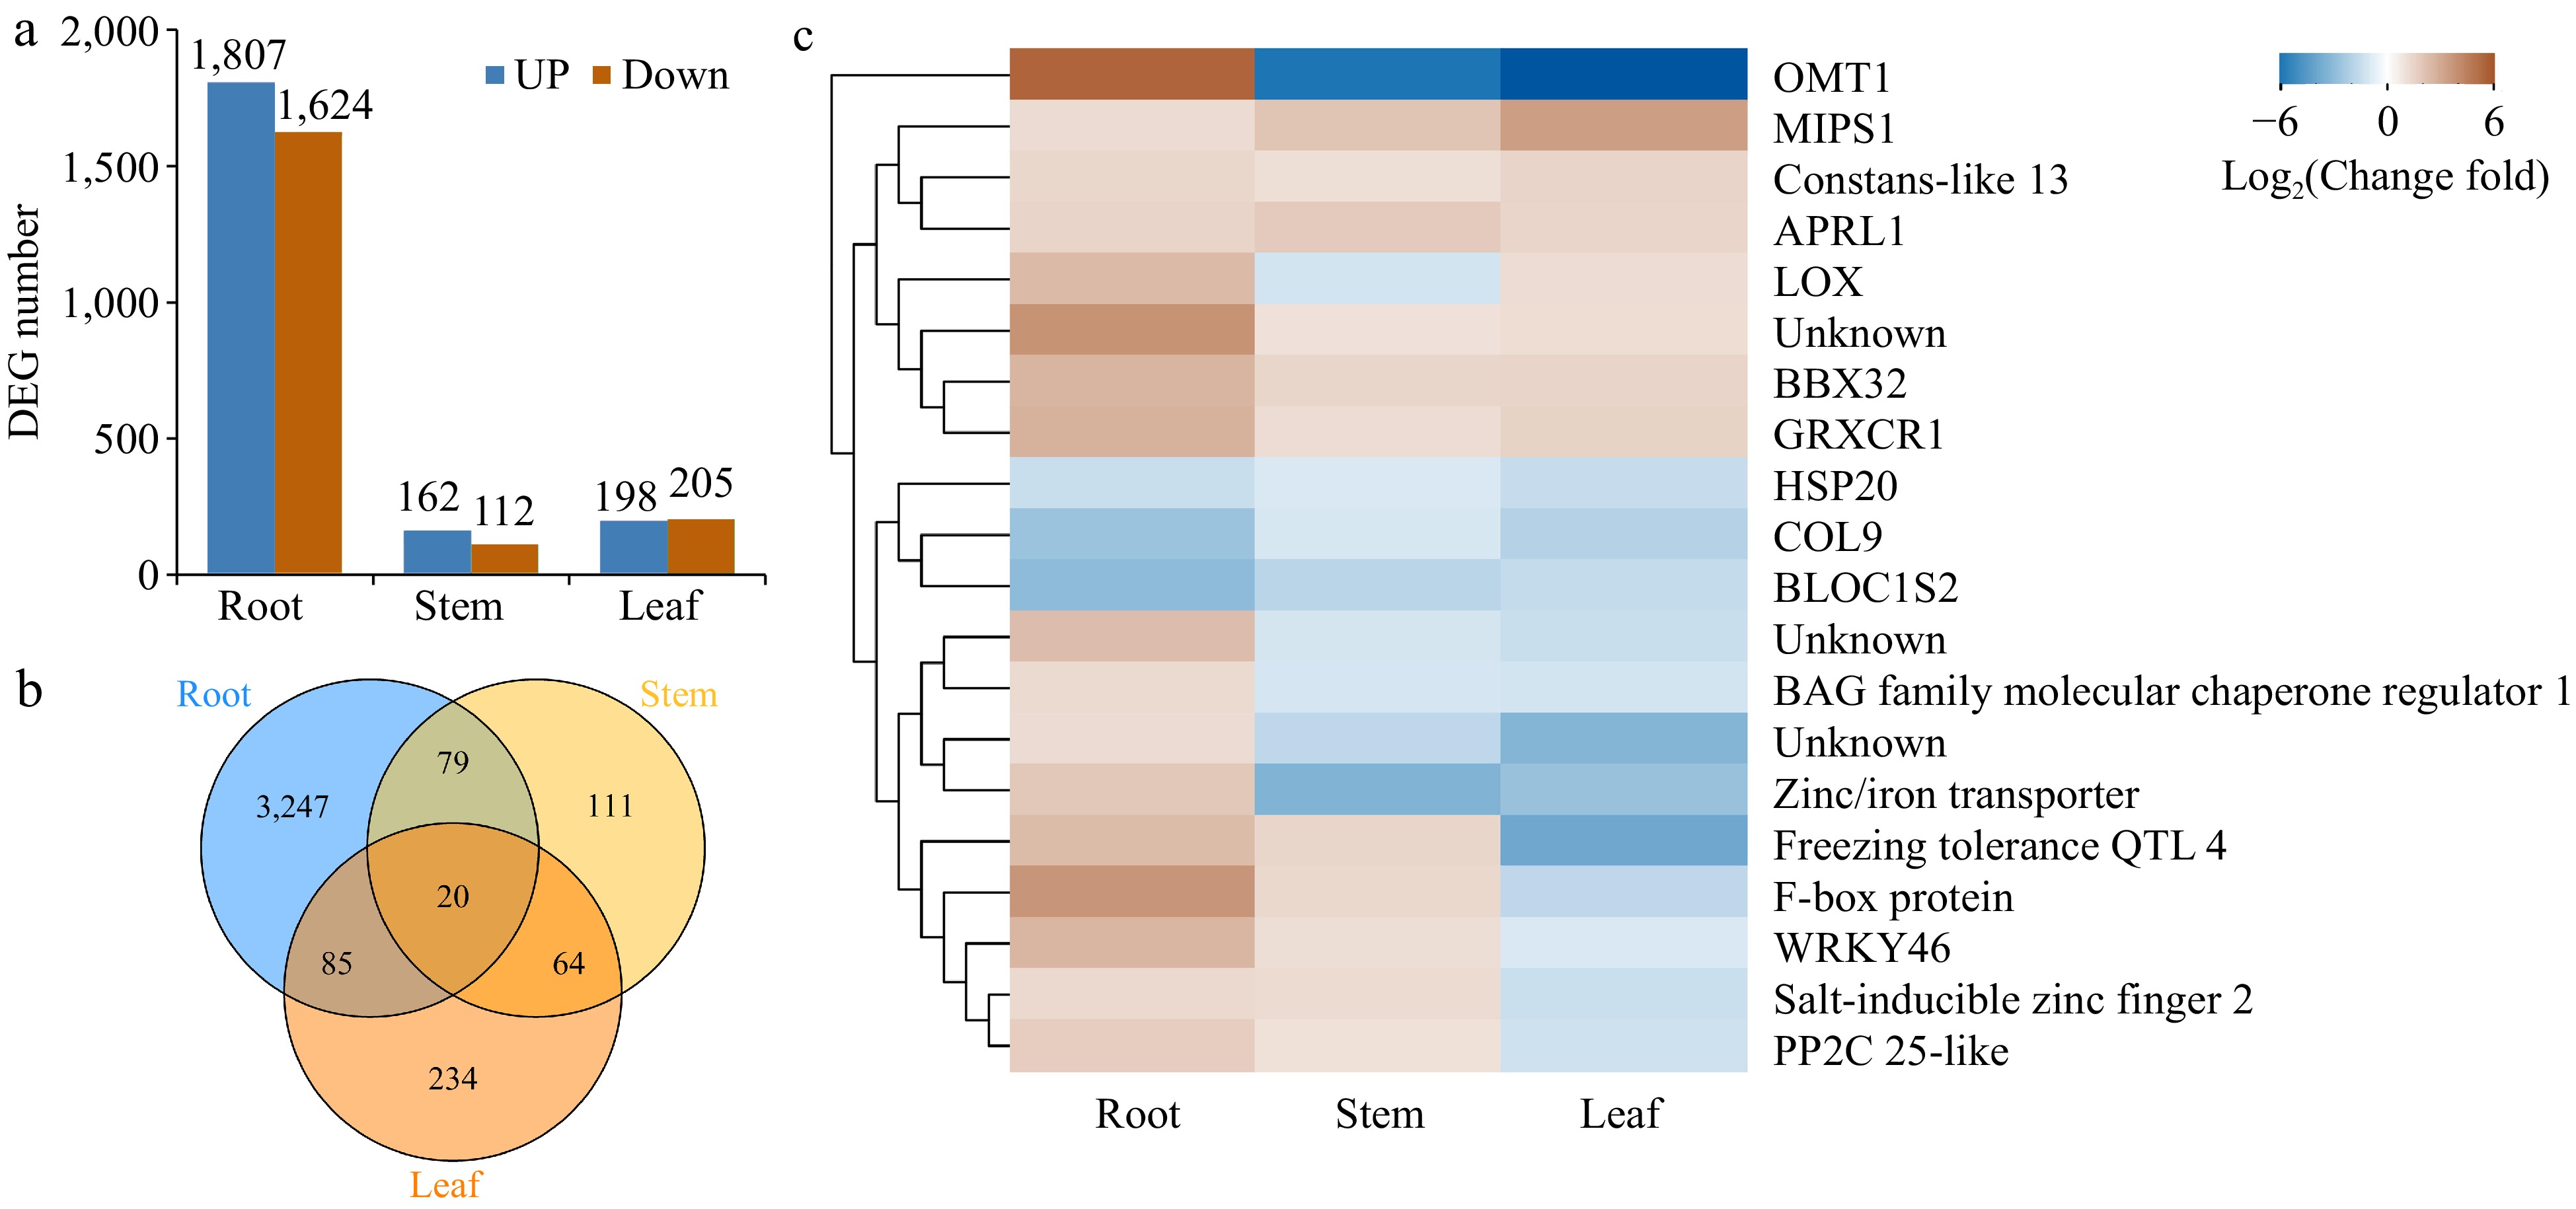
Figure 3.
Global analysis of gene expression in different tissues of Cj + LL and Pt + LL. (a) The number of differentially expressed genes in the root, stem and leaf tissues. (b) Venn diagram showing the number of commonly and uniquely expressed genes in the root, stem and leaf tissues. (c) Heatmap showing the genes differentially expressed in the root, stem and leaf tissues. DEG: differentially expressed gene.
To further elucidate the difference in root, stem and leaf tissues between Cj + LL and Pt + LL at the transcript level, GO-based term classification and KEGG-based pathway enrichment analyses were performed. In the root tissue, 112 biological processes, 23 molecular functions and 17 cellular components were shown to be enriched in the DEGs (Supplemental Table S8). In biological processes, several hubs were significantly enriched, including response to inorganic substance, secondary metabolic process, flavonoid biosynthetic and metabolic processes, and other processes (Fig. 4a & Supplemental Table S8). Notably, several enriched GO terms were related to plant development, nutrient element uptake and stress response, such as response to hormone, ion transport, response to metal ion, lignin biosynthetic process and glutathione metabolic process (Supplemental Table S8). According to the KEGG pathway enrichment analysis (Fig. 4d & Supplemental Table S9), our attention was attracted by several enriched pathways, such as flavonoid biosynthesis (15 DEGs), glutathione metabolism (31), phenylpropanoid biosynthesis (45), alpha-linolenic acid metabolism (13), carotenoid biosynthesis (10) and plant hormone signal transduction (54) were in accordance with the results of GO enrichment analysis. In the stem tissue, the DEGs were enriched in 38 biological processes and two molecular functions (Supplemental Table S8). Among the biological processes, several hub processes were identified, including response to chitin, flavonoid biosynthesis and metabolism, and response to stimulus (Fig. 4b). In the leaf tissue, 58 biological processes, three cell components and 12 molecular functions were enriched in the DEGs (Supplemental Table S8). Response to inorganic substance was the most enriched hub biological process, which was in accordance with the results of the root tissue GO enrichment analysis (Fig. 4a & c). The KEGG pathways enriched with the DEGs in the stem and leaf tissues were also identified (Supplemental Table S9). Several common pathways were identified in both stem and leaf tissues, such as alpha-linolenic acid metabolism, flavonoid biosynthesis, phenylpropanoid biosynthesis and diterpenoid biosynthesis (Supplemental Table S9).
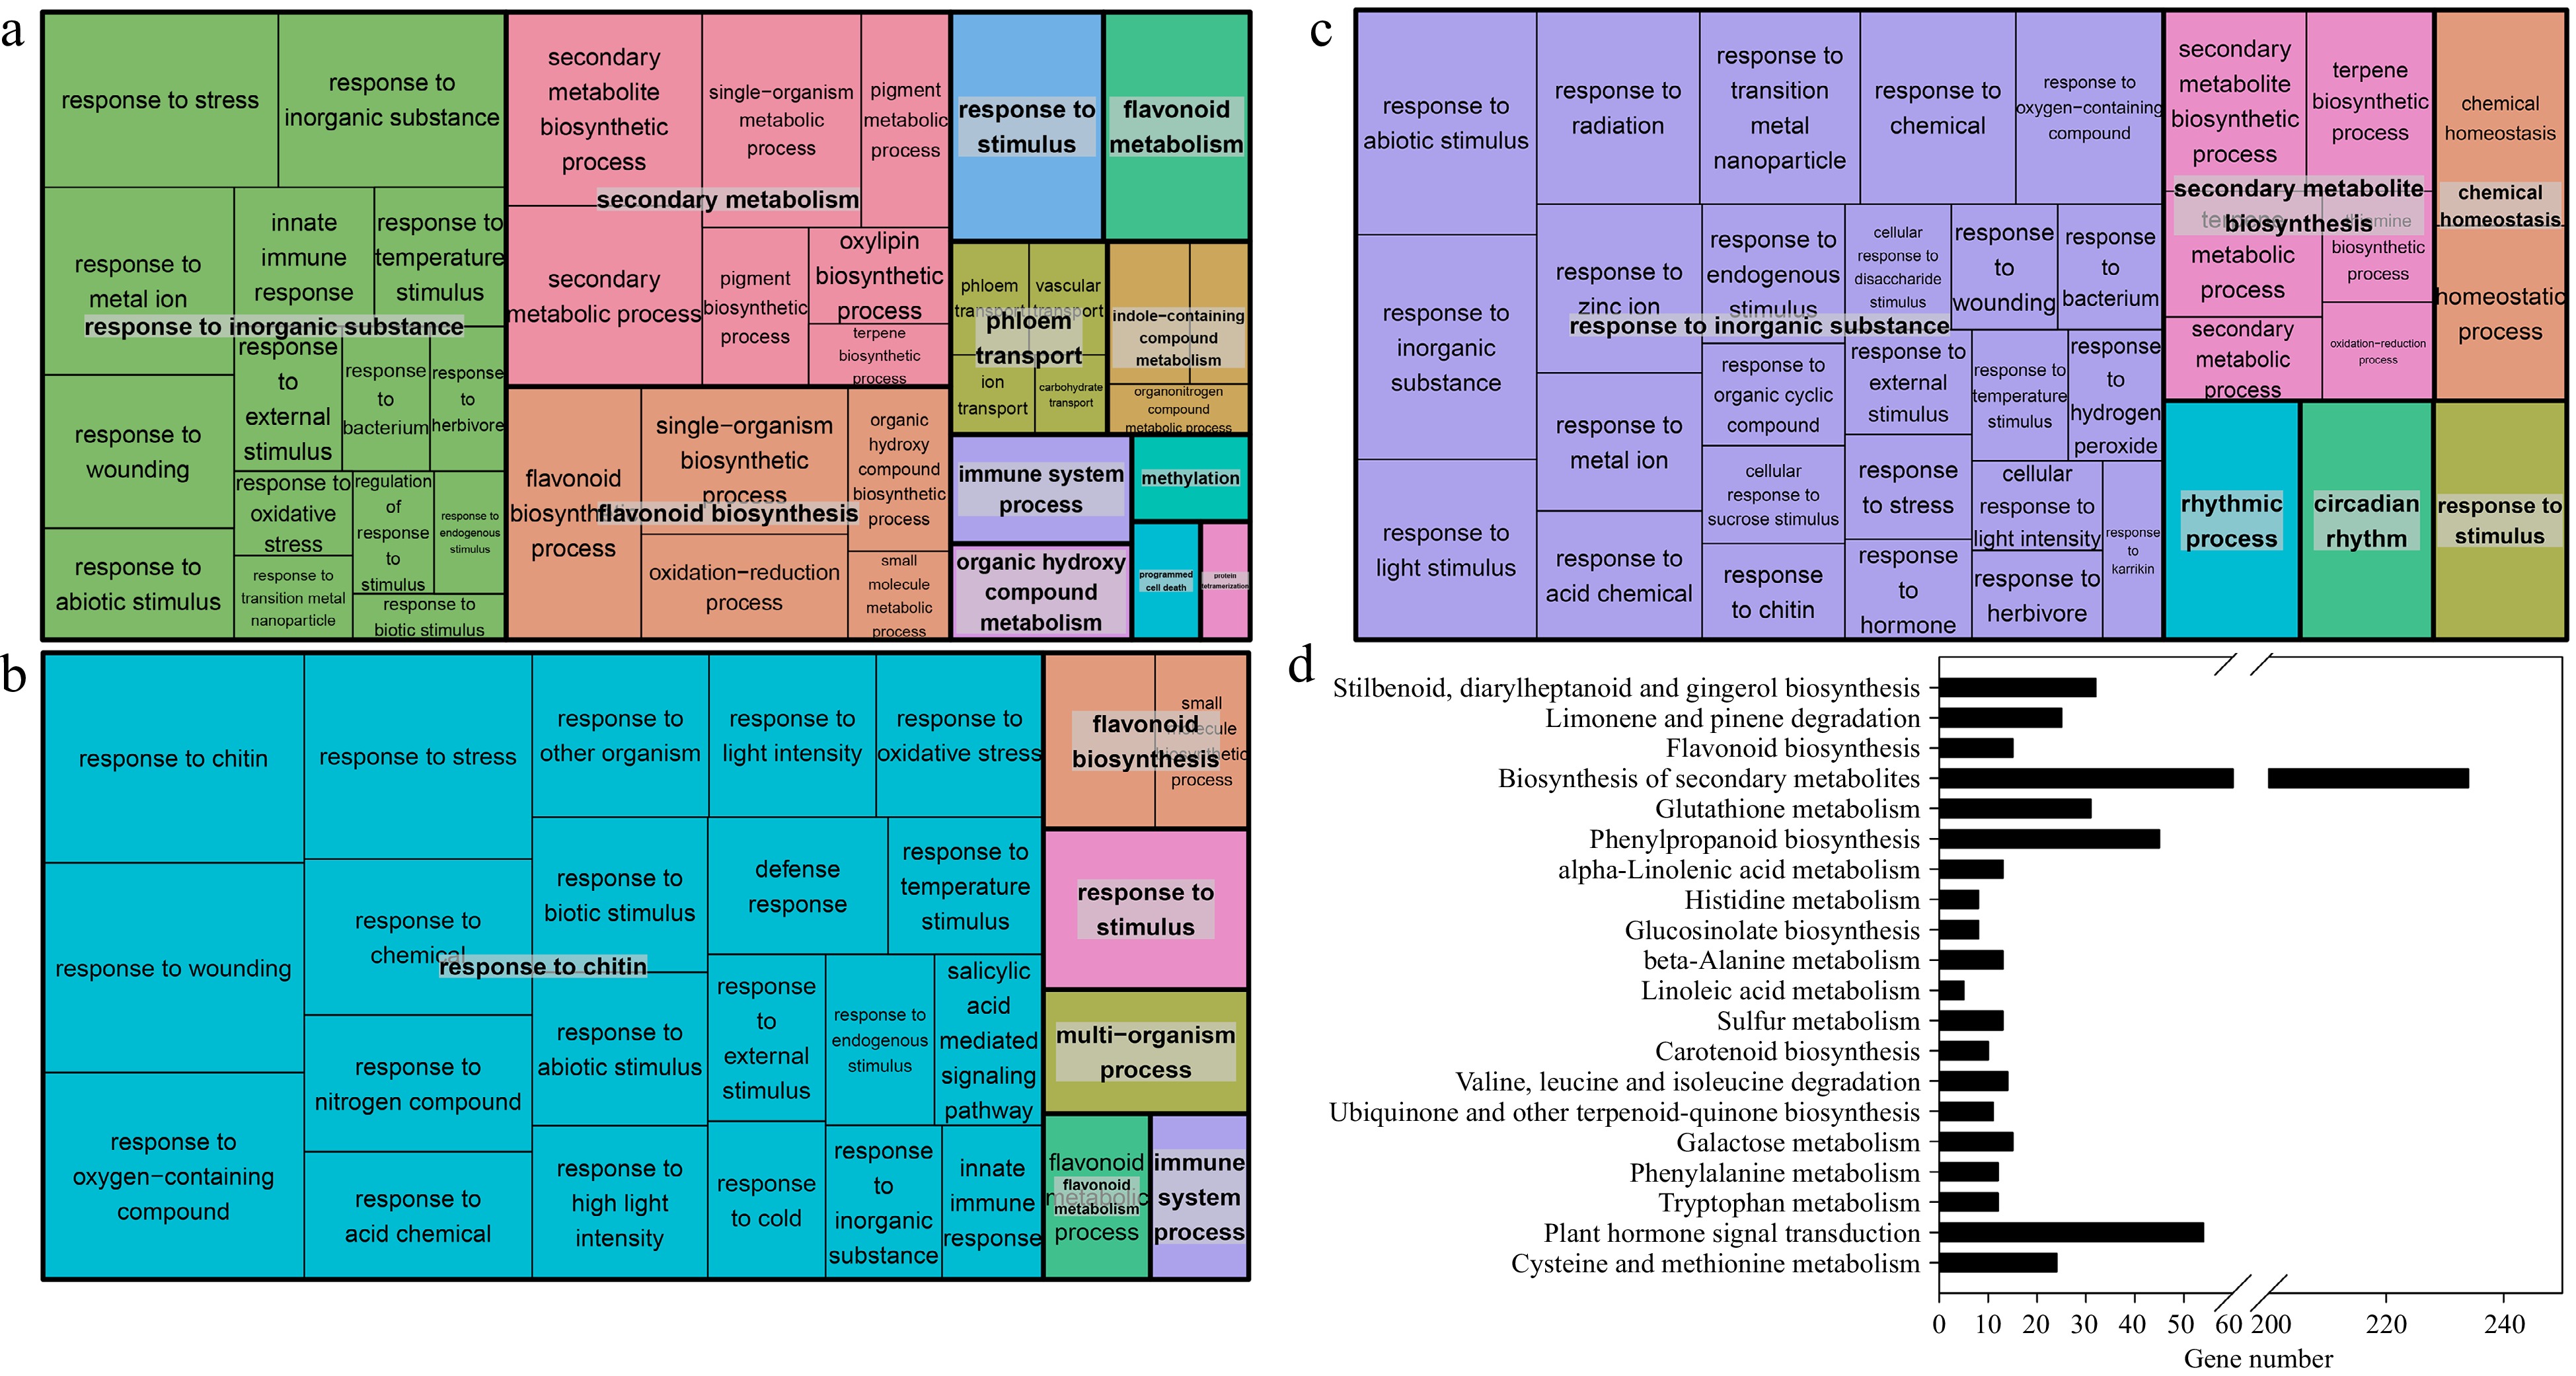
Figure 4.
Treemap showing the Gene Ontology (GO) enrichment analysis and the enriched KEGG pathways of the DEGs in the (a), (d) root tissue, (b) stem tissue and (c) leaf tissue of Cj + LL and Pt + LL. (a)−(c), biological processes; (d) KEGG pathways. Each rectangle is a single cluster representative. The representatives are joined into 'superclusters' of loosely related terms, visualized with different colors. The size of the rectangles may be adjusted to reflect either the p value or the frequency of the GO term in the underlying GO database. KEGG: Kyoto Encyclopedia of Genes and Genomes.
Phytohormone biosynthesis and signal transduction pathway genes underwent great changes
-
In this study, 54 DEGs in the roots of Cj + LL and Pt + LL and seven DEGs in the leaves of Cj + LL and Pt + LL were enriched in plant hormone signal transduction (Fig. 4d & Supplemental Table S9). The DEGs in the JA, auxin and cytokinin signal transduction pathways were also verified in the roots of Cj and Pt, which showed distinct expression between Cj_root and Pt_root (Fig. 5). As shown in Table 1, there were 14, 7, 6 and 5 DEGs distributed in the auxin, ABA, CK and JA signal transduction pathways, respectively. In the JA biosynthesis and signal transduction pathway, several key DEGs were identified, and in the root tissue, most of these DEGs were upregulated in Cj + LL_root (Table 1). As shown in Fig. 5a & Table 1, the key genes for JA biosynthesis were upregulated in Cj + LL_root and Cj_root, such as PKT (Cs9g05210), ACX (Cs6g08630) and LOX2 (orange1.1t04376). Therefore, we measured the content of JA in the root and leaf of Cj + LL and Pt + LL. As shown in Fig. 6a, the content of JA in the root and leaf of Cj + LL was much higher than that in Pt + LL. Moreover, six DEGs were identified in the JA signal transduction pathway. The expression levels of JAZs (Cs1g17210, Cs1g17220 and Cs7g02820), repressors of MYC2, in Cj + LL_root was higher than those in Pt + LL_root, while this three JAZs gene continuously be a low expression level at 6.5 < pH < 8 in Cj_root, then rapidly reached to the similar expression level (Cs1g17210 and Cs7g02820) or significantly higher (Cs1g17220) than Pt_root at pH = 9.5. However, the expression levels of COI1 (Cs7g31600) and MYC2 (orange1.1t01021) in Cj + LL_root and Cj_root were lower than those in Pt + LL_root and Pt_root at pH ≤ 8.0, and quickly rose when pH increased (Fig. 5a & Table 1). This result revealed that COI1-mediated JA signaling in the root of Cj + LL or Cj was weaker than in the root of Pt + LL or Pt under moderately alkaline stress conditions and strengthened while its exacerbated. In the auxin signal transduction pathway, the gene GH3.6 (Cs5g32030) attracted our attention due to its expression pattern in the roots of Cj and Pt. The expression of GH3.6 in the roots of Cj was approximately 150-fold higher than that in the roots of Pt under pH 6.5 and 8.0 conditions (Fig. 5c). At pH 9.5, the expression of GH3.6 was largely increased (approximately 2-fold) in the roots of Cj, but it showed little change in Pt (Fig. 5c). In previous studies[62,63], GH3.6 was shown to play an important role in auxin and JA homeostasis. In the CK signal transduction pathway, the genes were all downregulated in the roots of Cj + LL (Table 1). In the ABA biosynthesis pathway, the expression of ABA 8'-hydroxylase (Cs6g19380) in Cj + LL_root was approximately 9-fold higher than that in Pt + LL_root, and the expression of NCED1 (Cs5g14370), a key gene in ABA biosynthesis, was lower in Cj_root than in Pt_root (Table 1 & Fig. 5b). These differences may explain why the ABA content in the roots of Cj + LL was lower than that in the roots of Pt + LL (Fig. 2b). In addition, the PYR/PYL genes and ABA receptors were also downregulated in the roots of Cj + LL (Table 1).
Table 1. A list of some of the important differentially expressed genes in the root tissue between Cj + LL and Pt + LL.
Gene ID FPKM log2 Ratio
(Cj + LL_root/Pt + LL_root)Probability Gene name Pt + LL_root Cj + LL_root H+-transporting ATPase Cs6g03490 13.80 6.03 −1.20 0.83 ATPase 4 Cs5g04360 32.35 12.96 −1.32 0.86 ATPase 11 Cs5g08370 0.62 7.44 3.60 0.89 ATPase Cs2g13550 320.97 115.17 −1.48 0.89 F-type H+-transporting ATPase subunit beta Cs7g14520 0.62 4.64 2.90 0.82 V-type H+-transporting ATPase subunit H Cs3g25550 6.75 0.85 −2.99 0.86 V-type H+-transporting ATPase subunit a Cs3g25560 12.03 5.59 −1.11 0.81 V-type H+-transporting ATPase subunit a Aquaporin Cs7g25610 125.66 52.03 −1.27 0.87 Aquaporin PIP 2-1 Cs7g31410 148.77 22.09 −2.75 0.92 Aquaporin PIP 1-1 Cs6g11670 10.04 1.80 −2.48 0.87 Aquaporin PIP 2-2 Cs6g11700 14.95 5.82 −1.36 0.84 Aquaporin PIP2-1 Cs5g08710 15.09 2.82 −2.42 0.89 Aquaporin TIP2-2 Cs7g28650 447.95 51.70 −3.12 0.93 Aquaporin TIP1-1 Cs8g17900 11.52 2.95 −1.97 0.86 Aquaporin TIP1-3 Cs2g04370 4.28 20.43 2.25 0.89 Aquaporin NIP1-2 JA biosynthesis and signal transduction Cs9g05210 15.71 133.92 3.09 0.93 PKT Cs5g17880 24.23 52.72 1.12 0.86 OPR2 Cs5g17920 38.68 125.16 1.69 0.90 OPR2 Cs6g08630 13.04 48.65 1.90 0.90 ACX Cs1g17380 43.12 90.51 1.07 0.86 LOX3 orange1.1t03773 37.65 113.44 1.59 0.89 LOX2 orange1.1t04376 21.70 114.64 2.40 0.92 LOX2 orange1.1t00464 22.53 46.72 1.05 0.85 JAR1 Cs1g17210 153.01 442.86 1.53 0.89 JAZ Cs1g17220 70.18 182.71 1.38 0.88 JAZ Cs7g02820 232.46 521.60 1.17 0.87 JAZ10 Cs7g31600 31.27 17.16 −0.87 0.81 COI1 ABA biosynthesis and signal transduction Cs1g22620 6.40 32.66 2.35 0.91 ABA1 Cs6g14030 7.37 20.57 1.48 0.86 ABA2 Cs6g19380 55.00 495.16 3.17 0.94 ABA 8'-hydroxylase Cs8g19140 13.73 5.495 −1.32 0.84 HAI2 Cs9g18020 5.29 12.54 1.25 0.824 PP2C orange1.1t00478 136.22 36.88 −1.89 0.904 PYL9 orange1.1t01026 62.78 21.28 −1.56 0.894 PYR1 Cs1g19380 37.87 14.395 −1.40 0.87 SnRK2.5 Cs4g05990 0.01 2.12 7.73 0.807 SnRK2 Cs1g19910 11.745 32.3 1.46 0.87 SnRK2 Auxin signal transduction Cs4g04520 12.71 29.77 1.23 0.86 ARF7 Cs4g07020 33.15 14.08 −1.24 0.86 ARF19 Cs3g25860 27.15 11.37 −1.26 0.86 ARF5 Cs2g05440 5.55 1.43 −1.964 0.80 ARF3 Cs1g13960 18.25 67.95 1.90 0.90 IAA15 Cs9g08100 18.66 58.73 1.65 0.89 IAA22B Cs4g18240 8.77 51.10 2.54 0.91 IAA29 Cs6g07990 47.99 19.56 −1.29 0.87 AUX1 Cs1g22140 1.24 6.17 2.32 0.84 GH3.1 Cs5g32030 9.90 27.82 1.49 0.87 GH3.6 Cs4g12720 43.54 17.55 −1.31 0.87 SAUR72 Cs7g03030 29.78 13.75 −1.11 0.85 SAUR orange1.1t02550 20.21 52.50 1.38 0.87 SAUR Cs5g32500 14.39 6.51 −1.14 0.82 TIR1 Cytokinin signal transduction Cs5g32140 39.75 16.12 −1.30 0.87 AHP orange1.1t01850 60.92 15.39 −1.98 0.90 ARR-A Cs7g07940 56.70 13.82 −2.04 0.91 ARR-A Cs9g02760 16.87 6.64 −1.35 0.85 ARR-B Cs7g06180 20.05 9.22 −1.12 0.84 ARR-B Cs2g19760 10.39 3.45 −1.59 0.84 CRE1 Phenylpropanoid biosynthesis (lignin biosynthesis) orange1.1t02755 199.89 75.86 −1.40 0.88 CCR1 Cs7g24940 32.08 81.54 1.35 0.88 PAL4 Cs6g11940 263.56 143.15 −0.88 0.83 PAL1 Cs8g15880 16.64 5.42 −1.62 0.87 4CL orange1.1t02041 308.63 637.33 1.05 0.86 Peroxidase 15 Cs2g28110 42.09 14.10 −1.58 0.89 Peroxidase 4 orange1.1t02947 4.355 74.87 4.10 0.96 OMT1 orange1.1t03686 70.36 7.03 −3.32 0.94 OMT1 Cs1g12660 19.94 94.94 2.25 0.91 CCOAMT Cs1g22450 74.54 34.48 −1.11 0.86 CCOAMT Vitamin E biosynthesis Cs7g17560 7.80 16.06 1.04 0.82 PDS1 Cs7g15250 36.25 9.42 −1.94 0.89 G-TMT Cs9g17840 1.89 9.44 2.32 0.87 HPT1 Cs3g03920 10.38 2.98 −1.80 0.85 HPT1 Cs9g19520 1.67 18.18 3.45 0.92 HPT1 orange1.1t05352 0.71 12.25 4.11 0.93 HPT1 Glutathione metabolism Cs5g32800 416.34 1032.87 1.31 0.88 GST Cs1g02370 22.36 7.25 −1.62 0.88 GGT Cs5g03830 169.05 659.59 1.96 0.90 GPX Cs6g19310 94.55 217.63 1.20 0.87 G6PD orange1.1t02665 34.83 13.39 −1.38 0.87 GR 
Figure 6.
The contents of (a) JA, (b) lignin, (c) GSH, (d) MDA and (e) H2O2 in Cj + LL and Pt + LL. JA: jasmonate; GSH: glutathione; ABA: abscisic acid; IAA: indole-3-acetic acid. A single asterisk (*) represents statistically significant differences (p < 0.05), and double asterisks (**) represent highly statistically significant differences (p < 0.01). Analyzed using Student's t test.
Lignin biosynthesis may play an important role in the response to alkalinity stress
-
Many DEGs related to lignin biosynthesis were identified in the root, stem and leaf tissues of Cj + LL and Pt + LL (Tables 1 & 2). Among these DEGs, several key genes for lignin biosynthesis were all downregulated in Cj + LL_root, including CCR1 (orange1.1t02755) and 4CL (Cs8g15880), which were also verified in Cj_root and Pt_root by qRT‒PCR (Table 1 & Fig. 5d). Other DEGs displayed a mixed expression pattern (contained both upregulated and downregulated genes) and showed distinct expression patterns between Cj_root and Pt_root. (Tables 1, 2 & Fig. 5d). To further investigate the different changes in lignin in the cell wall between Cj + LL and Pt + LL, we determined the content of lignin in the root and leaf of Cj + LL and Pt + LL. As shown in Fig. 6b, the content of lignin in Cj + LL was significantly lower than that in Pt + LL in both the root and leaf tissues, which was in accordance with the results of gene expression analysis.
Table 2. List of some of the important differentially expressed genes in the stem and leaf tissues between Cj + LL and Pt + LL.
Gene ID Stem (FPKM) Leaf (FPKM) Gene
namePt + LL
_stemCj + LL
_stemlog2 Ratio
(Cj + LL_stem /
Pt + LL_stem)Probability Pt + LL
_leafCj + LL
_ leaflog2 Ratio
(Cj + LL_leaf /
Pt + LL_leaf)Probability Phenylpropanoid biosynthesis Cs1g11780 24.56 56.53 1.20 0.87 22.36 74.58 1.74 0.90 HCT Cs4g01930 − − − − 7.52 16.54 1.14 0.80 HCT Cs1g12660 − − − − 20.34 62.34 1.62 0.89 CCoAOMT Cs6g11940 − − − − 72.42 157.96 1.13 0.87 PAL Cs6g20950 8.00 0.12 −6.06 0.90 14.82 0.08 −7.53 0.96 OMT1 orange1.1t05218 6.39 24.56 1.94 0.88 − − − − OMT1 orange1.1t05354 28.11 8.83 −1.67 0.88 − − − − OMT1 Cs8g04970 27.45 9.07 −1.60 0.87 − − − − CAD orange1.1t02036 2.87 10.97 1.94 0.83 − − − − Peroxidase15 orange1.1t02041 − − − − 2.61 14.31 2.45 0.87 Peroxidase15 orange1.1t02044 − − − − 16.26 43.46 1.42 0.87 Peroxidase15 alpha-Linolenic acid metabolism Cs1g17380 15.07 45.38 1.59 0.89 − − − − LOX3 Cs2g21000 − − − − 29.49 95.15 1.69 0.90 HPL1 orange1.1t04376 26.92 11.80 −1.19 0.84 15.35 35.87 1.22 0.85 LOX2 ABA biosynthesis Cs5g14370 13.58 35.27 1.38 0.87 − − − − NCED1 Cs8g18780 − − − − 18.07 47.40 1.39 0.87 ABA 8'-hydroxylase Cs8g05940 − − − − 1.80 9.71 2.43 0.84 ABA 8'-hydroxylase Cs6g19380 − − − − 43.57 4.88 −3.16 0.93 ABA 8'-hydroxylase Plant hormone signal transduction Cs1g15830 − − − − 32.49 14.61 −1.15 0.84 IAA26 Cs1g13960 − − − − 37.59 97.30 1.37 0.88 IAA15 Cs2g17860 − − − − 6.21 16.41 1.40 0.83 CRE1 Cs3g23120 − − − − 16.03 34.30 1.10 0.84 Cyclin D3 orange1.1t01850 − − − − 13.81 46.12 1.74 0.89 ARR-A Cs5g04810 − − − − 8.04 32.93 2.03 0.89 ARR5 Cs4g15360 − − − − 6.98 17.24 1.31 0.82 PP2C Other metabolic pathways and genes involved in the response to alkalinity stress
-
The formation of reactive oxygen species (ROS) can disturb normal metabolism when they are produced in excess. Glutathione (GSH) is an important ROS scavenger. In this study, several DEGs of Cj + LL_root and Pt + LL_root were enriched in the glutathione metabolism pathway (Table 1 & Fig. 5e). In addition, we measured the contents of GSH, MDA and H2O2 in Cj + LL and Pt + LL. As shown in Fig. 6c, d & e, the contents of MDA and H2O2 in the root and leaf tissues of Pt + LL were significantly higher than those in the root and leaf tissues of Cj + LL, and the GSH content in the root tissue of Cj + LL was higher than that in the root tissue of Pt + LL. In addition, as shown in Table 1, for H+-transporting ATPase genes, the expression levels of most of these genes were downregulated in Cj + LL_root, and 7/10 of H+-transporting ATPase genes were downregulated in Cj_root compared with Pt_root under alkaline conditions (Fig. 5f).
Exogenous JA enhanced the tolerance of Cj to alkalinity stress
-
In our previous study[4], JA plus auxin analog treatment enhanced the tolerance of Pt seedlings to alkalinity stress, while the application of JA had little effect on improving the tolerance of Pt seedlings to alkalinity stress. In this study, we demonstrated that exogenous JA application to Cj seedlings cultured at pH 8.0 significantly reduced the contents of MDA and H2O2 in the root tissue and increased the number of LRs (Fig. 7). Notably, the content of H2O2 was significantly reduced in stem and leaf tissues, and a higher concentration of exogenous JA resulted in a lower content of H2O2 and more generation of LRs (Fig. 7a, c & d). However, the application of JA had little effect on MDA in stem and leaf tissue (Fig. 7b). Furthermore, we designed another treatment experiment using MeJA, SHAM and NAA to treat Cj seedlings at pH 8.5 (Fig. 8). After 10 weeks of culture, the growth status of the MeJA treatment group was the best, generating the largest number of LRs and had the highest photochemical efficiency (Fv/Fm) of photosystem II (Fig. 8a, b, d & e). The status of the SHAM and SHAM+NAA treatment groups were not good, and leaf yellowing and root necrosis were serious (Fig. 8a). Moreover, as shown in Fig. 8, NAA had little effect on improving the tolerance of Cj seedlings to alkalinity stress.
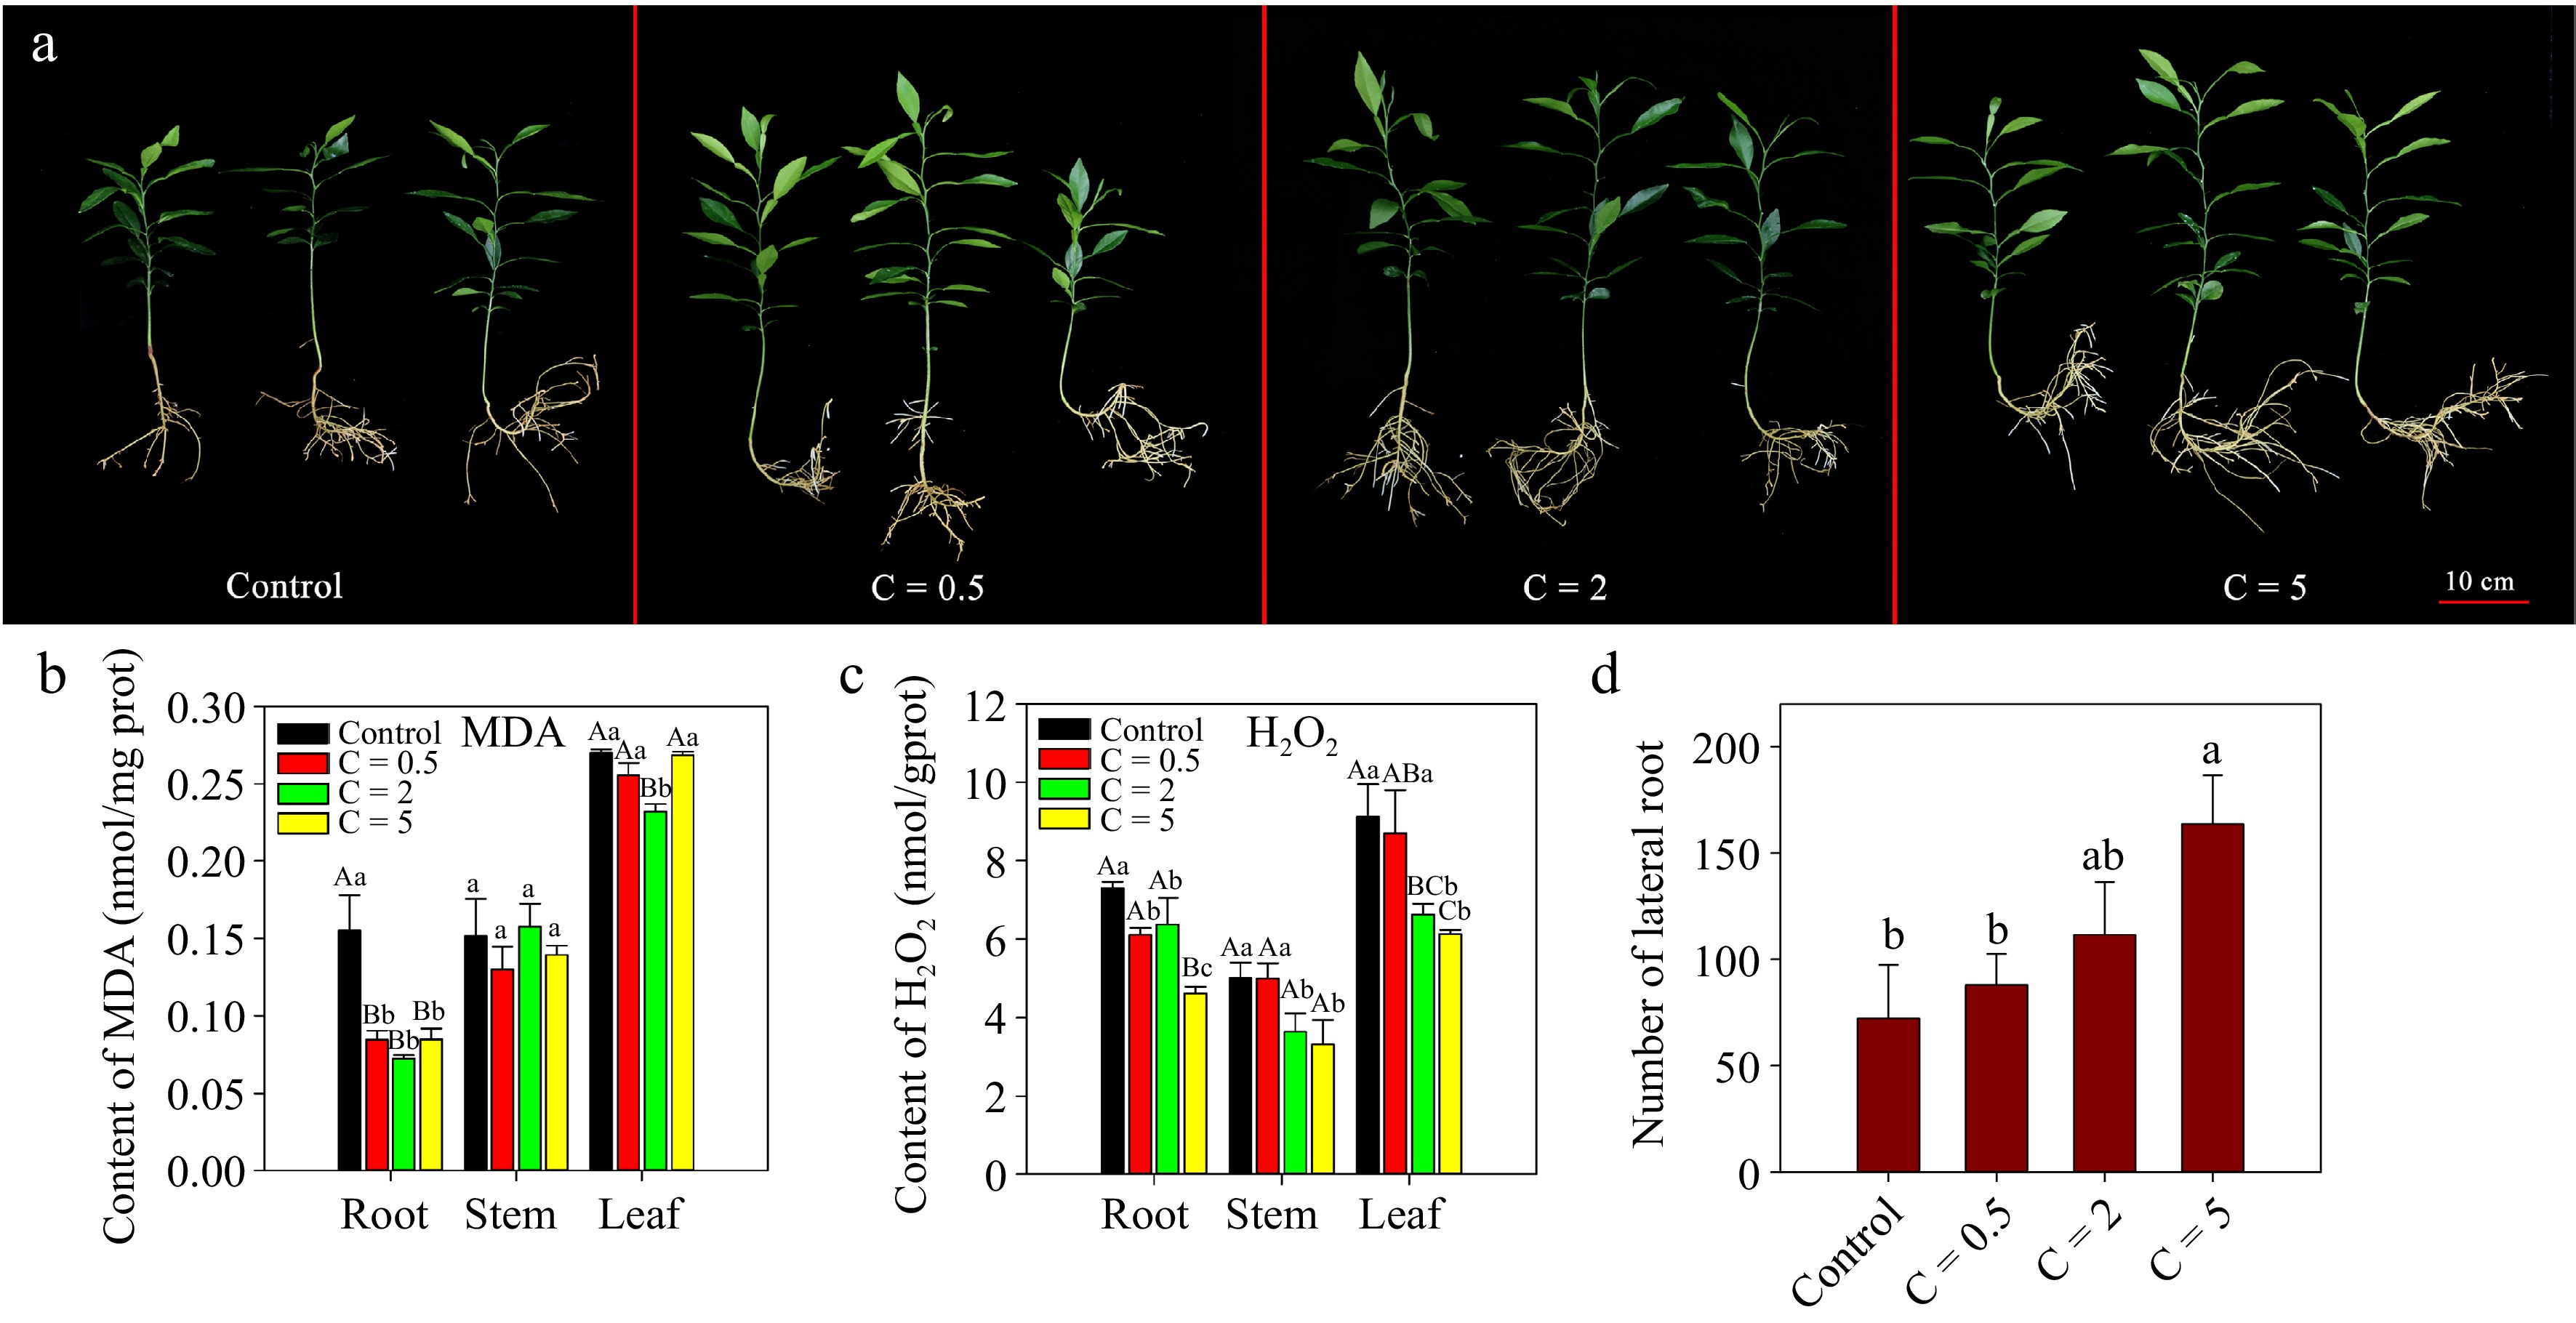
Figure 7.
Exogenous JA treatment of Cj seedlings with different concentrations under alkalinity stress. (a) Phenotypes of Cj seedlings; (b)−(c) contents of MDA and H2O2 in the root, stem and leaf tissues; (d) number of LRs of Cj seedlings. In this figure, the treatment groups are named 'C=concentration'. C = 0.5 indicates that the JA treatment concentration was 0.5 μM. Lowercase and capital letters represent statistically significant differences (p < 0.05) and highly statistically significant differences (p < 0.01), respectively. Data were analyzed using one-way ANOVA.
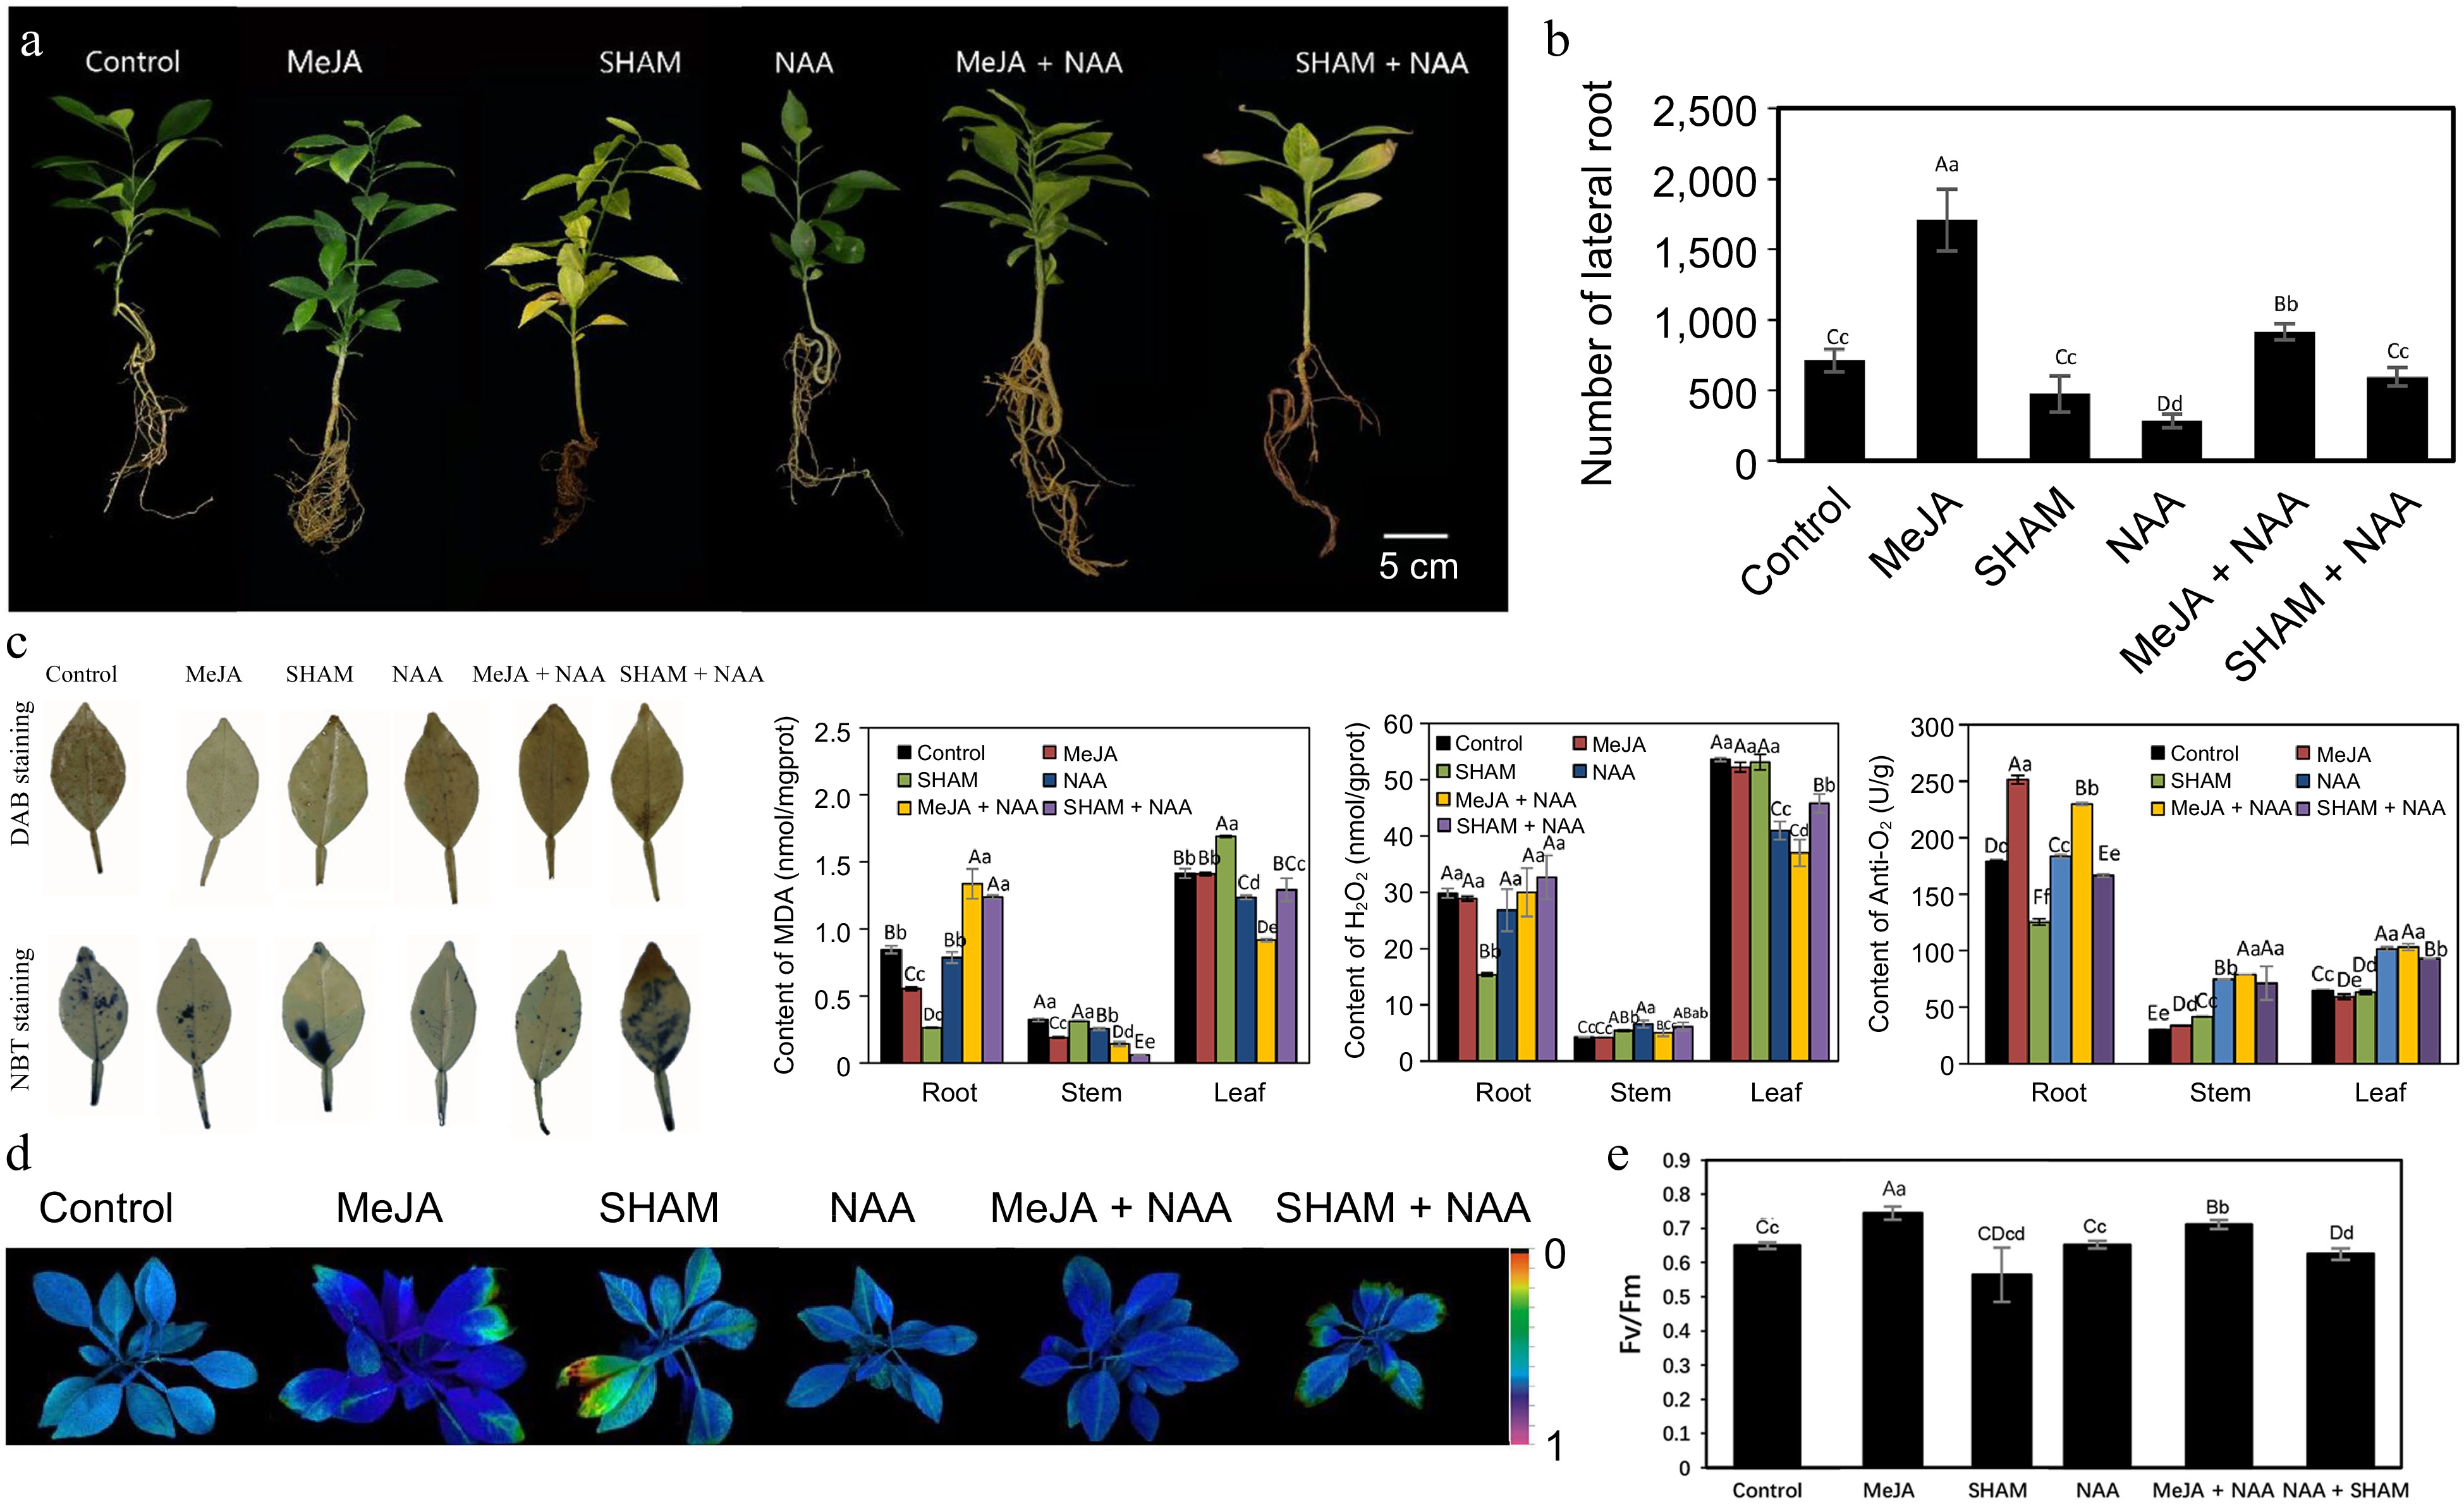
Figure 8.
Exogenous MeJA, SHAM and NAA treatment of Cj seedlings under alkalinity stress. (a) Phenotypes of Cj seedlings; (b) Number of LRs of Cj seedlings; (c) In situ accumulation of H2O2 and anti-O2·– examined by histochemical staining with DAB and NBT in leaf tissue and the contents of MDA, H2O2 and anti-O2·– in the root, stem and leaf tissues; (d) chlorophyll fluorescence imaging; (e) Fv/Fm ratios. Lowercase and capital letters represent statistically significant differences (p < 0.05) and highly statistically significant differences (p < 0.01), respectively. Data were analyzed using one-way ANOVA.
-
Two citrus rootstocks, Cj and Pt, and one navel orange scion, LL, were used in this study. Cj has been reported to be a rootstock with tolerance to iron deficiency and alkalinity stress[64, 65]. However, little is known about its genetic background and molecular regulatory mechanism. In this study, its performance and response to alkalinity stress, together with Pt, an alkalinity stress-sensitive rootstock, were investigated. In our previous study[4], the root, stem and leaf were affected under alkalinity stress in both Cj and Pt, but the impact on Pt was more serious than that on Cj in every part of the plants, especially in the root tissues. The contents of mineral elements were dramatically influenced by alkalinity stress in both Cj and Pt, and they also showed differences between Cj and Pt[4]. In the present study, similar results were also obtained in 'Lane Late' navel orange grafted onto these two rootstocks (Cj and Pt) (Figs 1 & 2). In calcareous soil, Pt + LL was dramatically inhibited in growth and yield and was more sensitive to drought and iron deficiency, whereas no significant effect was found on Cj + LL (Figs 1 & 2). These results indicated that Cj was more tolerant to alkalinity stress than Pt.
Jasmonate plays a positive role in tolerance to alkalinity stress
-
Previous studies have shown that JA is closely related to salt and alkalinity stress. For instance, Pedranzani et al.[17] showed that salt-tolerant tomato cultivars have higher levels of JAs than salt-sensitive cultivars. A similar result was also obtained by Kang et al.[16], who reported that higher endogenous JA levels accumulated in salt-tolerant cultivar crops compared with the salt-sensitive cultivar, and the application of exogenous JA effectively reduced sodium ions in salt-tolerant rice. In this study, the key genes involved in JA biosynthesis were all upregulated in Cj + LL, such as PKT, OPR2, ACX and LOX (Table 1 & Fig. 5). The JA level in Cj + LL was higher than that in Pt + LL (Fig. 6a). In addition, JA treatment has been found to enable recovery from the salt-induced defects in seedling development and photosynthetic activity or to enhance salt stress tolerance in several crop cultivars[15,18,20]. In this study, under alkalinity stress, exogenous JA treatment significantly reduced the levels of MDA and H2O2 in Cj, and an appropriate concentration of JA promoted lateral root generation (Figs 7 & 8). In our previous study, an appropriate concentration of JA with auxin could remarkably enhance the tolerance of Pt to alkalinity stress[4]. These results showed a positive role of JA in alkalinity stress responses in citrus.
When plants are exposed to stress conditions, reactive oxygen species (ROS) are generated[66]. Several studies have shown that exogenous JA treatment of soybean significantly increases the activities of SOD, POD, APX and CAT under salt or drought stress, and the increase in these antioxidant activities is essential for salt tolerance in soybean[67,68]. Qiu et al.[18] reported that exogenous JA enhanced the tolerance of wheat seedlings to salt stress by enhancing the activities and concentrations of antioxidants, including GSH, SOD, POD, CAT and APX. Moreover, exogenous application of JA can also significantly increase the content of GSH in Wolffia arrhizal and Agropyron cristatum under lead or water stress[69,70]. Similarly, the results of this study showed that the GSH concentration was higher in Cj + LL, which contained a higher level of JA (Fig. 6c). Moreover, under alkalinity stress, exogenous JA treatment could significantly reduce the levels of MDA and H2O2 in both Cj (Figs 7 & 8) and Pt[4]. Taken together, these results indicated that JA can effectively scavenge ROS by enhancing the concentration of antioxidant compounds to increase the ability of Cj to resist alkalinity stress.
In this study, the genes involved in lignin biosynthesis were significantly affected by alkalinity stress in both Cj and Pt (Fig. 5d). In calcareous soil, numerous genes in lignin biosynthesis were differentially expressed between Cj + LL and Pt + LL, and those key genes (such as CCR and 4CL) were all downregulated in Cj + LL (Table 1). In addition, the content of lignin in Cj + LL was much lower than that in Pt + LL (Fig. 6b). These results indicated that alkalinity stress has a significant influence on lignin biosynthesis in plants and can cause lignification of root tip cells. Denness et al.[26] has shown that lignin biosynthesis was regulated by an ROS- and JA-dependent process. JA and ROS have opposite effects on lignin deposition. JA functions as a repressor of lignin production, while ROS are required for lignin biosynthesis. Thus, in this study, alkalinity stress-induced lignin production may have occurred by inducing the generation of ROS. It is known that the ligneous cells of root tips will lose absorption and division functions. An excess of lignin production can lead to the loss of root absorption capacity[44]. Therefore, this difference may be an important factor in the greater tolerance of Cj than Pt to alkalinity stress.
Exogenous auxin promotion of LR generation in citrus under alkalinity stress may depend on changes in endogenous auxin content
-
The auxin pathway controls the development of LRs in various steps from priming to initiation, patterning, and emergence[6]. In our previous study[4], the expression of the genes in the auxin pathway was largely changed in both Cj and Pt under alkalinity stress, and the LR development of Cj and Pt was closely related to the content of IAA. In this study, the genes in which the auxin signal transduction pathway were enriched were also differentially expressed between the root tissue of Cj + LL and Pt + LL (Table 1). Under pH 9.5 conditions, treatment with exogenous JA and auxin analogs on Pt seedlings could significantly increase the number of LRs[4]. However, in this study, under conditions of pH 8.5, treatment of Cj seedlings with NAA had little effect on LR generation (Fig. 8). In our previous study[4], we found that the content of IAA largely decreased under pH 9.5 conditions in Cj but showed no change under pH 8.0 conditions in Cj; however, the content of IAA largely decreased in response to conditions of pH 8.0 in Pt. In addition, the content of IAA in the roots of Cj + LL was much higher than that in the roots of Pt + LL (Fig. 2b). Therefore, the endogenous IAA level, which is higher in Cj and has little change under nonextreme alkalinity stress, may be the reason that NAA treatment had little effect or a negative effect on Cj LR generation. On the other hand, the IAA content is largely decreased in Pt under alkalinity stress, and added exogenous auxin could promote LR generation[4]. Therefore, we think that exogenous auxin promoting LR generation in citrus under alkalinity stress may depend on the change in endogenous auxin content.
Other metabolic pathways and genes involved in response to alkalinity stress
-
In this study, the DEGs enriched in the CK signaling pathway were all downregulated in the roots of Cj + LL or Cj (Table 1 & Fig. 5c). Previous studies have shown that plants negatively affected in CK signal transduction or perception have more LRs[71,72]. Laplaze et al.[73] reported that CKs inhibit LR formation by repressing several auxin efflux carriers of PIN proteins to reduce auxin accumulation in LR founder cells. Moreover, Moriwaki et al.[74] showed that CKs inhibit LR formation by upregulating the MIZ1 gene, a gene involved in hydrotropism, to reduce IAA accumulation in the root. In this study, CK signal transduction was downregulated in the roots of Cj + LL/Cj and may play a negative role in LR development in citrus under alkalinity stress by crosstalk with the auxin pathway.
In this study, a number of H+-transporting ATPase genes were differentially expressed between Cj + LL and Pt + LL (Table 1) and were also differentially expressed between Cj and Pt under alkalinity stress (Fig. 5f). Moreover, the number of upregulated genes in Pt + LL or Pt was greater than that in Cj + LL or Cj. This result indicates that Pt may be able to release more protons from the roots than Cj releases. In addition, the expression of most H+-transporting ATPase genes was upregulated under extreme alkalinity stress (pH value 9.5) in both Cj and Pt (Fig. 5f), which indicated that the citrus rootstock could upregulate the expression of H+-transporting ATPase genes to release more protons to neutralize alkali in the rhizosphere and to enhance tolerance to alkalinity stress. Pt is able to release more protons from the roots than Cj, probably because Pt is more sensitive to alkalinity stress.
-
In this study, we comprehensively analyzed the transcriptomes, mineral elements, plant hormones and metabolites of Cj + LL and Pt + LL. The differential performance of Cj + LL and Pt + LL was associated with a number of metabolic pathways. Our data strongly indicate that jasmonate and its signal transduction pathway play crucial roles in tolerance to alkalinity stress in citrus. We propose that JA is involved in regulating LR formation, lignin biosynthesis and ROS scavenging. The differences in the contents of plant hormones (IAA, JA and ABA) and the expression of genes and their signaling pathways underlie the differential performance between Cj + LL and Pt + LL during alkalinity stress.
-
The authors confirm contribution to the paper as follows: manuscript writing, polishing and submission: Xu C, Wu J; data analysis: Xu C, Wu J; project conception and design: Wu J, Yi H; sample collection and experimentation: Cao J, Su M, Yan X, Yang H. All authors have read and approved the final manuscript.
-
All data generated or analyzed during this study are included in this published article and its supplementary information files.
This research was supported by Natural Science Foundation of China (NSFC) (32072541), National Modern Citrus Industry System (CARS-26), Collection, Utilization and Innovation of Germplasm Resources by Research Institutes and Enterprises of Chongqing (cqnyncw-kqlhtxm) and Hubei Province Technology Innovation Project (2023BEB025). We thank Wei Qin (a faculty of Agricultural Bureau of Changyang) and Changzao Li (the manager of Changyang orchard) for material collection.
-
The authors declare that they have no conflict of interest.
-
# Authors contributed equally: Chenyu Xu, Junying Cao
- Supplemental Table S1 A summary of RNA-seq.
- Supplemental Table S2 The primer sequences for quantitative real-time PCR.
- Supplemental Table S3 The nutritive elements content and pH value of the soil in the Changyang orchard and the control orchard.
- Supplemental Table S4 The tree vigor and yield of Pt+LL and Cj + LL.
- Supplemental Table S5 The content of mineral elements in different tissues of Cj + LL and Pt + LL.Different lowercase represents statistically significant differences (p < 0.05). Analysed using Student's t-test.
- Supplemental Table S6 An integration of differentially expressed genes in the root, stem and leaf tissues between Cj + LL and Pt + LL.
- Supplemental Table S7 The genes differentially expressed among three tissues between Cj + LL and Pt + LL.
- Supplemental Table S8 The enriched Gene Ontology (GO) terms of the DEGs in the root, stem and leaf tissues of Cj + LL and Pt + LL.
- Supplemental Table S9 The enriched KEGG pathways of the DEGs in the root, stem and leaf tissues of Cj + LL and Pt + LL.
- Copyright: © 2024 by the author(s). Published by Maximum Academic Press, Fayetteville, GA. This article is an open access article distributed under Creative Commons Attribution License (CC BY 4.0), visit https://creativecommons.org/licenses/by/4.0/.
-
About this article
Cite this article
Xu C, Cao J, Su M, Yan X, Yi H, et al. 2024. Comprehensive analysis provides insights into Ziyang xiangcheng (Citrus junos Sieb.) tolerance of alkalinity stress. Fruit Research 4: e001 doi: 10.48130/frures-0023-0037 

Comprehensive analysis provides insights into Ziyang xiangcheng (Citrus junos Sieb.) tolerance of alkalinity stress
- Received: 03 August 2023
- Revised: 27 September 2023
- Accepted: 11 October 2023
- Published online: 02 January 2024
Abstract: Alkaline soil is one of the major problems affecting the development of the citrus industry. Ziyang xiangcheng (Citrus junos Sieb. ex Tanaka) (Cj) is an alkalinity stress-tolerant citrus rootstock. In this study, two citrus rootstocks (Cj and Poncirus trifoliata (L.) Raf.) (Pt)) and one navel orange scion ('Lane Late' navel orange (Citrus sinensis (L.) Osb.) (LL)) were used. The root, stem and leaf tissues of grafted materials Cj + LL and Pt + LL grown in calcareous soil were used to identify genes and pathways that are responsive to alkalinity stress using comparative transcriptomics. Seedlings of Cj and Pt cultured in nutrient solutions at three pH grades were used to perform a supplemental experiment. A comprehensive analysis of the RNA-seq data, physiology, biochemistry, agronomic traits and mineral elements of the Cj + LL, Pt + LL, Cj and Pt materials revealed several candidate pathways and genes that were highly regulated under alkalinity stress. The data suggest that the jasmonate pathway may play crucial roles in tolerance to alkalinity stress in Cj by interacting with other plant hormones, lignin biosynthesis and the ROS scavenging system. These results provide new clues for future investigations of the mechanisms underlying the tolerance of citrus to alkalinity stress.
-
Key words:
- Citrus rootstock /
- Alkalinity stress /
- Jasmonic acid /
- Transcriptome /
- Lignin