


-
Apple (Malus × domestica) is one of the most favorite fruit crops around the world with its good flavor and nutritive value. Many factors affect the commercial traits of apples, including different crop load levels, which can significantly affect the quality and ripeness of the fruit[1]. Under natural conditions, only 8%−10% of apple blossoms can develop into fruit. An ideal yield is obtained when approximately 5% of the blossoms set fruit. Crop load influences fruit quality, nutritional balance, and return bloom in the 'Honeycrisp' apple[2], and the crop load of apples is related to their rootstock type, and usually vigorous stock can load more fruit. Different rootstocks and interstocks have many complex and not fully understood effects on the growth, flowering, fruiting, yield efficiency, and fruit quality of apple trees[3]. Rootstock and crop load are one of the important factors in orchard management, which have a significant impact on yield and fruit quality. The research on the effect of rootstock on fruit quality often ignores confounding factors such as crop load and fruit size[1,4].
As a means of controlling crop load, thinning can improve return bloom for the following year and promote annual fruiting. When proper thinning method is implemented, the crop load is reduced to a level that balances tree carbohydrate usage between developing fruit in the current year and flower bud development for the following crop. Several techniques to manage the crop load of apples include hand thinning after fruit set, chemical thinning, blossom thinning with environmentally friendly compounds, such as corn oil emulsion and essential plant oils, use of tree shakers, and mechanical thinning at bloom. However, due to the high costs and requirement of skilled laborers for the manual thinning method, chemical thinning becomes the best option for growers gradually. Research on chemical thinners has been reported until now, with the aim of thinning and conserving labor as well as reducing the impact on fruit quality. Additionally, chemical thinning agents significantly impact source-sink relationships, and it can balance the competitive effects between fruit and growing shoots[1]. The optimal concentration of olive oil treatment has the effect of thinning and avoids fruit rust while thinning[5]. Lime sulfur inhibits embryo fertilization by inhibiting the growth of pollen tubes in apples, which in turn has a thinning effect[6]. The first study of ethephon (2-chloroethyl phosphonic acid) in flower thinning may be in 1969[7]. Once absorbed by the tissues, ethephon is hydrolyzed, releasing ethylene. The release of ethylene, a gas that can induce leaf abscission from plants in containers, may also be the main mechanism for its thinning effect[8]. Recently, several commercial fruit agents have been developed and released in the market containing different compounds including Promalin, MaxCel, and Accede. These fruit agents are effective[9], but are difficult to apply widely in some regions due to their limited popularity.
NAA and its amide, NAA(m), were first discovered in fruit thinners. Its thinning effect was discovered accidentally before that auxin was thought to play a role in delaying abscission[10]. Compared to NAA, NAA(m) is more reliable[11]. With the late application, NAA(m) may slow down fruit growth, resulting in reduced fruit size at harvest[12]. However, the molecular mechanism of how NAA affects fruit development is not well understood. Benzyladenine (BA) is a good candidate for thinning because it naturally exists in some plants. BA seems to be more stable and effective than NAA, as good as carbaryl, and safer for beneficial insects[12]. Fruit size, percent dry weight, soluble solids content, and return bloom were increased by using 6-benzyl adenine (6-BA) and NAA to control the crop load of the 'Empire' apple[13]. Carbaryl as a pesticide can also be used as a fruit thinning agent. Carbaryl is a mild diluent that can be used with another compound (such as NAA or BA) or at low light intensities to produce a stronger dilution effect[8,12]. However, a related study showed that carbaryl does not enhance small apple fruit abscission in low light[14]. Also, carbaryl has a promotion effect on the return bloom[12]. Photosystem II (PSII) inhibitor Metamitron has been shown to reduce fruit set in apples[15]. When applying 150 g/ha or 180 g/ha of Metamitron on apple trees at a diameter of 6 mm or 10 mm stages, it can achieve a good thinning effect[16].
In addition to affecting the fruit set rate during thinning, chemical thinning agents may also have an impact on fruit quality. Fruit set and development processes depend on auxin, gibberellin, and cytokinin. The application of these substances in the fruit set process will have the effect of thinning flowers and fruits[17]. The application of these plant hormones also has a regulatory effect on fruit size, fruit shape, and nutrient content. The effects of exogenous hormones on plants vary depending on the type and concentration of hormones applied. The study reported that ARF106, a gene associated with fruit enlargement, was identified by QTL localization and may be involved in the NAA response process through the hormonal pathway[18]. Also, a suitable concentration of NAA treatment promoted the ripening of apples before harvesting[19]. The application of transcriptome is important to reveal the effects of the exogenous hormone on fruit development and the ripening processes. Previous studies have focused on the exogenous NAA in the development of the ovary and fruit set by transcriptome analysis[17,20], however, the application of exogenous NAA throughout the fruit development period has rarely been investigated.
A better understanding of the relationship between the rootstock and crop load will contribute to future breeding and production for apple. Meanwhile, it is necessary to explore the optimal strategies for the use of chemical thinning agents under an optimal crop load. Based on this, we evaluated different crop load on apple tree development, fruit quality, and yield in the different rootstock. After that, we performed the thinning effect of several different fruit thinning agents in terms of the type, concentration, and time of spray applications in the widely used dwarfing interstock under an optimal crop load. NAA treatment significantly inhibited fruit development and ripening. Applying exogenous NAA at the precise timing could potentially assume a pivotal role in regulating fruit ripening and enhancing fruit quality. Therefore, we performed transcriptome analysis to investigate the molecular mechanisms of how NAA, as a fruit thinning agent, affects the process of fruit development. Our results provide a reference standard for the use of chemical thinners and optimal crop load on apple trees, which can benefit apple cultivation and production.
-
Seven-year-old 'Fuji' pollinated by 'Gala', with M26 as the intermediate rootstock and eight-ribbed begonia (Malus robusta Rehd) as the base rootstock. Selecting trees with strong growth, large flowers, and consistent tree potential as a single plot, each plot of tree was marked with three large branches in different directions, and three plots were repeated for each treatment. All the materials were cultivated at the Luochuan Experiment Station of Northwest A&F University, located in Luochuan, Shaanxi Province, on the loess plateau of China (35°78' N, 109°37' E). The station is characterized by an average annual temperature is 9.3 °C, an average altitude is 1,100 m, sunlight hours are 2,551, annual radiation is 55.4 KJ/cm, the frost-free period is 165 d, and the annual rainfall is 622 mm.
We investigated fruit thinning agents from three aspects of different types, concentration, and time of application respectively. The application time of the fruit thinning agent was sprayed 15 d after the bloom stage (May 2nd, 2021). We used an electric backpack sprayer to spray large branches, with the nozzle about 10−15 cm from the fruit, spraying evenly without forming liquid beads. The specific agents and statistical methods are shown below:
(1) Different types of fruit thinning agents
Carbaryl (Macklin, China), 6-BA (Macklin, China), NAA (Macklin, China), and Metamitron (Macklin, China) were sprayed in the treatment groups and water was used as the control. The spraying date for this experiment was May 2nd, 2021.
(2) Different concentrations of fruit thinning agents
Carbaryl, 6-BA, and NAA were sprayed in the treatment groups, where three different spray concentrations were set up in each treatment, and water was used as the control. The concentrations of Carbaryl were 500, 1,000, 2,000 mg/L and 6-BA were 5, 10, 15 g/L and NAA were 10, 20, 30 mg/L.
(3) Different spraying times of fruit thinners
Four treatments and one control group were set up in the experiment, and the fruit thinning agent was sprayed on May 1st, 2021, May 6th, 2021, May 11th, 2021, May 16th, 2021, and May 21st, 2021 after the bloom. Water was used as the control.
(4) Different statistical methods of indicators
The number of fruit clusters was counted before spraying the thinning agent, and then the number of clusters with fruit was counted after the fruit set stabilizes. The two data were divided to obtain the cluster fruit set rate. The center flowers fruit set rate was obtained by counting the number of center flowers before spraying divided by the number of center flowers with fruit after spraying. After the fruit set, the number of fruits on each cluster was counted and classified according to criteria 1, 2, 3, and more. After harvesting all fruits, 20 fruits were randomly selected from the marked large branches of each plot in each treatment. After the harvest of all fruits, fruit quality was measured to evaluate the effect of the fruit thinning agent.
$\rm Fruit \;set\; rate =\dfrac{ Number\; of\; fruiting\; flowers}{ Total\; flowers}$ $\rm Cluster \;fruiting \;set\; rate =\dfrac{\rm Number\; of\; fruiting\; clusters}{\rm Total\; number\; of \;clusters}$ $\rm Center\; flower \;fruit \;setting\; rate =\dfrac{\rm Number\; of \;center\; flower\; fruits}{\rm Total \;number \;of\; center\; flowers}$ $\rm Side\; flower \;fruit \;setting \;rate =\dfrac{\rm Number \;of \;side \;flower \;fruits}{\rm Total \;side \;flowers} $ The proportion of different types of fruit (100%) = Single-fruit ratio (Number of single fruits ⁄ Number of fruit set) + Double fruit ratio (Number of double fruits ⁄ Number of fruit set) + Triple fruit ratio (Number of triple fruits ⁄ Number of fruit set)
Fruit quality measurement indicators include single fruit weight, fruit cross and longitudinal diameter, contents of soluble sugar, and titratable acid content. The single fruit weight was measured with an accuracy of 0.01 g, the fruit cross and longitudinal diameter were measured with vernier calipers, the content of soluble sugars were measured with a PAL-1 digital saccharimeter (ATAGO, JP), and the titratable acid content was measured with a GMK-835F acidity meter (G-WON, KP). Fruit shape index and sugar-acid ratio were calculated from fruit cross and longitudinal diameter, content of soluble sugar and titratable acid content, respectively.
Experimental design of load capacity
-
In this experiment, we chose three different cultivation patterns of 'Fuji' apples, including seven-year-old dwarfing rootstock fruit trees, seven-year-old dwarfing interstock fruit trees, and 20-year-old vigorous stock fruit trees. Seven-year-old 'Fuji' pollinated by 'Gala', with M26 as the interstock and eight-ribbed begonia as the base rootstock. The tree shape was a free spindle shape, with 1.5 m × 4 m spacing, north-south row direction, and soil management was a natural grass system. 20-year-old 'Fuji' pollinated with 'Gala', the base rootstock of eight-ribbed begonia, was spaced 6 m × 8 m in north-south rows with uniform growth after the second interruption.
Three different types of fruit trees, including vigorous stock, dwarfing rootstock, and dwarfing interstock were designated A, B, and C. Fruit retention was determined by the production standard before the trial, and a control group (Control) was set up based on the trunk girth, and the number of fruit retention was increased and decreased based on the control group. The fruit retention of vigorous stock was divided into five combinations: The fruit retention number of 240, 320, 480, 560, and 400 for A1−A4 and control, respectively. The fruit retention of dwarfing rootstock was divided into five combinations: 90, 110, 150, 170, and 130 for B1−B4 and control, respectively. The fruit retention of dwarfing interstock was divided into five combinations: 100, 150, 210, 260, and 180 for C1−C4 and control, respectively. The test single plant was a plot and each treatment was replicated in three plots.
Tree growth-related index included main branch diameter increment, tree height growth rate, and new length increment. On May 26th, 2021 and November 28th, 2021, the diameter of the branch was measured at 15 cm above the ground, and the increment of the branch was obtained by the difference between the two periods. Selecting the new shoot without an autumn tip, its length was measured with steel tape on May 24th, 2021 and October 15th, 2021. The new length increment was obtained by two data differences. Leaf-related indexes including leaf area, and chlorophyll content. The middle leaves of the new annual branches of the test trees were selected, and 20 leaves were selected from each tree. The leaf area was measured using a handheld leaf area meter YMJ-D (Tuopu, China), and the chlorophyll content in the leaves was determined in vivo using a SPAD chlorophyll meter (Konica, Japan). The single plant yield of each plot was counted, then the number of apples planted per acre was deduced according to the plant spacing of each test variety, and the mu yield was deduced by multiplying the single plant yield by the number of apple plants per acre.
Transcriptome sample preparation, library construction, and analysis of RNA-seq samples
-
The transcriptome samples were divided into two groups, treated with 20 mg/L NAA and water, respectively. Select fruit samples during the early fruit stage, fruit enlargement stage, before and after fruit coloration. Fresh fruit samples were collected at 60, 90, 120, and 150 d after flowering, with five uniformly sized, undamaged fruits harvested each time, and kernels removed. Each treatment has three biological replicates. The fruit pulp was mixed and put into marked tinfoil bags, which were quickly frozen in liquid nitrogen and stored at −80 °C.
The sequencing libraries were generated by using the NEBNext® UltraTM RNA Library Prep Kit for Illumina® (NEB, USA). In summary, mRNA was purified from total RNA using poly-T oligo-attached magnetic beads. First-strand cDNA was synthesized with random hexamer primers and M-MuLV Reverse Transcriptase (RNase H). Second-strand cDNA synthesis was performed using DNA polymerase I and RNase H, and Phusion High-Fidelity DNA polymerase was used for PCR. Universal PCR primers and index (X) primers were used. Finally, PCR products were purified (AMPure XP system) and library quality was assessed on an Agilent Bioanalyzer 2100 system.
The RNA-seq process involves quality control, sequence alignment, and differential analysis. Clean data were obtained by removing adapter-containing reads, ploy-N-containing reads and low-quality reads from the raw data. After quality control by FastQC v0.11.9, the clean reads were mapped to the reference genome[21] by HISAT2 v2.1.0[21,22]. After alignment with the genome, the transformed and sorted binary bam files were obtained using samtools v1.9[23] with the parameter -bq 1. Based on the genome annotation file, the bam file reads were counted using Htseq v0.13.5[24]. Differential expression analysis was performed on the read counts matrix of 24 samples using R/DESeq2.[25]. Genes with absolute values of log2(fold change) > 1 and padj < 0.05 are defined as significantly different genes. FPKM represents the fragment of the exon model per million mappings, which is calculated using the following formula: FPKM = Read counts / (Mapped reads (Millions) × Exon length (KB). Gene ontology (GO) enrichment of differentially expressed genes was used agriGO v2.0. Differentially expressed genes were identified as highly enriched for GO terms with FDR less than 0.05. Heatmaps and Venn plots were produced by TBtools[26].
Co-expression network construction and trait association analysis of modules
-
To show the co-expression network of the differentially expressed genes associated with fruit development traits. mRNAs (990) were selected as candidates using the WGCNA package (1.70-3) in the R environment[27]. The matrix-type used for soft threshold filtering is 'unsigned' with the soft threshold = 5. The assignment of modules to mRNAs is determined using a Topological Overlap Matrix (TOM) and detected by the dynamic tree-cutting method. The modules eigengenes (MEs) are used for expression patterns and module genes were used for further research (Supplemental Table S1). The fruit coloration trait is assigned a value of 0 for uncolored, 1 for not fully colored, and 2 for fully colored. The hub genes of the trait association module were screened by gene significance (GS) > 0.6 and module membership (MM) > 0.8. The top 200 connections of edges were selected as candidates for co-expression networks. The hub genes and the neighboring key genes from the extracted connections were used to construct simple co-expression networks in Cytoscape[28].
-
Optimal crop load in apple development can enhance fruit quality while reducing the nutritional consumption of the tree. To explore the optimal crop load for apple production, we performed different degrees of crop load through three common types of cultivated apple trees: vigorous rootstock, dwarfing rootstock, and dwarfing interstock. For the different degrees of crop load, we set the fruit number of 240 (A1), 320 (A2), 480 (A3), and 560 (A4), as well as control (400) for the vigorous stock apple trees. With the dwarfing rootstock apple trees, we also set four crop load degrees including 90 (B1), 110 (B1), 150 (B1), and 170 (B1), as well as 130 for the control. For the dwarfing interstock apple trees, crop load with 100 (C1), 150 (C2), 210 (C3), and 260 (C4), as well as control (180) treatments were investigated (Fig. 1a−d). Then, we assessed the growth status of apple trees and fruit quality under different crop load treatment. Different crop load had a certain influence on the tree growth status and fruit weight (Figs 1 & 2). For the vigorous stock fruit trees, when the crop load was 320 per plant (A2), the tree height growth rate (THGR) presented the highest levels at 0.31%. Similarly, the main branch diameter increment (MBD) and the new length increment (NLI) also showed the highest levels at 5.29 and 4.35 cm with the A2 crop load treatment (Fig. 1a, left plot). The dwarfing rootstock apple trees showed the highest level of THGR at the B2 crop load, and the highest MBD under the B2 and B4 crop load, respectively. By contrast, the length of NLI showed no significant between control and treatment (Fig. 1a, middle plot). For the dwarfing interstock apple trees, the C3 crop load presented the highest level of THGR and MBD (Fig. 1a, right plot).
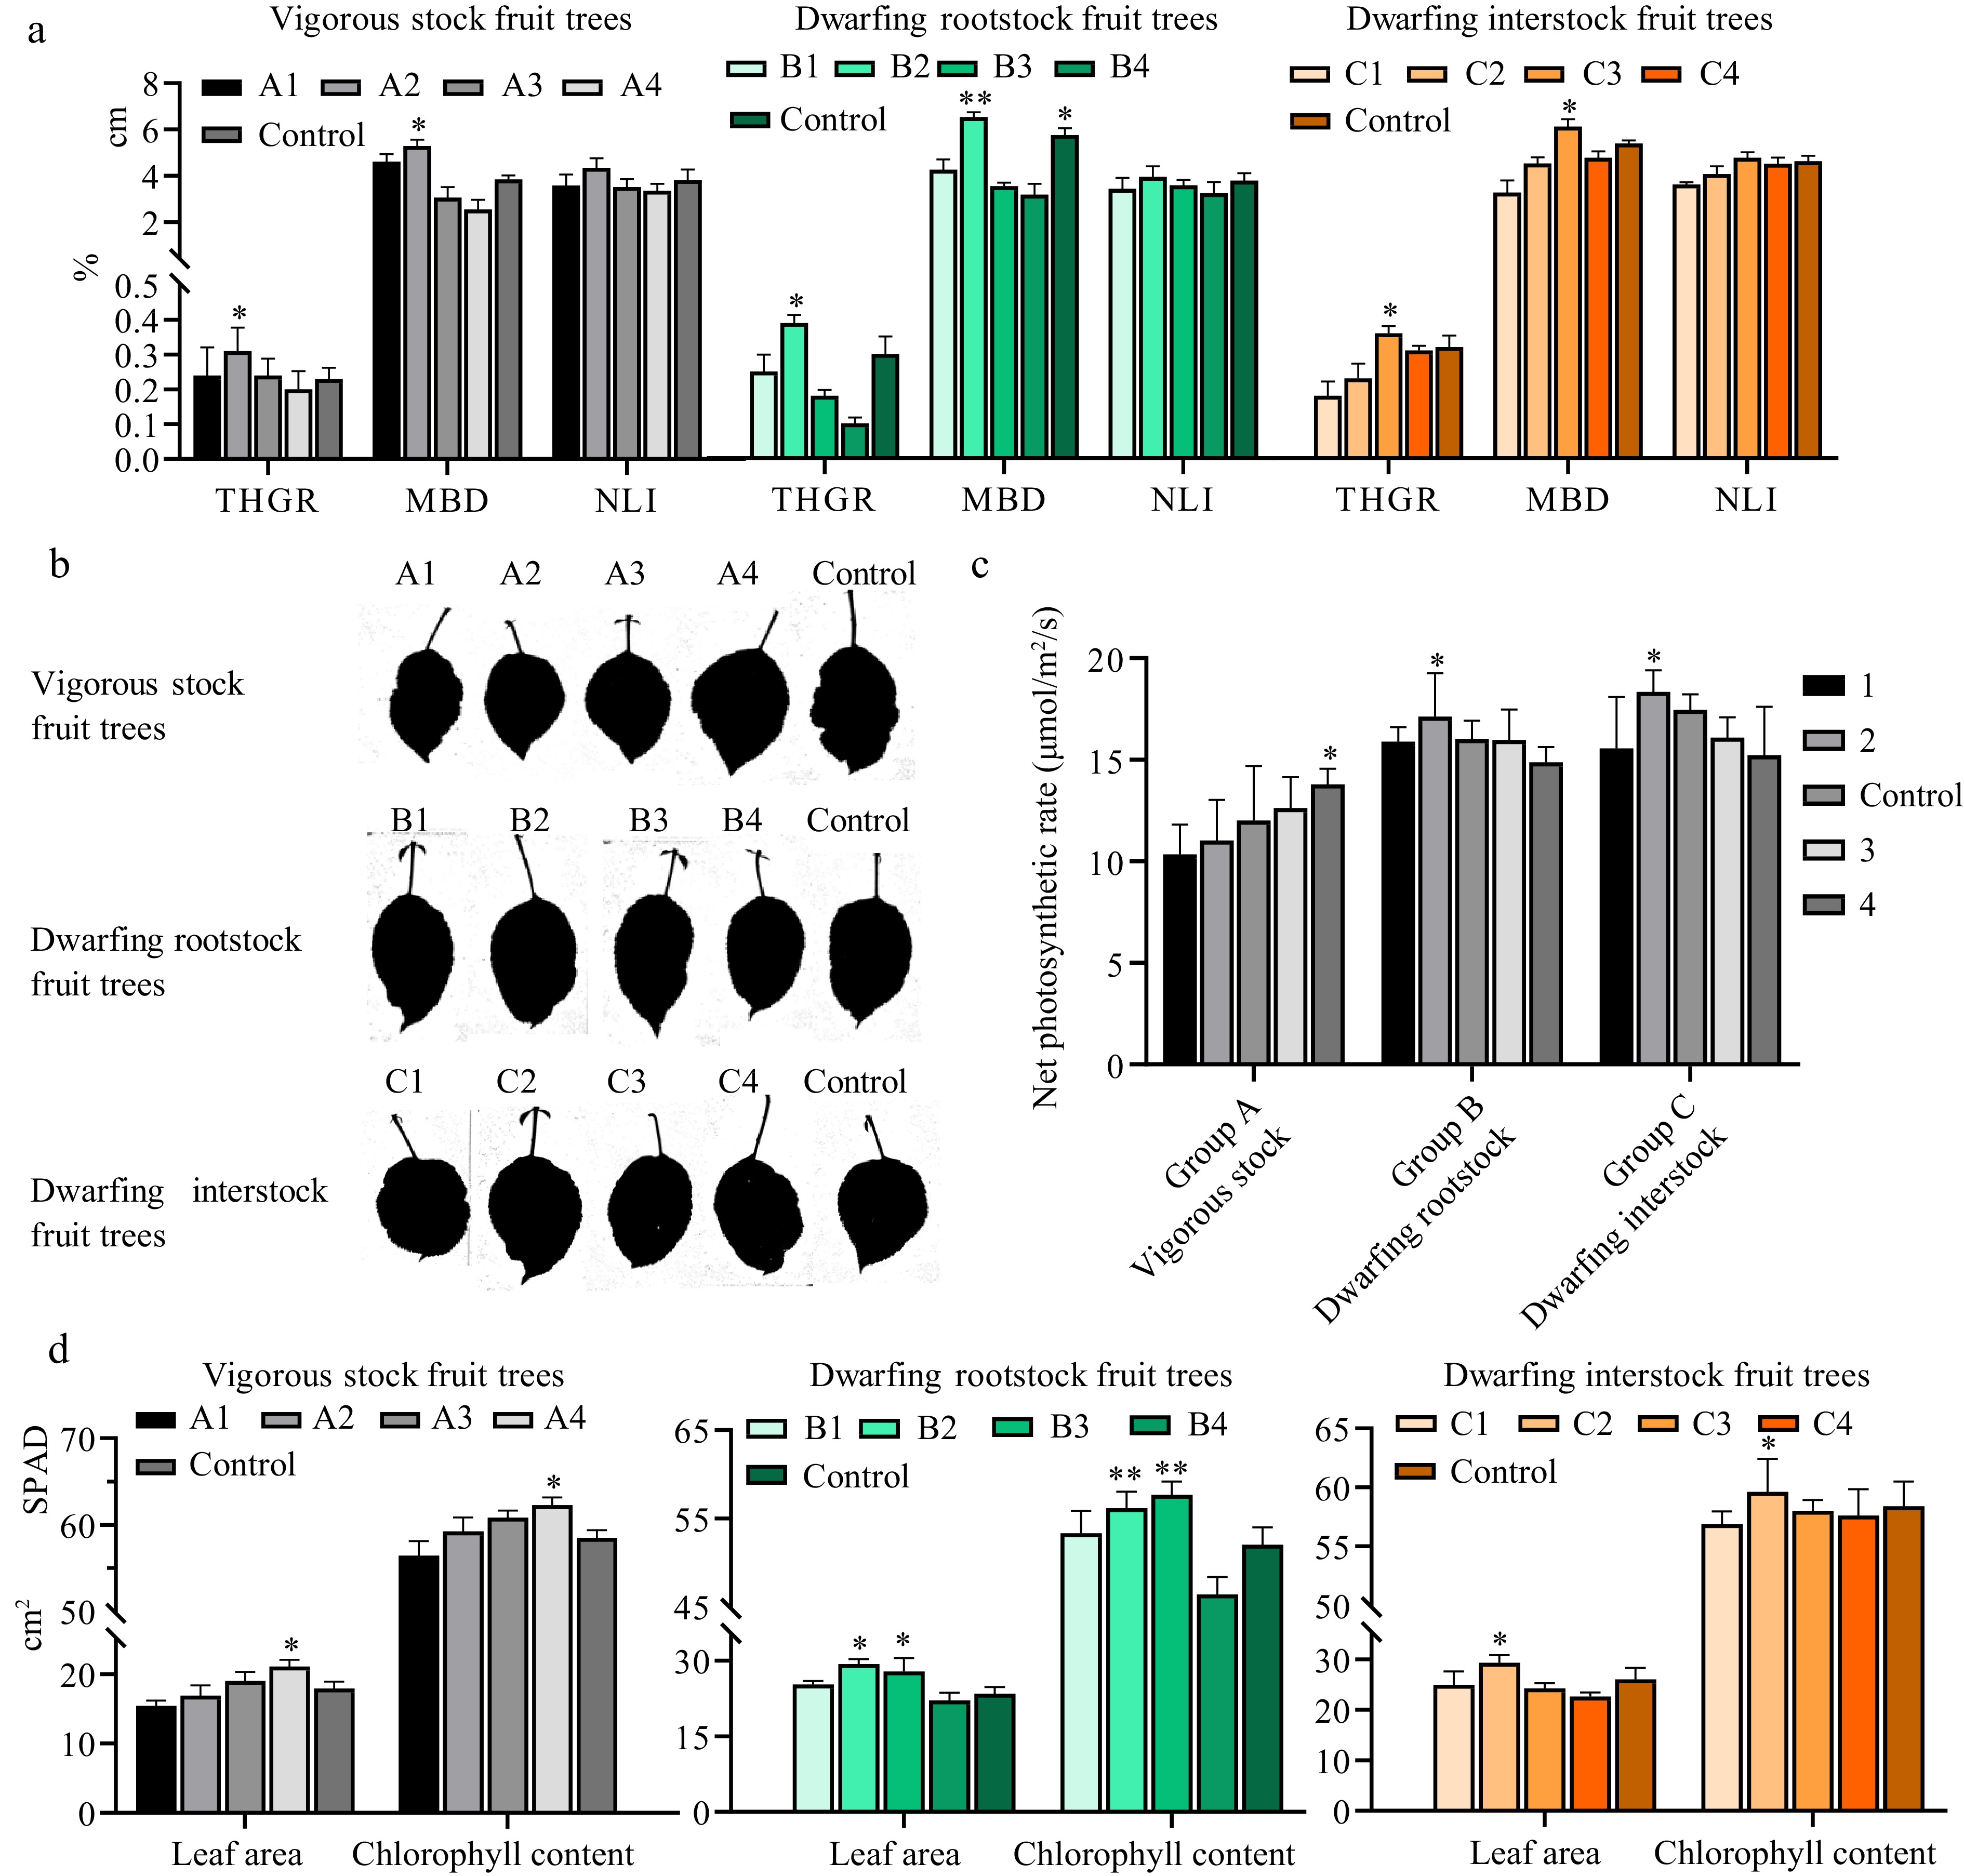
Figure 1.
Effect of different crop load on the development of tree and leaves. (a) Tree characteristics of three cultivation types under different loads. The lower half of the y-axis represents THGR (Tree Height Growth Rate). and the upper half of the y-axis represents MBD (Main branch diameter increment) and NLI (New length increment). Vigorous stock, dwarfing rootstock and dwarfing interstock are shown on the left, middle, and right, respectively. (b) Leaf area scanning of three rootstock types under different loads and control. (c) Net photosynthetic rate of three rootstock types under different loads and control. (d) Leaf area and chlorophyll content of three rootstock types under different loads and control. The lower half of the y-axis represents leaf area and the upper half of the y-axis represents chlorophyll content. In the vigorous stock apple trees, A1 represents 240, A2 (320), A3 (480), A4 (560), and control (400). B1 represents 90, B2 (110), B3 (150), B4 (170), and control (130) for the dwarfing rootstock apple trees. C1 represents 100, C2 (150), C3 (210), C4 (260), and control (180) for the dwarfing rootstock apple trees. Asterisks indicate significant differences to the lowest data (Student's t-test; * p < 0.05 and ** p < 0.01).
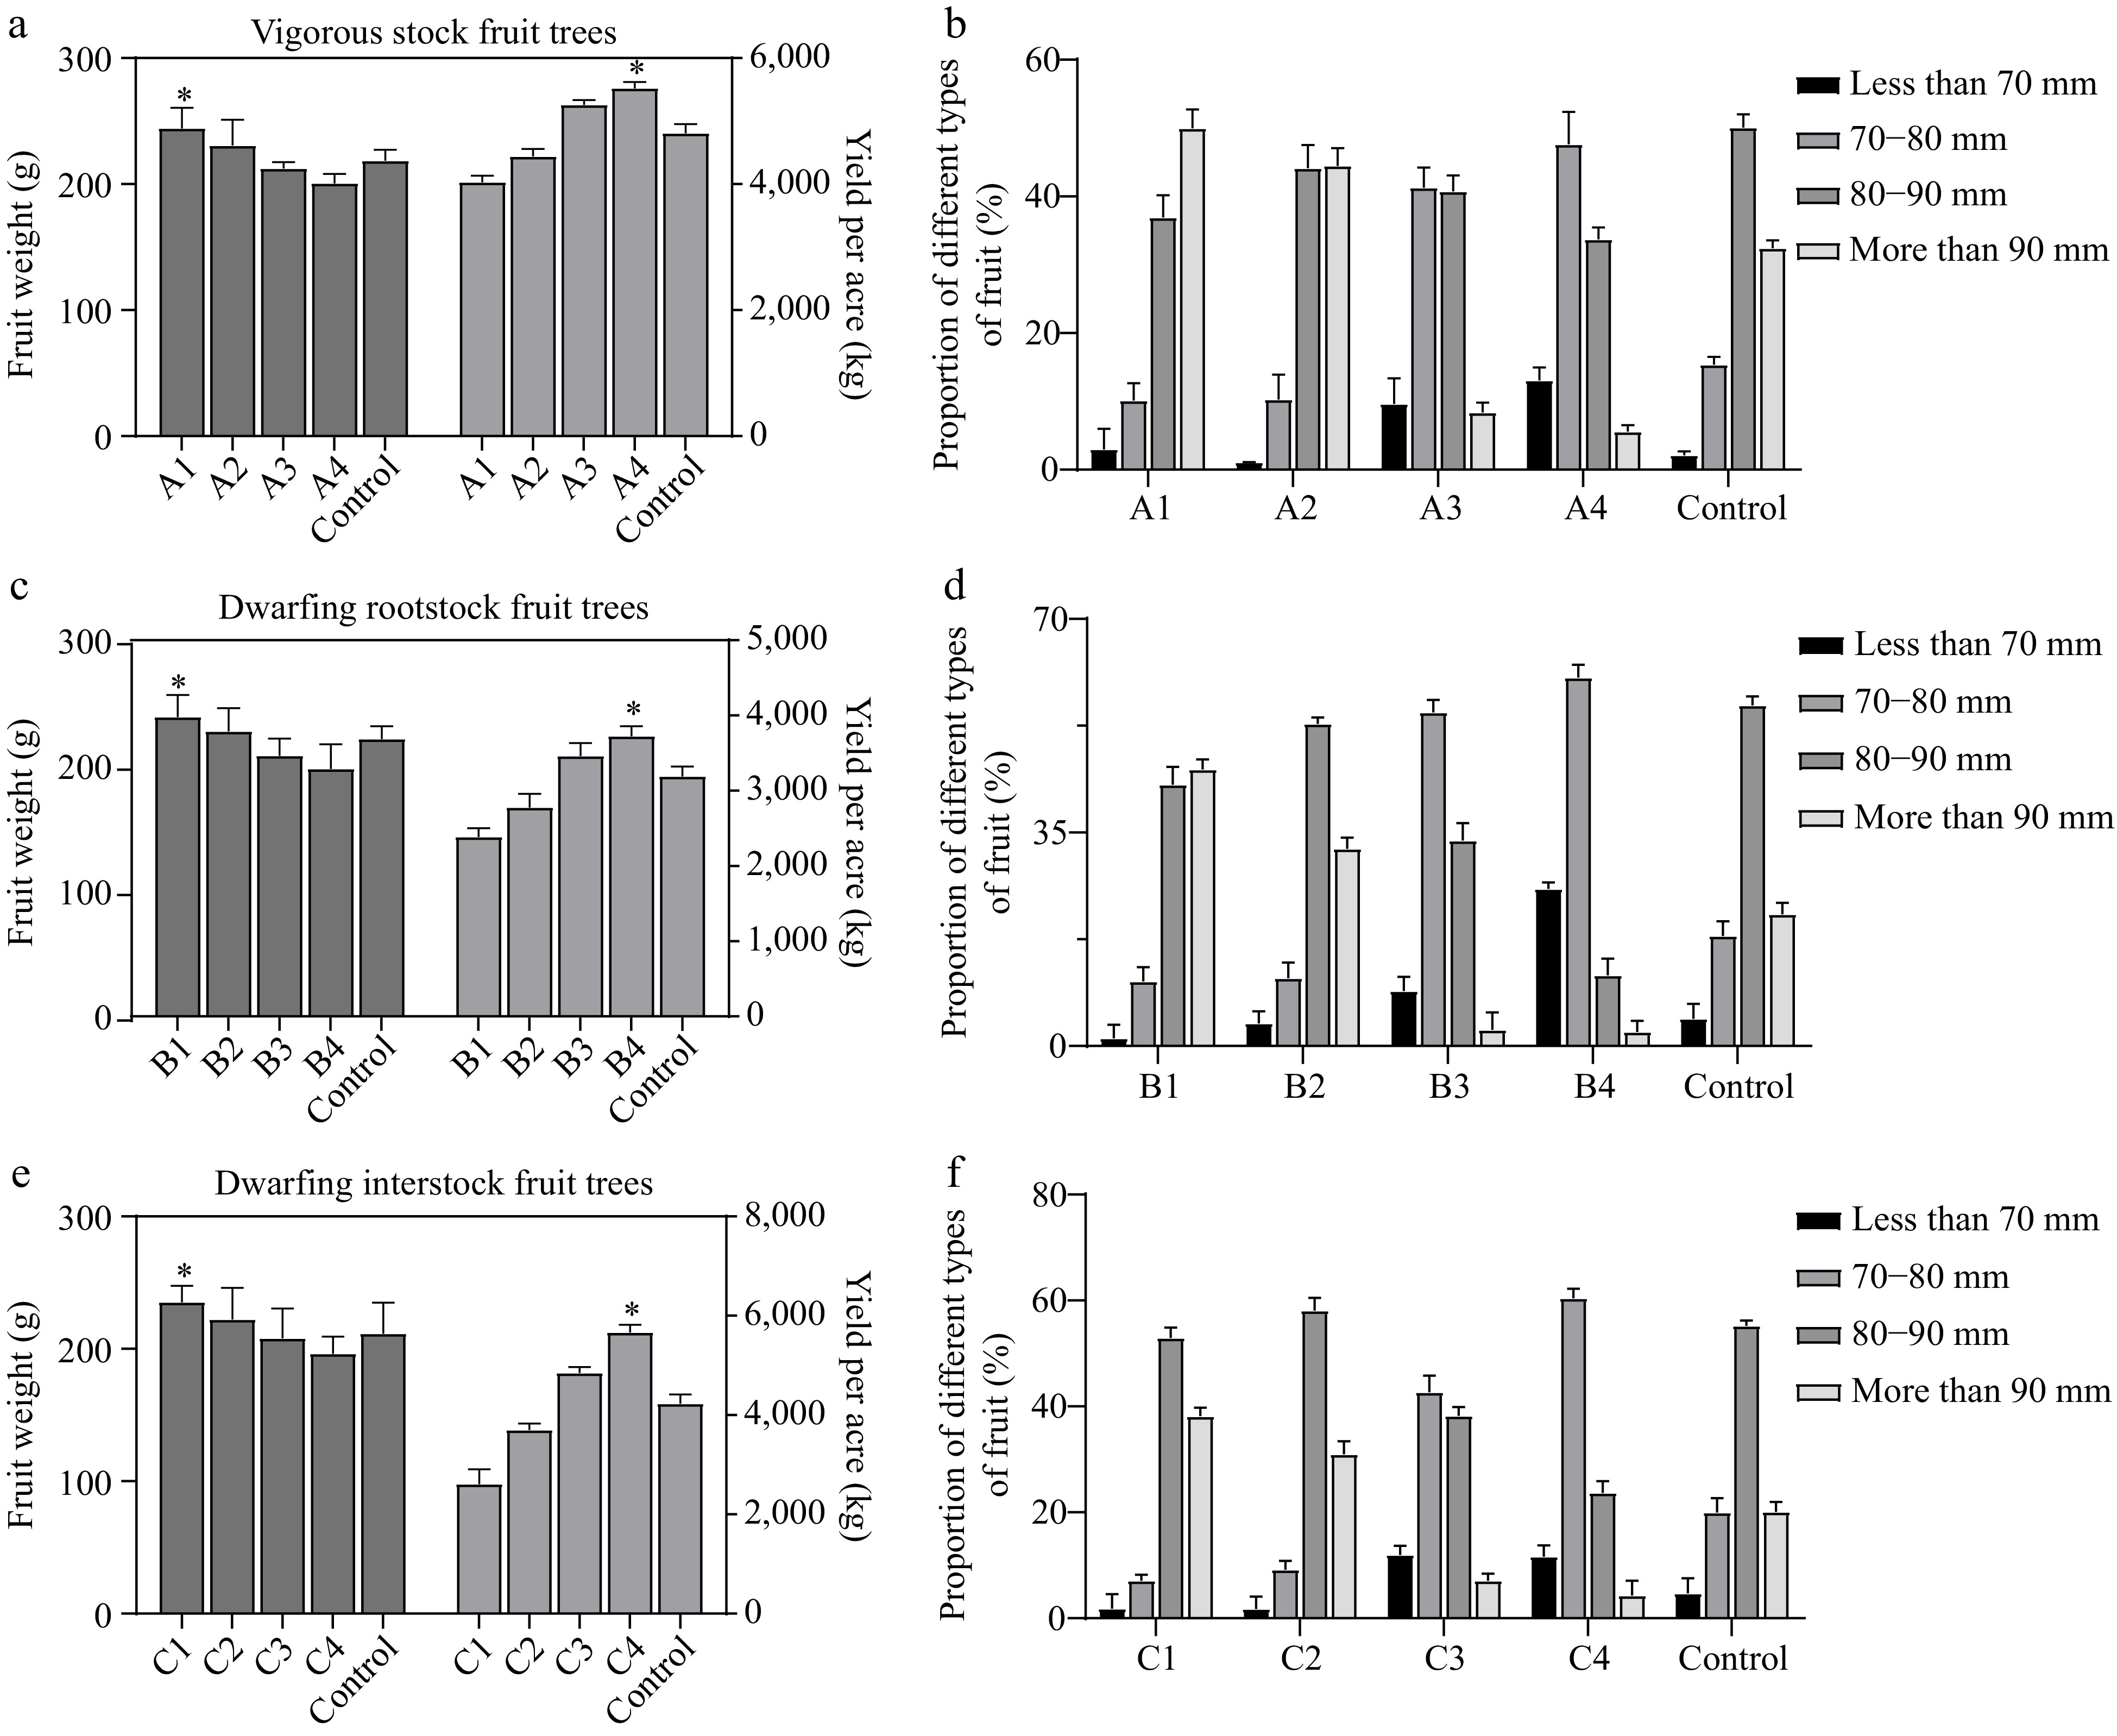
Figure 2.
Effect of different loadings on fruit. (a) Effect of different loadings on weight and yield of arborized fruits. (b) Effect of different loadings on fruiting types of vigorous stock fruit trees. (c) Effect of different loadings on fruit weight and yield of dwarf self-rooted rootstock. (d) Effect of different loadings on fruit type of dwarf self-rooted rootstock fruit trees. (e) Effect of different loadings on fruit weight and yield of dwarfing interstock. (f) Effect of different loadings on fruit type of dwarfing interstock fruit trees. For the different degrees of crop load, 240, 320, 480, 560, and 400 for A1−A4 and control for vigorous stock fruit trees. The fruit retention of dwarfing rootstock was divided into 90, 110, 150, 170, and 130 for B1−B4 and control, respectively. Meanwhile, 100, 150, 210, 260, and 180 for C1−C4 and control of the dwarfing interstock fruit trees, respectively. Asterisks indicate significant differences to the lowest data (Student's t-test; * p < 0.05).
To uncover the effects of various crop load, we observed the developmental phenotype of leaves. For the vigorous stock apple trees, the leaf size of the A4 treatment was obviously higher than that of other treatments (Fig. 1b). The net photosynthetic rate of leaves showed an increasing trend with increasing fruit loading, with a net photosynthetic rate of 10.34 μmol/m2/s under the A1 treatment and 13.79 μmol/m2/s under the high loading A4 treatment, showing an increase of 33.36% (Fig. 1c). Similarly, the leaf area and chlorophyll contents raised with the increasing crop load and the A4 treatments presented the highest values (Fig. 1d, left plot). These results indicated that increasing the crop load of vigorous stock apple trees raised the leaf area and chlorophyll contents, which enhanced the leaf photosynthetic rate for the vigorous stock apple trees. For the dwarfing rootstock apple trees, the leaf area and chlorophyll contents reached the highest under B1 and B2 treatments (Fig. 1d, middle plot). Correspondingly, the net photosynthetic rate values also presented the highest level under the B2 treatment. However, the B4 crop load treatment showed relatively low levels compared with the other treatments (Fig. 1c). This implied that increasing the crop load of dwarfing rootstock apple trees decreased the leaf area, chlorophyll content, and net photosynthetic rate, which was quite different with the vigorous stock apple trees. For the dwarfing interstock apple trees, the leaf area, chlorophyll content, and net photosynthetic rate correspondingly presented the highest levels under the C2 crop load treatment (Fig. 1b−d). Moreover, the leaf area, chlorophyll content, and net photosynthetic rate showed a similar variation trend with the dwarfing rootstock apple trees and were different with the vigorous stock apple trees, which implied that this difference might be related to the vigorous stock and dwarf apple trees.
A valid indicator to evaluate the optimal load is the quality of the mature fruit setting. So, we further investigated the fruit weight, yield, and quality under different crop load treatments (Fig. 2). Generally, with the increasing crop load degree, the fruit weight presented decreased trend, while the field yield per acre was increased (Fig. 2a, c, e). In detail, for the vigorous stock apple trees, the highest fruit weight was 244.31 g per fruit under the A1 treatment with low loading, which was significantly higher than the other treatments, especially 218.42 g per fruit under the A4 treatment (Fig. 2a). For the dwarfing rootstock apple trees, the highest fruit weight was 238.80 g per fruit under the low loading B1 treatment and 197.27 g per fruit under the high loading B4 treatment (Fig. 2c). For the dwarfing interstock apple trees, the highest fruit weight was 235.06 g per fruit under the low loading C1 treatment, and 196.21 g per fruit under the high loading C4 treatment (Fig. 2e). These results indicated that the vigorous stock apple trees generally had the heavier fruit than that in the dwarf trees and the average of fruit weight is higher with the lower crop load among three types of apple trees.
Although the low degree of crop load can lead to better fruit quality, the earnings of apple fruits are the main concerns for the growers, which leads us to further perform the comprehensive effects of crop load on the fruit size. For the vigorous stock apple trees, the percentage of fruits above 80 mm in diameter was 76.9% under the A2 treatment, which was significantly higher than the other treatments. The highest percentage of fruits above 90 mm in diameter was 49.97% under the low load level A1 treatment, and the highest percentage of superior fruits above 80 mm in diameter was achieved when the load level was 320 fruits per plant (A2) (Fig. 2b). For the dwarfing rootstock apple trees, the percentage of fruits above 80 mm diameter decreased with increasing loadings, the highest percentage of fruits above 80 mm diameter was 88.18% under low loadings B1 treatment and the lowest percentage of fruits above 80 mm diameter was 13.85% under high loadings B4 treatment pieces, and the highest percentage of superior fruits above 80 mm diameter was obtained when the loadings of dwarf self-rooted rootstock fruit trees were 90 fruits per plant (B1) (Fig. 2d). For the dwarfing interstock apple trees, the percentage of large fruits in C1 and C2 was significantly higher than the control at low loadings, and the percentage of small fruits was much lower than the control. The percentage of fruits above 80 mm was as follows: C1 > C2 > Control > C3 > C4. The percentage of fruits above 80 mm in dwarfing interstock fruit trees was the highest when the crop load was 100 fruits per plant (C1) (Fig. 2f). In summary, the recommended loadings for vigorous stock, dwarfing rootstock, and dwarfing interstock were 320 (A2), 90 (B1) and 100 (C1) for obtaining good quality fruit above 80 mm, respectively.
Effect of fruit thinner on fruit set and fruit quality
-
Fruit thinning is necessary to achieve optimum crop load. Chemical thinning agents, due to their lower cost and convenience, are widely used in apple production. Based on the above results, we used the widely utilized dwarfing interstock with high grafting compatibility to assess the various thinning agents (carbaryl, 6-BA, NAA, and Metamitron), varying spraying concentrations, and application time of fruit thinning agents on fruit quality. To set the concentration gradient, we firstly conducted pre-experiments on these fruit thinning agents to determine the approximate concentration required to achieve an optimal crop load of 100 (C1) (Supplemental Fig. S1). The chemical fruit thinners were applied to apple trees after 15 d of full bloom. The results showed that the cluster fruit set rate ranged from 64.3% to 84.17%, which has significant differences compared with the control (water treatment). Particularly, the carbaryl treatment had the lowest cluster fruit set rate, followed by Metamitron, 6-BA, and NAA (Fig. 3a). For the center flower fruit setting rate, the carbaryl and NAA treatments presented a slightly higher center flower fruit setting rate than that in 6-BA and Metamitron (Fig. 3a). By comparing the triple, double, and single fruit ratios of different fruit thinner treatments, it showed that carbaryl and 6-BA presented much higher levels than that in NAA, Metamitron, and control (Fig. 3b). Taken together, we comprehensively believed that the thinning effects of carbaryl and 6-BA are better than the other fruit thinners in this study.
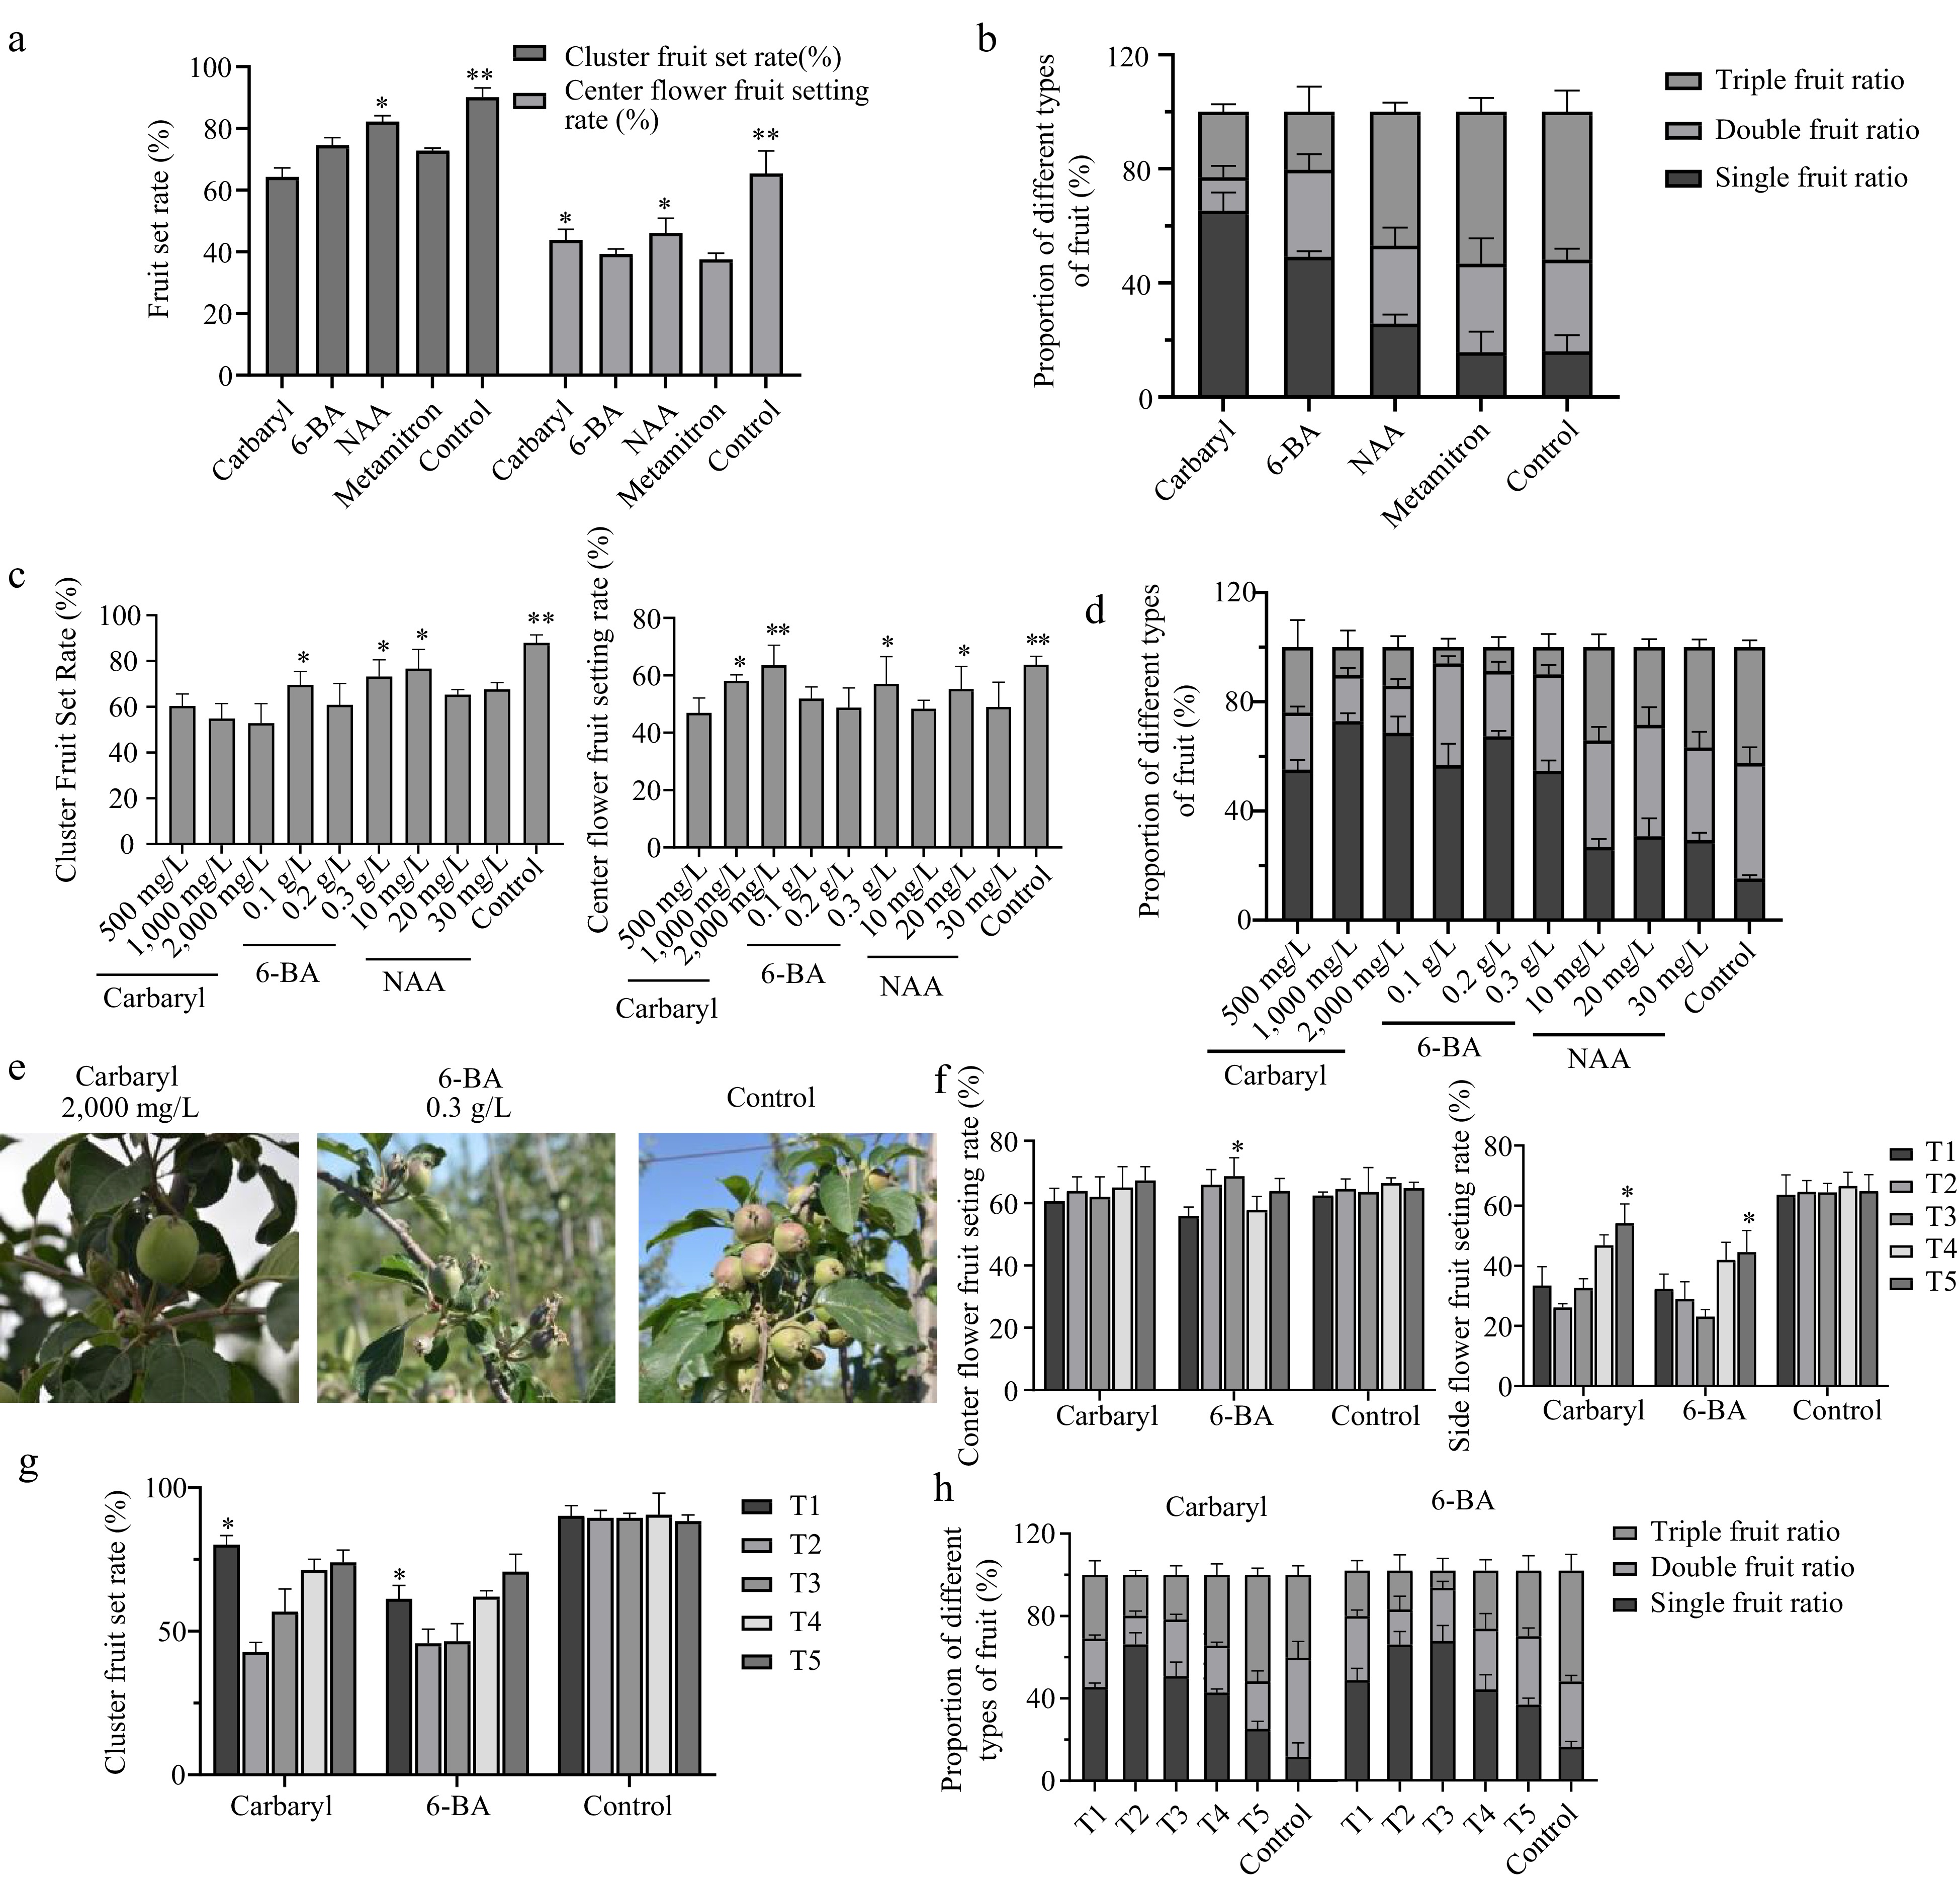
Figure 3.
Thinning effect of fruit thinning agents. (a) Cluster fruit set rate and center flower setting rate of different kinds of fruit thinners. (b) The proportion of different types of fruits with different types of fruit thinning agents. (c) Cluster fruit set of different concentrations of fruit thinners. (d) Cluster fruit set rate and center flower setting rate with different concentrations of fruit thinning agents. (e) The proportion of different fruit types with different concentrations of fruit thinners. (f) Center and edge flower setting rate at different spraying times of fruit thinning agents. (g) Cluster fruit set rate at different spraying times of fruit thinning agent. (h) The proportion of different fruit types at different spraying times of fruit thinning agents (Carbaryl, 6-BA). Asterisks indicate significant differences to the lowest data (Student's t-test; * p < 0.05 and ** p < 0.01).
The thinning effects mainly depended on the concentration of thinner and spraying time on the early fruits. Thus, we respectively set three different concentrations for carbaryl, 6-BA, and NAA to explore the best treating concentrations (Fig. 3c−e), which we thought had good thinning effects based on the above results (Fig. 3a, b). For the carbaryl treatments, with the increasing concentrations of carbaryl (500, 1,000, and 2,000 mg/L), the cluster fruit thinning rate and the center flower fruit set rate increased (Fig. 3c). Also, the high concentrations of carbaryl significantly increased the single fruit ratio (Fig. 3d). Thus, the concentrations of 2,000 mg/L carbaryl had the best thinning effects for fruit thinning. For 6-BA treatments, the cluster fruit set rate of 0.2 g/L was lower than that in 0.1 and 0.3 g/L, while the center flower fruit set rate of 0.3 g/L treatment was significantly higher than that in 0.1, and 0.2 g/L treatments (Fig. 3c). However, the concentrations of 0.2 g/L treatment presented highest single fruit ratio (Fig. 3d). Concerning the NAA treatments, the 20 mg/L and 30 mg/L of NAA treatments presented lower cluster fruit set rate than the 10 mg/L treatment, while 20 mg/L NAA treatment showed the highest center flower fruit set rate (Fig. 3c). However, NAA treatments distinctly decreased the single fruit ratio compared with the carbaryl and 6-BA treatments and the single fruit ratio of NAA treatments showed no obvious difference among three different concentrations (Fig. 3d). Moreover, we further investigated the effects of different fruit thinner concentrations on fruit quality (Table 1). For carbaryl, when the spraying concentration was 2,000 mg/L, the fruit weight and acid-sugar ratio reached the highest levels. For 6-BA, the fruit weight and acid-sugar ratio reached the highest values when the spraying concentration was 0.3 g/L. For NAA, the single fruit weight was much lower than the other treatments and control because the NAA treatments inhibited fruit enlargement and development. Although the single fruit weight was distinctly decreased, the acid-sugar ratio of 20 mg/L NAA treatment was significantly higher than that in 30 mg/L and 10 mg/L (Table 1). Meanwhile, we evaluated the results of external quality determination and found that under carbaryl 2,000 mg/L and 6-BA 0.3 g/L, there were varying degrees of increase in pericarp hardness, pericarp ductility, pulp brittleness, compactness of pulp, brightness, and fruit coloration (Supplemental Table S2). In conclusion, we recommended the concentrations of carbaryl and 6-BA were 2,000 mg/L and 0.3 g/L for fruit thinning, respectively (Fig. 3e). However, the NAA treatments on these three concentrations distinctly decreased the fruit weight, so we were not recommended it for fruit thinning.
Table 1. Effect of different concentrations of fruit thinning agent on fruit quality.
Treatment Single fruit weight (g) Fruit shape index Contents of soluble sugar (%) Titratable acid content (%) Acid-sugar ratio Carbaryl 500 mg/L 232.31ab 0.83d 12.24c 0.23ab 53.22de Carbaryl 1,000 mg/L 221.58abc 0.82cd 12.80b 0.21bc 60.95c Carbaryl 2,000 mg/L 251.24a 0.82cd 13.47a 0.21d 64.14b 6-BA 0.1 g/L 221.16bc 0.84bc 12.30c 0.22bcd 55.91d 6-BA 0.2 g/L 213.53c 0.85ab 13.61a 0.21d 64.81b 6-BA 0.3 g/L 235.34ab 0.86a 13.32b 0.20cd 66.60a NAA 10 mg/L 105.99e 0.80de 10.47d 0.25a 41.88g NAA 20 mg/L 103.31e 0.83d 12.38cd 0.23ab 53.83de NAA 30 mg/L 89.81f 0.82cd 10.80d 0.21bc 51.43f Control 208.08d 0.82bc 11.47cd 0.21d 54.62d Different lowercase letters indicate statistical significance between the tested cultivars at p < 0.05. It is reported that the fruit thinning effect was affected by the treatment period of developmental fruits[12]. To further explore the optimal treatment period for the developmental fruits, we selected five different periods of developmental fruits, including May 1st (T1), 6th (T2), 11th (T3), 16th (T4), and 21st (T5), and treated them with carbaryl and 6-BA, which were considered as good fruit thinner based on the above results (Fig. 3f−h). For the carbaryl treatments, with the delay of the spraying period, the center flower fruit set rate showed no differences but the side flower fruit set rate presented an increasing trend (Fig. 3f). The cluster fruit set rate showed the highest level at the early stage T1, dropped to the lowest level at T2, and then increased with the developmental stages (Fig. 3g). Interestingly, the single fruit ratio of carbaryl treatment at the T2 stage presented the highest level and 6-BA treatments showed the peak levels at T2 and T3 stages (Fig. 3h). Overall, based on the above results, we recommended the spraying period of developmental fruits were T2 for carbaryl and T3 for 6-BA treatment, respectively.
Transcriptomic analysis of NAA treatment on the fruit development process
-
From the above study, the application of suitable chemical thinning agents, and the optimal loadings on different rootstocks were revealed. The results are important for evaluating the use of chemical thinning agents on different rootstocks on 'Fuji' apples in the industry. Our study showed that reducing the crop load would have a significant promotion effect on the quality and size of the remaining fruit. However, based on the above results, we found that only the spraying of the fruit thinner NAA could distinctly inhibit the fruit enlargement and ripening during the fruit development process (Table 1 & Fig. 4a). To further investigate the molecular mechanism of NAA as a fruit thinner on apple fruit development and ripening, we performed the transcriptome analysis on the NAA treated and control fruits at 60 (FS1), 90 (FS2), 120 (FS3) and 150 (FS4) days after flowering stages to explore the potential transcriptional regulations of NAA on apple fruit development and ripening. As shown in Fig. 4a, it is indeed that the apple fruits of the NAA-treated group were significantly smaller than those of the control group. As shown in Fig. 4a, the fruit growth graphs were drawn with the fruit transverse diameter, fruit longitudinal diameter, and fruit weight as the vertical coordinates accompanying the fruit development process. The longitudinal diameter of NAA-treated fruits was smaller than that of distilled water control treatment in all periods. The longitudinal diameter of NAA-treated fruits increased by 45.7% to 1.16 cm and almost stopped increasing from FS2 to FS4; the longitudinal diameter of control treatment increased by 53.7% to 2.23 cm. The results suggested that the development of both transverse and longitudinal diameters of NAA-treated fruits was delayed.
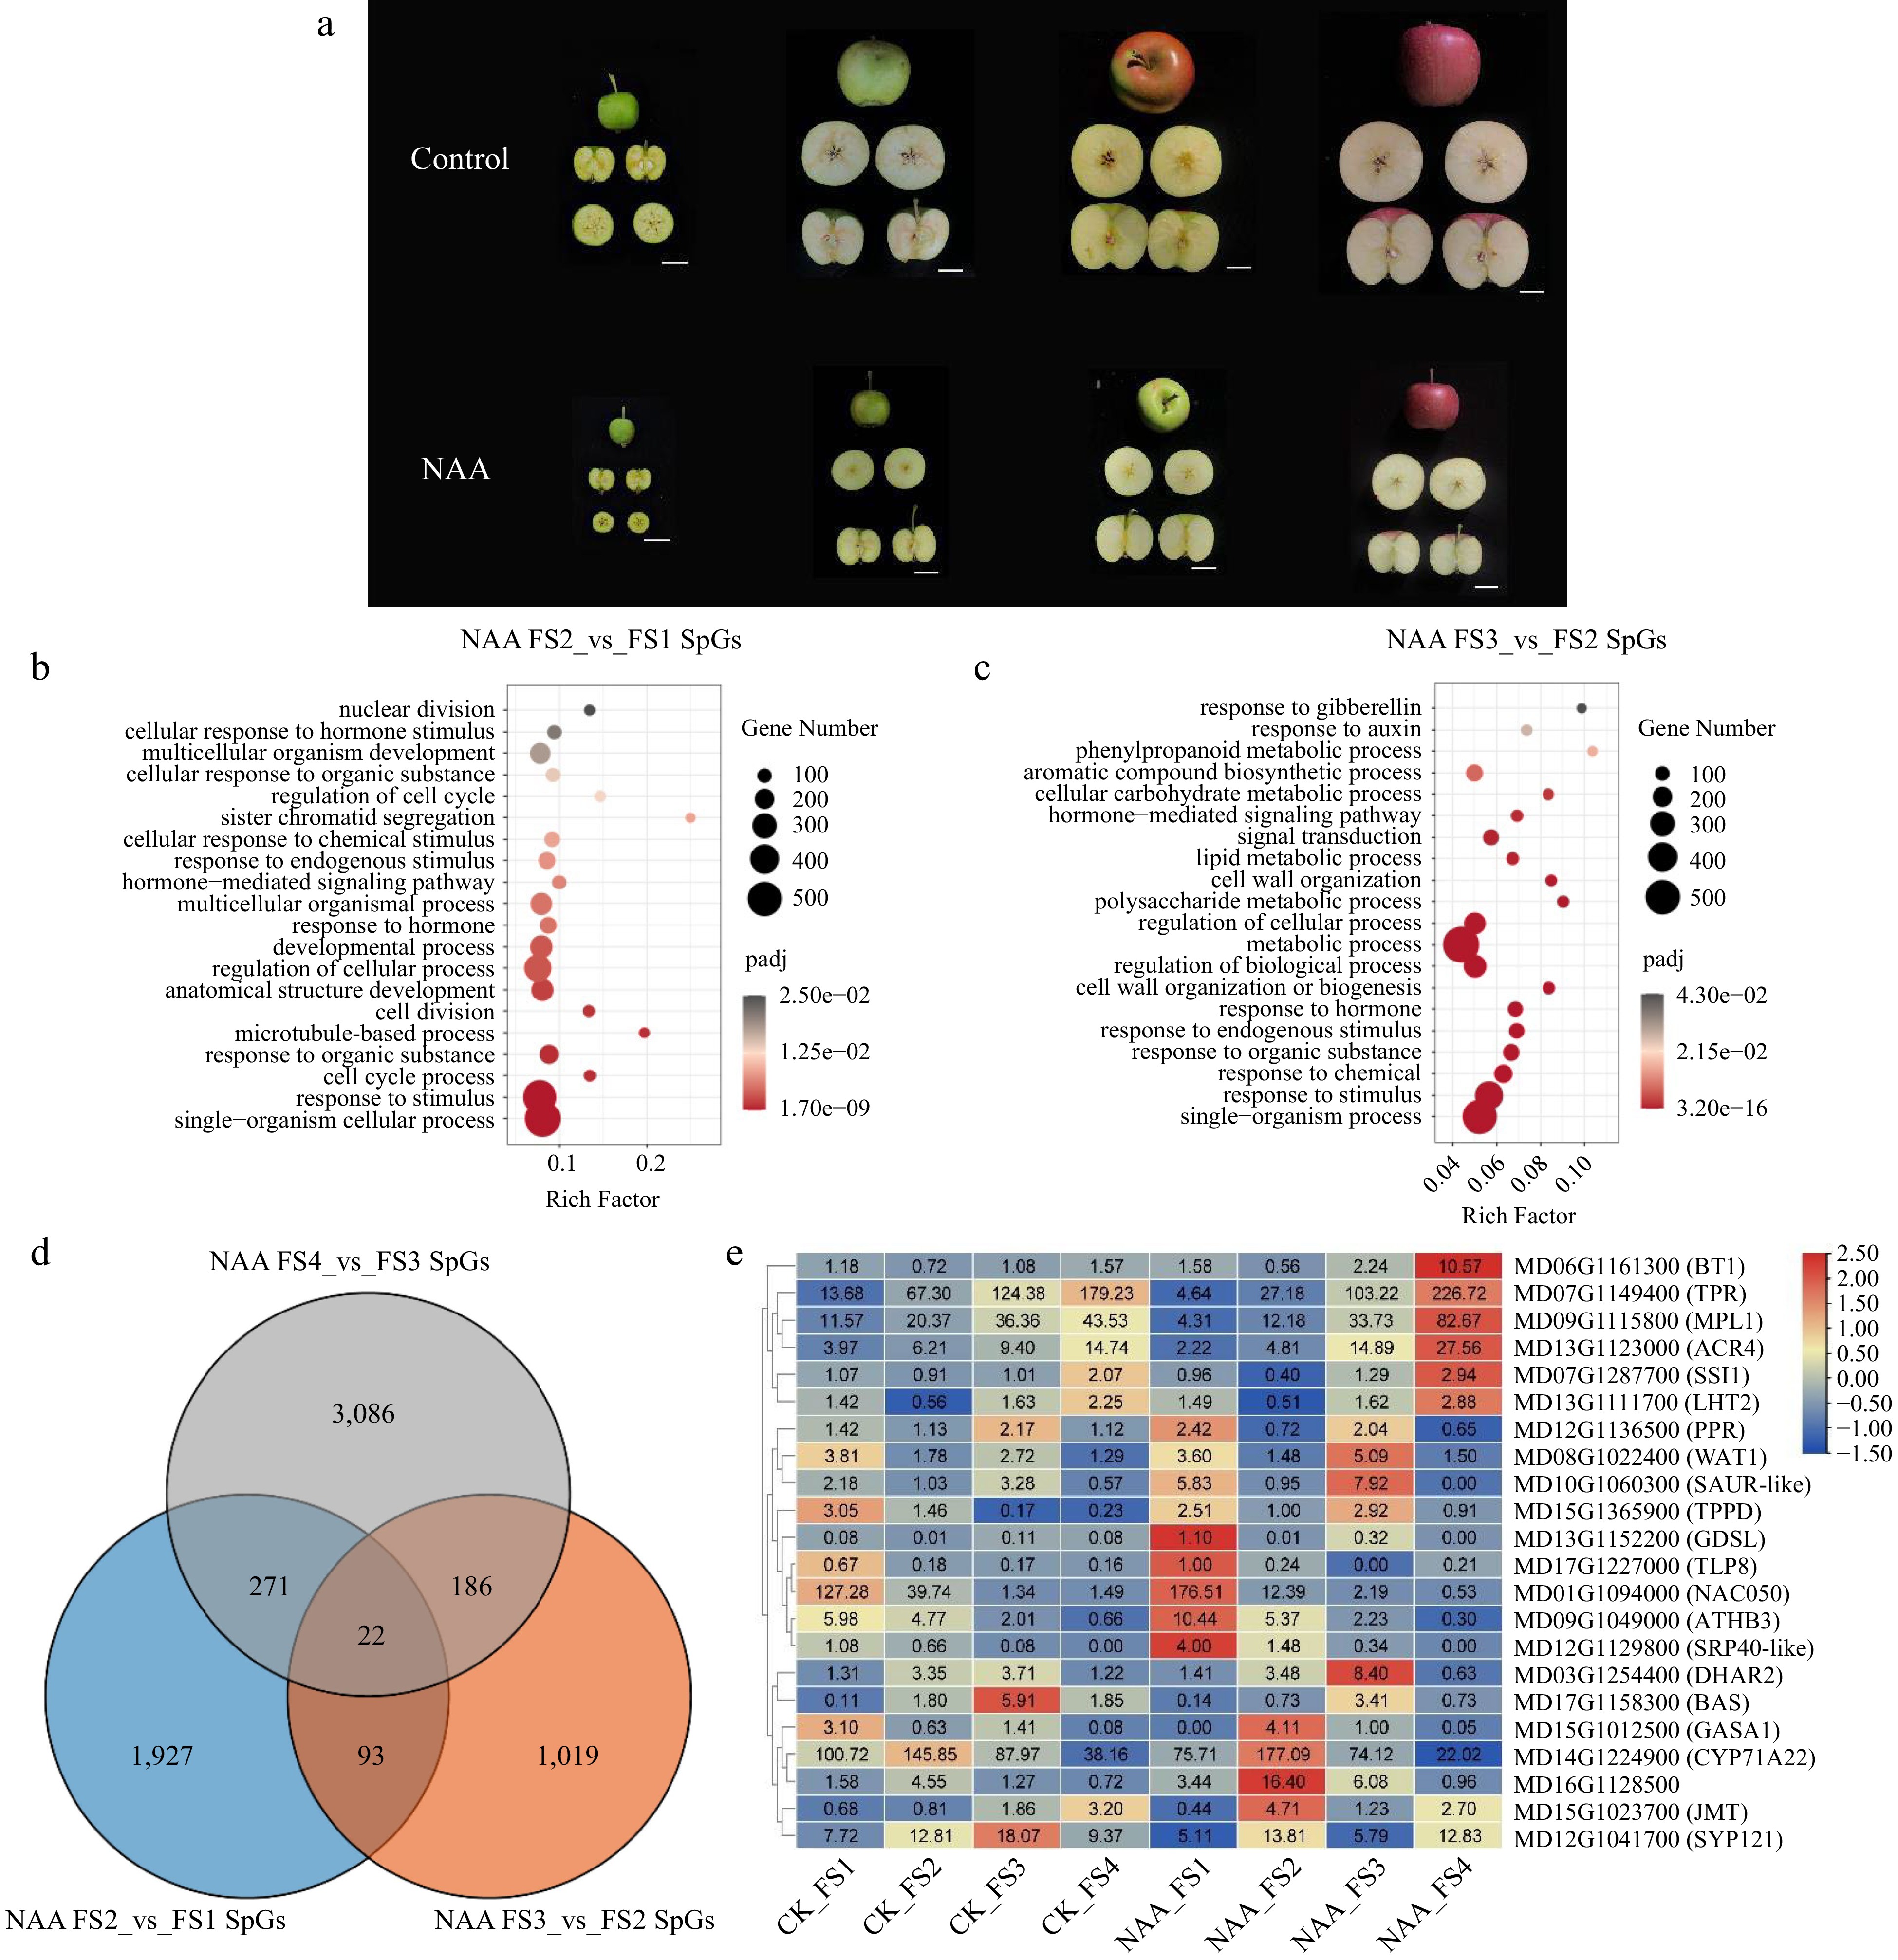
Figure 4.
Transcriptome analysis of fruit NAA-treated phenotypes and NAA-treated specifically expressed genes. (a) Phenotypes of control and NAA treatment. The white scale line is 2.5cm. (b) Enrichment analysis of FS2 vs FS1 specifically expressed genes under NAA treatment. (c) Enrichment analysis of FS3 vs FS2 specifically expressed genes under NAA treatment. (d) Venn of genes specifically expressed at different stages of combination under NAA treatment. (e) The heatmap of the overlap 22 genes from the Venn plot at the FPKM level.
To reveal the effect of NAA treatment on apple fruit development and ripening processes, we performed transcriptome analysis for NAA treatment vs control in four different stages. Expression patterns of genes involved in fruit development have been reported by previous studies[29]. So, we focused on the effect of NAA treatment on fruit development in our study. Firstly, to remove genes normally responding in fruit development, we overlap the genes differentially expressed in the adjacent stages (including FS2 vs FS1, FS3 vs FS2, FS4 vs FS3) of CK and NAA treatments, respectively, and thus filter genes specifically expressed in the CK or NAA treatment (Supplemental Fig. S2). The results showed a significant increase in the number of differentially expressed genes after NAA treatment. The difference was most pronounced from PS3 to PS4 stage in the same 30-d time interval. These specifically expressed genes (SpGs) in NAA may be regulated by NAA treatment and thus have an important role in fruit ripening. To further explore the effect of NAA treatment on the fruit ripening process, we performed functional enrichment of genes specifically expressed by NAA treatment at different stages. In all three comparative combinations of NAA SpGs, pathways related to stimulation, hormones, and development were enriched. It indicates that NAA may affect fruit development and ripen directly or indirectly through hormonal pathways. FS2 vs FS1 was mainly enriched to abundant genes related to cell cycle and cell division, suggesting that NAA may impact fruit expansion by affecting the cell division process during FS1 to FS2 (Fig. 4b). In FS3 vs FS2, mainly metabolism-related pathways and phenylalanine metabolic processes were enriched, among which auxin- and gibberellin-response pathways were also enriched (Fig. 4c). FS4 vs FS3 were enriched for metabolic-related pathways, as well as for abscisic acid and ethylene response pathways (Supplemental Fig. S2b). It suggests that NAA may influence fruit ripening through different hormonal pathways from FS2 to FS4.
For further exploring the genes affected by fruit ripening in NAA treatment, we performed an overlap of genes specifically expressed by NAA treatment in adjacent stages. The results showed that 22 NAA treatment-specific expressed genes played a role throughout the fruit developmental stage (Fig. 4d). These genes may have an important role in the influence of NAA on fruit development. The expression patterns of 22 genes showed that some genes showed the same trend in the control, and these genes responded more dramatically under NAA treatment (Fig. 4e). These genes may be affected by NAA treatment and thus play a role in the metabolic process of fruit ripening. Among the 22 genes, most of them are related to hormone response pathways, such as GASA1, JMT, and SAUR-like. Two transcription factor genes, ATHB3 and NAC050, presented with high expression in FS1. Both homeobox-leucine zipper protein and NAC domain-containing protein have been reported to be involved in hormone signaling pathways[30,31]. BT1, SYP121, LHT2, and ACR4, which are highly expressed in FS4, were also reported in the study to be possibly involved in abscisic acid and ethylene synthesis pathways by themselves or their family proteins[32−35]. Moreover, these 22 NAA-specific induced genes also contain the WAT1, a plant-specific protein that determines the thickness of the secondary cell wall of the fiber and is expressed highly at the FS3 stage. NAA SpGs analysis suggested that NAA treatment may regulate cell division, cell cycle, and fruit ripening process by affecting hormonal, and metabolic-related pathways.
Analysis of the co-expression network at four stages under NAA treatment and control
-
NAA-treated fruits showed significant differences in fruit phenotypes such as fruit size and color (Fig. 4a), indicating that NAA treatment had an important role in the apple fruit development and ripening process. Therefore, we further compared the transcriptional alterations between NAA and control at four developmental stages to reveal the effects of NAA treatment on fruit development. The analysis of differences showed that the number of differentially expressed genes presented NAA_FS1 vs Col_FS1 > NAA_FS3 vs Col_FS3 > NAA_FS4 vs Col_FS4 > NAA_FS2 vs Col_FS2 (Supplemental Fig. S3). Moreover, we overlapped the four comparative combinations (Fig. 5a).
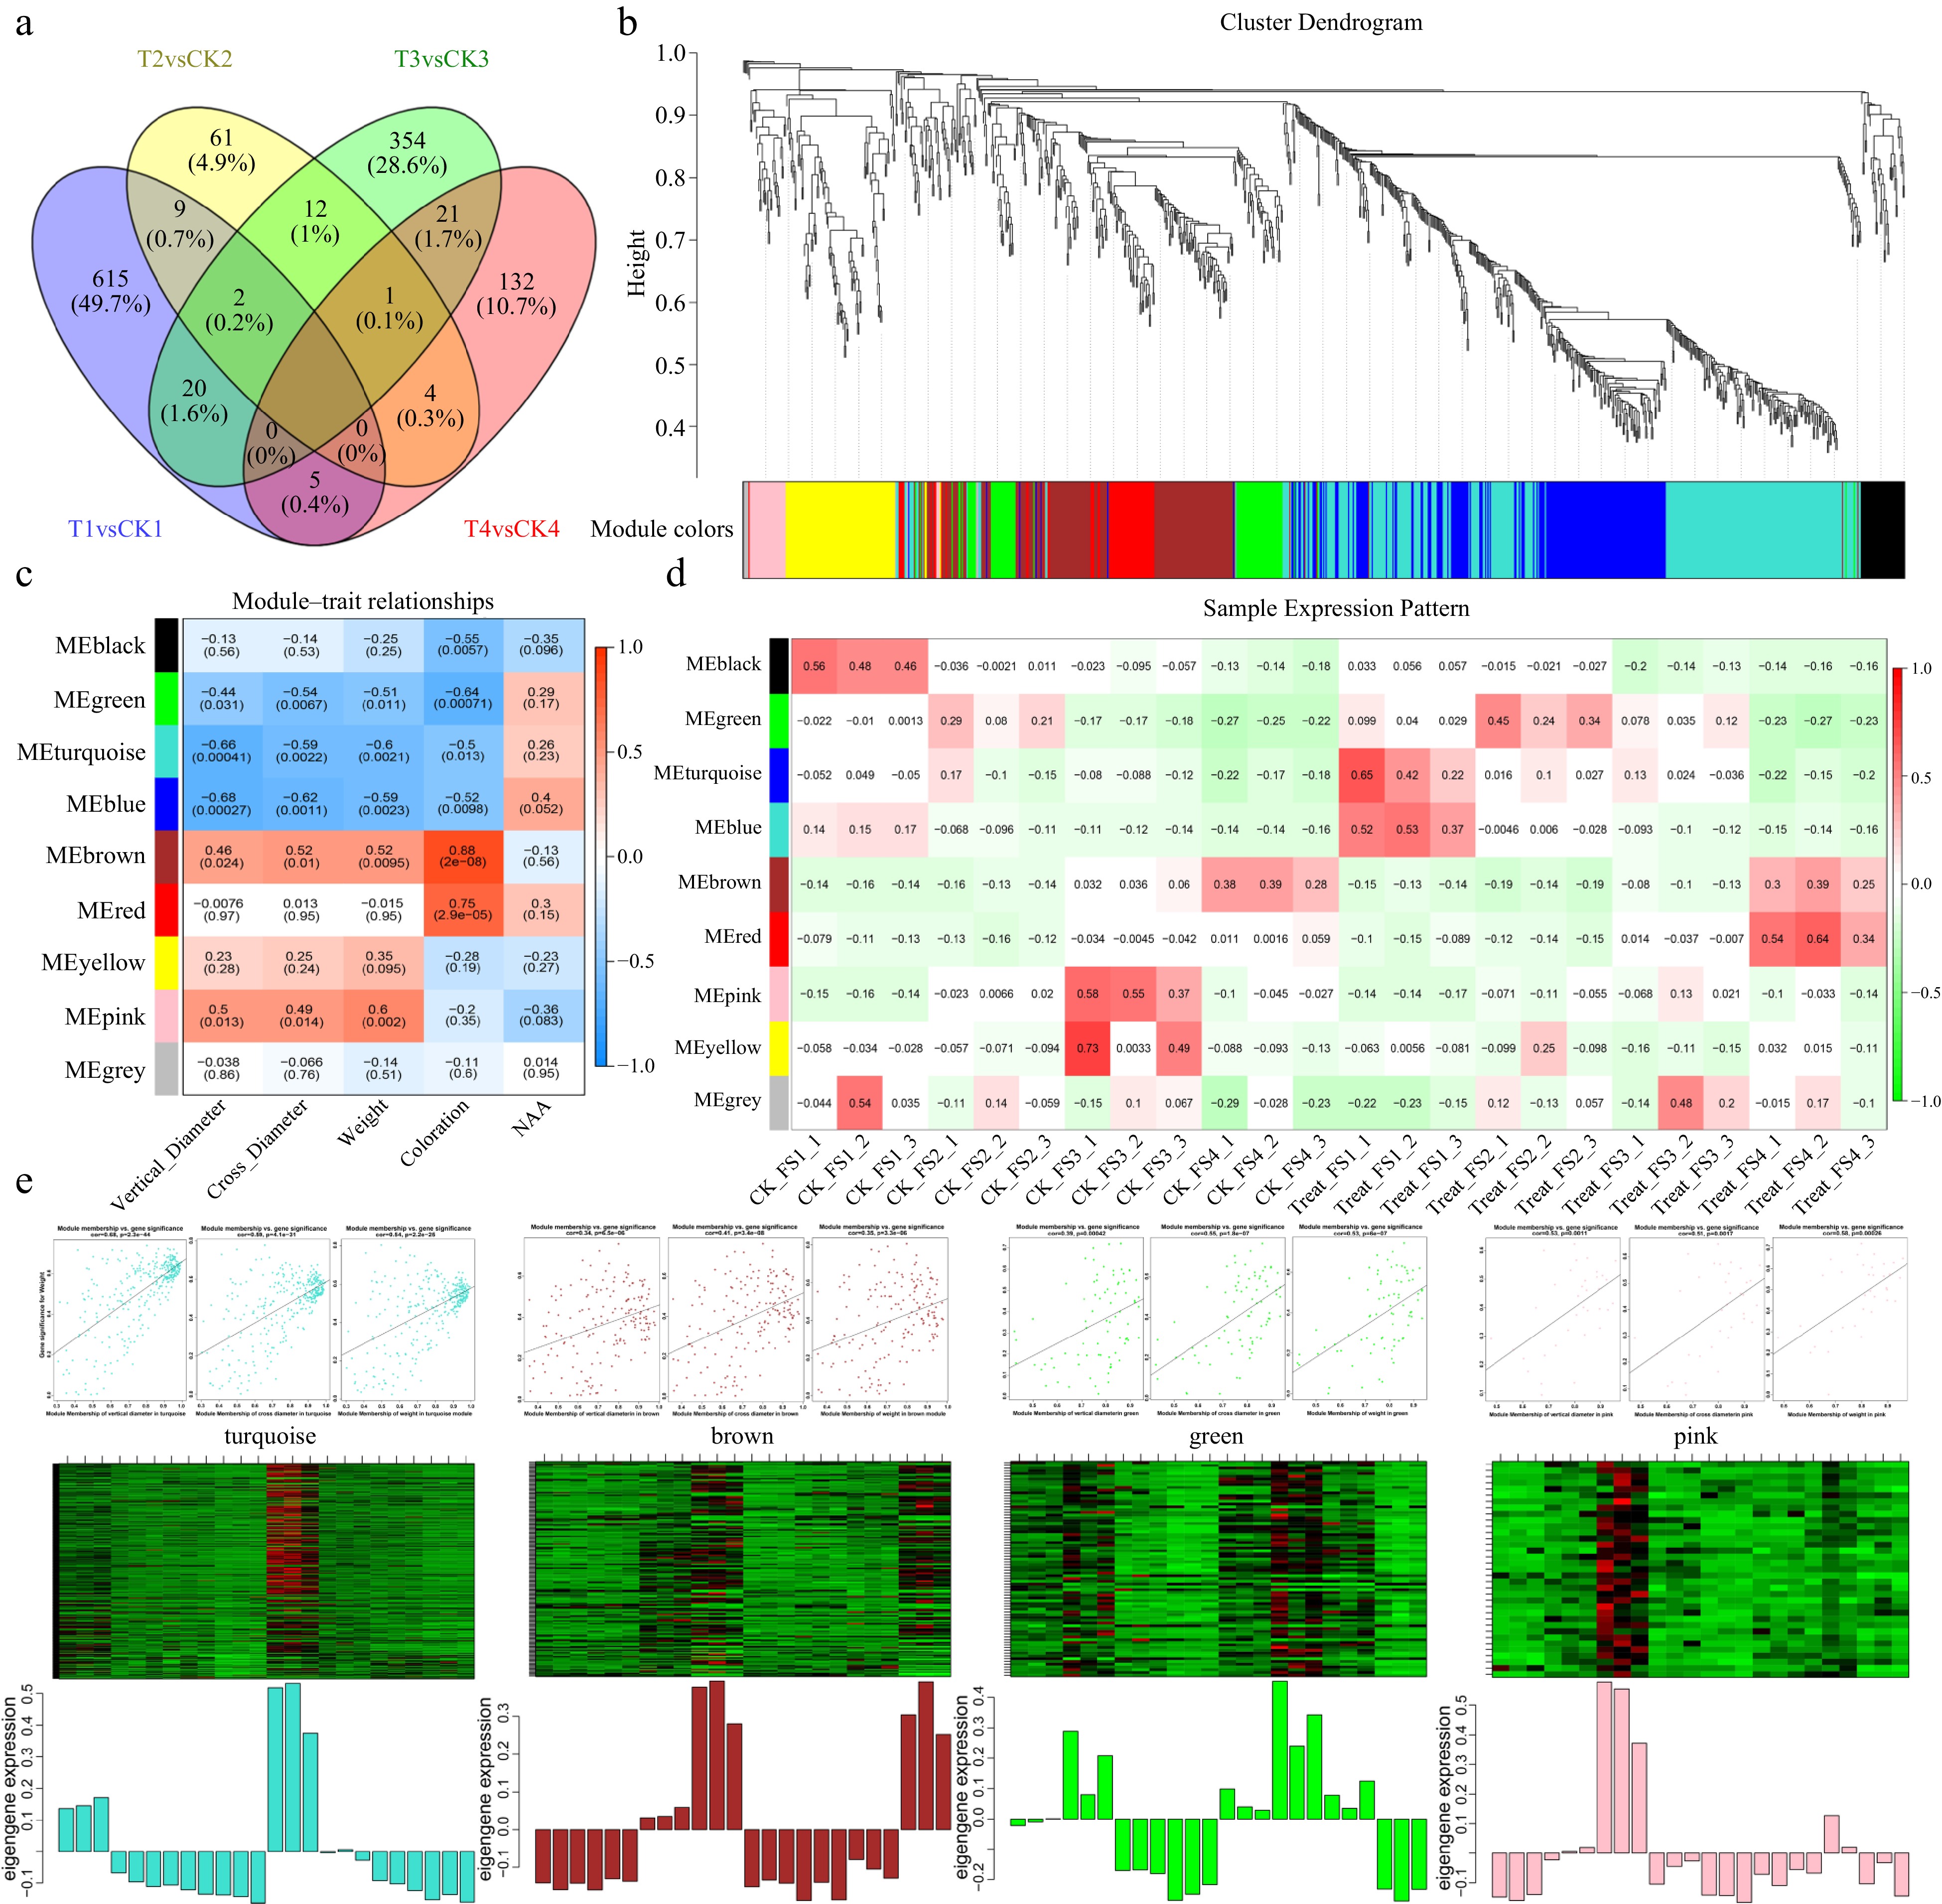
Figure 5.
During the NAA treatment, four stages of differences and WGCNA analysis. (a) Venn plot of differential genes in four stages for NAA treatment vs control. (b) Hierarchical cluster tree of the 990 genes colored by different modules. (c) Module-trait relationship correlation patterns. (d) Correlation between modules and different samples. (e) Visualization of the expression level and correlation of GS with MM and modules. The GS and MM correlation point plots are arranged by vertical diameter, cross diameter, and weight.
The process of fruit expansion was inhibited by NAA treatment at the FS1 stage, while NAA treatment inhibited the process of fruit coloration at the FS3 stage. WGCNA (Weighted correlation network analysis) can be used to identify co-expressed gene clusters (modules), and the module epigengenes (MEs) are employed to construct an association between the gene expression and the phenotype of interest. To investigate the relationship between NAA treatment-responsive genes and fruit expansion or coloration in each stage, we performed WGCNA analysis on 1,239 differential genes. After initial filtering, the 990 gene distribution was consistent with the scale-free network characteristics (Supplemental Fig. S4a). By constructing a hierarchical clustering tree, eight modules were obtained and marked by different colors (Fig. 5b). Each module has different MEs, and could be classified into four groups: the first included black, green; the second included turquoise and blue; the third included brown and red; the fourth included yellow and pink (Supplemental Fig. S4b). To filter out genes related to fruit expansion and fruit coloration, we associated the eight modules MEs with traits. The results showed that the modules of green, turquoise, blue, brown, and pink were correlated with fruit size and fruit weight. The modules of brown and red were related to fruit coloration (Fig. 5c, Supplemental Fig. S4c, d). Meanwhile, we constructed correlation expression profiles of different samples with different modules of MEs (Fig. 5d).
For the subsequent analysis, we evaluated the correlation profiles of modules with traits, different samples, and different modules to select the modules that had stable biological replication and high trait correlation from eight modules. Although the red module was highly correlated with fruit coloration, it was excluded because the sample expression pattern did not match the phenotype. Finally, we chose the modules green, turquoise, and pink, which are related to fruit expansion, and brown related to fruit coloring. Enrichment results showed that four modules were significantly enriched for pathways related to response stimulus or hormone response. In the hormone response-related pathways, there was a significant enrichment of the turquoise module to the gibberellin and ethylene response-related pathway, while the brown module was significantly enriched to the pathways related to abscisic acid and jasmonic acid response. The turquoise module showing significant upregulation of FS1 expression after NAA treatment significantly enriched many terms associated with plant-type cell walls, developmental growth involved in morphogenesis, etc. (Supplemental Table S3). The green module with upregulated expression in FS2 and FS3 after NAA treatment showed significant enrichment in processes such as response to oxygen-containing compounds, response to lipids, and response to acid chemicals, in addition to the cellular component organization (Supplemental Table S3). The pink module is significantly enriched for fewer pathways, but it contains terms related to response to stimulus and metabolic process (Supplemental Table S3). For the brown module that was hyper-expressed in late fruit development, it was shown to be highly connected with the secondary metabolic process, the phenylpropane metabolic process (Supplemental Table S3). The enrichment results suggested that four modules were associated with stimulation and hormonal pathways. Among them, the turquoise module was significantly associated with fruit expansion and the brown module might be related to fruit coloration.
To further screen genes for the effect of NAA treatment on fruit enlargement and fruit coloration. We calculated gene significance (GS) and module membership (MM) in the four modules (Fig. 5e & Supplemental Fig. S4c, d). GS was defined as the correlation between gene expression profiles and specific traits, while MM was correlated between MEs and gene expression profiles. Genes with GS > 0.6 and MM > 0.8 were identified as potential hub genes for each module (Supplemental Table S4). Enrichment analysis showed that turquoise and brown modules were linked to fruit expansion and fruit coloration. Accordingly, we selected the top 200 connections of these two modules related to cell development, phenylpropanoid pathway, and hormone-related hub genes for co-expression networks (Fig. 6). The turquoise module in the co-expression network contains seven hub genes, including expansin A15 (MD09G1052900) and expansin B3 (MD17G1242600), which are associated with cell expansion. The hormone response core genes contain the wax deposition and ethylene response-related WIN1 (MD02G1030900)[36], the ABA-induced protein HVA22C (MD13G1073600)[37], a positive regulator of cell elongation and gibberellin-related PRE1 (MD09G1049300)[38], and the cytokinin signaling pathways involved in AHP1 (MD12G1226800) and ARR6 (MD14G1188400)[39]. The results showed that NAA treatment during the early stages of fruit development may influence several hormone pathways and thus affect fruit expansion. For the brown module, the hormone-related eight core genes contained seven linked to the abscisic acid response (MD07G1268800, MD10G1013800, MD10G1014000, MD09G1069500, MD09G1141700, MD13G1061900, MD16G1127100) and two linked to the jasmonic acid response (MD09G1069500, MD10G1252600). The three phenylpropanoid related hub genes consist of two lignin synthesis-related genes (MD17G1222400, MD17G1224900) and one key gene for flavonoid synthesis, phenylalanine ammonia lyase 1 (MD01G1106900). The results showed that NAA treatment may affect fruit development through the abscisic acid response pathway and phenylalanine ammonia lyase on coloration in the middle and late stages of fruit ripening.
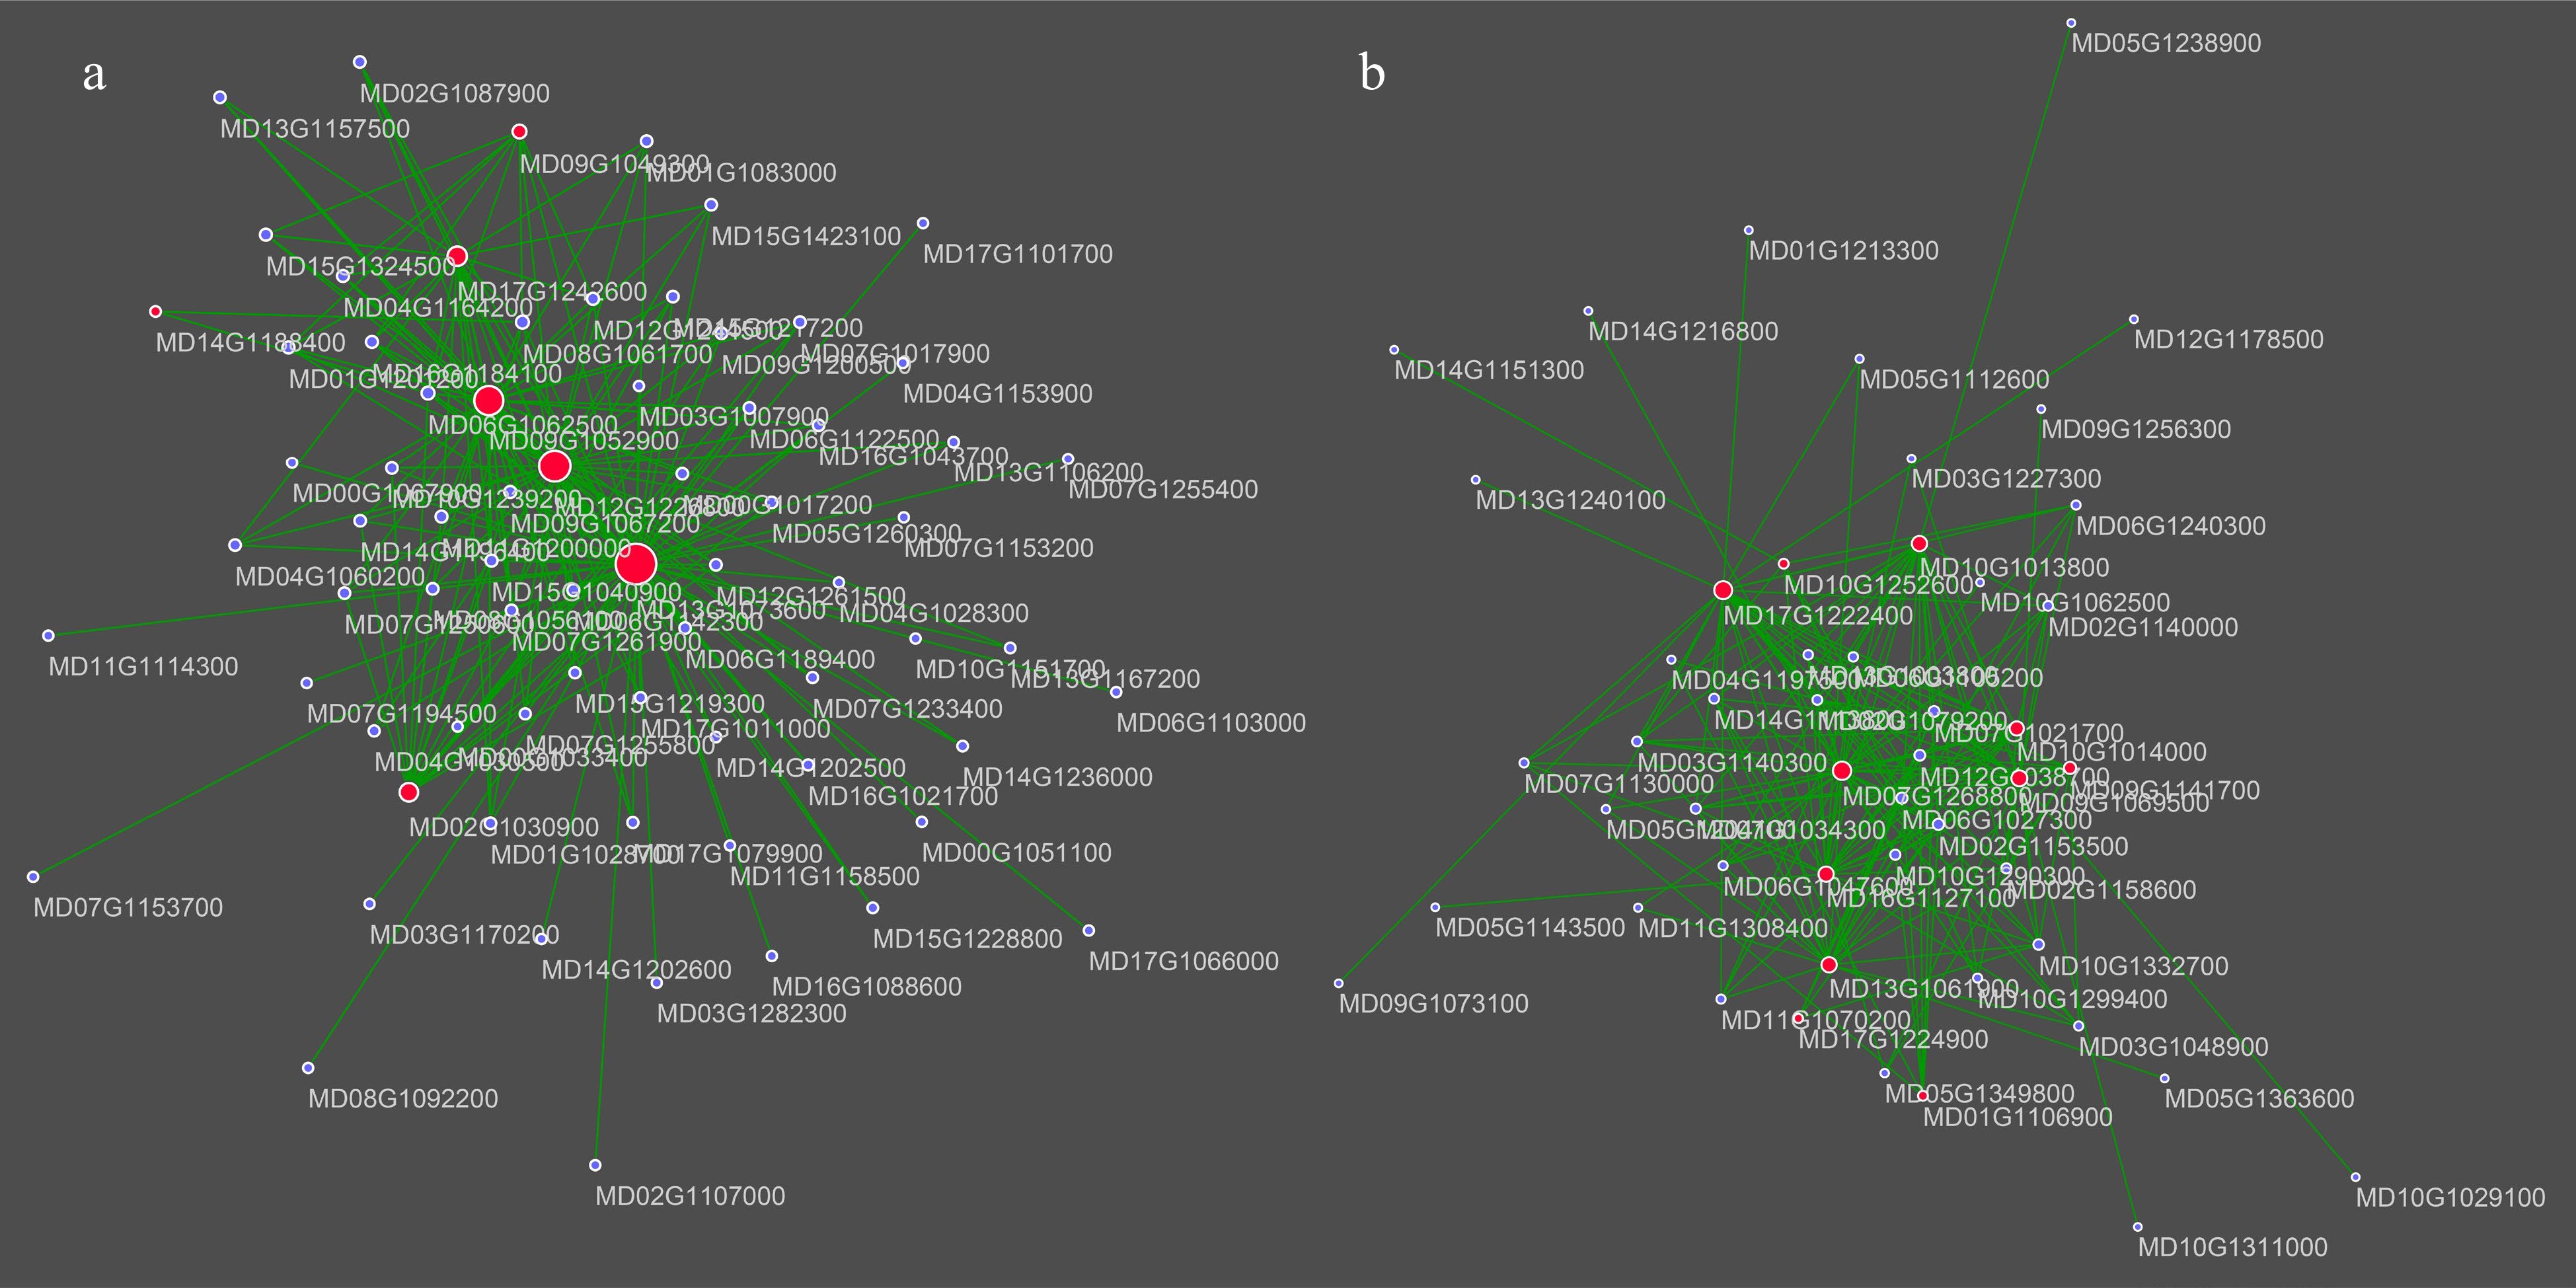
Figure 6.
Visualization of the selected hub genes and the top 200 connections in the different stage-specific modules. (a) Co-expression network of turquoise module-related genes. (b) Co-expression network of brown module-related genes. Point size represents the degree of the layout. Hub genes are marked with the red.
Analysis of fruit ripening-related genes and construction of pathways for NAA treatment vs control
-
According to the previous study, researchers proposed the apple fruit ripening model which is regulated by the ethylene, EIN3, MADS1/2, and ACS/ACO regulation loop (Fig. 7a)[40]. To explore the possible transcriptional regulations of NAA on inhibiting the apple fruit enlargement and ripening, expression changes of known genes involved in apple fruit development and ripening were further investigated (Fig. 7). As shown in Fig. 7b, Ethylene insensitive 3 (EIN3, MD07G1053800), as a trigger of fruit ripening transcriptional factor, presented a peak expression level at FS3 stage of control fruits, but at FS4 stage of the NAA treated fruits (Fig. 7b). Considering the FS3 stage is the beginning of the fruit ripening at normal condition, EIN3 might play a crucial role in the fruit ripening. This implied that the delays of EIN3 peak expression during NAA-treated fruit development might be related to the delayed fruit ripening under NAA treatment. For the EIN3-binding F-box proteins (EBFs), their expression levels in the NAA-treated fruits were generally lower than that in the control fruits at early stages (FS1−FS3), but rise sharply at the mature stage of FS4 (Fig. 7b), corresponding to the delayed fruit ripening phenotype. Concerning the two MADSs (MADS1 and MADS2), their expression levels were generally decreased along with the fruit development stages (Fig. 7b). It is obvious that the mRNA abundances of MADS1 and MADS2 were much higher in NAA-treated fruits than that in the control fruits at early stages, especially at the FS1. For the ethylene synthesis genes, the expression level of ACO presented extremely low during the four development stages, while the expression abundance of ACS generally presented a very low expression level at early stages (PS1−PS3) and ACS boomed its expression abundance at the mature stage PS4 (Fig. 7b), suggesting that the ethylene synthesis genes were playing their roles at fruit mature stage. However, the expression levels of ACO in the NAA-treated fruits at the mature stage were much higher than that in the control fruits (Fig. 7b). Considering the NAA inhibiting the fruit enlargement and ripening possibly occurred at early fruit development stages, we think that the ethylene synthesis genes might not be the key factor of NAA induced ripening delay. Except for the Ethylene-EIN3-MADS1/2 and ACS/ACO ripening loop, previous studies had identified the other fruit ripening factors, such as transcriptional factors ERF, ARF, and ethylene receptors ETR. As shown in Fig. 7c, these genes presented a similar expression pattern that they are generally expressed highest at the FS3 stage (the ripening beginning stage) in the control fruit, while this expression was distrusted in the NAA treated fruits and their expression levels were generally lower than that in the NAA treatment. Since these genes play an important role in fruit ripening, we presumed that the distribution and decrease of these ripening-related genes expression might lead to the delay of fruit ripening under NAA treatment.
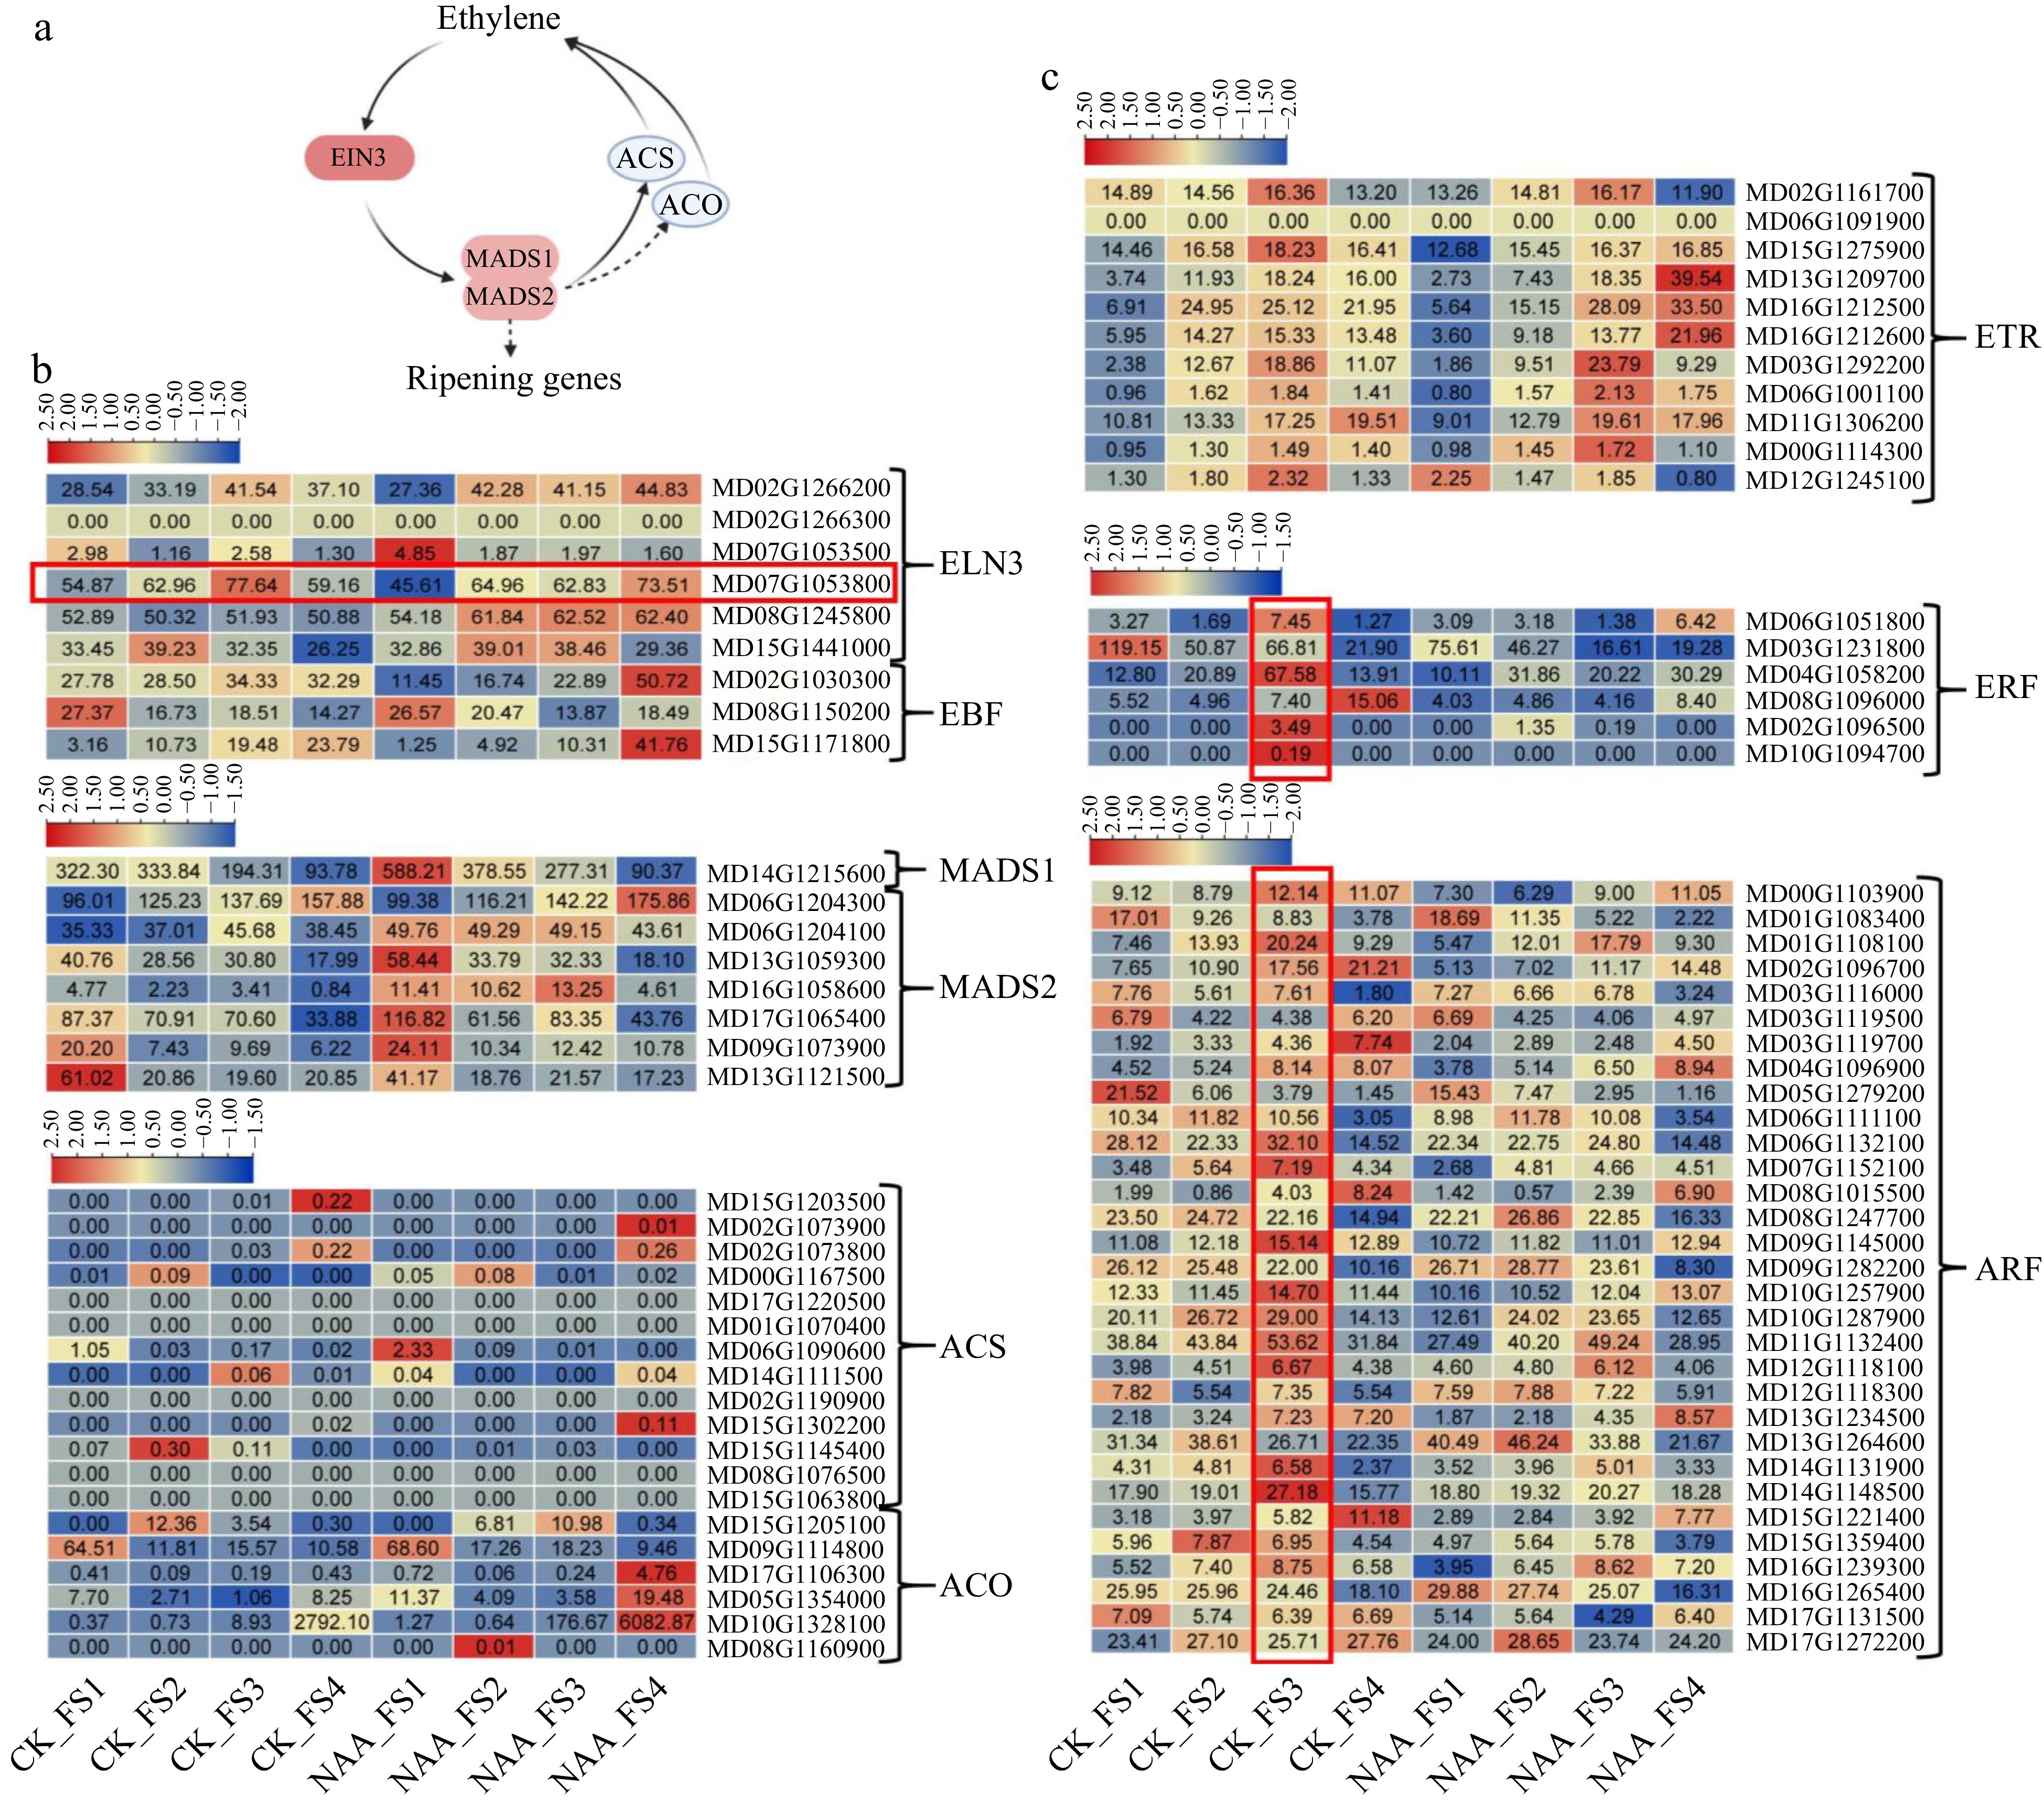
Figure 7.
Expression changes of known genes involved in apple fruit development and ripening process. (a) Model of apple fruit ripening was proposed by a previous study[40]. (b) Expression changes of genes involved in the apple fruit ripening. (c) Known genes associated with fruit development and ripening.
-
Apple, as one of the most popular fruits, is widely loved for its nutritional value and flavor. The exploration of apple thinning agent has never stopped obtaining higher fruit quality and more economic value. A higher number of crop load can decline fruit size, fruit quality, tree growth, and nutrient storage, and plant resistance[8]. The study on different rootstocks of the apple cultivar 'Ligol' found that yield and fruit weight are related to crop load, while changes in metabolites depend on the rootstock[41], and the size of the 'gala' apple is influenced by production load and other factors, but not affected by rootstock[42]. Different from the close relationship between citrus fruit quality and rootstock on water, apple quality mainly depends on yield and canopy management[43]. Therefore, the relationship between apple rootstock and crop load should focus on determining the appropriate crop load for different rootstocks. For 'Honeycrisp' apples on M9-NIC29 and 'Braebum' apples on M.26 rootstock, higher maturity is associated with lower crop load[2,44]. As the crop load (K + Mg + N): Ca ratio decreases gradually with increasing crop load, the lowest (K + Mg + N): Ca is achieved at 11.3 fruit/cm2[2]. Mean fruit mass and relative yield of 'Golden Delicious' apples, greater than 70 mm in diameter on the Hashabi rootstock, increased with midday stein water potential. Compared to high crop load, low crop load has a stronger correlation with stem water potential[45]. In our study, we evaluated the suitable crop load for 'Fuji' apple on different rootstocks. For vigorous stock, dwarfing rootstock, and dwarfing interstock, A2 (320), B2 (110), and C3 (210) are suitable for tree growth. However, to obtain fruits with better quality (fruits with a diameter exceeding 80 mm), A2 (320), B1 (90), and C1 (100) are more recommended. Meanwhile, we evaluated the suitable crop load for different rootstocks. For vigorous stock, dwarfing rootstock, and dwarfing interstock, A2 (320), B2 (110), and C3 (210) are suitable for tree growth. However, to obtain fruits with better quality (fruits with a diameter exceeding 80 mm), A2 (320), B1 (90), and C1 (100) are more recommended.
Of the many fruit thinning methods, chemical thinning is widely used for its convenience, simplicity, economy, and causes less damage. However, the thinning effect of fruit thinning agents is influenced by many factors, such as the type of thinning agent, concentration, and the fruiting stage of the application. The inappropriate use of chemical thinning agents may also have a negative impact on fruit quality[8,12]. Determining the suitable thinning efficiency of different thinning agents combined with the optimal amount of fruit retention is of great importance for the use of chemical thinners for the apple industry. For fruit thinning, the fruit thinners carbaryl, 6-BA, NAA, and Metamitron could provide good fruit thinning effect and are widely used in fruit thinning[12]. In this study, all four fruit thinners, carbaryl, 6-BA, NAA, and Metamitron showed significant thinning effects. The use of 6-BA and Metamitron had a low center flower set rate, while carbaryl and NAA showed a relatively high center flower set rate. However, carbaryl and 6-BA were more likely to obtain single fruit ratios compared to NAA and Metamitron (Fig. 1). The fruit thinning agents carbaryl, 6-BA, and NAA were widely reported in early studies[8]. Carbaryl is an insecticide that is widely used because it has no negative effects on trees and fruits. In our study, it also possessed a high thinning effect, and the quality of the fruit after the application was significantly improved compared to the control. However, previous studies have shown that overuse may increase peel russeting, so carbaryl may not be used repeatedly[12]. The thinning effect of NAA can be strongly influenced by the environment, and it has both thinning and fruit retention effects. In our study, NAA application produced a thinning effect and inhibited fruit enlargement, which is consistent with previous studies[12,46]. It seems that this effect is closely related to the concentration of NAA in apples[18]. Meanwhile, the use of NAA in late fruit development could increase the fruit retention rate[20]. Therefore, studying the molecular mechanisms of NAA on fruit development at different concentrations may be important for revealing NAA-based fruit thinners. Another fruit thinner 6-BA is more recognized because of its natural presence in the plant. 6-BA promotes the synthesis of ethylene in leaves and fruits, which may produce the thinning effect through ethylene[47]. Compared to NAA, 6-BA has been studied for a shorter time[8]. However, the thinning effect of 6-BA was shown comparable to the widely used carbaryl in our results, so it may have a better application prospect for BA as a thinning agent.
In terms of fruit concentration, we evaluated the optimum concentration for thinning effect of three fruit thinning agents carbaryl, 6-BA, NAA by setting up a concentration gradient. For plant hormone fruit thinner, 6-BA tended to show an increasing and then decreasing trend with the concentration changing. However, at higher concentrations of NAA (20 mg/L, 30 mg/L), opposite trends were observed in cluster and center fruit set rates. This trend may prove that NAA has a preferred concentration for fruit thinning. The results of previous work showed that NAA injection at 9.49671 mg/L could significantly inhibit fruit enlargement and promote fruit abscission. However, low concentrations of NAA (18.621 μg/L, 1.8621 mg/L) were injected to promote fruit enlargement and increase fruit retention. Three NAA treatment concentrations were higher than 9.49671 mg/L in our results, so three concentrations of NAA produced thinning effects consistent with the previous injection results[18]. In addition, some studies prove that NAA can also play a role in fruit retention at fruit ripening[19]. The study of NAA treatment during fruit development is important to reveal the effect of NAA on fruit.
Plant hormone-based thinners, auxin, gibberellin, and cytokinin affect the fruit setting and development process, and their application during fruit setting will play a role in chemical thinning agents. The application of these plant hormones also has a regulatory effect on fruit size, fruit shape, and nutrient content[17]. In our study, we found that NAA significantly inhibited the fruit development process. In similarity, the NAA treatment of both grape and tomato delayed the ripening process. In grapes, NAA treatment showed a longer phenological period, while down-regulating the expression of VviF3'H, a gene related to the flavonoid pathway[48]. Similarly, exogenous auxin delays the ripening process in tomatoes and disturbs the expression pattern of many genes involved in metabolic pathways[49]. Simultaneously, there may be crosstalk between auxin and ethylene, which could inhibit tomato fruit ripening[50]. However, NAA treatment had no significant effect on the large green and white ripening stages of strawberries. After removing the achenes, NAA treatment significantly promoted fruit coloration and inhibited fruit enlargement. Meanwhile, the treatment with an NAA inhibitor significantly inhibited the ripening process of the fruit. It was indicated that endogenous NAA played a facilitating role during strawberry development. In the presence of sufficient endogenous NAA, exogenous NAA had no significant effect on the fruit, which was significantly different from exogenous NAA in apples[51].
A previous study on apples has revealed the effect of NAA as a chemical thinning agent on the fruit abscission zone and ovary development through transcriptomic studies[17,20]. In our study, we analyzed NAA treatments and water treatment as control throughout the developmental period to reveal the effects of NAA in fruit pre-development and later fruit ripening processes. Our results show that FS2vsFS1 NAA SpGs are significantly enriched in genes related to cell division, cell cycle, and hormones. The enrichment results of FS2vsFS1 were similar to the cell cycle obtained in the transcriptome of the abscission zone after NAA treatment, but genes related to photosynthesis, ethylene, and ABA were not significantly enriched in FS2 vs FS1 might be due to the difference in tissue samples[20]. Related studies also involved the ripening process of apple fruits. In a previous study, all fruits dropped before harvest after NAA treatment at 540.009 mg/L, so the study was not performed on the exogenous NAA transcriptome for the entire developmental period.[17]. But the enrichment pathways in NAA-treated special genes 18 d after treatment (DAT) were significantly enriched for pathways related to stress and signaling pathways, which were similar to our results[17]. Meanwhile, the results of our FS2 vs FS1 and FS3 vs FS2 difference analysis showed that NAA treatment was probably a stimulus for the fruit, which may affect fruit development by affecting hormonal pathways such as auxin and gibberellin, cell division and development in the early stages of fruit development. In addition to the NAA-related transcriptome results, the application of exogenous auxin has different effects on apples depending on the concentration and stage of application. Low concentrations of NAA (18.621 μg/L, 1.862 mg/L) were injected to promote fruit expansion and increase fruit retention, while 9.497 mg/L NAA injection significantly inhibited fruit enlargement and promoted fruit abscission. And the region of ARF106 (MDP0000232116), which is related to auxin, was found by QTL localization and possibly related to the expansion of NAA-treated apple fruits, and verified by RT-qPCR[18]. Similarly, many ARF family members were found in our transcriptome results, but ARF17 (MD15G1359400) which corresponds to ARF106 (MDP0000232116) did not show significant changes, probably due to differences in genome annotation, differences in NAA treatment, or differences in RT-qPCR and transcriptome results, etc.
For screening genes related to fruit size and fruit coloration under NAA treatment, we performed co-expression network analysis by WGCNA and selected genes with GS > 0.6 and MM > 0.8 in the turquoise and brown modules related to fruit size and coloration as hub genes for analysis. We found that most of the hub genes are associated with the hormonal pathway. The turquoise module hub gene contains the expansin A15 (MD09G1052900) and expansin B3 (MD17G1242600) genes that are involved in cell division. Also included the hub genes of cytokinin-related AHP1 (MD12G1226800) and ARR6 (MD14G1188400)[39], a positive regulator of cell elongation and gibberellin-related PRE1 (MD09G1049300)[38]. These genes may respond to NAA treatment, which in turn affects cell division and extension. Meanwhile, the ABA-induced and negatively regulating GA-mediated programmed cell death protein HVA22C (MD13G1073600)[37,52] were also found in the hub genes. And seven genes related to ABA and two genes related to jasmonic acid response could be found in the hub genes of the brown module. This result suggests that NAA treatment may regulate fruit development through multiple hormonal pathways during early fruit development, and regulate late fruit development through the ABA pathway. In previous studies, exogenous NAA and 2,4-D in apple callus affected pathways such as cytokinin, ethylene, and gibberellin-related pathways, which is consistent with our hub gene-related pathways in the turquoise module with high FS1 expression in WGCNA and FS2 vs FS1, FS3 vs FS2 NAA SpGs hormone enrichment results[53]. Similarly, auxin was found to be involved in the regulation of apple anthocyanins through Aux/IAA-ARF. Under treatment with auxin, auxin binds to MdIAA121 and releases the negative regulator of the anthocyanin pathway, MdARF13, which binds to the promoter of the structural gene of the anthocyanin pathway, MdDFR, and thus negatively regulates anthocyanin accumulation in apple[54]. For the hub genes of the brown module in the fruit coloration, we found the hub gene of the flavonoid pathway phenylalanine ammonia lyase 1 (MD01G1106900). Possibly suggesting that the effect of NAA treatment on fruit coloration in FS3 may also affect anthocyanin synthesis by influencing phenylalanine ammonia lyase. Simultaneously, the previous studies of apple callus revealed that the auxin treatment inhibited the anthocyanin synthesis process, which is also consistent with our FS3 phenotype and the enrichment of phenylalanine metabolic processes in FS3 vs FS2 NAA SpGs[53]. The regulation mechanism of phenylalanine ammonia lyase 1 might be a very interesting research direction. Transcriptome application throughout fruit development is important to reveal the effect of exogenous NAA on fruit development and the ripening process. Our study is valuable for the evaluation of exogenous auxin in commercial application and specification.
-
In our study, we evaluated crop loads on different types of rootstocks to obtain optimal Fuji apple loads for low tree nutrient consumption and high-quality apple production. The recommended loadings for vigorous stock, dwarfing rootstock, and dwarfing interstock were 240 (A2), 90 (B1) and 100 (C1) to get sustainable production. Furthermore, to achieve these crop load in a cost-effective manner, we evaluated different fruit thinning agents (carbaryl, 6-BA, NAA, and Metamitron), application concentrations, and timing of use on widely used dwarfing interstock. The results showed that the best use of fruit thinning agents is 2,000 mg/L carbaryl at 10 d after flowering. We also found that exogenous NAA inhibited fruit enlargement. Transcriptome analysis of the four periods (FS1, FS2, FS3, FS4) revealed that many hormones and ripening-related genes responded to exogenous NAA treatment. And further WGCNA analysis combined with fruit phenotypes identified core genes associated with fruit expansion and fruit coloration as well as constructed expression networks. Our study has implications for the application of fruit thinners, the assessment of crop loads, and revealing the molecular mechanism of exogenous NAA in fruit development.
-
The authors confirm contribution to the paper as follows: study conceptualization: Zou Y; data curation: Wang Q, Jiang W, Zheng Q; methodology: Wang S, Wang Y, Wang J, Zou Y; formal analysis: Jiang W; visualization: Wang S; validation: Wang Q; funding acquisition: Li X, Xu J; supervision: Li X, Wang J, Guan Q, Ma F, Zhang J, Zheng Q, Zou Y, Xu J; writing-original draft: Wang S, Wang Q, Yan J; writing-review & editing, investigation, project administration: Xu J. All authors reviewed the results and approved the final version of the manuscript.
-
The transcriptome data have been deposited into the NCBI BioProject (BioProject,
https://www.ncbi.nlm.nih.gov/bioproject/ ) under accession number PRJNA1013905. This work was supported by grants from the Key S&T Special Projects of Shaanxi Province, China (2020zdzx03-01-02), the Spring Sunshine Program supported by the Ministry of Education, China (HZKY20220551), the National Natural Science Foundation of China (31972370).
-
The authors declare that they have no conflict of interest.
-
# Authors contributed equally: Shicong Wang, Qianying Wang
- Supplemental Table S1 Genes contained in different modules.
- Supplemental Table S2 Effects of different concentrations of fruit thinning agents on the external quality of apples.
- Supplemental Table S3 The enrichment of module contained genes.
- Supplemental Table S4 The hub genes of different module.
- Supplemental Fig. S1 Apple yield per acre under different thinning agent treatments.
- Supplemental Fig. S2 Transcriptome differential analysis overlap and enrichment analysis supplement.
- Supplemental Fig. S3 Volcano plot of 4 time point difference analysis.
- Supplemental Fig. S4 Supplement of WGCNA analysis (Containing soft thresholds, module correlations, coloring trait correlations and red module expression profiles).
- Copyright: © 2024 by the author(s). Published by Maximum Academic Press, Fayetteville, GA. This article is an open access article distributed under Creative Commons Attribution License (CC BY 4.0), visit https://creativecommons.org/licenses/by/4.0/.
-
About this article
Cite this article
Wang S, Wang Q, Jiang W, Wang Y, Yan J, et al. 2024. Evaluating the sustainable cultivation of 'Fuji' apples: suitable crop load and the impact of chemical thinning agents on fruit quality and transcription. Fruit Research 4: e009 doi: 10.48130/frures-0024-0002 

Evaluating the sustainable cultivation of 'Fuji' apples: suitable crop load and the impact of chemical thinning agents on fruit quality and transcription
- Received: 06 November 2023
- Revised: 11 December 2323
- Accepted: 18 December 2023
- Published online: 04 March 2024
Abstract: The optimal load capacity provides sustainable production and high quality in 'Fuji' apple production. Determining optimal crop loads with simple and affordable thinning methods is critical for apple. We set different load capacities on different apple tree rootstocks and evaluated their effects on tree development, fruit yield and quality. The optimal load capacity for vigorous stock, dwarfing rootstock, and dwarfing interstock were 240, 90, and 100 for apples above 80 mm in diameter, respectively. To explore the optimal strategies of diverse fruit thinning agents (carbaryl, 6-BA, NAA, and Metamitron) used in the 'Fuji' apple tree, we assess from thinning agents' types, varying spraying concentrations, and application time in the most widely used dwarfing interstock. The results showed that the best use of fruit thinning agents is 2,000 mg/L carbaryl at 10 d after flowering could significantly reduce fruit set rate and improve the fruit quality in the dwarfing interstock. During the research, only the fruit thinner NAA treatment suppresses fruit development. Thus, we performed the transcriptome analysis on the NAA-treated and control fruits at 60 (FS1), 90 (FS2), 120 (FS3), and 150 (FS4) days after flowering stages to investigate the potential transcriptional regulations of NAA on fruit development and ripening. Transcriptome results showed that genes related to fruit expansion (expansin A15, expansin B3), phytohormone-related genes (HVA22C, PRE1, AHP1, etc.), fruit coloring-related genes (PAL), and many ripening-related transcription factors (EIN3, ERF, ARF, etc.) might be regulated by exogenous NAA. Our results provide an important reference for the sustainable production and optimal use of fruit thinning agents.
-
Key words:
- Apple /
- Fruit development /
- Fruit thinner /
- Crop loads /
- Exogenous NAA /
- RNA-seq