


-
Lonicerae japonicae flos (LJF), derived from the dried flower buds or initial blooms of Lonicera japonica Thunb. (Caprifoliaceae), is a traditional medicinal herb with pharmacological properties including heat-clearing, detoxification, and wind-heat dispersion[1]. LJF contains abundant bioactive constituents such as phenolic acids[2], volatile oils[3], flavonoids[4], iridoid glycosides[5], and triterpenoids[6]. Modern pharmacological studies confirmed that LJF exhibits diverse bioactivities, including antiviral[7], hepatoprotective[8], gut-modulatory, antidepressant[9], antioxidant, anti-allergic[10], and immunomodulatory effects[11]. Owing to its significant therapeutic value, LJF is extensively incorporated into compound formulations of traditional Chinese medicine and natural health products, demonstrating substantial commercial demand.
LJF was primarily cultivated in Hebei, Henan, and Shandong provinces of China. Owing to its drought and cold tolerance, coupled with high adaptability, cultivation has expanded to multiple additional provinces. However, LJF quality exhibited significant variation across geographical origins due to environmental factors such as climate, precipitation, soil composition, and topography[12]. Current quality control and variability assessment of LJF remained primarily dependent on morphological evaluation or quantification of limited marker compounds. This lack of systematic evaluation methods contributed to inconsistent herbal quality. Consequently, research on geographical origin and quality correlation is essential not only for enhancing therapeutic efficacy but also for promoting standardized industrial development.
Primary methodologies for geographical discrimination and quality assessment of traditional Chinese medicines encompass an array of analytical approaches, including but not limited to: morphological identification[13], mineral element analysis[14,15], stable isotope techniques[16,17], spectroscopic methods[18,19], and chromatographic approaches[20,21]. Morphological evaluation, which relies on sensory characteristics such as visual, tactile, olfactory, and gustatory assessments, is highly dependent on empirical expertise and is inherently subjective, which can compromise identification accuracy. Stable isotope technology, predicated on natural fractionation differences of stable isotopes in organisms of divergent origins, enables identifying the origin. This technology could be utilized to determine the geographic origin and authenticity, based on the differences in stable isotope abundance values of organisms from different origins[22]. Nevertheless, it demonstrates limited discriminative capacity when organisms originate from proximate regions with analogous environmental conditions. Critically, the content of marker compounds in traditional Chinese medicines correlates closely with both environmental factors and species-specific accumulation patterns of secondary metabolites in plants[23], forming the foundation for quality evaluation and therapeutic efficacy[24]. Therefore, quality assessment based on quantitative profiling of marker compounds represents a validated strategy for herbal medicine quality control.
Currently, there are instances of unethical merchants employing substandard products through the addition of chemical substances and fraudulent processing, compromising the reliability of the quality assessment of herb materials by a singular evaluation method. To address this challenge, a multidimensional quality evaluation system was established, integrating three critical dimensions: morphological traits, environmental factors, and intrinsic chemical properties. To this end, a multi-dimensional comprehensive quality evaluation system was established; this system combines: morphological identification of LJF across geographical origins, stable carbon and nitrogen isotope ratio analysis, and quantification of marker compounds. Hierarchical Cluster Analysis, Principal Component Analysis, and Orthogonal Partial Least Squares Discriminant Analysis were employed to discriminate geographical origins and identify key differential markers. An origin discrimination model was constructed using these key differential markers and rigorously validated through blinded independent testing to ensure robustness. The integrated approach enhances quality control efficacy and establishes refined quality criteria for LJF.
-
LJF samples were collected from eight production regions in China: Chongqing, Guangxi, Guizhou, Hebei, Henan, Hunan, Shandong, and Sichuan. Those originating from Chongqing were labeled CQ1 to CQ2; from Guangxi as GX1 to GX2; from Guizhou as GZ1 to GZ3; from Hebei as HB1 to HB7; from Henan as HEN1 to HEN10; from Hunan as HUN1 to HUN4; from Shandong as SD1 to SD8; and from Sichuan as SC1 to SC4, making a total of 40 batches. Each sample was sequentially washed with tap water and deionized water to remove adhering soil. The washed samples were then dried at 55 °C until a constant dry weight was attained. The dried material was ground into powder and subsequently sieved through a No. 65 mesh. All powdered material samples were stored in a dry and shaded environment prior to analysis.
Morphological characteristics evaluation
-
All 40 batches of LJF samples were laid flat on laboratory benches. The external morphological characteristics, including appearance, color, odor, and pubescence density, were systematically observed. Subsequently, the length, maximum diameter, and basal diameter of each individual sample were measured using digital calipers. All observations and measurements were recorded.
To mitigate subjective bias in origin discrimination, this study employed Doubao AI as an auxiliary tool. The methodology comprised three phases: The first phase was initial feature extraction and knowledge base construction: Doubao AI processed images of LJF from diverse origins to identify and extract key visual morphological traits, forming a preliminary origin classification knowledge base. The second phase was visualization of diagnostic traits: Based on the extracted key discriminative features, representative morphological traits specific to each origin were visualized, generating standardized, origin-specific morphological diagrams compliant with medicinal plant illustration protocols. The last phase was origin retrospective testing: captured sample images from each origin were input into Doubao AI with instructions to match images to their origin based solely on visual morphology. Furthermore, to assess the tool's reliability and exclude pervasive 'AI hallucination' as the cause of failure, a control test was conducted using Andrographis paniculata (chuanxinlian) images.
Stable isotope ratio analysis
-
Powdered samples (2 mg) were weighed using an analytical balance (Mettler-Toledo, USA) and transferred into tin capsules for carbon (C) and nitrogen (N) isotope analysis. The δ13C and δ15N values of all the samples were analyzed via an elemental analyzer-stable isotope ratio mass spectrometry (EA-SIRMS; isoprime vision IRMS interfaced with a vario ISOTOPE CUBE EA, Elementar, Germany). The carbon and nitrogen elements in the samples were converted into CO2 and N2 in the reactor. EA oxidation and reduction furnace temperatures were respectively set at 1,150 and 850 °C. Resultant gases were separated and purified through a carbon sieve gas chromatography column under helium carrier gas flow prior to introduction into the isotope mass spectrometer. Isotopic composition was expressed in δ notation relative to international standards[25]: δ (‰) = [(Rsample/Rstandard) −1] × 1,000‰, where δ represents either δ13C or δ15; Rsample denotes the abundance ratio of heavy isotope against light isotope, e.g.,13C/12C,15N/14N; Rstandard is the isotope ratio of reference standard vs primary standards, Pee Dee Belemnite (VPDB) for carbon, Air gas (AIR) for nitrogen. In this study, the certified reference material B2155 (Carbon: 46.5%; Nitrogen: 13.32%; Sulphur: 0.751%) was used for isotopic calibration. Analytical quality control included interleaved analysis of the standard every 12 samples. All measurements were performed in triplicate, and mean values ± standard deviation (SD) were calculated.
Marker compounds identification and quantification
-
An accurately weighed powder sample (0.2 g) was transferred into a stoppered conical flask. A volume of 20 mL of 75% methanol was added, and the flask was accurately weighed. Then the powder was extracted in an ultrasonication (220 W, 40 kHz) for 30 min. After the mixture cooling to room temperature, the flask was reweighed. The weight loss was compensated for by replenishing with 75% methanol. Subsequently, the extract underwent centrifugation at 12,000 rpm for 5 min. The resulting supernatant was filtered through a 0.22 μm nylon filter before being injected into the ultrahigh-performance liquid chromatography coupled with quadrupole time-of-flight mass spectrometry system (UPLC-Q-TOF-MS/MS, Waters Milford, MA, USA). The content of marker components in LJF was determined by calculating the mean peak area from three replicate injections.
The reference standards were accurately weighed and transferred into amber volumetric flasks, then dissolved in 75% methanol to prepare individual stock solutions with final concentrations of 100 μg/mL, including chlorogenic acid, neochlorogenic acid, cryptochlorogenic acid, and luteoloside.
A method was developed using UPLC-Q-TOF-MS/MS for the identification and quantification of the marker compounds. All samples were analyzed using an Agilent ZORBAX Eclipse Plus C18 column (2.1 mm × 100 mm, particle size: 1.8 μm) at 35 °C. Separation of standards and samples was achieved using the mobile phase comprised of 0.1% aqueous formic acid solution (A) and acetonitrile containing 0.1% formic acid (B), with the following gradient elution program: 0–2 min, 5%–11% B; 2–10 min, 11%–28% B; 10–11 min, 28%–45% B; 11–16 min, 45%–95% B. The flow rate was set at 0.5 mL/min, the injection volume was 2 μL, and the detection wavelength was 254 nm. Analysis was performed on a Xevo G3 Q-Tof mass spectrometer equipped with an electrospray ionization (ESI) source in negative ion mode. The mass range was set at m/z 100–1,200 Da. The optimized parameters were as follows: collision energy, 20–30 eV; cone voltage, 40 V; capillary voltage, 2 kV; ion source temperature, 100 °C; desolvation temperature, 250 °C; cone gas flow, 50 L/h; and desolvation gas flow, 600 L/h.
The compounds were identified based on the calculated accurate masses of the molecular ions and isotopic distributions in the mass spectra with database matches (mass error < 5 ppm), analyzing the characteristic MS/MS fragmentation patterns, and verifying with reference standards' retention times.
Statistical analysis
-
Data organization and analysis were performed using Excel 2021 (Microsoft Corporation, Redmond, WA, USA). Statistical analysis of the data was performed using SPSS Statistics 24.0 (SPSS Inc., Chicago, IL, USA) and SIMCA-P 14.1 (Umetrics, Umea, Sweden). Results were expressed as mean ± standard deviation (SD).
ANOVA was initially conducted to assess the significance level of each variable between groups and its impact on classification. Significant differences between datasets from various origins were defined as differences with p < 0.05. However, it is often challenging to fully differentiate similar groups using a single variable. Therefore, multivariate statistical techniques such as HCA, PCA, and OPLS-DA were employed to extract discriminant information from all variables for clearer group classification and screening differential indicators. Unsupervised HCA was utilized for dimensionality reduction, and the data set was treated by using the squared Euclidean distance as a similarity measure, which preliminarily determined the classification of LJF origins on stable isotope ratios and the relative contents of the marker compounds[26]. PCA was used to reduce the dimensionality of large data sets by transforming multivariate datasets into principal components while retaining maximal variance information. Hence, in the present study, PCA was used to visualize the original state of the data and observe the intrinsic distribution and group relationships of the test samples based on differences in the marker compounds contents[27]. Building upon prior multivariate outputs, OPLS-DA, a supervised statistical procedure, was carried out to search for a linear regression model that projects observed variables onto predicted variables in a new space for sample classification purposes. And then 200 permutation tests were employed to evaluate the reliability of the classification model and to evaluate whether the model was overfit. The results of verification are described by R2X, R2Y, and Q2, which represent the capacity of the model to explain the variance in the X and Y variables and the predictive capability of the model, respectively. The results of permutation tests are given as the values at which R2 and Q2 intercept the Y-axis. LDA provided the best discrimination between the groups by simultaneously minimizing within-group variance while maximizing between-class variance to generate discriminant functions[28]. This reduced the dimensionality of data points onto the same line while keeping them as separated as possible. Then, leave-one-out cross-validation assessed model stability and predictive performance through iterative exclusion of individual specimens.
-
Distinct morphological features of LJF samples were illustrated in Fig. 1 and summarized in Supplementary Table S1. There were certain differences in the morphological characteristics of samples from different regions. Samples from Guangxi, Guizhou, and Sichuan displayed slender needle-like morphologies with sparse pubescence. Sichuan samples predominantly showed brown to yellowish-brown pigmentation.
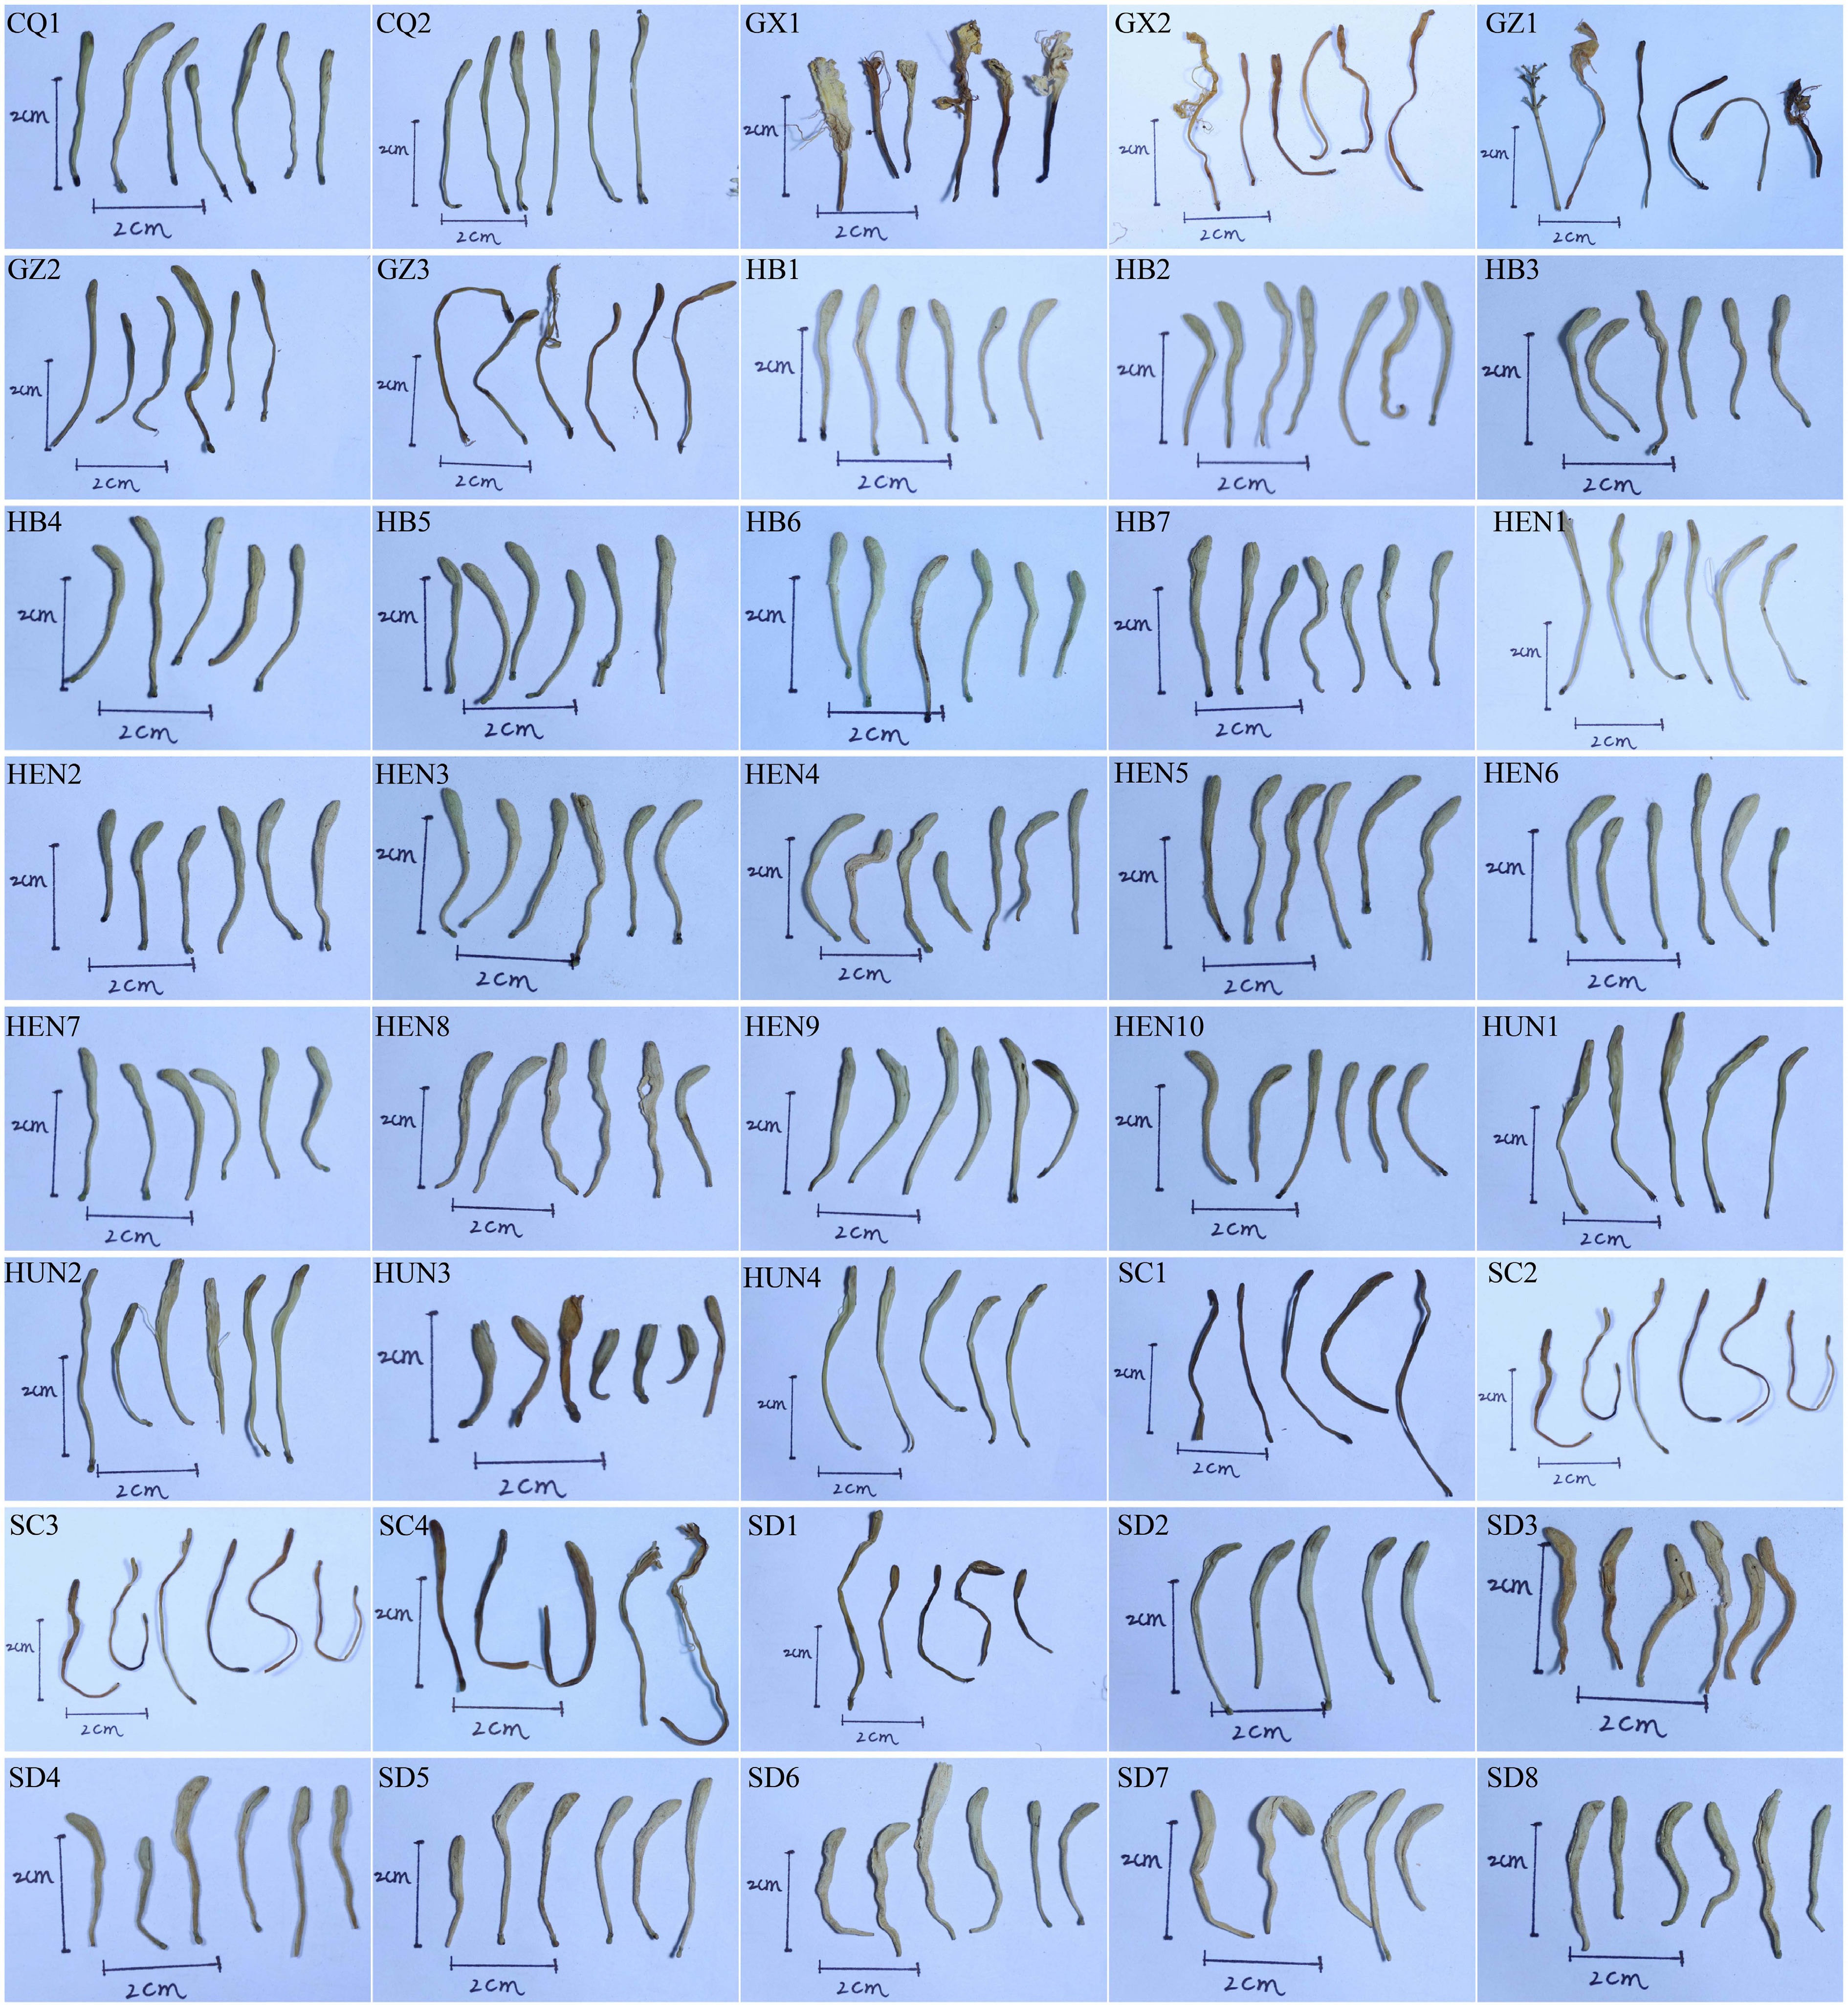
Figure 1.
Character of Lonicerae japonicae flos samples from different origins.
To minimize observer bias in origin discrimination, Doubao AI was employed (Fig. 2). Visual morphological traits were identified and extracted by processing images of LJF from diverse origins, forming a preliminary origin classification knowledge base (Table 1). Initial attempts using solely visual input failed to achieve accurate origin identification, prompting the AI to recommend more detailed input parameters.
Subsequent queries combined sample images with textual descriptions of key morphological traits. While this elicited retrospective outputs from Doubao AI, precise origin identification remained unattainable. Control testing demonstrated that Doubao AI accurately identified Andrographis paniculata (Burm.f.) Nees, effectively eliminating the possibility that pervasive AI hallucination was the plausible cause for the failure in LJF origin matching. 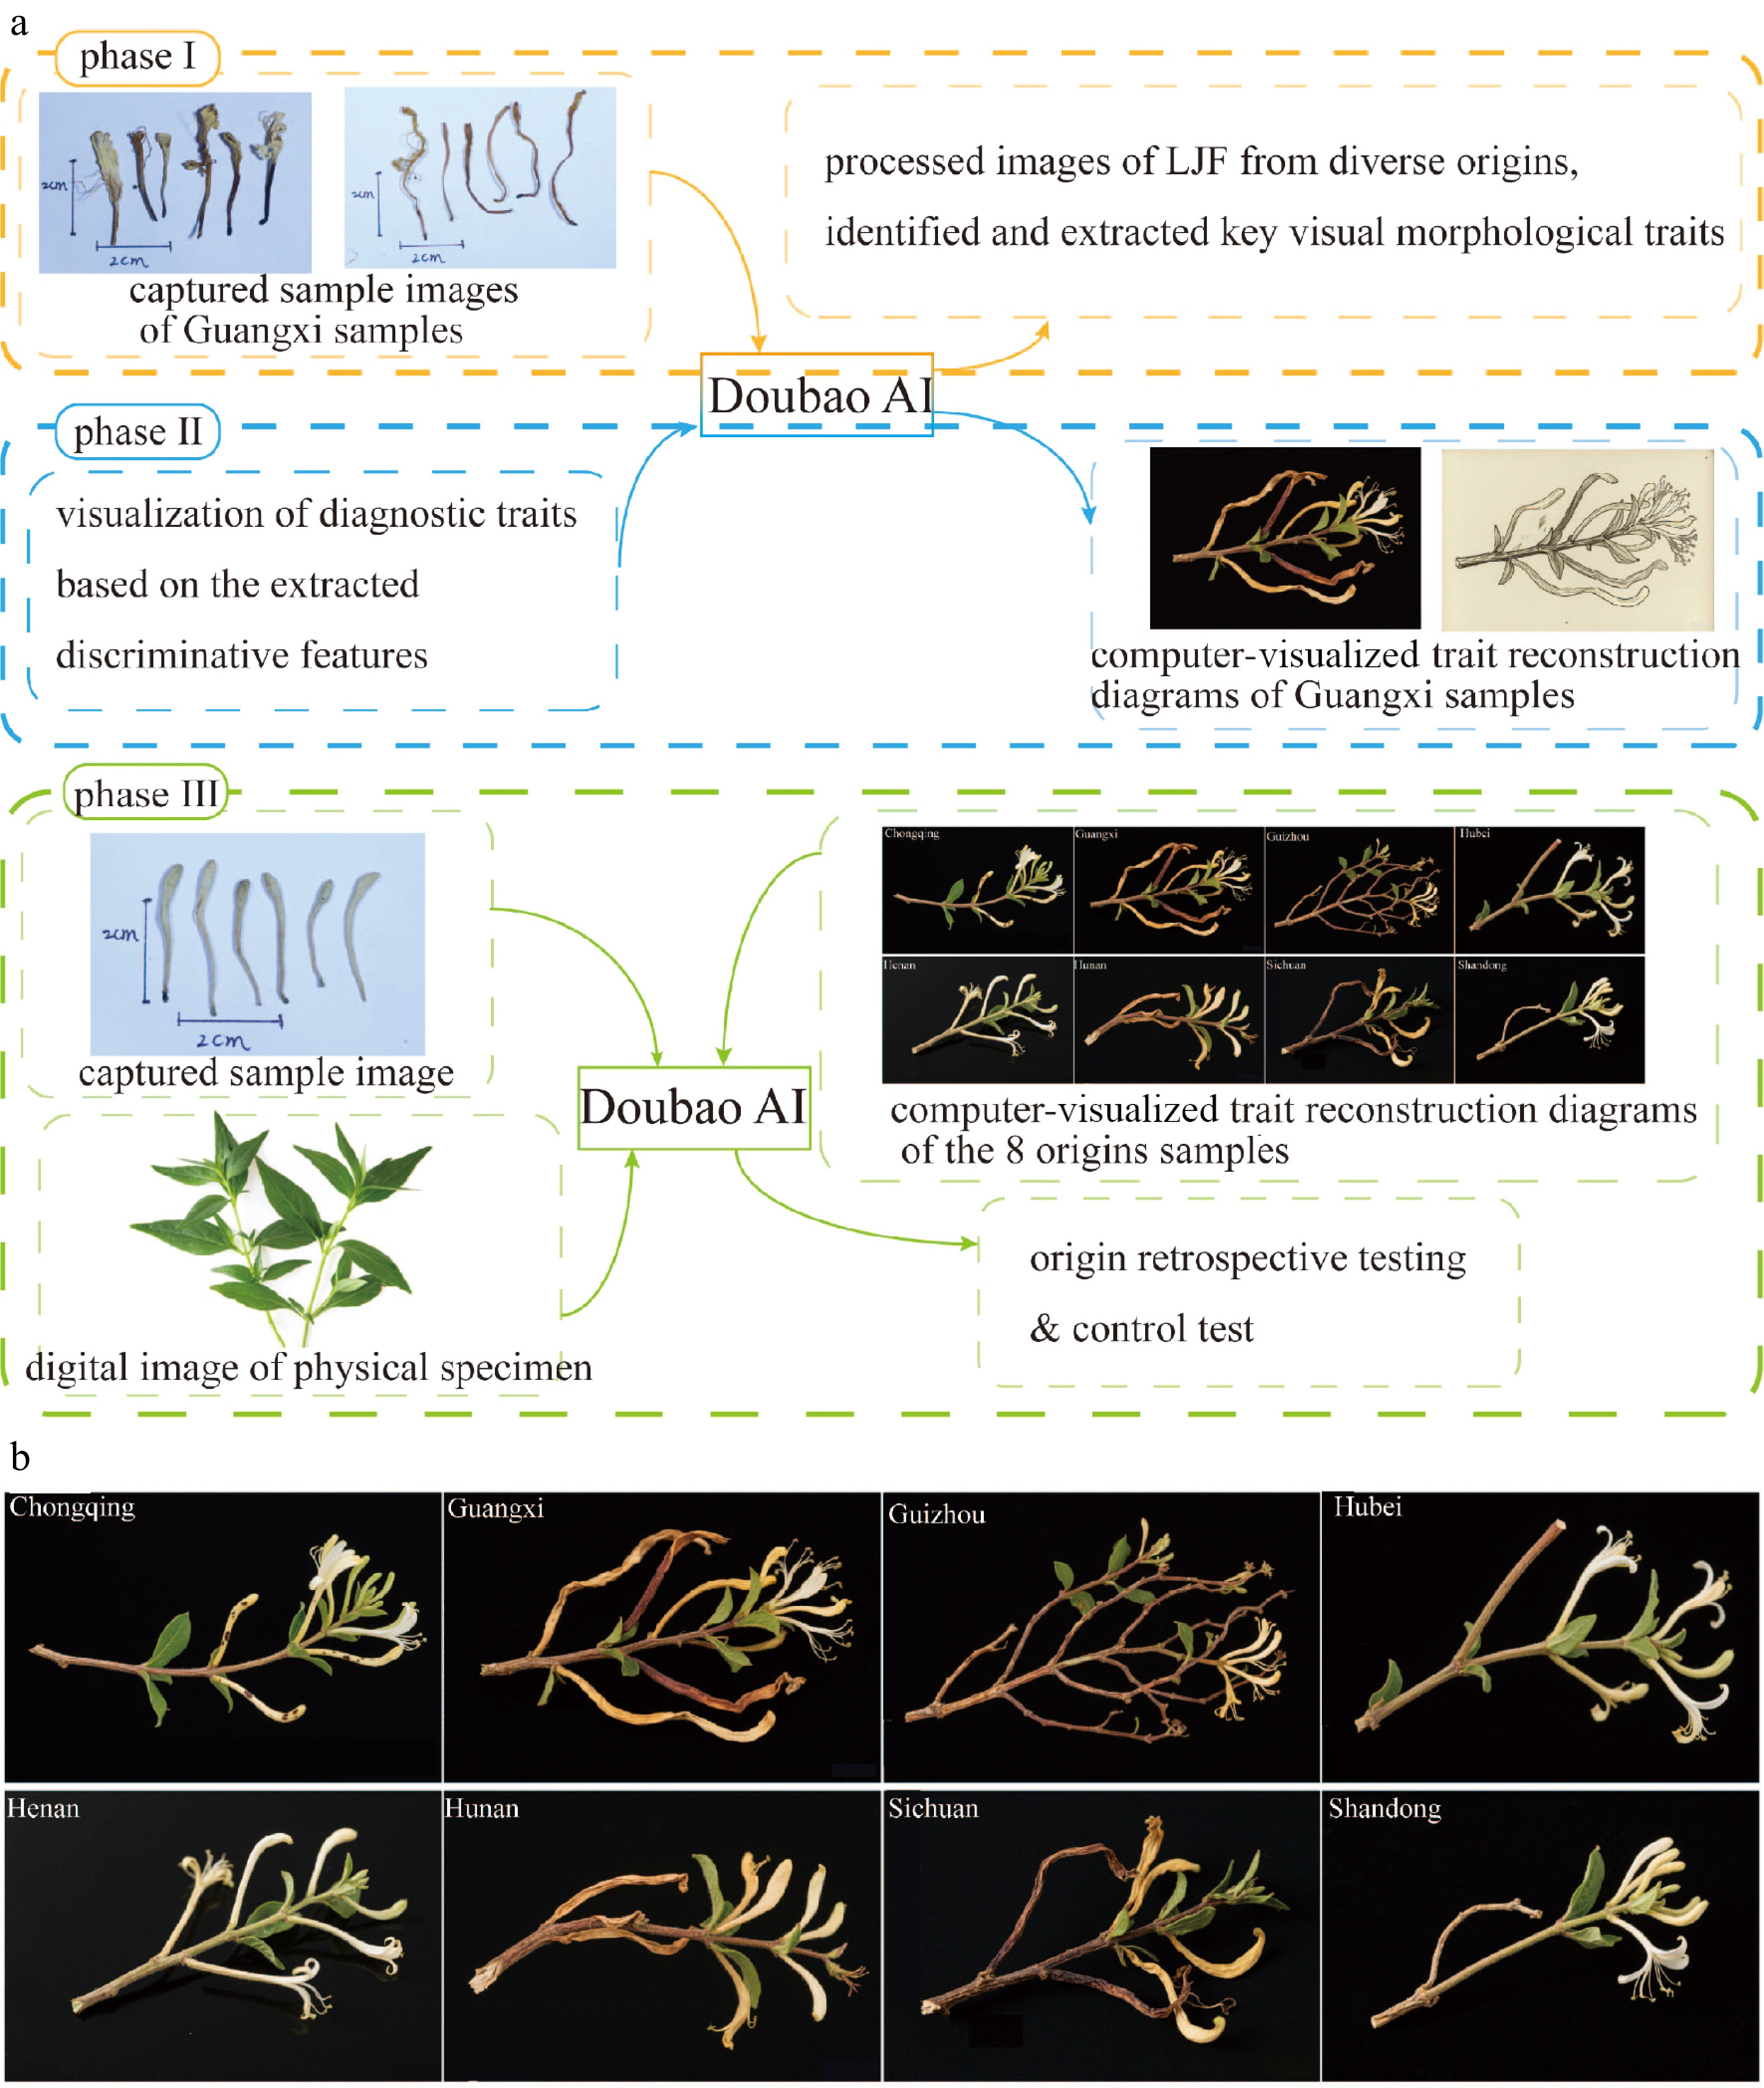
Figure 2.
AI-assisted discrimination of Lonicerae japonicae flos geographical origins. (a) Three phases of the methodology: phase I is feature extraction and knowledge base establishment; phase II is visual trait profiling; and phase III is origin retrospection and validation. (b) Computer-visualized trait reconstruction diagrams of the eight origins samples (image generated using an AI tool [Doubao] as an auxiliary step in the methodological process).
Table 1. AI-assisted comparative morphological characteristics of Lonicerae japonicae flos from different geographical origins relative to pharmacopeial standards.
Origin Morphology Color Size and uniformity# Pubescence and calyx Conformity to pharmacopeia* CQ Slender rod-shaped, curved Pale yellow-green to white-yellow, some spots, discoloration 2–4 cm, slender No significant pubescence ★☆☆☆☆ GX Elongated strip, twisted/curved, irregular Yellow-brown to pale brown, uneven, faded 2–5 cm, variable diameter No pubescence, residual filaments/stamens present ★☆☆☆☆ GZ Elongated strip, significantly twisted, branched, complex Pale to dark yellow-brown, uneven 2–5 cm, variable diameter No pubescence, residual calyx/stamens present ★☆☆☆☆ HB Slender rod-shaped, slightly curved, regular, Pale yellow-white to green-yellow, uniform (apex pale brown) 2–4 cm, uniform diameter Sparse short pubescence, clear calyx ★★☆☆☆ HEN Slender rod-shaped, slightly curved, regular, Pale yellow-white to green-yellow, uniform 2–4 cm, uniform diameter Covered with fine short pubescence (less dense), intact calyx ★★★☆☆ HUN Elongated strip, twisted, wrinkled/curled Yellow-brown, uneven (darker apex) 2–5 cm, variable diameter No pubescence, residual calyx/stamens curled ★☆☆☆☆ SD Slender rod-shaped, slightly curved, regular, Pale yellow-white to green-yellow, uniform, bright 2–4 cm, uniform diameter Densely covered with short pubescence, intact calyx ★★★★★ SC Elongated strip, severely twisted, curled, wrinkled Dark yellow-brown to brown-black, uneven 2–5 cm, highly
variable diameterNo pubescence, residual structures severely curled ★☆☆☆☆ * Conformity Assessment: Based primarily on the critical pharmacopeial requirement for 'densely pubescent' surface and intact morphology. ★★★★★ = Fully conforms, ★★★☆☆ = Partially conforms, ★★☆☆☆ = Marginally conforms, ★☆☆☆☆ = Does not conform, ☆☆☆☆☆ = Strongly deviates. # Size & Uniformity: The size and uniformity data shown in this table were derived from AI-based analysis of sample images with scale bars. These findings suggested that AI tools like Doubao possessed potential utility in the morphological identification of traditional Chinese medicines, demonstrating competence in extracting, summarizing, and differentiating key traits across distinct plant species. However, both conventional methods and AI tools faced limitations in achieving precise discrimination between geographical origins based solely on macroscopic morphological features, due to the subtlety of inter-origin variations. Consequently, integrating complementary discriminatory indicators-such as chemical, genetic, or spectroscopic markers-is essential for reliable origin authentication of LJF.
Differential analysis of samples based on stable isotope ratio values
Geographical variation analysis based on stable isotope ratio values
-
One-way ANOVA revealed significant regional differences in both δ13C and δ15N values of LJF samples across the eight regions (p < 0.05; Table 2). The δ13C values ranged from –32.10‰ to –26.28‰ (mean: –28.54‰), while δ15N values exhibited a broader range, from –7.49‰ to 16.82‰ (mean: 1.09‰).
Table 2. Isotopic ratios of C and N in Lonicerae japonicae flos from different origins.
Origin n δ13C (‰) δ15N (‰) Max. Min. Mean SD# Max. Min. Mean SD# CQ 2 −29.40 −29.65 −29.53 0.46 3.03 2.48 2.76 0.39 GX 2 −29.30 −29.53 −29.42 0.15 −2.55 −3.95 −3.25 0.99 GZ 3 −28.09 −28.95 −28.42 0.59 0.07 −0.86 −0.49 0.49 HB 7 −27.87 −30.00 −28.88 1.10 0.62 −0.62 0.09 0.47 HEN 10 −26.54 −29.92 −28.21 1.19 0.87 −1.18 0.07 0.68 HUN 4 −28.42 −30.30 −29.52 1.16 4.54 2.24 3.16 0.98 SD* 8 −27.15 −28.50 −27.81 0.39 1.39 −0.72 0.31 0.69 SC 4 −28.04 −28.89 −28.39 0.18 9.16 6.23 7.39 1.32 CQ: Chongqing, GX: Guangxi, GZ: Guizhou, HB: Hebei, HEN: Henan, HUN: Hunan, SD*: Shandong, SC: Sichuan, n: Number of samples, Max.: Maximum value, Min.: Minimum value, Mean: Arithmetic mean, SD#: Standard deviation. Regional δ13C variation was less pronounced. Mean δ13C values decreased significantly (p < 0.05) only between Hunan and Shandong, with no significant differences observed among other pairwise regional comparisons. Regionally, mean δ13C followed the order: Shandong > Henan > Sichuan > Guizhou > Hebei > Guangxi > Hunan > Chongqing. Samples from northern provinces (Shandong and Henan) showed significantly more positive δ13C values, indicating higher water use efficiency. This pattern may correlate with the temperate monsoon climate of these regions, characterized by lower precipitation and periodic drought conditions that promote stomatal closure and reduce discrimination against 13C during photosynthesis. Conversely, samples from southern provinces (Chongqing and Guangxi) exhibited the more negative δ13C values, reflecting lower water use efficiency under humid subtropical conditions with abundant precipitation (> 1,200 mm annually) and minimal water stress. Provinces with intermediate δ13C values (Hubei, Hunan, Sichuan, and Guizhou) showed internal variation, likely due to complex topography and microclimatic diversity across these transitional zones.
In contrast, the δ15N values of samples showed substantial regional variation, reflecting differences in nitrogen sources and agricultural practices. Among them, samples from Sichuan exhibited the highest δ15N values, followed by Chongqing and Hunan. Samples from Shandong, Hebei, Henan, and Guizhou showed no significant differences in δ15N, while Guangxi samples displayed the lowest values. Generally, synthetic fertilizers produce δ15N values approaching 0‰ or negative, whereas organic amendments tend to yield positive values due to microbial fractionation during mineralization processes. Samples from Sichuan and Hunan exhibited significantly enriched δ15N values (approximately +7.70‰ and +3.39‰, respectively), suggesting the probable application of organic fertilizers. In contrast, samples from Guangxi and Guizhou showed depleted values (approximately −3.25‰ and −0.40‰), potentially indicating predominant use of chemical fertilizers. Additional factors influencing soil nitrogen dynamics include microbial processes such as nitrification and denitrification, which preferentially utilize 14N and consequently enrich the residual soil pool in 15N. These isotopic differences provide valuable insights for identifying agricultural practices and verifying production methods in Lonicera japonica cultivation.
Notably, while pairwise comparisons between individual provinces sharing similar geographical locations revealed no significant differences in δ15N, grouping adjacent provinces revealed distinct regional patterns. Significant differences (p < 0.01) in δ15N were observed when provinces were grouped into three major geographical areas: Guangxi and Guizhou; Hebei, Henan, and Shandong; and Hunan, Sichuan, and Chongqing. These results indicated that LJF δ13C and δ15N values exhibit regional variation, with δ15N differences being particularly pronounced and reflecting distinct geographical characteristics.
Hierarchical cluster analysis based on stable isotope ratio values
-
HCA of the samples was performed to distinguish the LJF samples from eight origins using stable isotope ratios. As illustrated in Supplementary Fig. S1a, HCA using δ13C revealed overlapping sample distributions across geographical regions, indicating indistinct clustering patterns. In contrast, HCA based on δ15N (Fig. 3a) demonstrated clear geographical segregation at a linkage distance of 4: the samples from Henan, Hebei, Shandong, and Guizhou provinces were grouped into one category, samples from Hunan and Chongqing provinces were grouped into another category, samples from Guangxi were grouped into a separate category, and samples from Sichuan were grouped into yet another category. Subsequent HCA based on δ13C and δ15N (Supplementary Fig. S1b) demonstrated that the clustering outcomes were analogous to those attained by using δ13C.
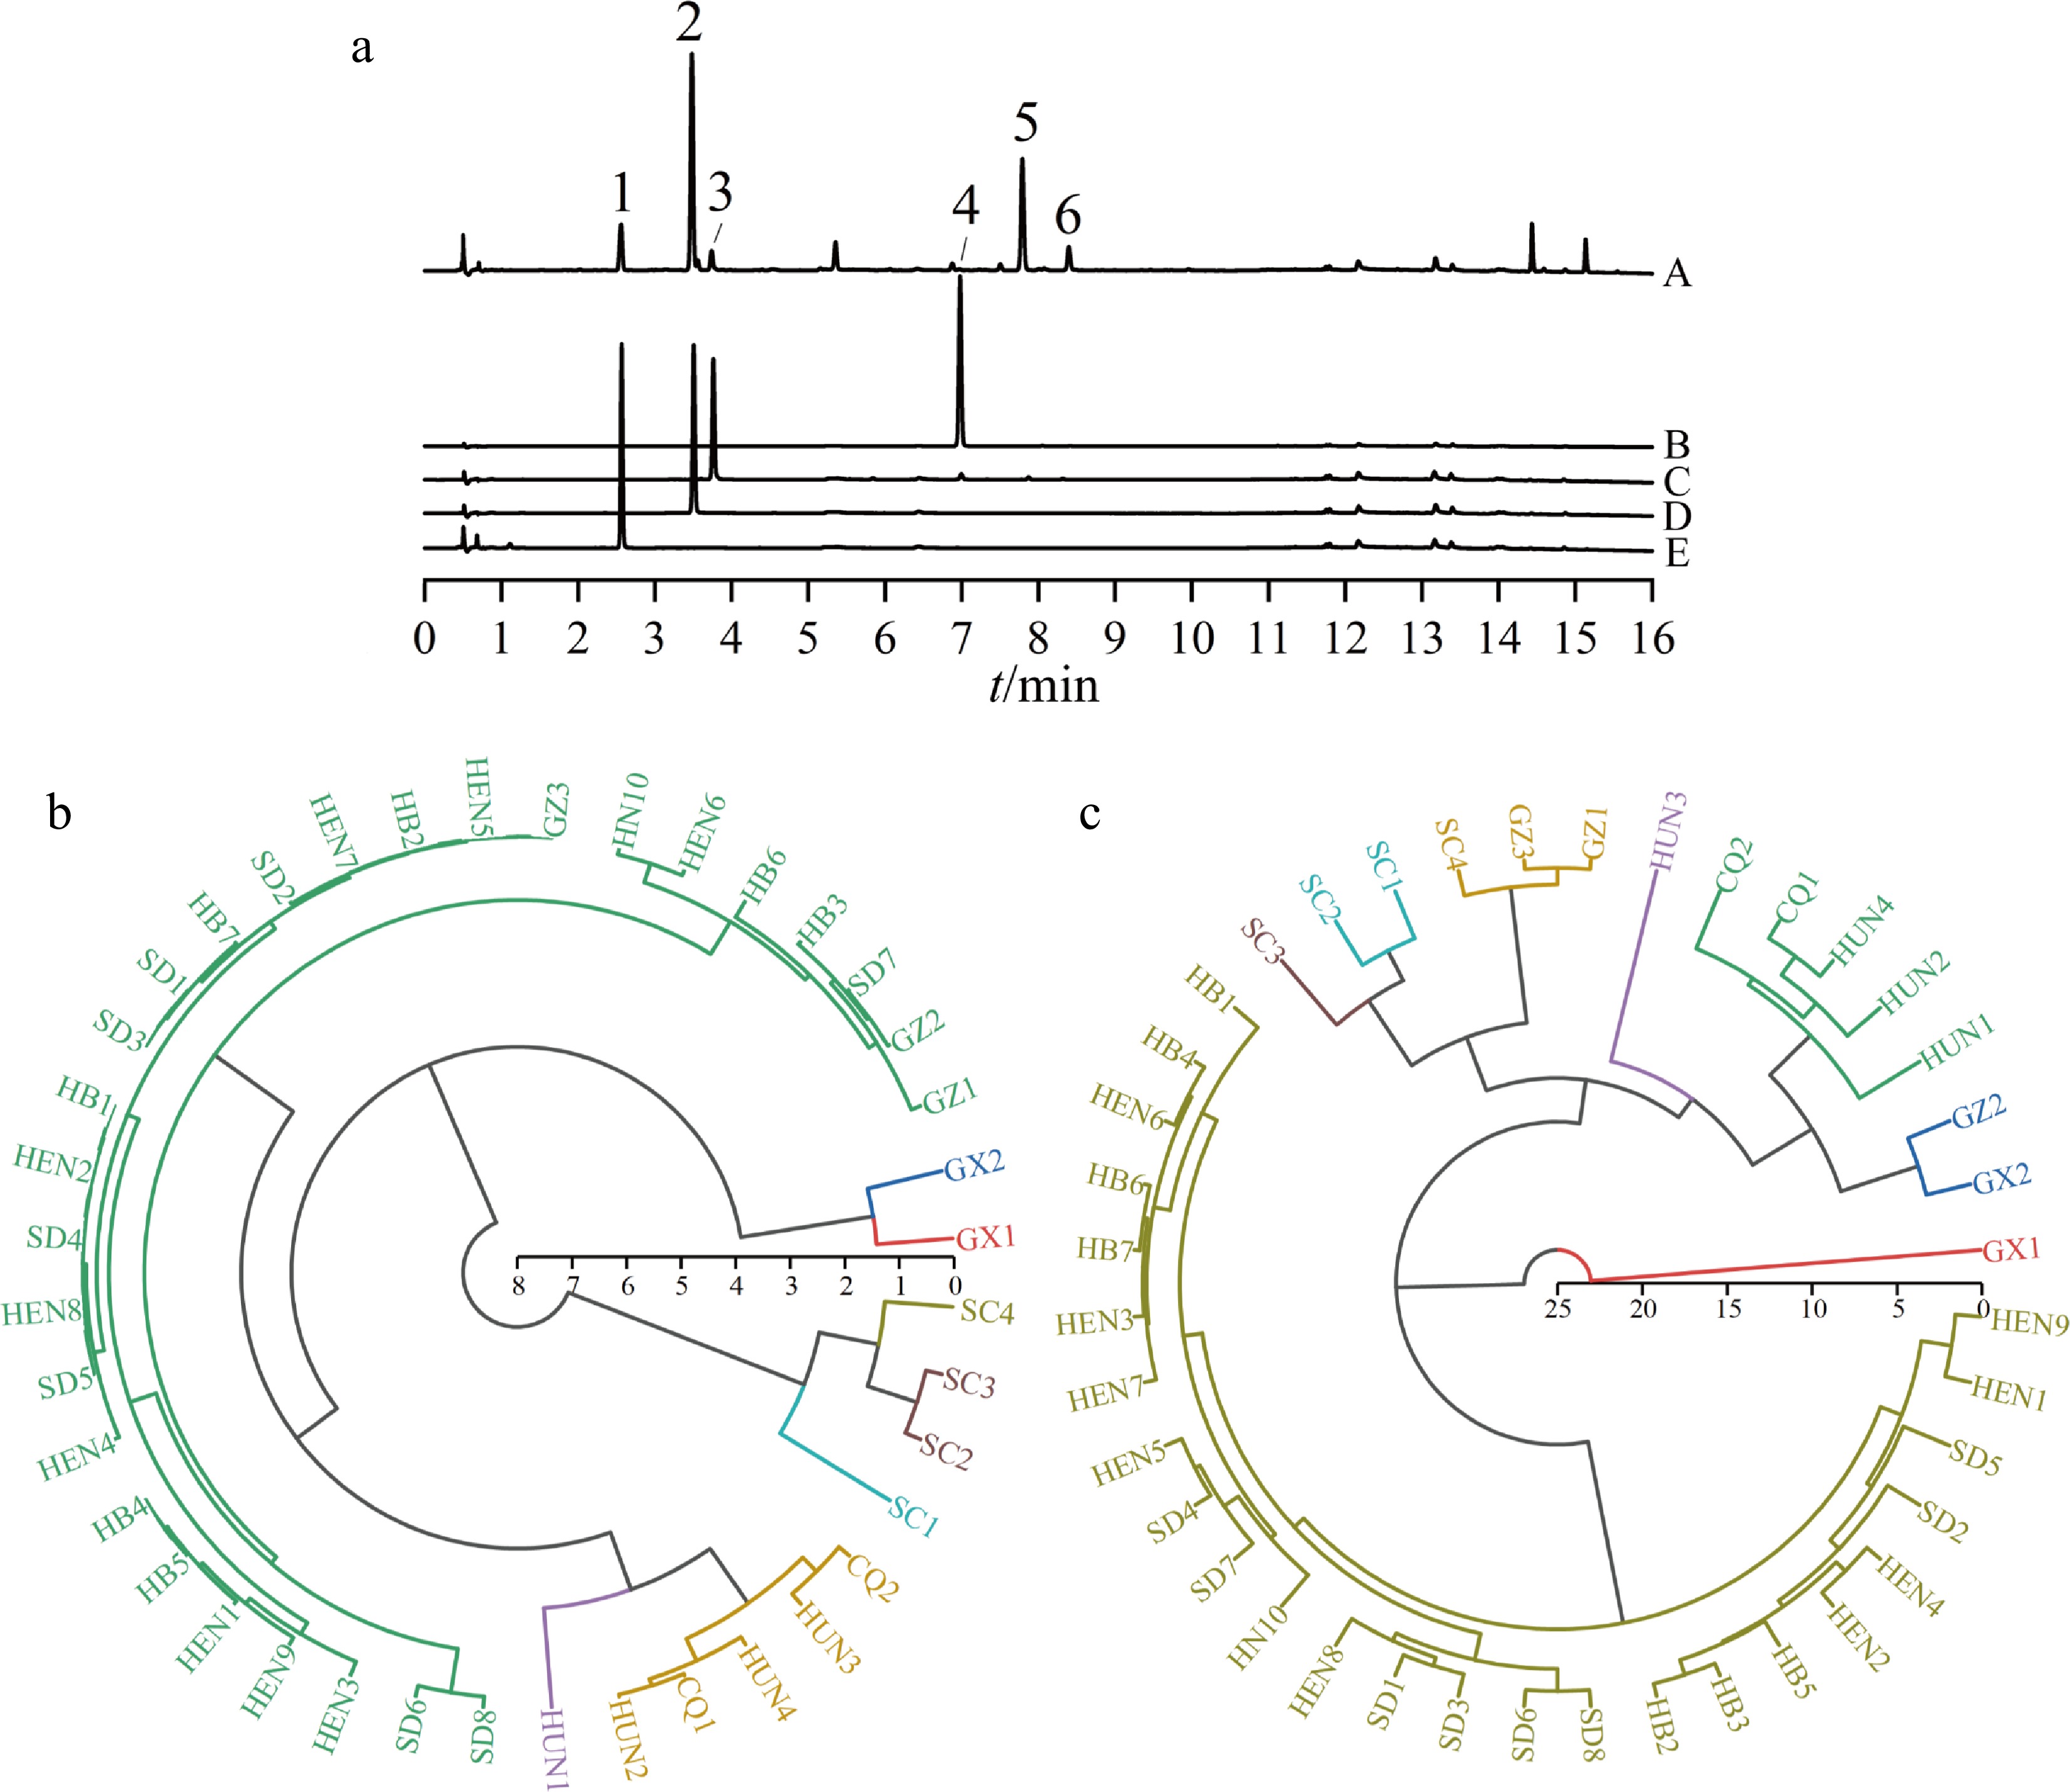
Figure 3.
UPLC/UV chromatograms of samples and hierarchical cluster analysis of LJF from different origins. (a) UPLC/UV chromatograms of samples (A) and standard samples (B–E). Peaks 1–6 correspond to the following compounds: neochlorogenic acid; chlorogenic acid; cryptochlorogenic acid; luteoloside; 4,5-dicaffeoylepi-quinic acid and 3,5-dicaffeoylepi-quinic acid. (b) Cluster tree diagram derived based on isotopic ratios of element N. (c) Cluster tree diagram derived based on the relative contents of quality control components.
Stable isotopes δ13C and δ15N serve as robust indicators for LJF origin identification and quality evaluation, reflecting environmental and geospatial influences on phytochemical composition. While these variables partially discriminate specific geographical regions (e.g., Sichuan vs. Guangxi), complete differentiation across all origins was unattainable. This limitation was likely attributable to the similar quality of samples in geographically proximate provinces; the differences in the δ13C and δ15N of the LJF were not obvious, such as the Hebei-Henan-Shandong macro-region exhibiting homogeneity due to spatial adjacency, as well as the southern and geographically proximate location and similar climatic conditions of Hunan and Chongqing. To augment origin discrimination accuracy, this study integrated an analysis of differential marker components, enhancing the evaluation system through marker components characterization.
Geographical discrimination and quality evaluation of LJF based on relative content of marker components
Identification and relative content determination of marker components
-
A total of six major marker components were identified (Fig. 3a). The relative percentages of these components were determined, and the results were presented (Table 3). Chlorogenic acid, cryptochlorogenic acid, neochlorogenic acid, and luteoloside were confirmed by comparison with reference standards, while 3,5-di-O-caffeoylquinic acid and 4,5-di-O-caffeoylquinic acid were identified through high-resolution mass spectrometry.
Table 3. Marker components and relative contents in samples from different origins.
Origin Relative percentage content (%) (mean ± SD) Chlorogenic acid Cryptochlorogenic acid Neochlorogenic acid Luteoloside 4,5-dicaffeoylepi-quinic acid 3,5-dicaffeoylepi-quinic acid CQ 29.33 ± 0.59 2.52 ± 0.28 6.60 ± 2.00 0.18 ± 0.00 18.94 ± 1.42 3.60 ± 0.08 GX 20.27 ± 9.12 0.78 ± 0.00 1.72 ± 1.63 0.15 ± 0.10 28.12 ± 6.14 2.54 ± 0.31 GZ 31.21 ± 3.34 1.43 ± 0.16 1.41 ± 1.50 0.09 ± 0.04 14.28 ± 7.16 3.70 ± 0.95 HB 18.51 ± 2.14 0.69 ± 0.07 0.60 ± 0.32 0.85 ± 0.09 11.24 ± 0.91 1.88 ± 0.39 HEN 19.83 ± 2.48 0.66 ± 0.14 0.50 ± 0.06 0.87 ± 0.18 11.47 ± 2.05 2.19 ± 0.52 HUN 27.76 ± 4.00 2.51 ± 0.69 6.00 ± 3.42 0.22 ± 0.03 18.89 ± 2.55 5.47 ± 3.52 SD 20.54 ± 1.61 1.33 ± 0.06 0.46 ± 0.02 0.79 ± 0.10 10.11 ± 1.40 2.35 ± 0.81 SC 36.90 ± 3.51 1.78 ± 0.74 1.37 ± 0.69 0.19 ± 0.03 15.02 ± 3.12 5.23 ± 2.86 F 22.51 22.65 14.88 45.05 14.44 4.20 P < 0.0001 < 0.0001 < 0.0001 < 0.001 < 0.001 0.0022 CQ: Chongqing, GX: Guangxi, GZ: Guizhou, HB: Hebei, HEN: Henan, HUN: Hunan, SD: Shandong, SC: Sichuan. As structural isomers sharing identical molecular weight, Peak 5 and Peak 6 (Fig. 3a) exhibited [M-H]− ions at m/z 515.1215 in negative ion mode, matching well with the theoretical value of 515.1190 for both isomers (mass error < 5 ppm). Further examination of the secondary ion fragments revealed that both peaks exhibited primary fragment ions at m/z 353.0852, corresponding to mono-caffeoylquinic acid anions [M-C9H6O3-H]− formed through the loss of a caffeoyl moiety (dehydrocaffeic acid) from the molecular ion. Subsequent dehydration of this intermediate yielded m/z 335.0748 ([M-C9H6O3-H2O-H]−), while further cleavage generated quinic acid ([QA-H]−, m/z 191.0553) through complete caffeoyl loss (162 Da) and caffeic acid ([Caf-H]−, m/z 179.0348). The fragment at m/z 173.0448 originated from dehydrated, ring-opened mono-caffeoylquinic acid intermediates. Notably, 4,5-di-O-caffeoylquinic acid's vicinal cis-diol configuration on the quinic acid core facilitated concerted dehydration and ring-opening, preferentially forming stable ions like m/z 335.0748 (C16H15O8−). Consequently, its fragmentation pathway to m/z 191.0553 was less pronounced compared to 3,5-di-O-caffeoylquinic acid, with higher relative abundances of m/z 335.0748, 179.0348, and 173.0448. Under identical mass spectrometric conditions, Peak 5 exhibited weaker signal intensity at m/z 191.0553 but stronger signals at m/z 335.0748, 179.0348, and 173.0448 compared to Peak 6, which is fully consistent with the predicted fragmentation pattern. Chromatographic behavior further supported the identification: The 3,5-di-O-caffeoylquinic acid isomer demonstrates superior molecular symmetry with more evenly distributed hydrophobic moieties, whereas in 4,5-di-O-caffeoylquinic acid, the adjacent caffeoyl groups (one positioned proximate to the carboxyl function) confer greater molecular polarity. Thus, 4,5-di-O-caffeoylquinic acid eluted earlier than 3,5-di-O-caffeoylquinic acid on the C18 column, consistent with their structural differences in steric hindrance and hydrophobicity. In conclusion, Peak 5 was conclusively identified as 4,5-di-O-caffeoylquinic acid and Peak 6 as 3,5-di-O-caffeoylquinic acid.
Geographical variation analysis based on relative content of marker components
-
The analytical results demonstrated substantial compositional variation among LJF samples from different geographical origins, with chlorogenic acid content ranging from 13.82% to 40.01%, cryptochlorogenic acid from 0.47% to 3.16%, neochlorogenic acid from 0.38% to 8.40%, luteoloside from 0.04% to 1.26%, 3,5-di-O-caffeoylquinic acid from 7.70% to 32.46%, and 4,5-di-O-caffeoylquinic acid from 1.40% to 10.71%.
Significant differences were observed in the relative contents of marker components among different geographical origins (p < 0.05). The Sichuan samples showed the highest relative content of chlorogenic acid, while Hunan and Chongqing samples exhibited significantly higher levels of cryptochlorogenic acid and neochlorogenic acid. Hebei and Henan samples demonstrated similar quality control component profiles. The highest luteoloside content was found in Hebei, Henan, and Shandong samples, though these samples contained relatively lower levels of 3,5-di-O-caffeoylquinic acid and 4,5-di-O-caffeoylquinic acid. These results indicated that the relative content of quality control components serves as an important indicator for distinguishing LJF samples from different geographical origins.
Hierarchical cluster analysis based on relative content of quality control components
-
Hierarchical cluster analysis was performed using the relative contents of quality control components as variables to evaluate the classification of LJF samples by geographical origin (Fig. 3c). At a linkage distance of ten, the samples were grouped into three main clusters: samples from Hebei, Henan and Shandong formed one cluster; samples from Sichuan, Chongqing, Guizhou, Hunan, and one sample from Guangxi (GX2) formed another cluster; while the remaining Guangxi sample (GX1) clustered separately, indicating significant quality variation between the Guangxi samples. The disparities between the Guangxi (GX) samples may be attributed to the thermal lability of phenolic acid compounds such as chlorogenic acid and neochlorogenic acid. The markedly lower contents of chlorogenic acid and neochlorogenic acid in GX1 compared to GX2, suggest that GX1 underwent processing at higher temperatures and/or for a longer duration, resulting in substantial degradation of these constituents under prolonged thermal exposure. When the linkage distance was reduced to eight, further differentiation was observed: Sichuan and Guizhou samples grouped together, Chongqing and Hunan samples formed a subgroup, while one Guizhou sample (GZ2) showed relatively greater divergence. These results demonstrated distinct differences in marker component profiles among samples from different regions.
Principal component analysis based on relative content of marker components
-
PCA was performed using SIMCA software to analyze the marker components of LJF from different geographical origins. The variance contribution rates of principal component 1 (PC1) and principal component 2 (PC2) were 60.8% and 14.3%, respectively, with a cumulative variance contribution rate of 75.1%, indicating that these components effectively captured the primary chemical variation among samples. The score plot (Fig. 4a) revealed distinct clustering patterns: samples from Hebei, Henan, and Shandong provinces formed a tightly grouped cluster that was clearly separated from other regions. In contrast, samples from Sichuan and Guizhou showed overlapping distribution with greater dispersion, while samples from Hunan and Chongqing occupied adjacent positions. The Guangxi samples appeared as isolated outliers, located far from other groups, consistent with the cluster analysis results. Based on the marked differentiation of Hebei, Henan, and Shandong samples from other regions, these were combined as a 'Northern Geographical Area' group (NGA) for comparative analysis against the remaining five regions. OPLS-DA was subsequently employed to identify the key marker components responsible for geographical discrimination.
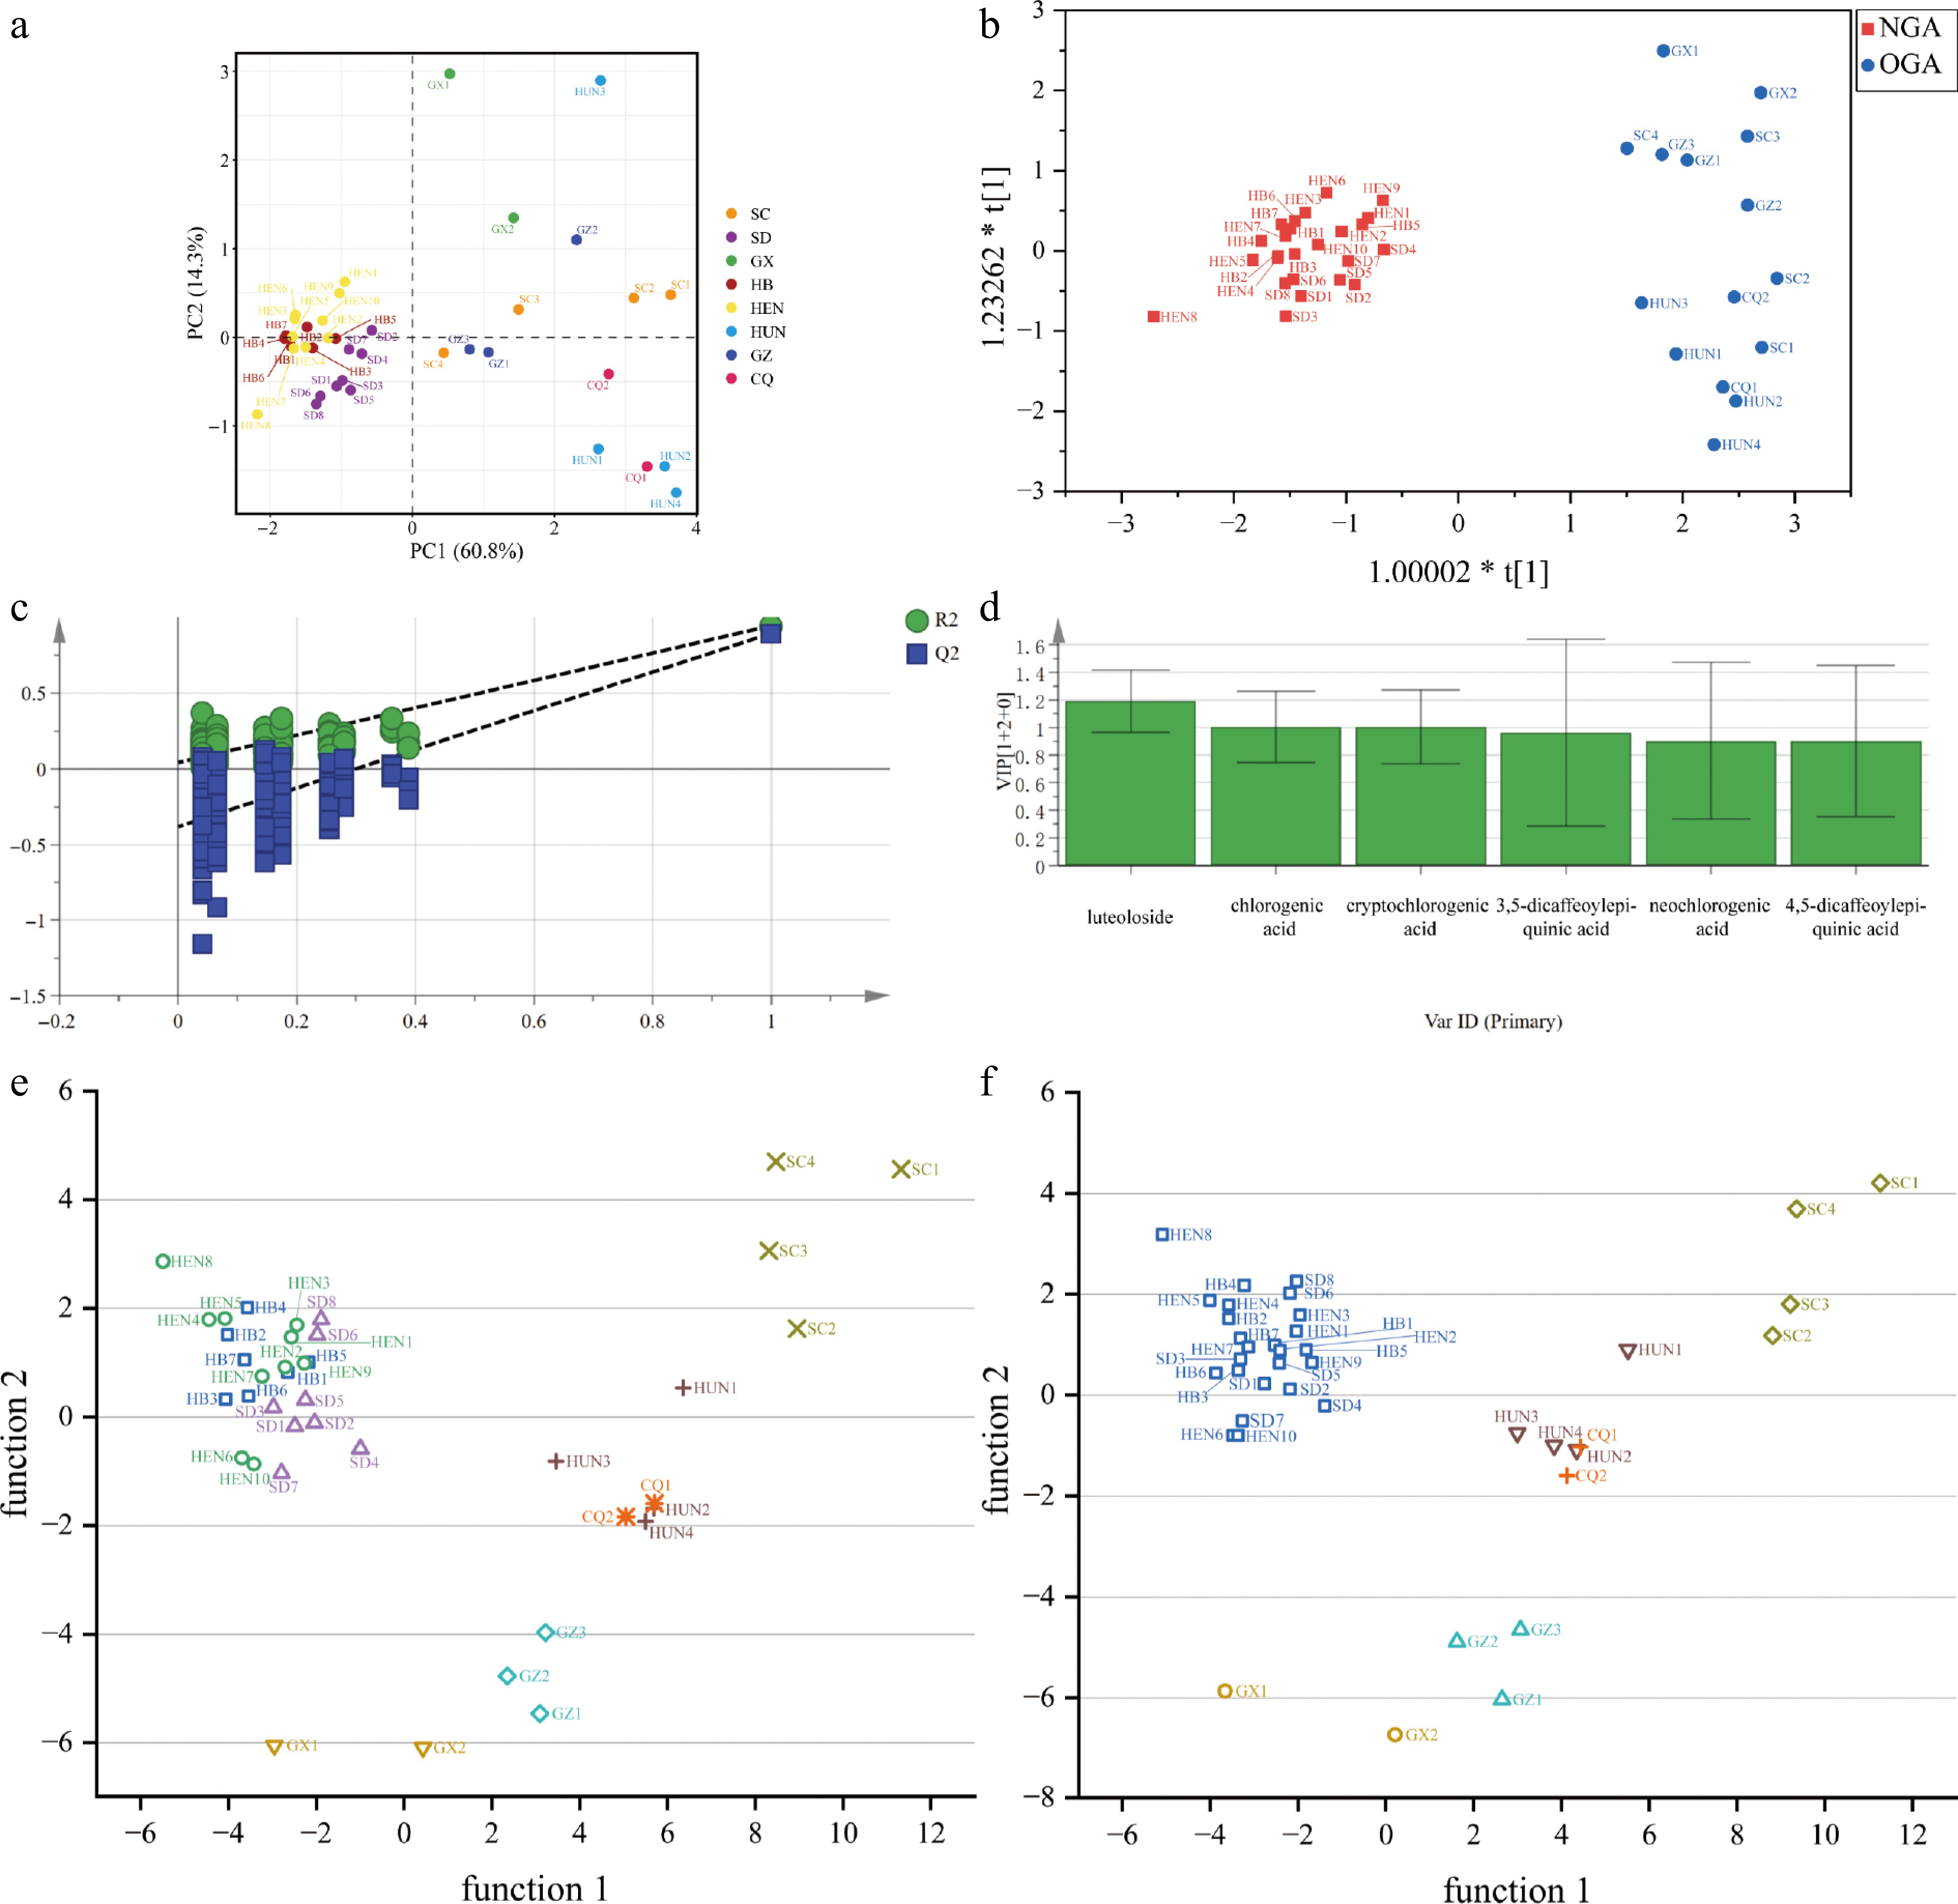
Figure 4.
Principal component analysis, orthogonal partial least squares, discriminant analysis, and discriminant analysis scatter plot of LJF from different origins. (a) PCA score plot of LJF from different origins. (b) OPLS-DA score plot of LJF from the 'Northern Geographical Area' group (NGA) and 'Other Geographical Area' (OGA); (c) Model verification diagram of 200 permutation tests. (d) VIP value. (e) Original discriminant analysis scatter plot. (f) Optimized discriminant analysis scatter plot.
Orthogonal partial least squares-discriminant analysis based on relative content of marker components
-
For the significant overlap in the chemical and isotopic profiles of these samples, as seen in Fig. 3, and their shared environmental background, samples from Hebei, Henan and Shandong were combined as the 'Northern Geographical Area' group (NGA), while samples from the other five origins were grouped as 'Other Geographical Area' (OGA). OPLS-DA was performed using SIMCA software to analyze the relative contents of marker components between these two groups. The model demonstrated excellent performance with cumulative explanation parameters: R2X and R2Y of 0.826 and 0.944, respectively, and a predictive ability parameter (Q2) of 0.893, all exceeding the 0.5 threshold, indicating a stable and reliable model with good predictive capability. The OPLS-DA model was validated through 200 permutation tests, demonstrating a Y-intercept below 0.3 for the R2 regression line and a negative Y-intercept for the Q2 regression line, with all permuted R2 and Q2 values lower than the original values (Fig. 4c). These results confirmed the absence of overfitting and support the model's validity for further data analysis. The score plots (Fig. 4b) revealed distinct separation between the two groups: Northern Geographical Area samples showed tight clustering, while Other Geographical Area samples were more dispersed, and there was no overlap between groups. Variable Importance in Projection (VIP) scores, which indicate each component's contribution to group discrimination, were used to identify key differential compounds. Using VIP > 1 as the threshold (Fig. 4d), luteoloside, chlorogenic acid, and cryptochlorogenic acid were identified as the critical markers responsible for the quality differences and group separation among samples from different geographical origins.
Linear discriminant analysis
Establishment of origin discrimination model
-
Based on the above analyses, the effects of difference indicators such as stable isotope ratios and relative contents of marker components on the effective discrimination of LJF origins were further assessed. LDA was conducted based on the δ15N and the contents of luteoloside, chlorogenic acid, and cryptochlorogenic acid. The discriminant function was obtained to perform discriminant analysis on the origins of the samples. The classification results indicated that four samples from Hebei were misclassified as Henan, eight samples from Henan were misclassified as Hebei, and one sample from Chongqing was misclassified as Hunan. The overall accuracy rate was 82.5%, indicating a relatively low discriminant accuracy rate.
Pursuant to the findings of the model discrimination results, in conjunction with the analysis of discrepancies in the stable isotopes and the relative content of marker components, the origin discrimination model was optimized by consolidating the samples from Hebei, Henan, and Shandong into a single, extensive geographical area, 'Northern Geographical Area' group (NGA). The improved discrimination model demonstrates an overall discrimination accuracy of up to 97.5%. Cross-validation analysis was employed to assess the accuracy of origin discrimination for the samples. The overall correct rate of cross-validation was 82.5%, indicating reliable predictive discrimination performance.
Validation of discrimination model applicability
-
The optimized discrimination model's applicability is validated by conducting blind independent tests on three newly purchased LJF samples. All of the samples were correctly classified, confirming that the model is suitable for discriminating among the geographical regions of JFL. Simultaneously, discriminant analysis plots based on function 1 and function 2 were drawn Fig. 4e, f, which allowed the differences to be observed more clearly. The samples were accurately divided, and the scatter plots in each category were relatively concentrated.
To further substantiate the model, prediction set validation and leave-one-out cross-validation were implemented. In the prediction set validation, two-thirds of the samples (n = 24) were randomly selected from the entire sample set as training samples to construct the model, while the remaining (n = 12) were designated as the prediction sample. Samples from Guangxi and Chongqing were excluded due to their insufficient sample sizes. In the leave-one-out cross-validation method, for each iteration, a single sample was excluded from the full set of 40 samples to serve as the test set. A discriminant model was constructed using the remaining 39 samples, and the geographical origin of the excluded specimen was predicted. This process was iteratively repeated until all specimens had been evaluated[29]. The validation results for the prediction set validation and leave-one-out cross-validation were 100% and 97.4%, respectively, both meeting the requirements for qualitative discrimination. The number and percentage of the observations that were correctly classified are shown in Table 4. This finding suggested that linear discriminant analysis can be employed to effectively distinguish the samples from Hebei, Henan, and Shandong provinces from other geographical origins.
Table 4. Discriminant analysis results of Lonicerae japonicae flos from different origins.
Classification Origin No. of samples Correctly predicted Accuracy (%) Training set NGA 25 25 100 CQ 2 1 50 GX 2 2 100 GZ 3 3 100 HUN 4 4 100 SC 4 4 100 Independent test set NGA 2 2 100 HUN 1 1 100 Prediction set validation NGA 10 10 100 GZ 1 1 100 SC 1 1 100 Leave-one-out
cross-validationNGA 25 25 100 CQ 2 1 50 GX 2 2 100 GZ 3 3 100 HUN 4 4 100 SC 4 4 100 NGA: Northern Geographical Area, CQ: Chongqing, GX: Guangxi, GZ: Guizhou, HUN: Hunan, SC: Sichuan. -
Environmental variation is a primary contributing factor influencing the quality heterogeneity of medicinal materials. Bioactive constituents in medicinal plants are primarily secondary metabolites, whose composition and abundance dynamically respond to environmental variations. This regulatory mechanism directly dictates phytochemical profiles governing medicinal quality. These variations in secondary metabolite content are ultimately manifested in the morphological characteristics of the plants. Therefore, this study integrates and screens data on the morphological traits, environmental parameters, and intrinsic phytochemical markers to establish a robust framework for quality evaluation and geographical origin discrimination of LJF.
Traditionally high-quality, LJF is characterized by plump buds, structural integrity (i.e., being uniform and unbroken), absence of pedicels or leaves, and freedom from blackheads or dark streaks[30]. Consistent with these established quality markers, morphological and sensory analysis confirmed that LJF samples originating from Hebei, Henan, and Shandong provinces exhibited plump buds, intense aroma, and uniform structural integrity, indicating comparatively higher quality traits. However, conventional trait identification relies on experiential macroscopic observation, which is inherently subjective and difficult to quantify. Artificial intelligence (AI) tools, such as Doubao AI, demonstrate the capability for preliminary morphological feature extraction and species discrimination. Beyond the specific tool used here, other AI visual recognition programs (Supplementary File 1 CNN Binary Image Classifier) under development also show significant application potential, while it requires a large amount of annotated data for optimization. Nevertheless, both conventional and AI-assisted morphological approaches share fundamental limitations for comprehensive quality assessment. Critically, key discriminative dimensions, including microscopic features, remain inaccessible through standard image acquisition protocols; moreover, model integrity is compromised by the disconnection between sensory parameters (e.g., odor, texture, color perception) and quantifiable physicochemical indicators, thereby hindering the development of holistic assessment models. Consequently, advancing the evaluation and authentication of Traditional Chinese Medicines necessitates moving beyond reliance on 'single-mode optimization'. The development of robust, multi-dimensional evaluation systems through the integration of diverse complementary indicators is imperative.
For environmental factor screening, stable isotopes of carbon, hydrogen, oxygen, and nitrogen are commonly used, as these elements are widely present in plant and animal organisms. Under the influence of various external environmental factors, these elements undergo varying degrees of natural fractionation, resulting in minor differences that enable the differentiation of organismal origins[31]. Although hydrogen and oxygen isotope ratios generally exhibit higher sensitivity to geographical and climatic variables (precipitation sources, temperature, and altitude) than carbon and nitrogen isotopes, this study employs carbon and nitrogen isotopes as the primary analytical indicators. This choice is based on their direct relevance to the core objective linking LJF identity to specific agricultural management practices and local growing conditions. Specifically, δ15N serves as an effective tracer of soil nitrogen dynamics and fertilization regimes (e.g., organic vs. conventional fertilization), which vary significantly across regions and farming practices; δ13C represents a robust proxy for water-use efficiency and photosynthetic pathways, reflecting water stress and photosynthetic performance under local cultivation conditions. Furthermore, hydrogen and oxygen exhibit significant susceptibility to factors such as precipitation, soil moisture evaporation and condensation, and plant transpiration[32], making their signals more challenging to interpret in this context. Additionally, the analytical process for hydrogen and oxygen is prone to interference, potentially compromising measurement accuracy. Therefore, this study focused specifically on carbon and nitrogen stable isotope analysis.
The results demonstrated minimal δ13C variation but significant δ15N heterogeneity across samples. This divergence is attributable to their distinct regulatory mechanisms. The homogeneity in δ13C values can be primarily attributed to the conserved C3 photosynthetic pathway in LJF. Furthermore, the lack of variation suggests an absence of significantly different water stress levels across growing origins, during growth, given that water availability is a major environmental driver of δ13C fractionation in conspecific plants[33]. In contrast, δ15N in plants is more strongly influenced by external environmental and ecosystem-level processes, leading to more pronounced geographical differences. This is evidenced by the clear regional clustering of δ15N values: Samples from Guangxi and Guizhou, which are geographically adjacent regions, have negative δ15N values, while samples from Hunan, Sichuan, and Chongqing have higher δ15N values. Samples from Hebei, Henan, and Shandong demonstrated similar δ15N values. Combined with sample morphological characteristics, these isotopic differences provide a powerful means to distinguish samples from different geographical origins.
According to the Chinese Pharmacopoeia (2020 edition), phenolic acids and luteoloside are the principal components for determining the content of LJF. The calculation of chlorogenic acid on the dried basis, with a minimum requirement of 1.5%. The calculation of phenolic acids, defined as the total of chlorogenic acid, 3,5-d-O-caffeoylquinic acid, and 4,5-d-O-caffeoylquinic acid, with a minimum requirement of 3.8%. The luteoloside should contain not less than 0.050%. The content of marker components is closely linked to the plant's secondary metabolism, which directly influences the morphological characteristics of LJF, including coloration, bud size, browning incidence, and length[34]. Therefore, quantifying these markers not only provides empirical support for correlating appearance traits with intrinsic quality but also provides a reference for the evaluation of their intrinsic quality.
While intra-provincial variation exists, the combination of stable isotopes and compositional markers provides a robust integrative signature capable of effective origin discrimination at a commercially and regulatory relevant scale. Nevertheless, distinguishing samples from Hebei, Henan, and Shandong remains challenging, possibly due to their similar geological structures, topographical patterns, and climatic conditions. Additionally, the sample sizes from non-traditional production areas such as Guangxi and Chongqing are relatively small. Consequently, although the model demonstrates high overall accuracy, predictive performance for the CQ and GX regions should be interpreted with caution. In response to the reviewer's valid concern regarding the initial validation, which used only three blind-test samples and underrepresented certain regions, an additional validation was performed using samples from Chongqing (S-CQ1, S-CQ2), Guangxi (S-GX), Guizhou (S-GZ), and Sichuan (S-CS). Based on their chemical markers, the model correctly identified the origin of all samples. This result further substantiates the model's robust identification capability across diverse geographic origins. Detailed results are presented in Supplementary Table S2.
Consequently, the origin identification model established in this study should be considered a preliminary framework. This model is based on a sample collection representing commercially available supplies from major genuine producing regions in China; utilization of an AI model was based on macroscopic morphology and environmental factors centered on carbon and nitrogen isotope ratios. This pioneering attempt demonstrates the feasibility of such an integrated approach. The methodology developed here can serve as a template for future studies. Future work will not only include the collection of commercially available samples but also field sampling of additional varieties of interest, followed by sample pretreatment according to pharmacopeial standards. On this basis, high-resolution microscopic images will be incorporated, and a more comprehensive and systematic approach will be implemented, including moisture content, ash content, acid-insoluble ash, other stable isotope ratios, and elemental analysis. This integrated system will enable more robust origin traceability and quality assessment of medicinal materials.
-
This study conducted a comprehensive analysis of quality variations in LJF across different geographical origins by integrating AI-assisted morphological characteristics, environmental factors, and intrinsic chemical composition. By combining traditional analytical approaches with modern artificial intelligence technology, a more efficient and objective strategy for quality assessment was established. Multivariate statistical analyses (PCA and OPLS-DA) identified δ15N isotopic ratio, luteoloside, chlorogenic acid, and cryptochlorogenic acid as the critical markers for the differentiation of LJF from various geographical origins. The developed discrimination model successfully distinguished samples from Hebei, Henan, and Shandong provinces from other production areas, providing a novel analytical framework for both quality control monitoring and authenticity research of traditional Chinese medicines.
This work was supported by the National Natural Science Foundation of China (Grant No. 82204852); National Traditional Chinese Medicine Inheritance and Innovation Team Program (Grant No. ZYYCXTD-C-202201); Guangzhou City Basic and Applied Research Topic (Grant No. 2023A04J2476); and Key Laboratory of Chinese Medicinal Resource from Lingnan (Grant No. ZZ-2025-219).
-
Doubao AI assisted only with image feature extraction and identification; it was not used for experimental design, data interpretation, or manuscript drafting. The authors accept full responsibility for AI output accuracy and research integrity.
-
The authors confirm their contributions to the paper as follows: study conception and design: Chen Y, Jin H, Gao L, Boriigidai A; data collection: Zeng H, Huang Y; analysis and interpretation of results: Sun X, Zhang H; draft manuscript preparation: Zhuo J, Ren J. All authors reviewed the results and approved the final version of the manuscript.
-
All data generated or analyzed during this study are included in this published article and its supplementary information files.
-
The authors declare that they have no conflict of interest.
-
# Authors contributed equally: Jin Zhuo, Jun Ren
- Supplementary Table S1 Morphological features of Lonicerae japonicae flos from different origins.
- Supplementary Table S2 Additional validation based on chemical markers.
- Supplementary Fig. S1 Hierarchical cluster analysis of Lonicerae japonicae flos from different origins.
- Supplementary File 1 CNN binary image classifier.
- Copyright: © 2026 by the author(s). Published by Maximum Academic Press, Fayetteville, GA. This article is an open access article distributed under Creative Commons Attribution License (CC BY 4.0), visit https://creativecommons.org/licenses/by/4.0/.
-
About this article
Cite this article
Zhuo J, Ren J, Zeng H, Boriigidai A, Zhang H, et al. 2026. Integrated chemometric approach combining morphology, stable isotopes, and quantitative markers for quality control and origin discrimination of Lonicerae japonicae flos. Medicinal Plant Biology 5: e005 doi: 10.48130/mpb-0025-0042 

Integrated chemometric approach combining morphology, stable isotopes, and quantitative markers for quality control and origin discrimination of Lonicerae japonicae flos
- Received: 28 July 2025
- Revised: 10 November 2025
- Accepted: 14 November 2025
- Published online: 26 February 2026
Abstract: Lonicerae japonicae flos (LJF) is a significant food and traditional Chinese medicine with diverse pharmacological effects and extensive prescription compatibility. However, systematic quality evaluation of LJF remains limited. Accurate identification of geographical origin is crucial for quality control and clinical efficacy. For the first time, this study integrates morphological quality assessment, environmental factors, and intrinsic quality characteristics by analyzing stable carbon (δ13C) and nitrogen (δ15N) isotope ratios alongside quantification of marker compounds to systematically evaluate LJF quality and discriminate its geographical origin. Stable isotope ratios (δ13C and δ15N) and relative contents of the marker compounds in LJF from eight geographical regions (n = 40) were determined. Multivariate statistical analysis revealed significant original differences. Hierarchical Cluster Analysis (HCA), Principal Component Analysis (PCA), and Orthogonal Partial Least Squares Discriminant Analysis (OPLS-DA) identified δ15N, luteoloside, chlorogenic acid, and cryptochlorogenic acid as key markers responsible for these geographical variations. Furthermore, a classification model for discriminating LJF geographical origin was developed using Linear Discriminant Analysis (LDA), and this model achieved 97.5% accuracy. This analysis elucidates the variations in stable isotopes and marker compounds, providing a valuable reference for the origin authentication, selection, and quality assessment of LJF.
-
Key words:
- Lonicerae japonicae flos /
- Origin discrimination /
- Chemometrics /
- Quality variation /
- Stable isotope /
- Marker compounds