


-
Integrated drip irrigation technology facilitates the precise, timely, and uniform delivery of water and nutrients directly to the crop's root zone, facilitating accurate control of fertilizer and irrigation water application. This method effectively mitigates issues associated with traditional flood irrigation practices such as nutrient leaching, groundwater nitrate pollution, and other environmental concerns[1,2]. However, the conventional drip irrigation fertilization interval in China is characterized by the prolonged duration and excessive use of irrigation fertilizers and elements. Consequently, it fails to meet the overall water and nutrient requirements essential for the optimal growth of tomatoes[3,4], which hinders their efficient and sustainable development. Conversely, irrigation in an excessively enclosed protected environment elevates soil moisture levels along with air humidity within facilities, which predisposes vegetables to diseases and impedes their growth and development. This ultimately leads to reduced production yields and decreases in quality[5].
Irrigation frequency is one of the most important factors affecting soil water and fertilizer utilization efficiency and crop yield[6]. It can improve soil microbial community structure and bacterial abundance by altering soil moisture and temperature[7,8]. Previous research has shown that the frequency of drip irrigation affects dry matter accumulation, malondialdehyde content, root growth, root vitality, plant yield, and fruit quality[9]. An appropriate drip irrigation frequency can increase tomato yield, and an inappropriate drip irrigation frequency can reduce tomato yield[10]. Under medium and low irrigation, tomato yield decreases slightly as the drip irrigation frequency increases. In sandy loam soil, tomato yield decreases as the drip irrigation frequency increases under low irrigation amounts[11]. The frequency of drip irrigation also affects the water use efficiency, yield, and quality of potato[12], corn[13], pepper[14], and cucumber[15] crops.
Drip irrigation can potentially affect soil bacterial communities by regulating the soil water content and nutrient levels[13,16]. The soil microbial community comprises various microorganisms and plays a key role in maintaining the normal function of the soil ecosystem and crop yields. Their activities can either have a positive or negative effect on plant growth[17,18]. Soil microorganisms directly affect plant growth through mutual (symbiotic) or pathogenic relationships with roots, as well as indirectly through free-living microorganisms (non-symbiotic) that can alter the plant nutrient supply[19]. Soil enzymes are primarily derived from the activities of soil microorganisms and play a critical role in the soil system. They catalyze biological and chemical reactions and promote the mineralization of soil organic phosphorus, the decomposition of soil organic matter, and nitrogen cycling[20,21]. Previous studies have demonstrated that beneficial microorganisms can enhance tomato root growth, improve the resistance of tomato to Verticillium wilt, and enhance yield and fruit quality[22,23].
Tomato (Solanum lycopersicum L.) is an annual or perennial herb and one of the main vegetable crops cultivated worldwide. Long-season tomato cultivation has a long production cycle, high yield, and a large demand for nutrients during the growing period. To maximize income, farmers often use a large amount of water and fertilizer for cultivation and management. However, this practice not only reduces fertilizer utilization efficiency but also disrupts the structure of soil microbial communities in later periods, which leads to the premature aging of plants and decreases yield and quality, and also hinders the sustainable development of facility vegetables. Most recent studies on tomato drip irrigation frequency have focused on short-season and multi-cropping systems; however, few studies have examined the use of precision irrigation systems for long-season overwintering tomato cultivation. The aim of this study was to investigate the effects of different irrigation frequencies on soil environmental factors, bacterial and fungal community composition, as well as growth and yield in the root zone of long-season overwintering tomatoes.
-
The experiment was conducted at the solar greenhouse of the Horticulture Experiment Station of Shandong Agricultural University (36°05' N, 117°03' E) from September 2020 to July 2021. The region has a continental semi-humid monsoon climate with an average annual precipitation of 803.7 mm. The soil characteristics were as follows: pH = 6.64, EC = 164.5 μS·cm−1, available nitrogen 97.77 mg·kg−1, available phosphorus 3.29 mg·kg−1, and available potassium 59.74 mg·kg−1. Drip irrigation was utilized, and nutrients and water were supplied through an integrated water and fertilizer solution system. The high border double row planting mode was adopted with a border-bottom width of 0.6 m, top width of 0.5 m, height of 0.25 m, large row spacing of 1.0 m, small row spacing of 0.4 m, and plant spacing of 0.47 m, 2,027 plants of tomato every 667 m2.
Grafted tomato (Solanum lycopersicum L.) seedlings of the scion variety 'Alishi T147' and rootstock variety 'Zhejiang anvil' were used. On October 6th, 2020, the tomato seedlings were planted when they had five true leaves and one heart. On November 13th, 2020, different fertilization treatments were carried out. The control group received drip irrigation with a balanced application of fertilizer containing 20% N, 20% P2O5, and 20% K2O, and high potassium fertilizer containing 17% N, 8% P2O5, and 30% K2O once every 12 d (CK1). The treatment groups all received drip irrigation with the tomato nutrient solution from Yamazaki (1978)[24] at different frequencies: once every 12 d (CK2), 6 d (T1), 4 d (T2), and 2 d (T3); the amount of fertilizer and water applied across the 12-d experimental period was the same. The experiment was conducted with each treatment being replicated four times in a randomized arrangement, and the size of each treatment plot was 50.4 m2. The treatments were stopped one month before the seedlings were extracted.
To ensure that the same amount of irrigation water was applied throughout the growth period of the control and all treatments, irrigation, and fertilization were applied consistently based on the plant growth status and nutrient requirements, weather, and soil moisture, and the amount of nutrients applied in the different drip irrigation frequency treatments throughout the growth period. In the early stage (from November 13th, 2020 to January 29th, 2021), half of the standard dose of the tomato nutrient solution of Yamazaki (1978)[24] (+ corresponding doses of trace elements in the general formula) was applied, 0.5 L (from November 13th to November 24th, 2020) - 1.0 L (from November 25th to December 18th, 2020) - 0.5 L (from December 19th, 2020, to January 29th, 2021) of water was applied every plant every day, 3/4 of the standard dose of the formula was applied in the middle stage (from February 1st, 2021 to April 21st, 2021), 0.5 L (from February 1st, 2021 to March 15th, 2021) - 1.0 L (from March 17th, 2021 to April 21st, 2021) of water was applied to every plant every day, and half of the standard dose of the formula was applied in the later stage (from April 22nd, 2021 to June 19th, 2021), 1.5 L of water was applied to every plant daily. The drip irrigation system is typically conducted on the sunny days, whereas it was occasionally stopped on the cloudy days. The amount of conventional drip irrigation water-soluble fertilizer applied was set according to the traditional fertilization regimes used in current production (balanced fertilizer was applied at the early stage, and high potassium fertilizer was applied at the later stage). Balanced fertilizer (11.33 kg) was applied every 667 m2 every 12 d from November 13th, 2020, to December 18th, 2020; 5.66 kg of balanced fertilizer + 5.66 kg of high potassium fertilizer was applied every 667 m2 every 12 d from December 19th, 2020, to January 30th, 2021; and 11.33 kg of high potassium fertilizer was applied every 667 m2 every 12 d from February 1st, 2021, to March 15th, 2021. From March 17th, 2021, to April 21st, 2021, 11.33 kg of balanced fertilizer + 11.33 kg of high-potassium fertilizer + 5.66 kg of calcium nitrate was applied every 667 m2 every 12 d. From April 22nd, 2021, to June 19th, 2021, 16.99 kg of balanced fertilizer + 16.99 kg of high potassium fertilizer was applied every 667 m2 every 12 d.
Measurement indices
Plant height and stem diameter
-
After planting, 20 tomato seedlings with similar growth trends were selected for each treatment. The plant height and stem diameter were measured at 30, 60, 90, 180, and 270 d after planting.
Chlorophyll content and photosynthetic parameters
-
Chlorophyll content and photosynthetic parameters were measured at the full fruiting stage.
The method of Sartory and Grobbelaar[25] was slightly modified in this study. Specifically, the third functional leaf located under the growth point of the plant was cut to obtain 0.2 g, which was then placed into a centrifuge tube with 25 mL of 95% ethanol. The tube was kept away from light for 48 h until the leaf turned white. Subsequently, the OD value was measured at 665, 649, and 470 nm using a UV-2600 spectrophotometer and the chlorophyll content was calculated according to a specific formula. This process was repeated three times and an average value was obtained for subsequent analysis.
The photosynthetic parameters were measured using the following method: a third flattened functional leaf under the plant growth point with consistent growth and no pests or diseases was selected in each treatment. The CIRAS-3 portable photosynthetic apparatus was used to measure the net photosynthetic rate (Pn), transpiration rate (Tr), stomatal conductance (Gs), and intercellular carbon dioxide concentration (Ci) from 9:00 to 11:30 in the morning on a sunny day. This process was repeated five times, and the average value was taken. The built-in light source was used for the measurement, with a luminous flux density of 1,200 μmol·m−2·s−1. The temperature in the greenhouse was maintained at 27 (±1) °C, and the air CO2 concentration was kept at 390 (±10) μmol·mol−1.
Root system
-
At 90 d after planting, tomato plants with consistent growth vigor and free of pests and diseases were selected for each treatment, and the root activity was measured using the TTC method[26]. Root length (RL), root surface area (RSA), and root volume (RV) were measured using a MICROTEK root analysis system (Shanghai Zhongjing Co. Ltd., China). The data were analyzed using LD-WinRHIZO software.
Soil enzyme activities
-
At 90 d after planting, six replicates were randomly selected from a total of six plants. For each plant, five soil samples were collected at a distance of 5−10 cm from the root collar in all directions and at depths ranging from 0−20 cm, resulting in a cumulative total of 30 soil samples. Soil samples were collected and air-dried naturally before being sieved through a 60-mesh sieve. The soil enzyme activities of urease (UE), catalase (CAT), alkaline phosphatase (ALP), and saccharase (SC) were determined using the indophenol-blue colorimetry method, the potassium permanganate titration method, the phosphate sodium method, and the 3,5-dimethylsalicylic acid method, respectively[27]. To ensure the reliability of the experimental data, six independent measurements of the above indicators were taken for each sample.
Soil moisture content, yield, dry matter, and water use efficiency (WUE)
-
The soil moisture content was measured at 60−270 d after planting and recorded using the TM3 soil moisture and temperature sensor produced by TOMST Company. Tomato fruits were harvested in each plot to estimate the tomato yield (kg·667 m−2) of each treatment. The root and plant samples were then deactivated in an oven at 105 °C for 30 min and dried at 75 °C for 36 h, after which the dry matter weight was measured.
$ \rm {WUE\;(kg\cdot m}^{{-3}} )=\dfrac{\rm Yield\;(kg)}{\rm Total\;irrigation\;volume\;during\;the\;growth\;period\;(m^3)} $ Soil microorganism DNA extraction and sequencing
-
The sampling sites were as mentioned above. Soil sample DNA was extracted using the EZNATM Soil DNA Kit (Omega, USA). The eluted DNA samples were analyzed by 1% (m·v−1) agarose gel electrophoresis and DNA concentrations were determined using a NanoDrop® 2000 UV-Vis spectrophotometer (Thermo Fisher Scientific, USA). The V3−V4 regions of the bacterial 16S rRNA gene were amplified using the primers 338F (5'-ACTCCTACGGGAGGCAGCAG-3') and 806R (5'-GGACTACHVGGGTWTCTAAT-3'), and the ITS regions of the fungal ITS1 rRNA gene were amplified using the primers ITS1F (5'-CTTGGTCATTTAGAGGAAGTAA-3') and ITS2R (5'-GCTGCGTTCTTCATCGATGC-3'). PCR amplification was performed with an initial denaturation step at 95 °C for 3 min, followed by either 27 cycles for the bacterial V3−V4 region or 37 cycles for the fungal ITS region with denaturation at 95 °C for 30 s, annealing at 55 °C for 30 s, extension at 72 °C for 45 s, and final extension at 72 °C for 10 min. PCR amplicons were detected by electrophoresis on a 2% (w·v−1) gel, and the Axygen® AxyPrep DNA Gel Extraction Kit (Axygen Biosciences, USA) was used to recover the target fragments. The purified amplicons were sequenced on an Illumina MiSeq platform (Shanghai Majorbio Bio-Pharm Technology Company, China).
Analysis of the sequencing data
-
The high-throughput sequence data were initially processed using USEARCH (v10.0.240,
www.drive5.com ) to align the overlapping regions with complementary base pairs. Subsequently, the barcode and primer sequences were excised, and this was followed by quality control, filtering, and chimera removal. Operational taxonomic units (OTUs) were separated at a similarity threshold of 97% using Unoise3. The tags were based on bacterial 16S sequences from the SILVA database (Release 138) and fungal ITS sequences from the UNITE database (Release 8.0). Taxa were classified using the RDP classifier (version 2.24) with a minimum reliability estimate of 80%.Statistical analysis
-
The bioinformatics data were analyzed using the Majorbio Cloud Platform (
www.majorbio.com ) provided by Shanghai Majorbio Biopharm Technology Co., Ltd. The data were processed and visualized in a Venn diagram using R (version 3.3.1). α-diversity analysis was conducted using Mothur software. Circos plots were generated using Circos-0.67-7 software. The relative abundances of species in different samples were determined using STAMP8 with G tests and Fisher's tests. Bacterial metabolic functions were predicted, analyzed, and plotted using the PICRUSt software package, and fungal metabolic functions were predicted, analyzed, and plotted using the FUNGuild package. Prokaryotic (bacterial) ecological functions were predicted utilizing the FAPROTAX database and then analyzed and plotted with Python. Microbial correlation analysis was performed using Networkx software for network analysis.Data were presented as the mean ± standard error. Different lowercase letters indicate significant differences between treatments according to one-way ANOVA with Duncan's multiple range tests (p < 0.05) in SPSS Statistics software (IBM Corporation, NY, USA).
-
Tomato height and stem diameter gradually increased with the growth period (Fig. 1a & b). Thirty days after planting, there were no significant differences in plant height and stem diameter among the treatments. From 60 to 270 d after planting, the plant height was highest in the CK, and the stem diameter was largest in T2. As the irrigation frequency decreased, the stem diameter first increased and then decreased. At 270 d after planting, the stem diameter was 4.1%, 4.9%, 5.5%, and 2.5% higher in T2 than in CK1, CK2, T1, and T3, respectively, and these differences were significant.
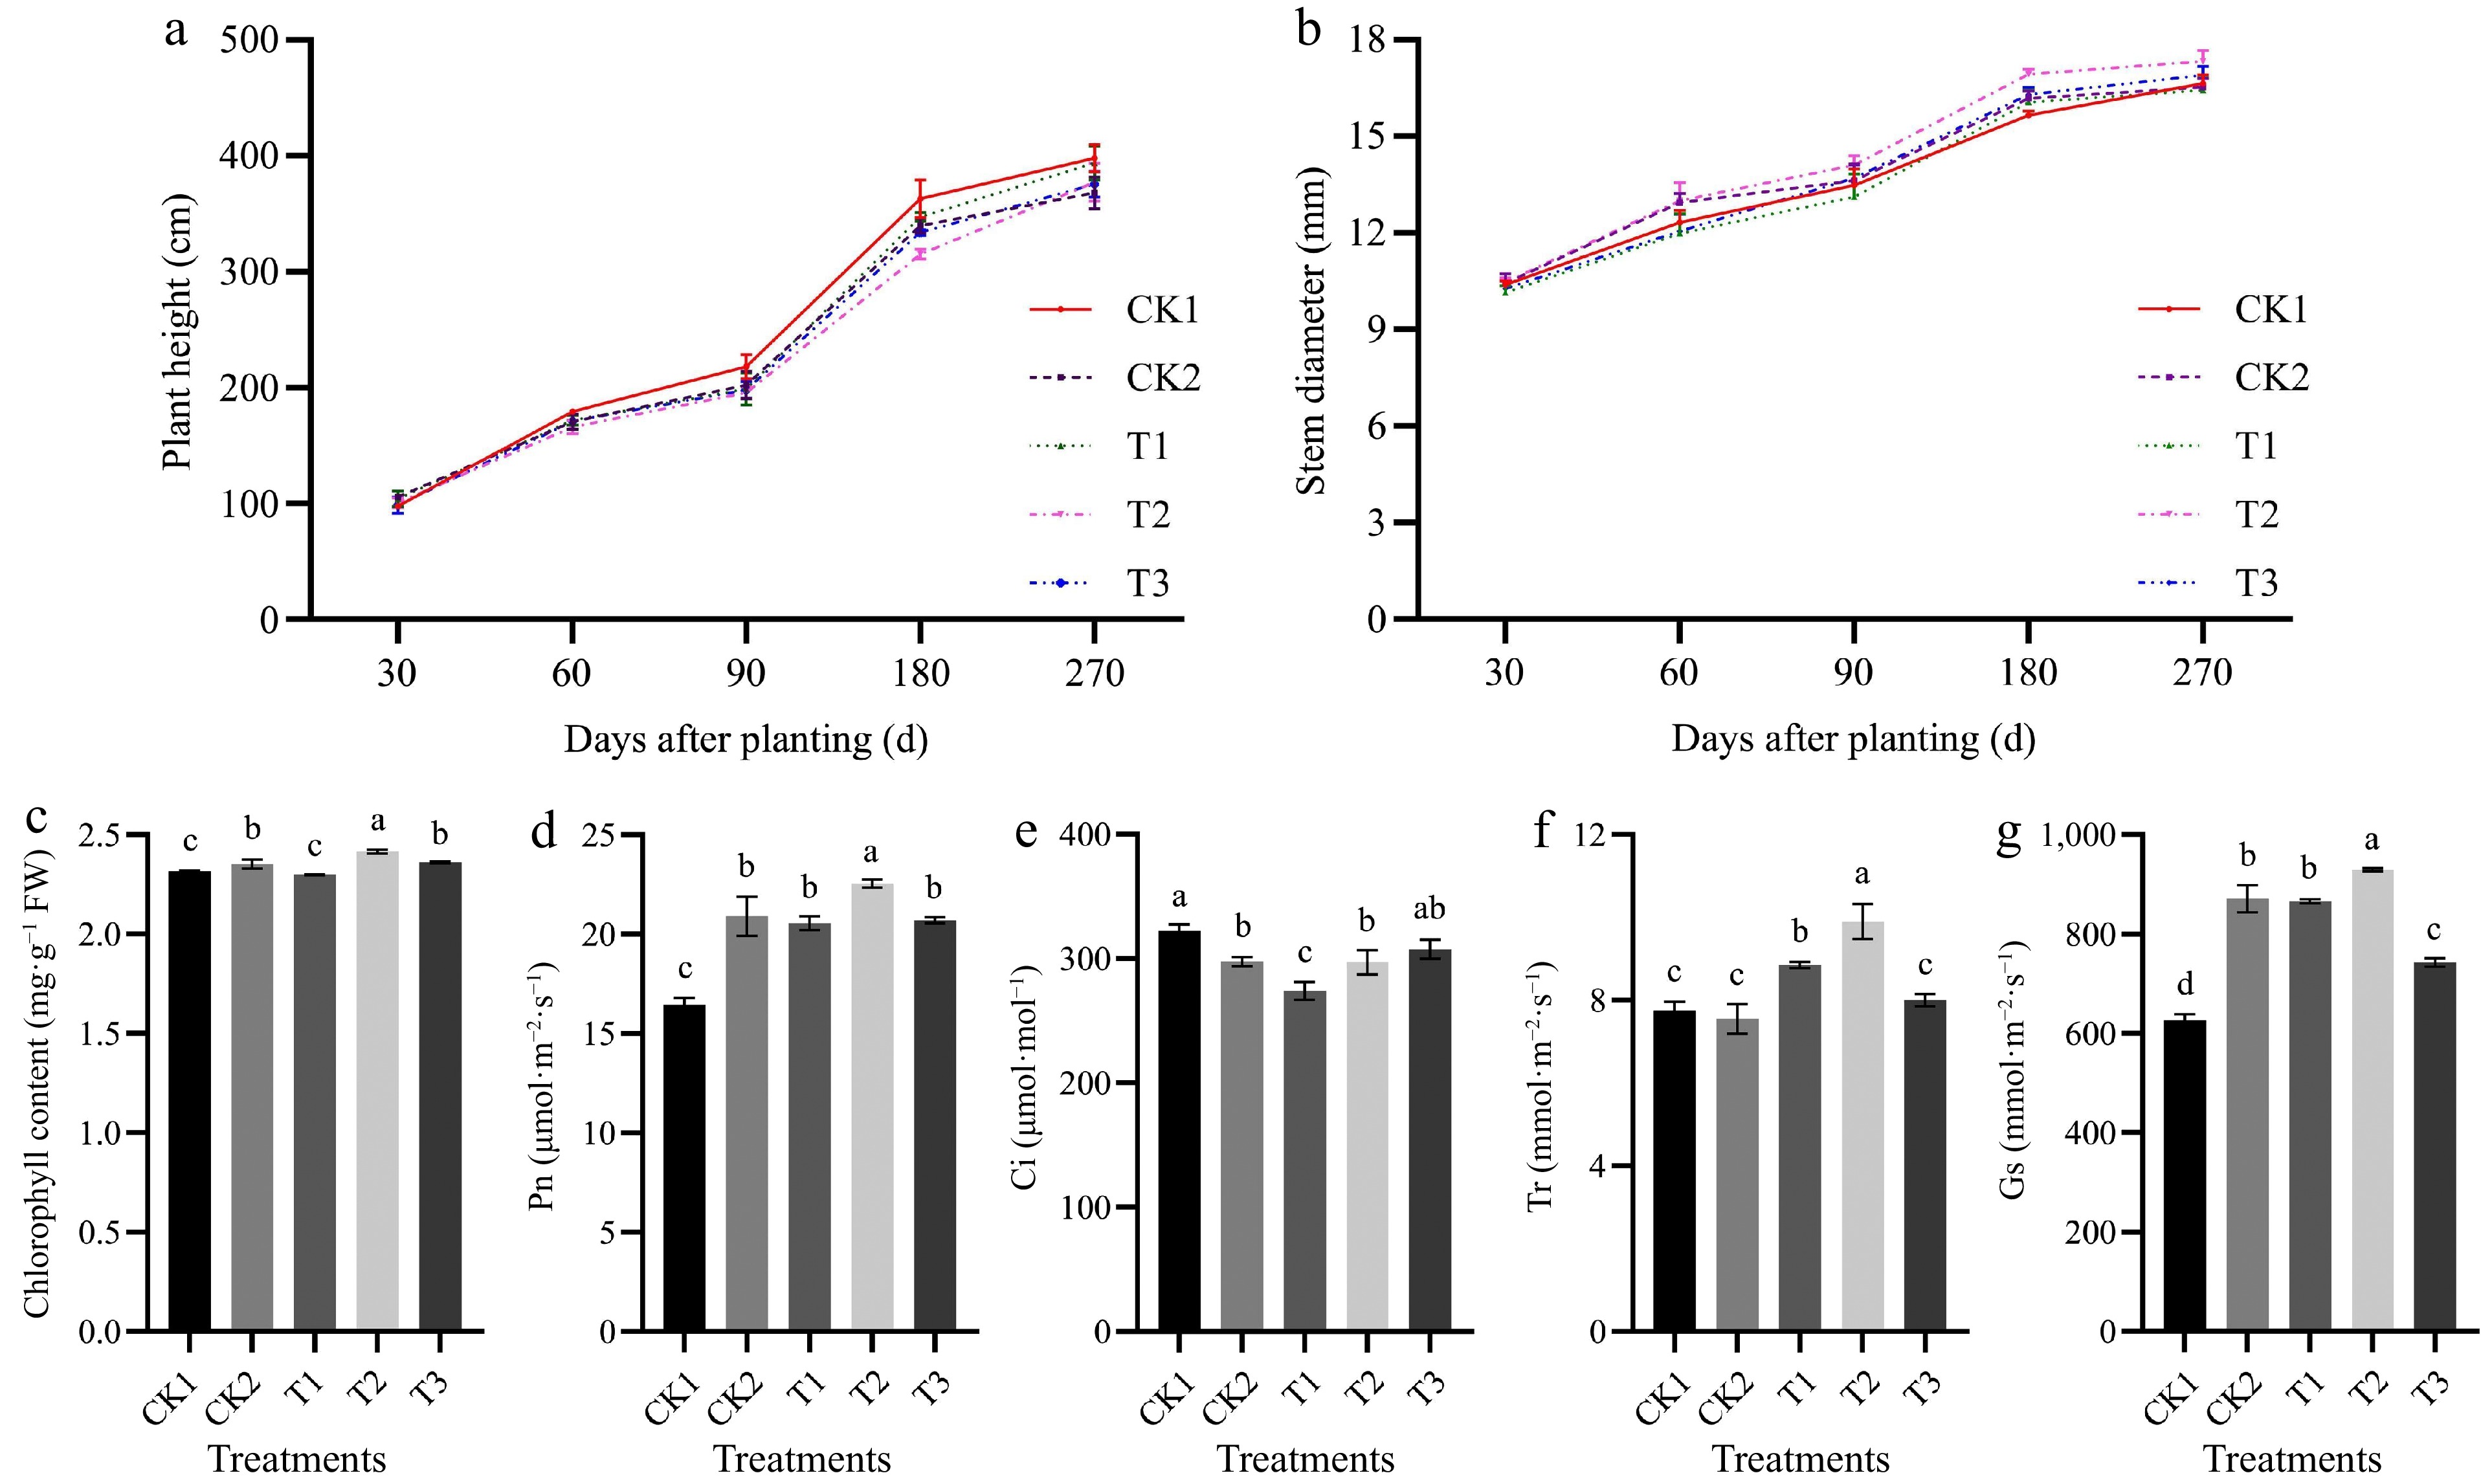
Figure 1.
The effects of different irrigation frequencies on (a) tomato plant height, and (b) stem diameter during 0−270 d. The effects of different irrigation frequencies on (c) tomato chlorophyll content, and photosynthetic parameters (d)−(g) at 90 d after planting. Pn: Net photosynthetic rate, Ci: Intercellular carbon dioxide concentration, Gs: Stomatal conductance, Tr: Transpiration rate. Different letters (a, b, c) indicate significant differences between groups (p < 0.05).
The chlorophyll content in tomato leaves was 4.3% higher in T2 than in CK1, and this difference was significant (Fig. 1c). The photosynthetic parameters of tomato leaves were higher under different irrigation frequencies than in CK1 (Fig. 1d−g). The Pn was 37.1%, 7.9%, 9.7%, and 8.9% higher in T2 than in CK1, CK2, T1, and T3, respectively, and these differences were significant. The Ci was 8.2%, 17.5%, 8.4%, and 4.7% higher in CK than in CK2, T1, T2, and T3, respectively. The Tr and Gs were highest in T2, and they were 27.7%, 31.1%, 11.9%, and 23.8%, and 48.5%, 6.7%, 7.3%, and 25.1% higher in T2 than in CK1, CK2, T1, and T3, respectively; all of these differences were significant.
Effects of drip irrigation frequency on the root growth and soil enzyme activity of tomato
-
The root parameters of tomato generally first increased and then decreased as the irrigation frequency decreased (Fig. 2). The root length was highest in T3, and it was 58.7% higher in T3 than in CK1. The root surface area and root volume were highest in T2, and they were 58.9% and 34.1% higher in T2 than in CK1, respectively. The root activity was 27.8%, 30.5%, 22.5%, and 19.1% higher in T3 than in CK1, CK2, T1, and T2, respectively, and these differences were significant. This indicates that root activity was highly sensitive to water and positively correlated with the irrigation frequency.
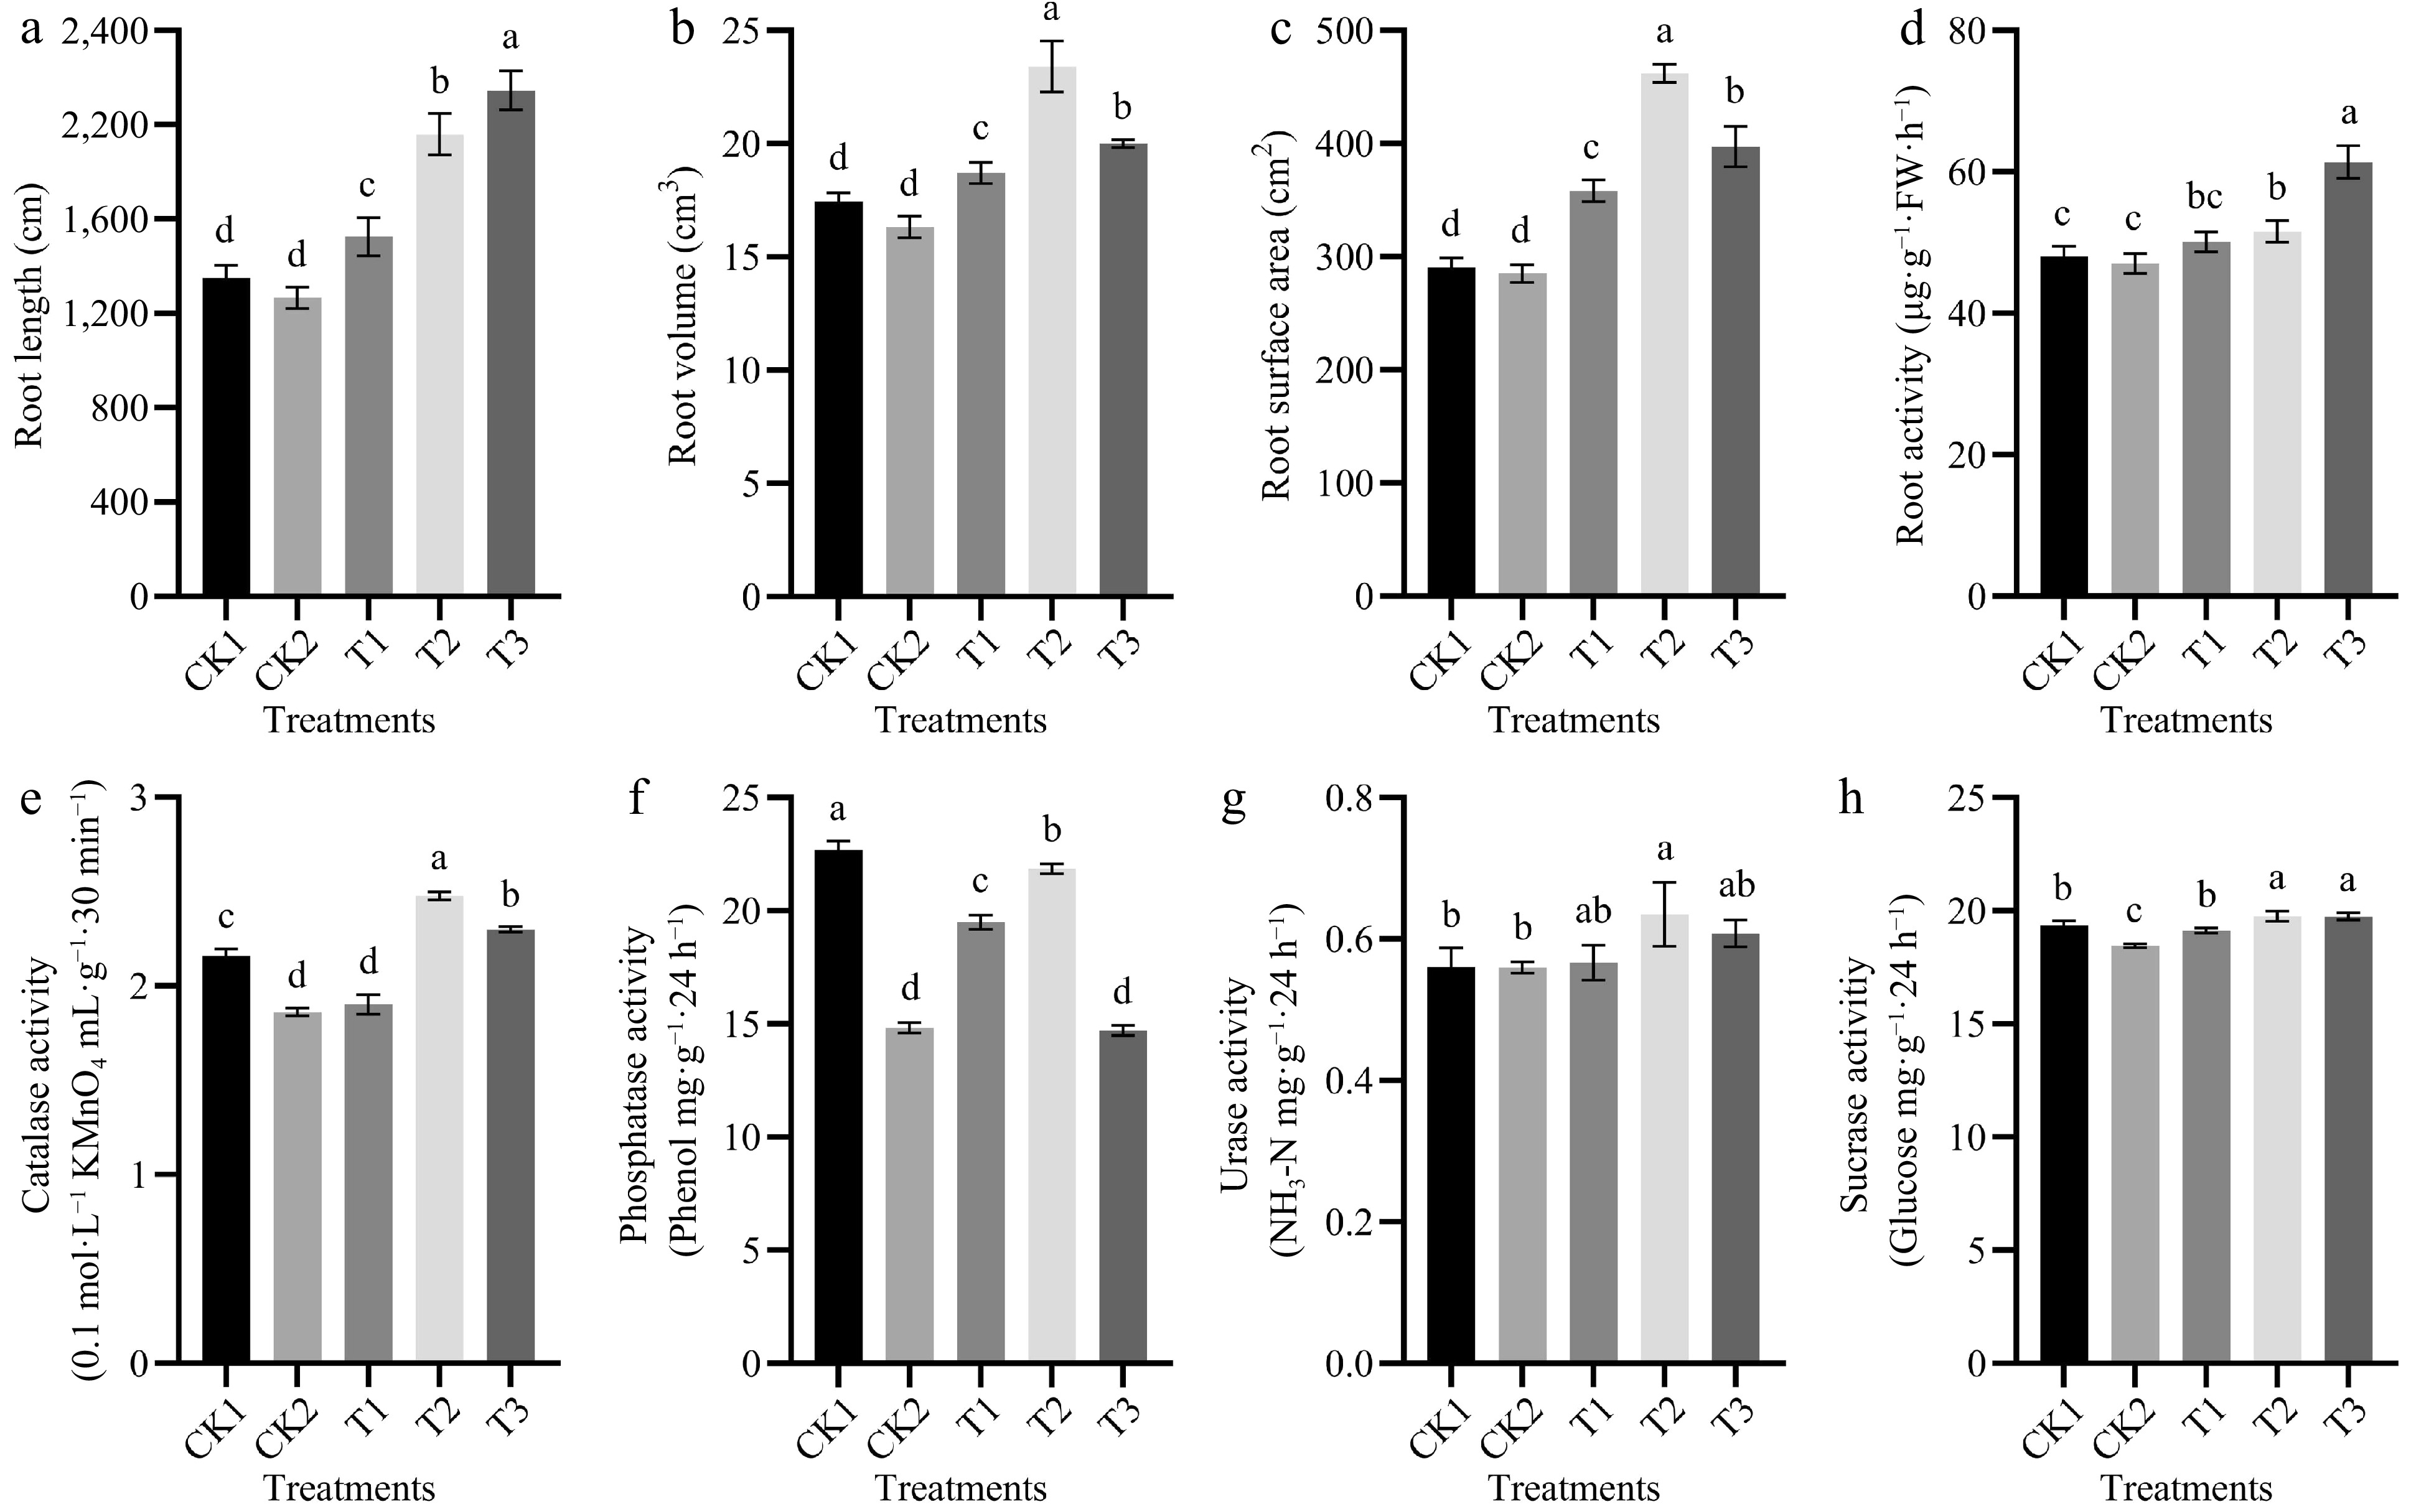
Figure 2.
The effects of different irrigation frequencies on (a) tomato root length, (b) root surface area, (c) root volume, (d) root vigor, and (e) soil activities of CAT, (f) ALP, (g) UE, and (h) SC at 90 d after planting. Different letters (a, b, c) indicate significant differences between groups (p < 0.05).
The CAT, UE, and SC activities were higher in T2 than in CK1, CK2, T1, and T3, and ALP activity was higher in CK1 than in CK2, T1, T2, and T3 (Fig. 2). The CAT activity was 14.8% and 33.1% higher in T2 than in CK1 and CK2, respectively, and this difference was significant. The UE activity was 13.4% and 13.5% higher in T2 than in CK1 and CK2, and SC activity was 2.1% and 7.1% higher in T2 than in CK1 and CK2; these differences were significant.
Effects of drip irrigation frequency on the soil moisture content, dry weight, yield, and water use efficiency of tomato
-
The irrigation frequency affects soil moisture content. Soil moisture content was higher in T2 than in CK1. After 180 d of planting, compared with the CK1 treatment, the soil moisture content in the T2 treatment was significantly 11.1% higher (Supplementary Fig. S1).
As shown in Table 1, the dry weight, yield, and water use efficiency of tomato generally first increased and then decreased as the irrigation frequency decreased; the highest values were observed in T2. The dry weight per fruit was 9.2% and 11.2% higher in T2 than in the CK1 and CK2; the yield and water use efficiency were 12.2%, 8.5%, and 12.2%, 6.2% higher in T2 than in the CK1 and CK2, respectively.
Table 1. The effects of different irrigation frequencies on tomato dry weight, yield, and water use efficiency.
Treatments Root dry weight (g·plant−1) Stem dry weight (g·plant−1) Leaf dry weight (g·plant−1) Fruit dry weight (g·plant−1) Yield
(kg·667m−2)Water use efficiency (kg·m−3) CK1 13.62 ± 0.21b 161.67 ± 4.74ab 328.07 ± 2.72a 516.46 ± 11.74c 19,331.50 ± 245.48d 50.85 ± 0.65c CK2 11.85 ± 0.29e 129.73 ± 4.15c 286.44 ± 8.05b 507.28 ± 6.61c 19,998.18 ± 429.97bc 52.60 ± 1.13bc T1 12.35 ± 0.40d 136.20 ± 9.40c 281.58 ± 5.23b 497.58 ± 10.12c 19,745.05 ± 179.73c 51.93 ± 0.47bc T2 13.03 ± 0.25c 164.47 ± 8.36a 328.23 ± 8.08a 564.22 ± 13.49a 21,696.72 ± 212.22a 57.07 ± 0.56a T3 15.73 ± 0.21a 151.97 ± 3.59b 320.40 ± 1.94a 538.22 ± 5.63b 20,531.81 ± 563.53b 54.00 ± 1.48b Note: Different letters (a, b, c) indicate significant differences between groups (p < 0.05). Effects of drip irrigation frequency on the soil microbial diversity of tomato
-
Comparison with CK1, T2 (drip irrigation of Yamazaki tomato nutrient solution and a general trace element formula every 4 d) enhanced soil enzyme activities, promoted root growth, and increased yield by 12.2%. Therefore, the frequency of drip irrigation every 4 d might improve the soil's microbiological environment, facilitate the absorption and utilization of nutrients by roots and ultimately lead to increased production.
To further investigate the effect of irrigation frequency on soil microbial community structure, MiSeq Illumina high-throughput sequencing technology was used to analyze the soil microbial community in the rhizosphere of tomato in CK1 and T2. A total of 644,366 high-quality bacterial sequences were obtained from all samples, with an average sequence length of 415 bp. Additionally, a total of 796,746 high-quality sequences with an average length of 258 bp were obtained from the fungal community analysis.
Microbial diversity was assessed based on operational taxonomic units (OTUs). Venn analysis revealed that CK1 and T2 collectively contained 9,093 bacterial and 1,761 fungal OTUs, with 1,097 and 1,613 unique OTUs, respectively. The abundance of bacterial OTUs was 67.9% higher in T2 than in CK1, and no significant differences were observed in fungal OTUs (Fig. 3a & b). Results of the rarefaction analysis demonstrated that the OTU sampling depth was sufficient for all generated libraries (Supplementary Fig. S2a & b). Additionally, Shannon-Wiener analysis indicated that the sequencing coverage adequately represented the microbial community within the sample, which supports the identifications made using the sequencing data (Supplementary Fig. S2c & d).
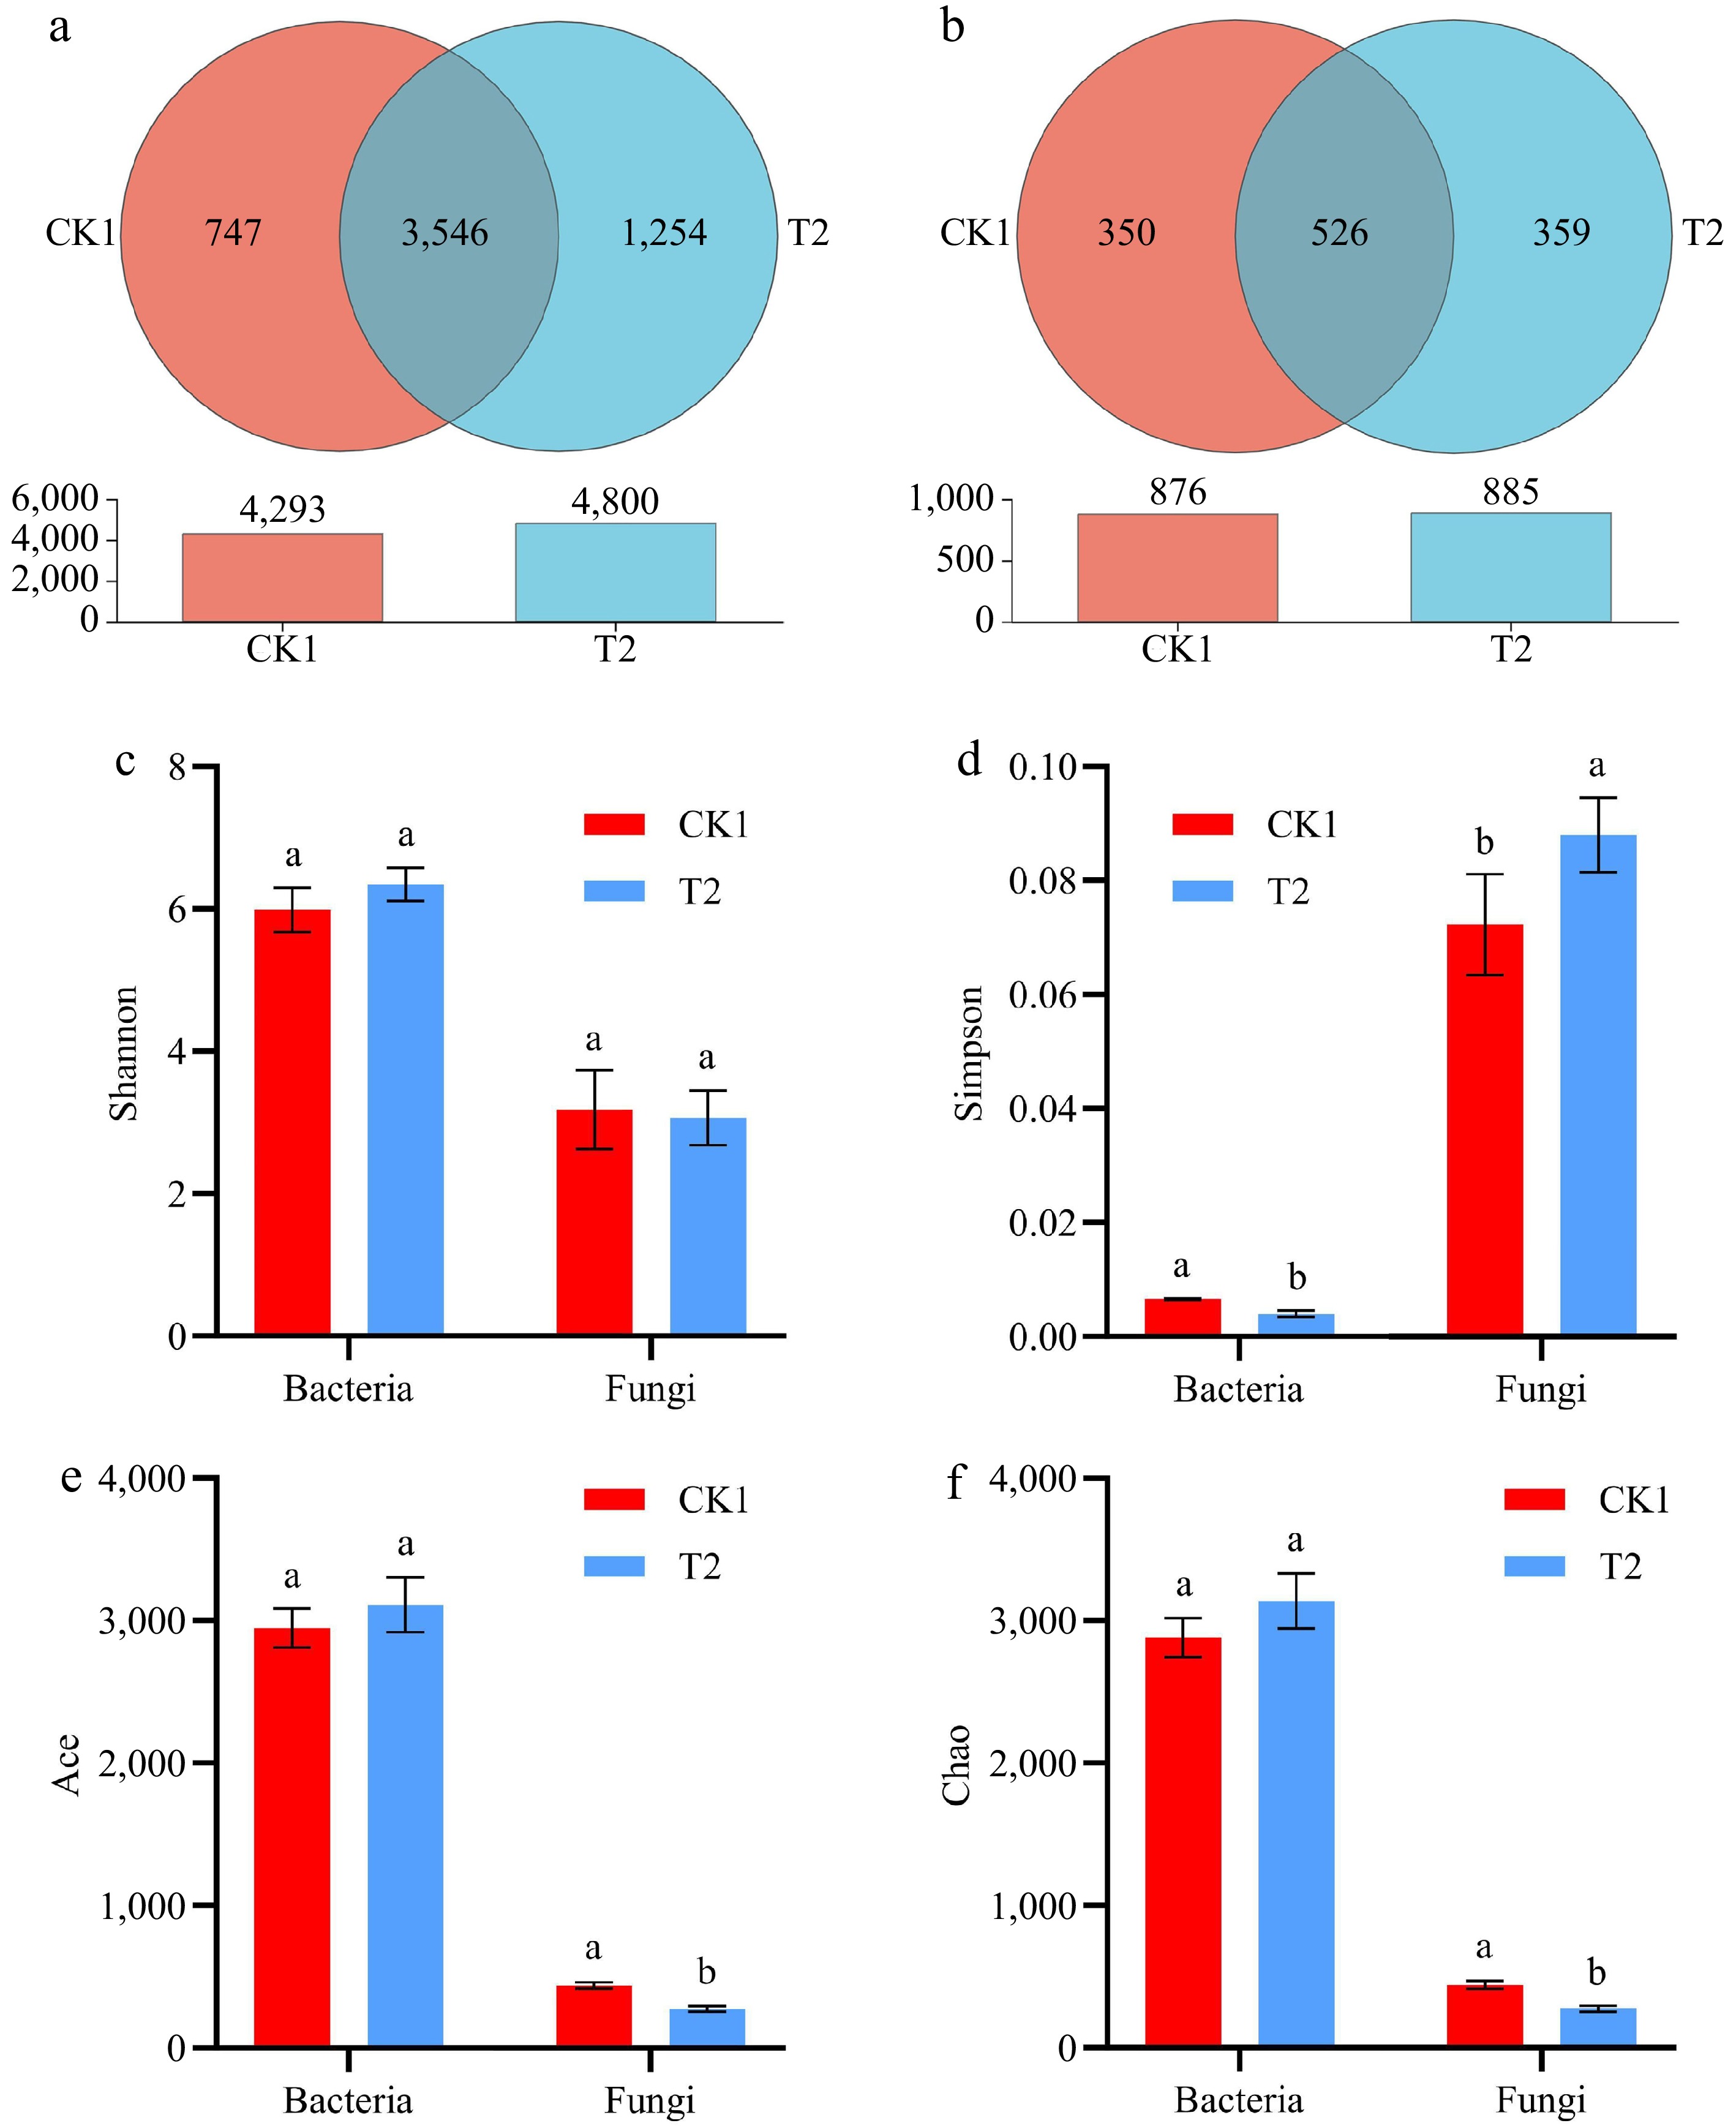
Figure 3.
The effect of CK1 and T2 on the composition of (a) bacterial, and (b) fungal OTUs in soil. (c)−(f) Bacterial and fungal alpha diversity indices of CK1 and T2 at the OTU level.
As shown in Fig. 3, the Shannon index, Ace index, and Chao1 of bacteria were higher in T2 than in CK1. In contrast, the Simpson index was lower in T2 than in CK1. These results indicate that the richness and diversity of bacteria were higher in T2 than in CK1. The Shannon index, Ace index, and Chao1 of fungi were higher in CK1 than in T2. Similarly, the Simpson index was lower in CK1 than in T2. These findings suggest that the richness and diversity of fungi were greater in CK1 than in T2.
Effects of drip irrigation frequency on the soil microbial community composition of tomato
-
Beta diversity analysis of soil bacterial and fungal communities were performed. Principal co-ordinates analysis (PCoA) was employed for the CK1 and T2 treatments (Fig. 4). The first principal component (PC1) and the second principal component (PC2) of the bacterial community structure accounted for 26.0% and 16.4% of the total variance, respectively. Similarly, PC1 and PC2 of the fungal community structure explained 23.3% and 21.0% of the total variance, respectively. No significant effects were observed regarding different drip irrigation frequencies on either bacterial or fungal community structures (p > 0.05).
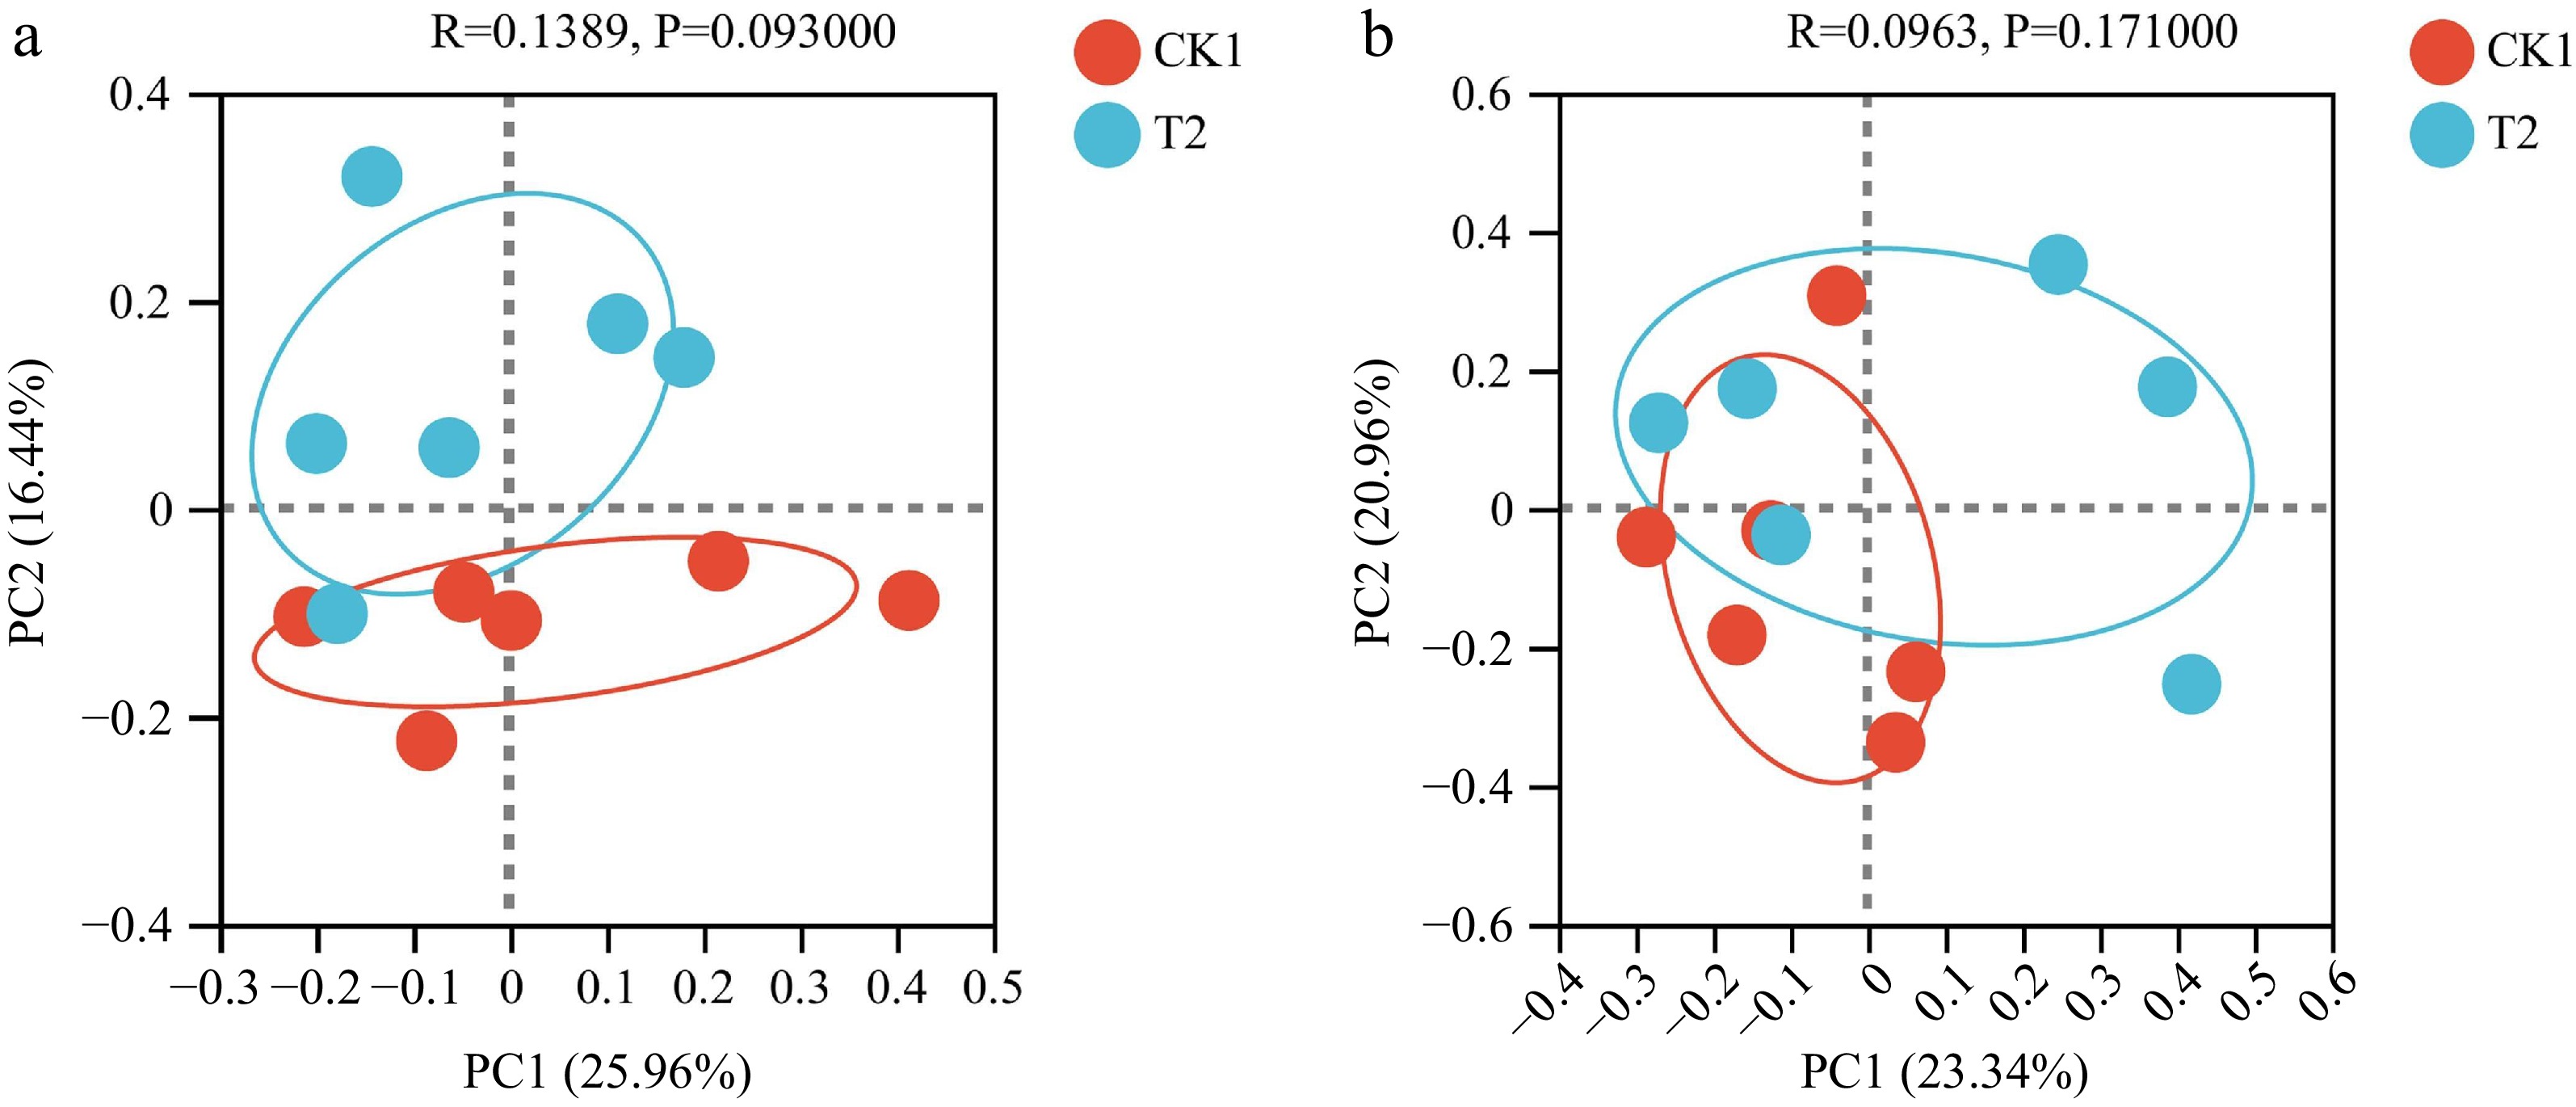
Figure 4.
Principal co-ordinates analysis (PCoA) of bacterial community structure in CK1 and T2.
To clarify similarities and differences in microbial communities at the phylum and genus levels under CK1 and T2, an analysis of the composition and structure of microbial communities were conducted (Fig. 5 & Supplementary Fig. S3). There are significant differences in Proteobacteria and Nitrospirota between CK1 and T2 treatments. There is no significant difference in fungal composition at the phylum level.
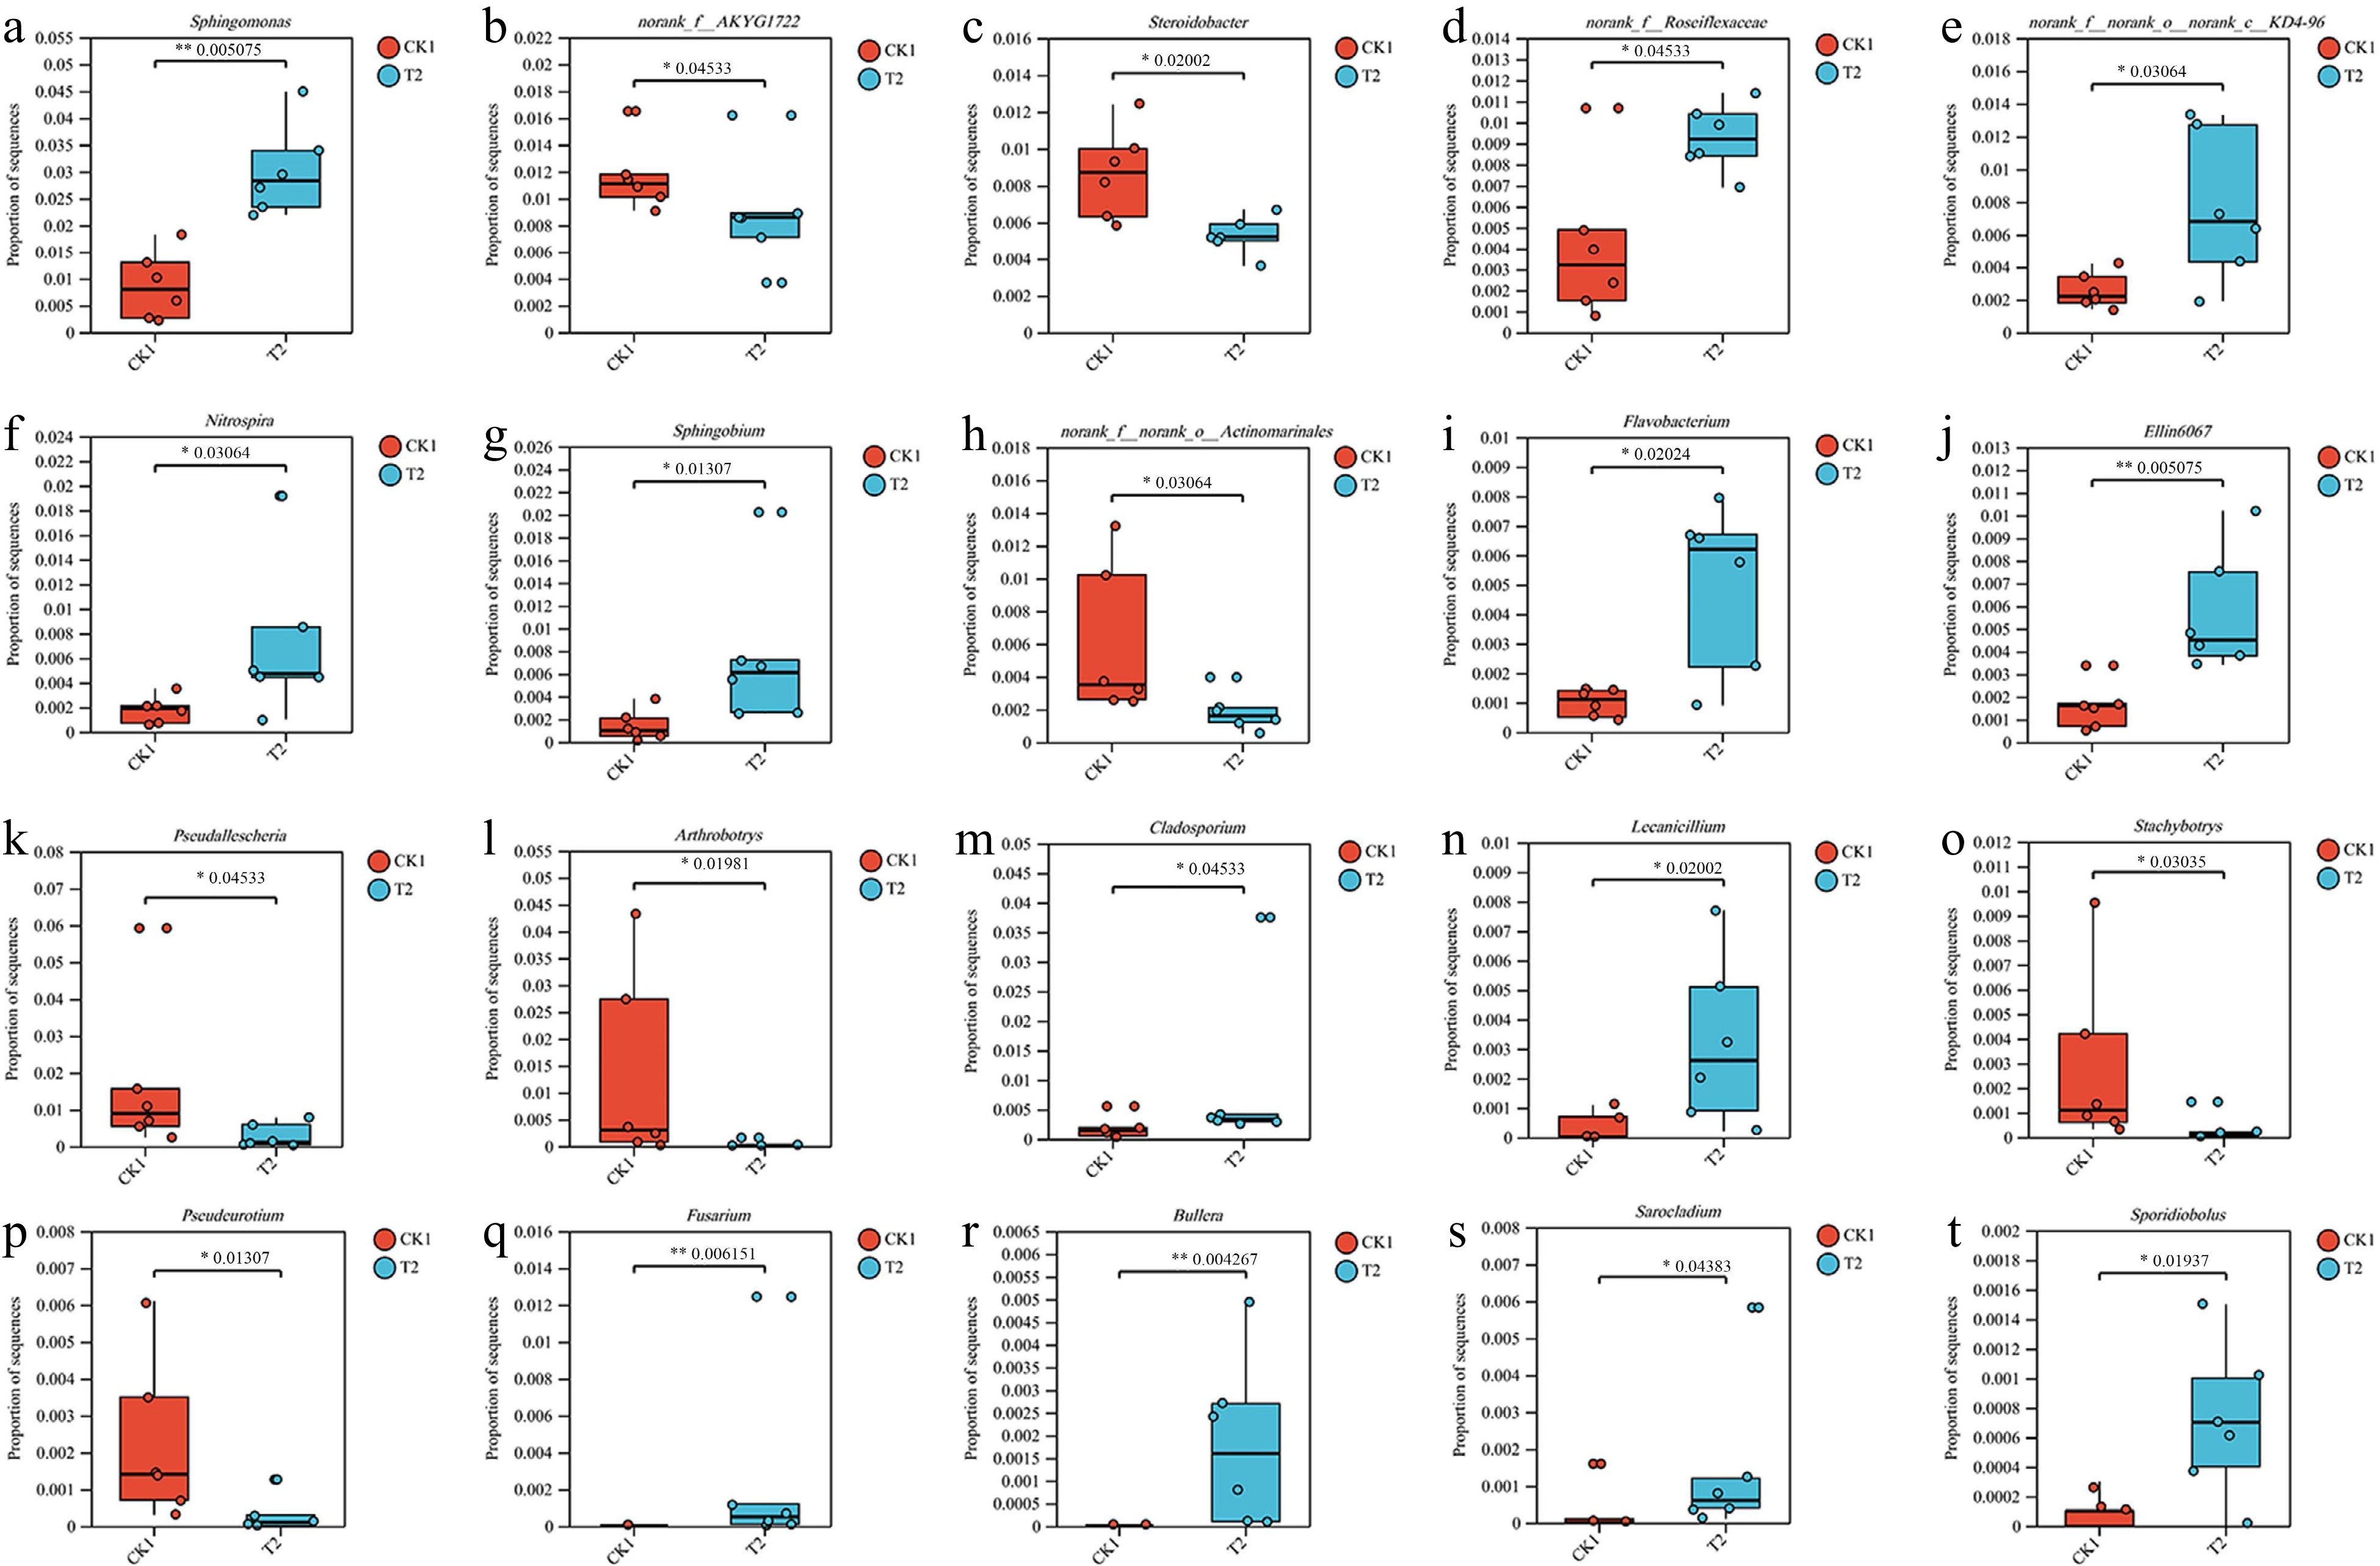
Figure 5.
Wilcoxon rank-sum test chart of the (a)−(j) ten bacterial and (k)−(t) fungal genus with the highest abundance averages.
A significant number of unidentified bacterial and fungal genus were detected (Fig. 5). Sphingomonas and norank_f_AKYG1722 are the dominant bacterial genera and a significant difference exists between the CK1 and T2 treatments. Pseudallescheria and Arthrobotrys are the dominant fungal genera, and a significant difference exists between the CK1 and T2 treatments. At the OTU level, OTU 1357, OTU 3611, and OTU 2845 are the predominant bacterial OTUs and OTU 1634, OTU 812, and OTU 1140 are the predominant fungal OTUs (Supplementary Fig. S4, Tables 2 & 3). The bacterial OTU 2173 and OTU 873 showed the most significant changes, increasing by 196.0% and 320.0%, respectively, compared to CK1. The fungal OTU 1512 and OTU 1227 also showed the most significant changes, increasing by 15,967.0% and 1,921.0%, respectively, compared to CK1.
Table 2. The variations in relative abundances reflect the distribution of OTU-level dominant bacteria in CK1 and T2.
OTU name CK1 relative
abundancesT2 relative
abundancesVariation in abundance OTU1357 3.23 2.00 −0.38 OTU3611 2.57 1.71 −0.33 OTU2845 2.44 1.49 −0.39 OTU4326 1.68 1.32 −0.21 OTU3270 1.87 1.01 −0.46 OTU3092 2.00 0.74 −0.63 OTU6159 1.75 0.80 −0.54 OTU1634 1.12 1.43 0.28 OTU6356 1.16 1.31 0.13 OTU1899 1.35 0.98 −0.27 OTU2173 0.55 1.63 1.96 OTU858 0.41 1.72 3.20 OTU675 1.19 0.91 −0.24 OTU2748 1.30 0.47 −0.64 OTU2911 1.10 0.36 −0.67 Table 3. The variations in relative abundances reflect the distribution of OTU-level dominant fungi in CK1 and T2.
OTU name CK1 relative abundances T2 relative
abundancesVariation in abundance OTU1634 31.56 14.20 −0.55 OTU812 16.62 22.73 0.37 OTU1140 16.63 17.24 0.04 OTU1752 3.15 5.25 0.67 OTU1573 4.78 0.86 −0.82 OTU1308 0.84 4.28 4.10 OTU185 2.47 2.54 0.03 OTU1512 0.03 4.82 159.67 OTU80 1.40 1.91 0.36 OTU1227 0.14 2.83 19.21 OTU427 1.65 1.06 −0.36 OTU1007 0.18 2.34 12.00 OTU1749 0.68 1.66 1.44 OTU961 1.63 0.24 −0.85 OTU1585 1.21 0.10 −0.92 Effects of drip irrigation frequency on the functional enrichment of rhizosphere bacteria and fungi in tomato
-
PICRUSt1 function prediction revealed 24 functional classifications of bacteria; amino acid transport and metabolism were the most enriched, and the difference between the CK1 and T2 was not significant (Fig. 6a). The KEGG functional abundance of bacteria in CK1 and T2 was calculated by PICRUSt2 function prediction. The results indicated that DNA-directed DNA polymerase, oxidoreductase, DNA 3'-5' helicase, histidine kinase, and 3-oxoacyl-[acyl-carrier-protein] reductase were significantly enriched (Fig. 6b & Supplementary Fig. S5a). Among them, peptidylprolyl isomerase is more concentrated in CK1, and glutathione transferase is more concentrated in T2 (Supplementary Fig. S5a).
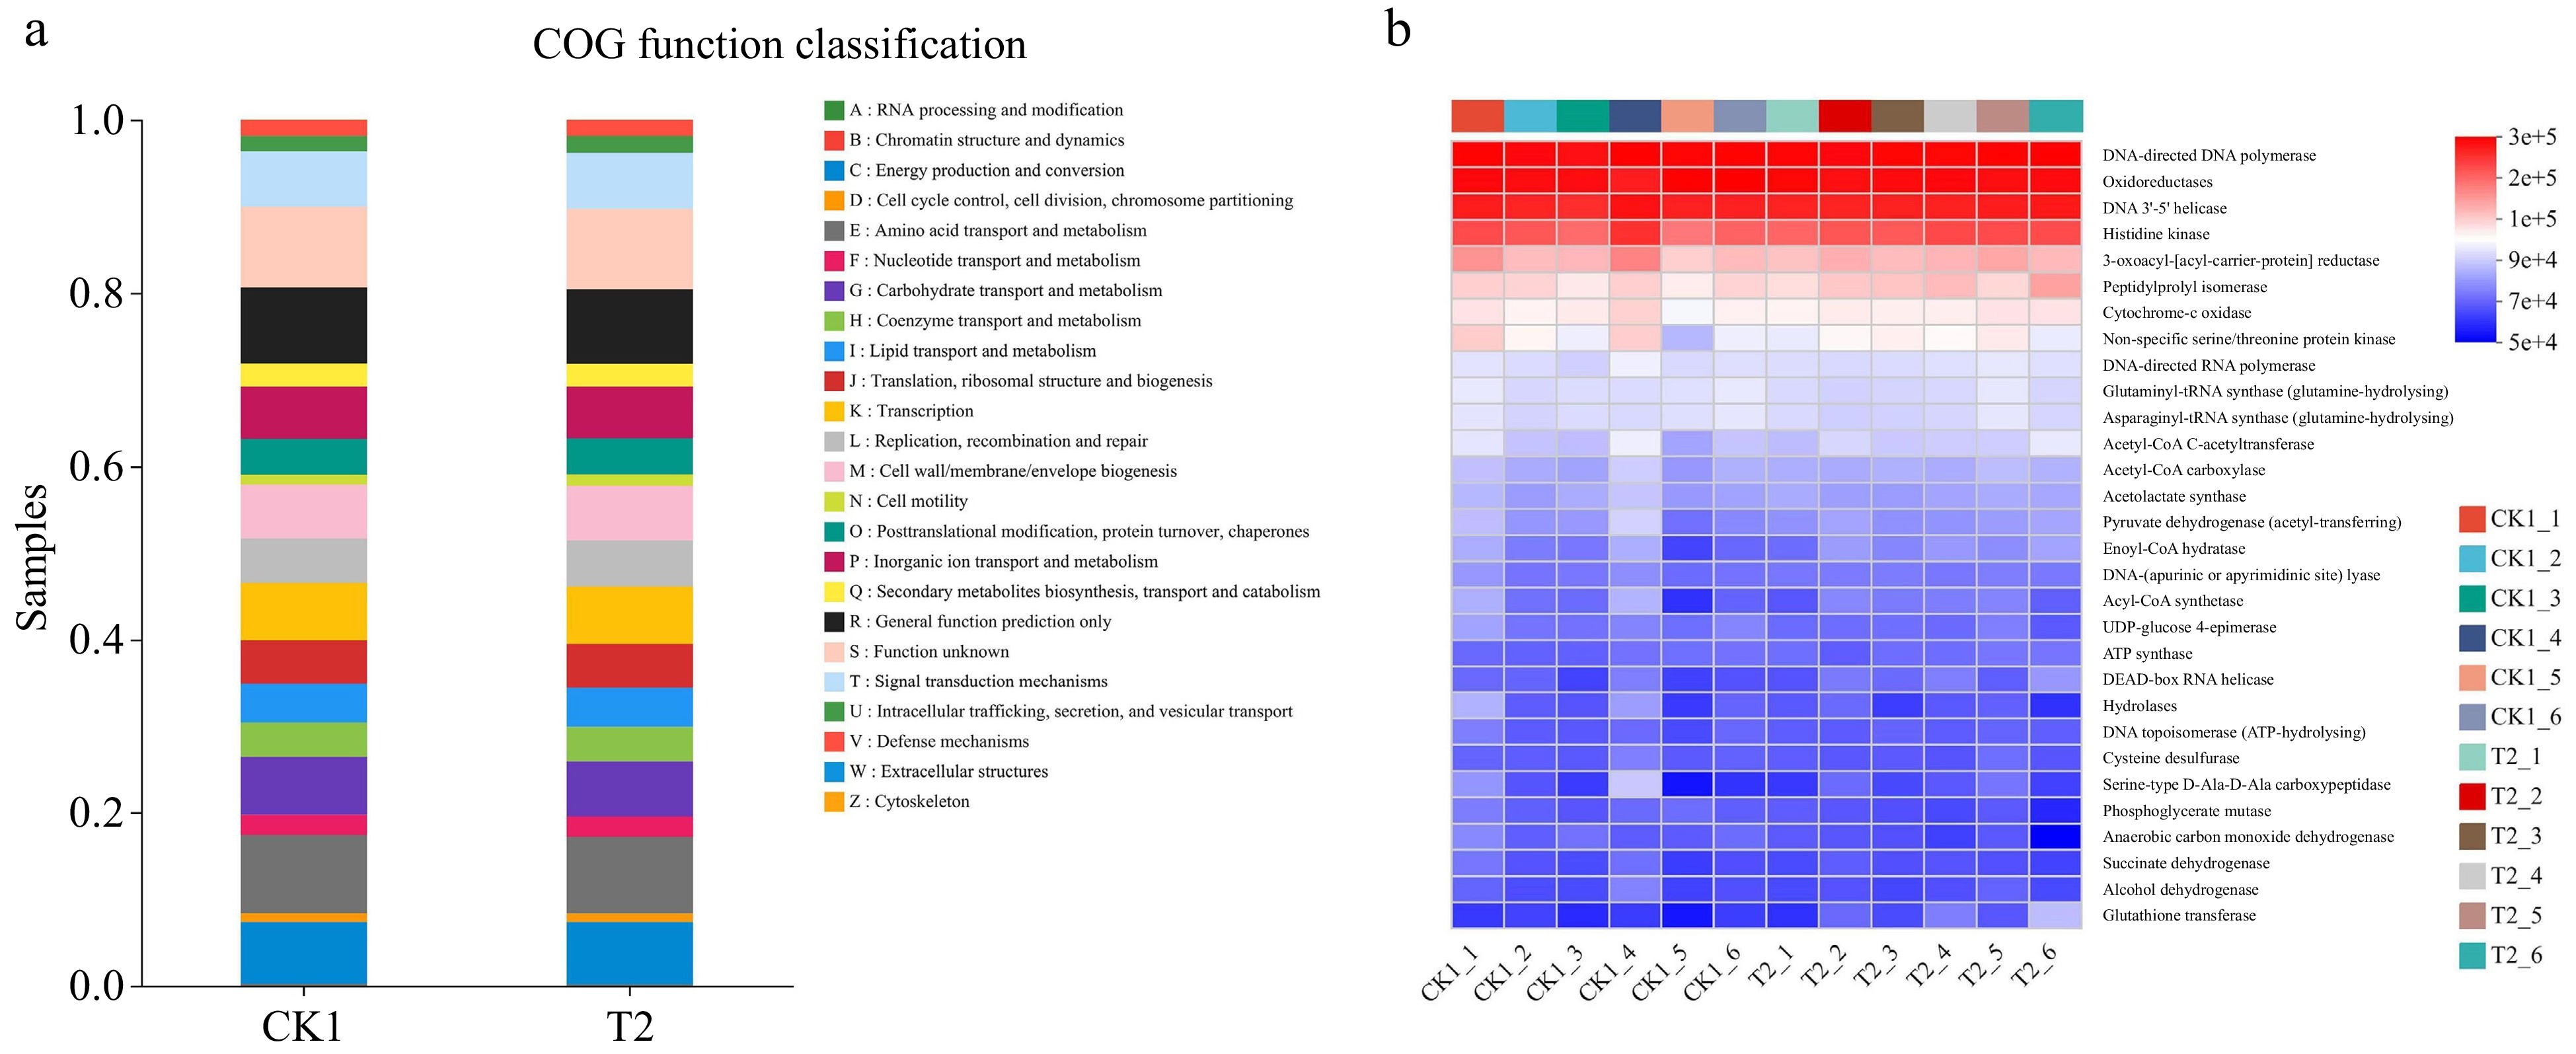
Figure 6.
Clusters of Orthologous Groups (COG) functional classification of PICRUSt in (a) bacteria of CK1 and T2. The functional heatmap predicted by PICRUSt2 in (b) bacteria in CK1 and T2.
The fungal community was dominated by saprotrophs (Fig. 7a). The abundance of Animal Pathogen-Dung Saprotroph-Endophyte-Epiphyte-Plant Saprotroph-Wood, Undefined Saprotroph, Endophyte-Plant Pathogen, Dung Saprotroph-Undefined Saprotroph, and Plant Saprotroph-Wood Saprotroph was higher in CK than in T2. The abundance of Endophyte-Litter Saprotroph-Soil Saprotroph-Undefined Saprotroph, Dung Saprotroph, and Animal Pathogen-Endophyte-Plant Pathogen-Undefined Saprotroph was higher in T2 than in CK. The KEGG functional abundances for fungi in CK1 and T2 were calculated by PICRUSt2 function prediction. Significant enrichment in hydrolase, L-arabinose isomerase, glucan 1,4-alpha-glucosidase, RNA polymerase, and exo-alpha-sialidase was observed (Fig. 7b & Supplementary Fig. S5b). Among them, L-arabinose isommerase, proteasome endopeptidase and Transferases is more concentrated in CK1, and chitin synthase and L-aminoadipate-semialdehyde dehydrogenase is more concentrated in T2 (Supplementary Fig. S5b).
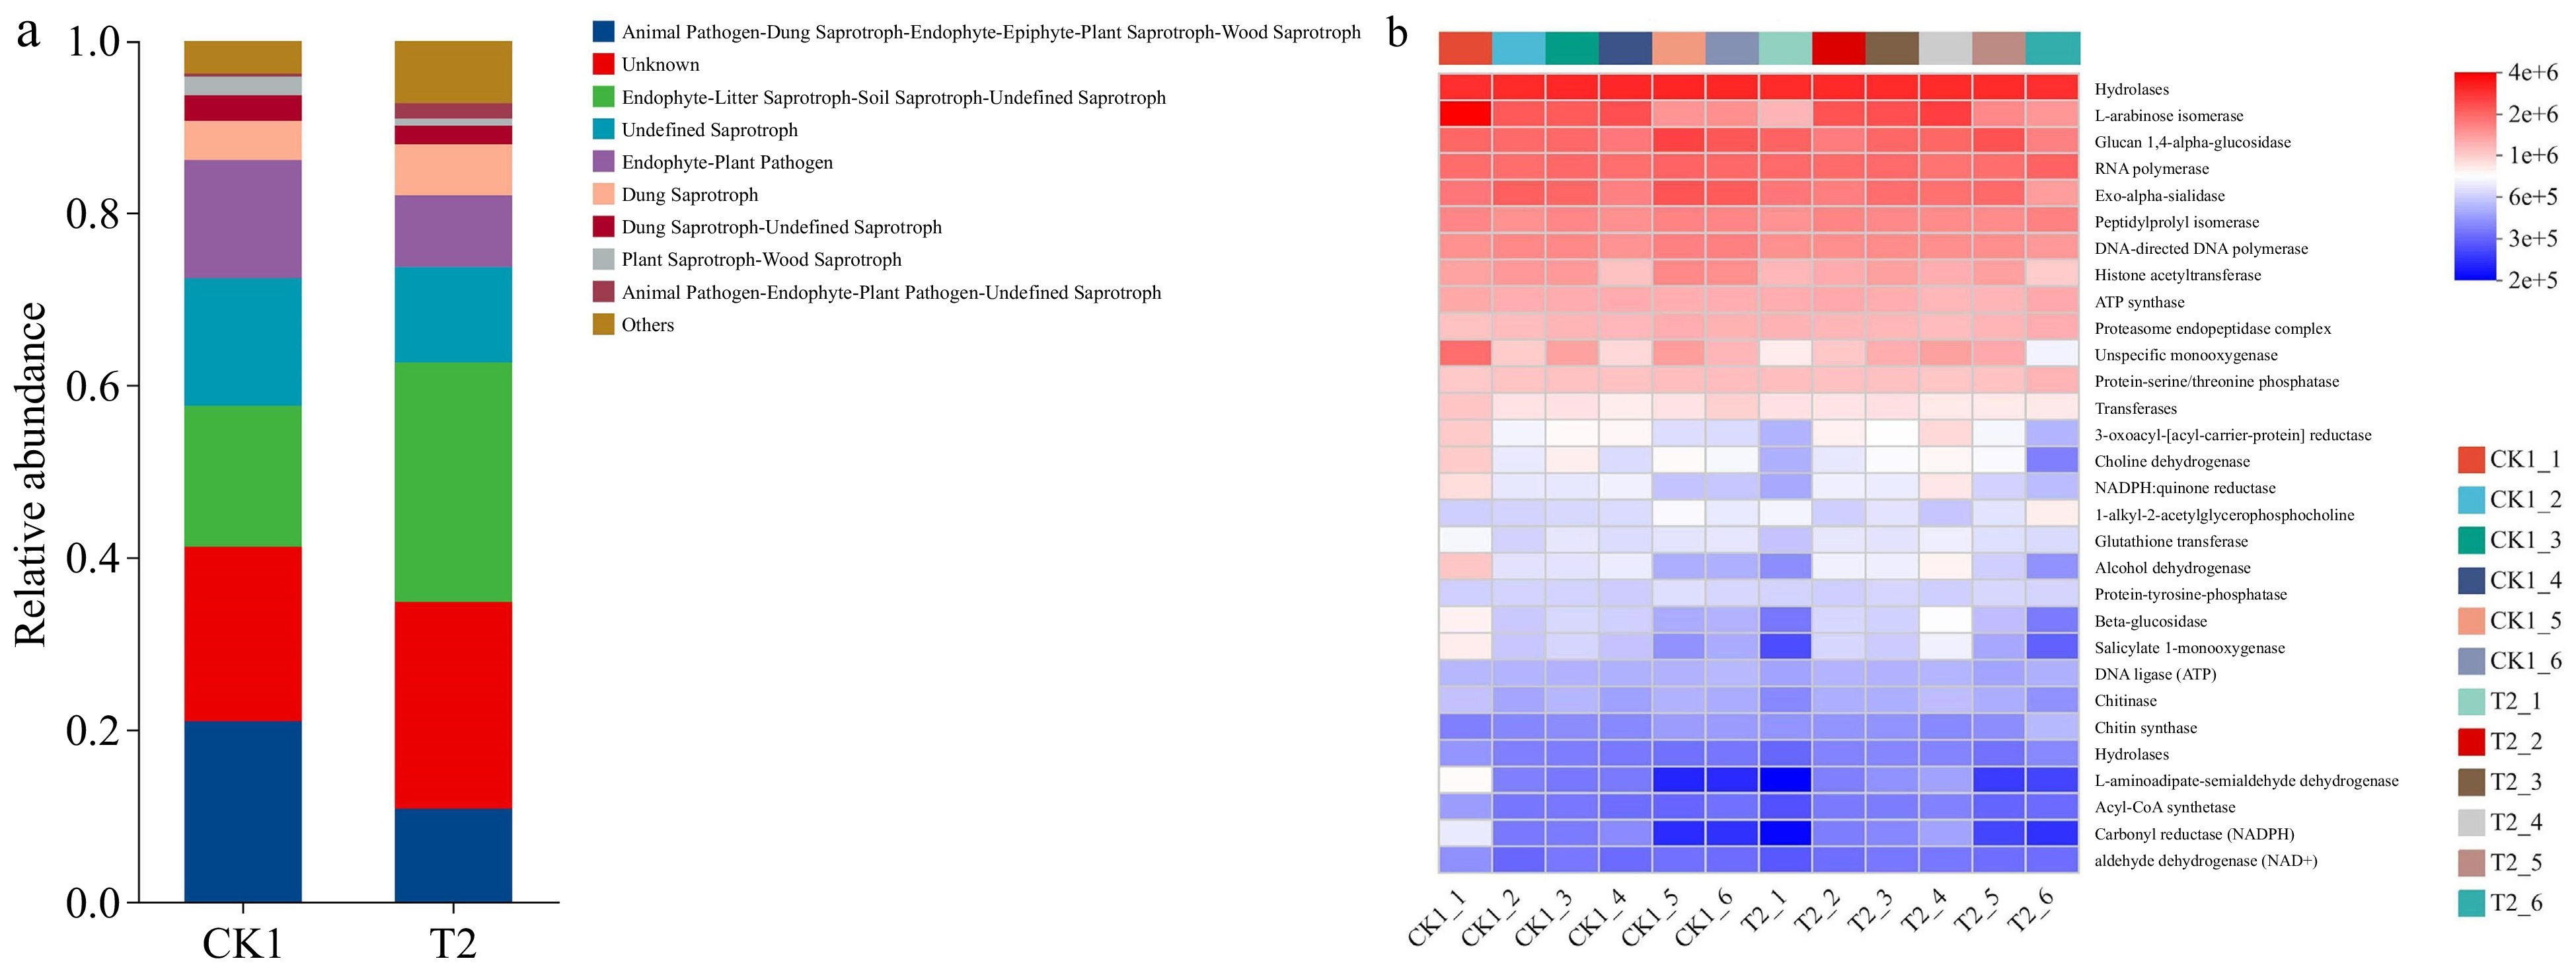
Figure 7.
Taxonomic analysis of fungal communities by microecological guilds (FUNGuild) (a) of CK1 and T2. The functional heatmap predicted by PICRUSt2 in (b) fungi in CK1 and T2.
Effects of drip irrigation frequency on the microbial-enzyme-root correlations of tomato soil
-
The CAT and SC activities were positively correlated with Sphingomonas and Ramlibacter and negatively correlated with Pseudolabrys (Fig. 8). The pattern of ALP activity was opposite to that of CAT activity. SC activity was positively correlated with Lysobacter and norank_f_Roseiflexaceae and negatively correlated with Nonomuraea. The UE activity was positively correlated with Sphingomonas and norank_f__norank_o__norank_c__KD4-96 and negatively correlated with Nonomuraea and Phialemonium. In fungi, UE and SC activities were positively correlated with Bullera, and Mortierella was positively correlated with UE activity. The remaining microorganisms belonged to Ascomycota and were positively or negatively correlated with the activities of four enzymes; Pseudorutium was the critical factor explaining variation in enzyme activities.
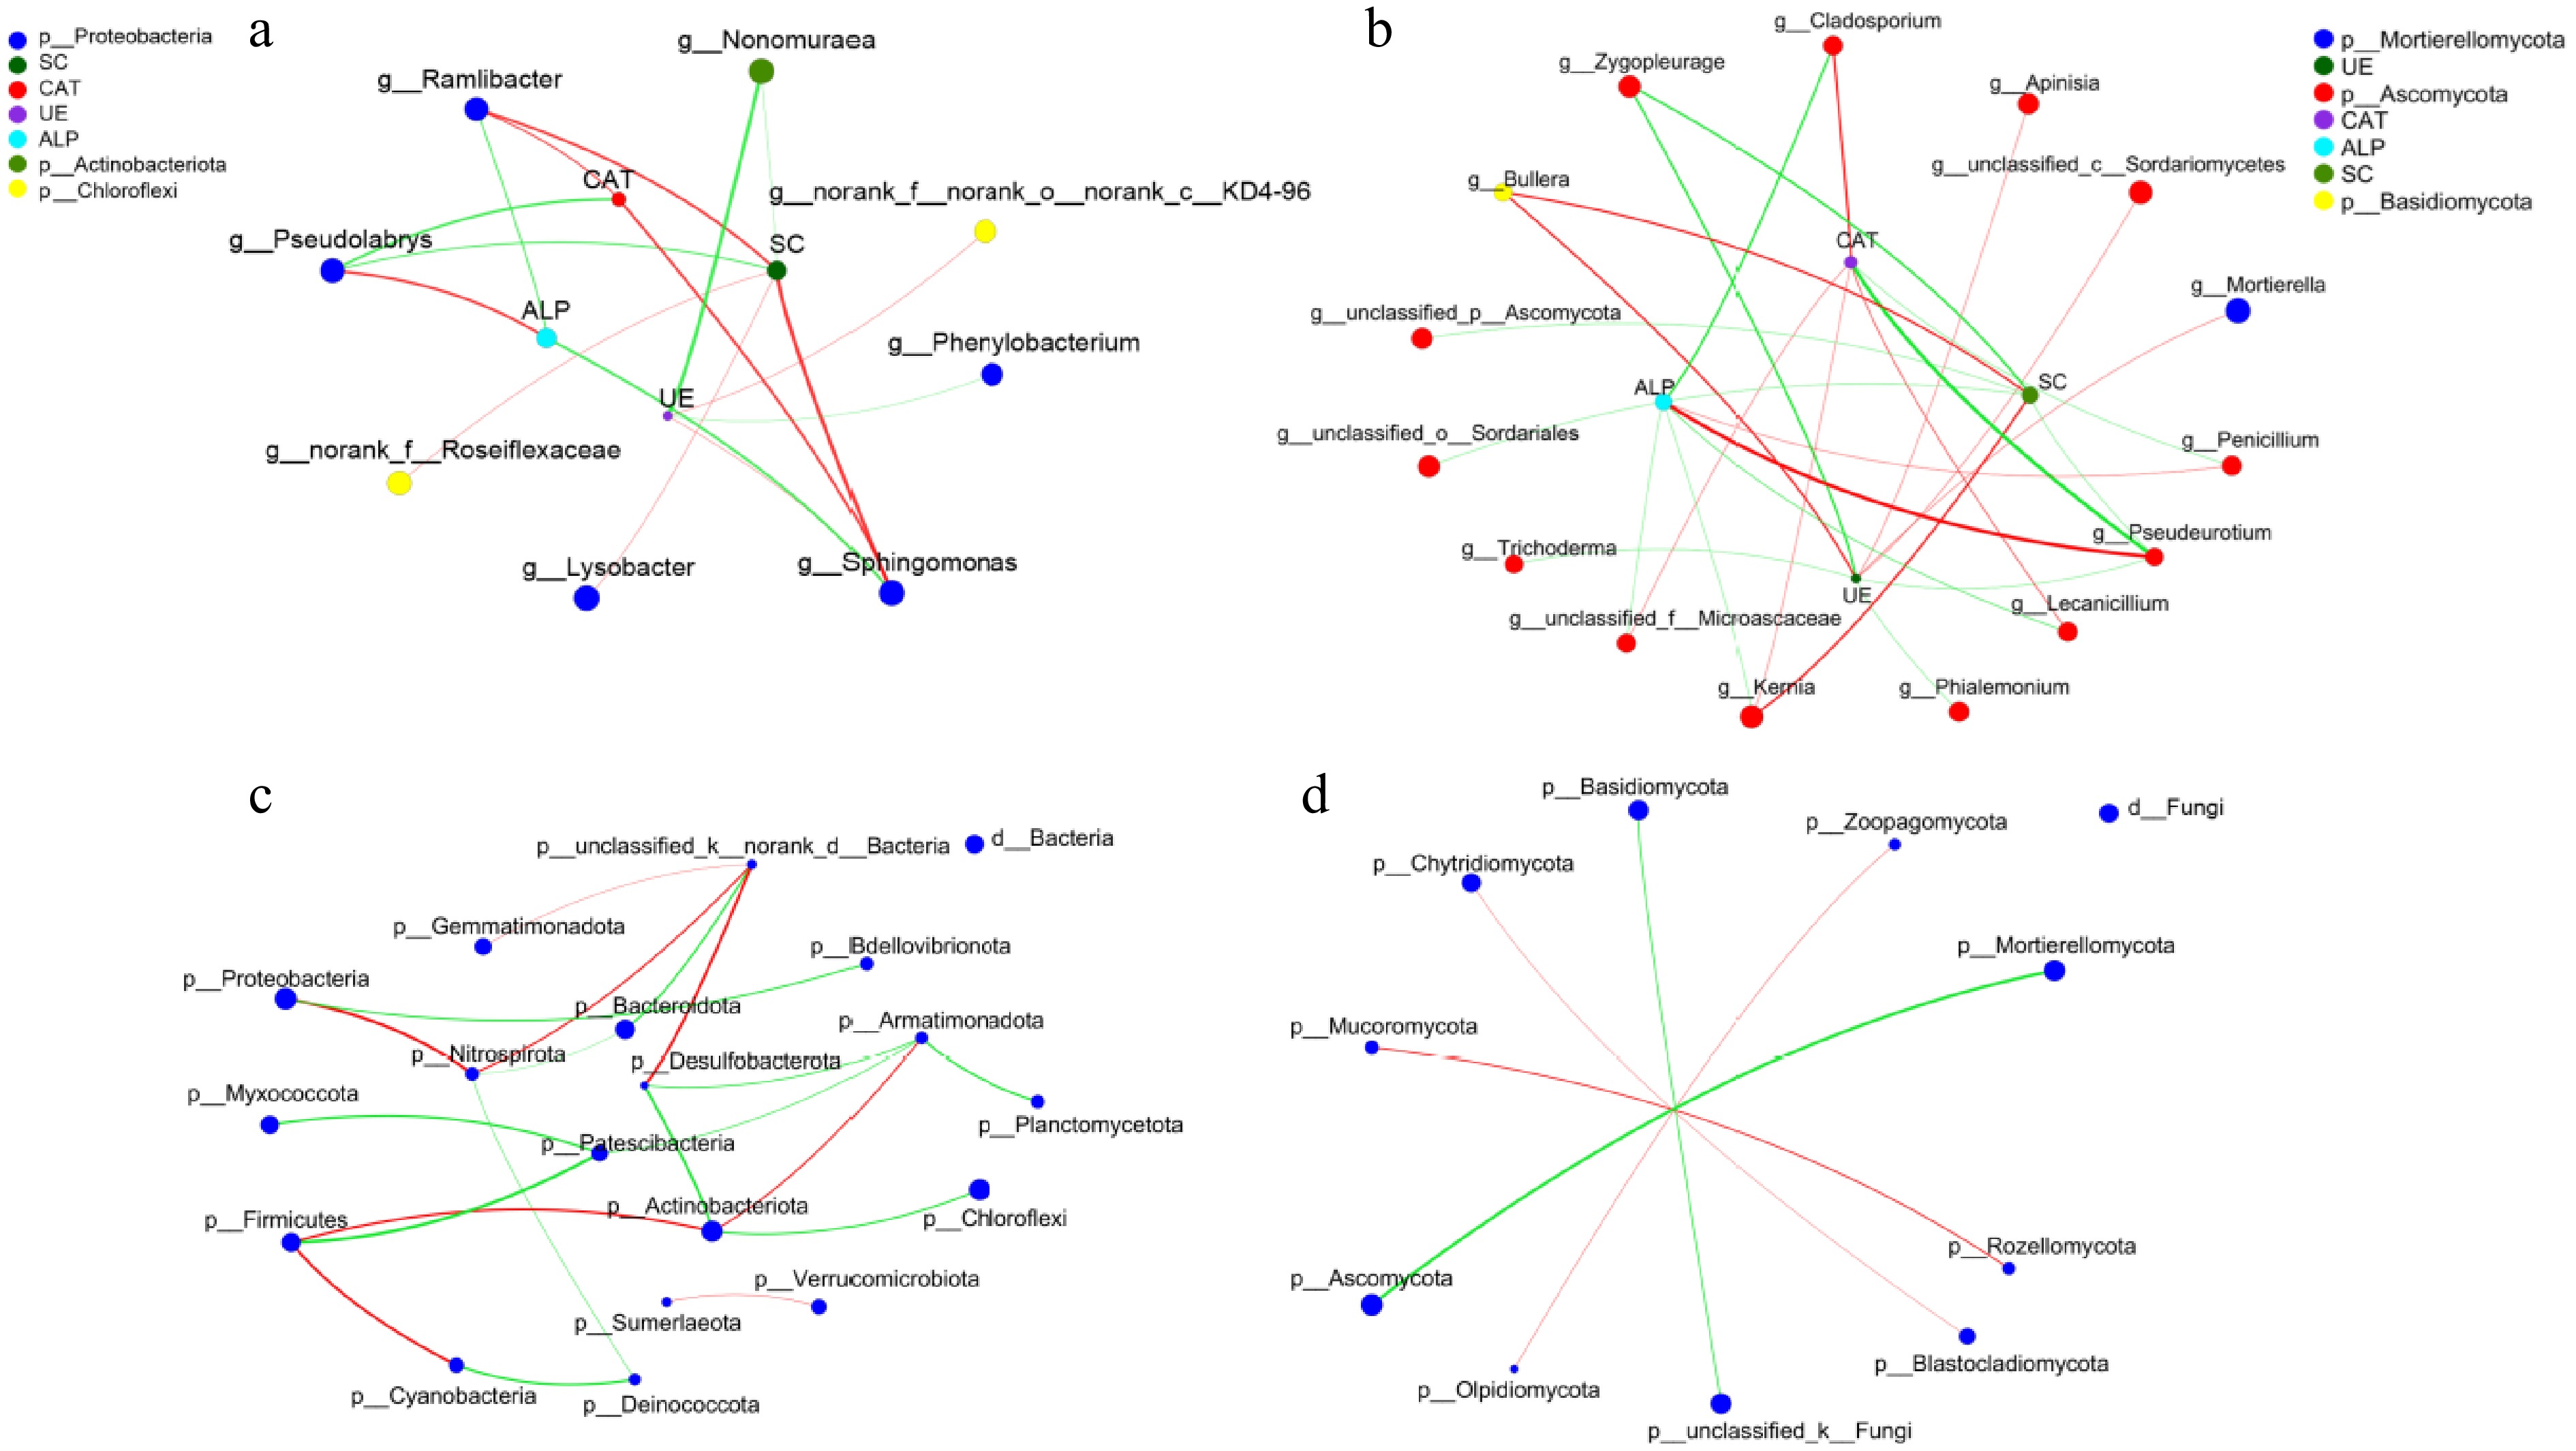
Figure 8.
The correlations between different (a) bacterial and (b) fungal genera with soil enzyme activities. The microbial interactions in different (c) bacterial and (d) fungal phylum.
At the phylum level, co-occurrence networks of microbial interactions were constructed (Fig. 8c & d). In bacteria, Nitrospirota, Actinobacteriota, and Armatimonadota were the critical factor. Proteobacteria were the most abundant, positively correlated with Nitrospirota, and negatively correlated with Bdellovibrionota. In fungi, the contribution of each fungus was the same, and Ascomycota was the most abundant and negatively correlated with Mortierellomycota.
The Shannon index, CAT activity, and UE activity were significantly positively correlated with root indexes, and ALP activities were negatively correlated with root indexes (Table 4). In conclusion, the interaction of soil microbial diversity with soil enzymes can promote root growth, which promotes the growth of the aboveground parts.
Table 4. Correlation analysis between soil microbial diversity, enzyme activities, and the root system.
Root length Root surface area Root volume Shannon 0.956** 0.945** 0.817* Simpson −0.982** −0.988** −0.937** Ace 0.493 0.384 0.487 Chao1 0.699 0.696 0.785 Catalase 0.971** 0.954** 0.973** Urease 0.926** 0.904* 0.795 Alkaline phosphatase −0.875* −0.821* −0.877* Sucrase 0.775 0.693 0.726 ** significant correlation at the 0.01 level; * significant correlation at the 0.05 level (2-tailed). -
Irrigation is an important agronomic measure that plays a crucial role in vegetable production. The frequency of drip irrigation significantly affected various aspects of tomato plant growth, including plant height, stem diameter, chlorophyll content, photosynthetic parameters, and yield during a long growing season. As the growth period extended, both plant height and stem diameter continuously increased. Additionally, a decrease in drip irrigation frequency initially led to an increase and then a subsequent decrease in tomato stem diameter (Fig. 2a & b). Furthermore, the root surface area, root volume, and root activity initially increased, and this was followed by a decrease as the drip irrigation frequency decreased (Fig. 2). Notably, the chlorophyll content, Gs, Tr, Pn, and yield of tomatoes peaked in T2 (Fig. 1c–g). These findings suggest that an appropriate drip irrigation frequency is beneficial for overall plant growth as well as the Pn[28] and yield[11,29]. It also increases the water utilization efficiency in T2, reaching 57.07 kg·m−3. This can be attributed to the fact that high-frequency irrigation may result in excessive water accumulation on the soil surface or shallow layers, which may not be effectively utilized by the root system and can have a negative effect on plant growth[5]. Moreover, when temperatures are low during the winter, high-frequency irrigation can elevate greenhouse humidity levels, which leads to increased susceptibility to diseases[30,31]. Conversely, when the irrigation frequency is low but the water applied per session is high, water can leak below the root system, which results in an inadequate moisture supply within the rhizosphere; this imposes stress on root development, affects overall plant growth and reduces yields[32,33].
Irrigation management has a strong effect on the soil microbial community, as well as its structure and composition[34,35]. Soil moisture is one of the main drivers of microbial activity. The results of this study demonstrate that the irrigation frequency has a significant effect on the α diversity and abundance of bacteria and fungi. The Chao index was used to estimate the abundance of bacteria and fungi under two different irrigation conditions; the abundance of bacteria was high in T2, and the abundance of fungi was high in CK1. Furthermore, the Shannon index (p < 0.05) was used to assess bacterial and fungal diversity, and bacterial diversity was significantly higher in T2 than in CK1; fungal diversity was notably higher in CK1 than in T2. The drip irrigation frequency altered the abundance of bacteria and fungi in tomato soil at the phylum, genus, and OTU levels (Fig. 5, Supplementary Figs S3 & S4). However, there was no significant difference between the CK1 and T2 groups at the phylum level (Supplementary Fig. S3), thereby modifying the abundance of functions (Figs 6 & 7). Sphingomonas were present in much higher quantities in T2 than in CK1. norank_f_AKYG1722, Pseudallescheria and Arthrobotrys was more abundant in the CK1 than in T2 (Fig. 4). These findings suggest that irrigation frequency can affect microbial diversity and community structure in soil, which leads to a shift from more favorable conditions for bacteria towards fungi as soil dryness increases. This shift may be attributed to the increased availability of nitrogen and organic carbon for soil microorganisms at an appropriate irrigation frequency[33,36]. There have been studies suggesting that Sphingomonas has the potential to promote plant growth and enhance yield[37,38]. Additionally, changes in root exudate composition due to drip irrigation frequency promotes alterations in soil bacterial and fungal communities[39,40].
Soil enzyme activities are thought to play a key role in mediating decomposition and nutrient turnover. Soil enzyme activity first increased and then decreased as the irrigation frequency decreased, indicating that an excessively high or low irrigation frequency was not conducive to improvements in enzyme activity (Fig. 2). According to co-occurrence network analysis, there was a strong positive correlation between soil enzyme activities and microbial communities (Fig. 8a & b). Soil enzyme activity was a key factor in the network analysis, and soil enzyme activity was significantly higher in T2 than in CK1 (Fig. 2). In addition, correlation analysis showed that soil microbial diversity and enzyme activity can promote root development (Table 4). This may be due to the appropriate drip irrigation frequency creating a favorable environment for microorganisms in the root zone and maintaining optimal soil pH and conductivity, which helps to increase soil enzyme activity[41,42]. This may also be attributed to the role of drip irrigation in enhancing the stability of soil aggregates in greenhouses, as well as its contribution to protecting enzyme activity through these soil aggregates[43].
-
In this study, drip irrigation with the tomato nutrient solution of Yamazaki (1978) every 4 d significantly increased the chlorophyll content of tomato leaves, as well as the Pn. Additionally, it improved root activity, length, volume, and surface area, ultimately leading to an increase in tomato yield. Furthermore, the application of drip irrigation with the tomato nutrient solution of Yamazaki (1978) every 4 d resulted in an increase in the abundance of Sphingomonas and a reduction in the abundance of norank_f_AKYG1722, Pseudallescheria, and Arthrobotrys. This also led to increases in soil enzyme activities and improvements in the soil microecological environment. Therefore, drip irrigation with the tomato nutrient solution of Yamazaki (1978) every 4 d promotes the growth of tomatoes, increases tomato yield, and improves the microecological environment of the soil. In summary, the tomato nutrient solution of Yamazaki and the general trace element formula can be applied every 4 d to optimize long-season tomato cultivation.
This work was supported by the Shandong Provincial Key Research and Development Program (2022LZGC009), the Taishan Scholar Program of Shandong Province (Grant No. tsqnz20240804), the earmarked fund for the Key Research and Development Program of Shandong Province (2021CXGC010810), and the Key Research and Development Program of Ningxia Hui Autonomous Region (2023BCF01042).
-
The authors confirm contribution to the paper as follows: study conception and design: Yang F, Wei M, Li J; data collection: Meng Q; analysis and interpretation of results: Liu X, Meng Q; manuscript preparation: Liu X, Meng Q; manuscript review and editing: Yang F, Ji T; manuscript revision and data re-analysis: Chen Q, Yang F, Ji T. All authors reviewed the results and approved the final version of the manuscript.
-
All data generated or analyzed during this study are included in this published article and its supplementary information files. The raw data of the sequences used during the current study are available from the corresponding author on reasonable request.
-
The authors declare that they have no conflict of interest.
-
# Authors contributed equally: Qi Chen, Xigang Liu
- Supplementary Fig. S1 The effect of CK1 and T2 on the moisture content of tomato soil after planting for 60−270 days.
- Supplementary Fig. S2 Shannon–Wiener curves (a, b) and rarefaction curves (c, d) of bacteria and fungi at the OTU level according to Illumina MiSeq data.
- Supplementary Fig. S3 Wilcoxon rank-sum test chart of the bacterial phylum.
- Supplementary Fig. S4 Relative abundances reflect the distribution of OTU-level dominant bacteria (a) and fungi (b) in CK1 and T2.
- Supplementary Fig. S5 The functional heatmap predicted by PICRUSt2 in bacteria (a) and fungi (b) in CK1 and T2.
- Copyright: © 2025 by the author(s). Published by Maximum Academic Press, Fayetteville, GA. This article is an open access article distributed under Creative Commons Attribution License (CC BY 4.0), visit https://creativecommons.org/licenses/by/4.0/.
-
About this article
Cite this article
Chen Q, Liu X, Meng Q, Li J, Wei M, et al. 2025. Drip irrigation frequency influences the composition of soil microbial communities and enzyme activities, and improves the growth and yield of long-season cultivated tomatoes. Vegetable Research 5: e016 doi: 10.48130/vegres-0024-0042 

Drip irrigation frequency influences the composition of soil microbial communities and enzyme activities, and improves the growth and yield of long-season cultivated tomatoes
- Received: 13 June 2024
- Revised: 31 October 2024
- Accepted: 06 November 2024
- Published online: 26 May 2025
Abstract: Protected vegetable production relies on drip irrigation for precise water and fertilizer delivery, which modifies the root zone microenvironment and microbial structure to influence yield and quality. In this study, compared with the conventional water and fertilizer treatment as a control (CK1), by using the tomato nutrient solution of Yamazaki, equal quantities of water and fertilizer were provided over a 12-d cycle, but with differing frequencies among the groups: every 12 d (CK2), 6 d (T1), 4 d (T2), and 2 d (T3). Results showed stem diameter and net photosynthetic rate were 4.1%, 4.9%, 5.5%, and 2.5% and 37.1%, 7.9%, 9.7%, and 8.9% higher in T2 than in CK1, CK2, T1, and T3, respectively. The root surface area and root volume were 59.0%, 62.1%, 29.1%, and 16.3% and 34.1%, 43.4%, 25.1%, and 17.0% higher in T2 than in CK1, CK2, T1, and T3, respectively. Furthermore, the yield was 12.2% higher in T2 than in CKl, and WUE was 12.2% higher in T2 than in CKl. The richness and diversity of bacteria were higher in T2 than in CK1, and the abundance and diversity of fungi were inversely related. The abundance of the genera Sphingomonas, Arthrobacter, and Ramlibacter increased, whereas that of Mycothermus decreased. Network and correlation analyses demonstrated that microorganisms and enzyme activities could interact to enhance the capacity of root systems to acquire nutrients from the soil. The present findings will aid the development and use of drip irrigation strategies in tomato cultivation in protected areas.