


-
Smoking remains one of the leading preventable causes of morbidity and mortality worldwide, contributing to numerous health issues such as cardiovascular disease, respiratory illnesses, and various forms of cancer[1]. Despite a general decline in smoking rates over the past few decades, a significant portion of the population continues to smoke, highlighting the ongoing need for effective smoking cessation interventions[2].
Nicotine Replacement Therapies (NRTs) are among the most extensively used, and scientifically validated pharmacological aids for smoking cessation. Approved by the US Food and Drug Administration (FDA), NRTs-such as patches, gums, and lozenges-deliver controlled doses of nicotine to alleviate withdrawal symptoms and reduce the urge to smoke, without exposing users to the harmful substances found in tobacco smoke[3,4]. Each form offers different modes of delivery and convenience, allowing users to select a product best suited to their preferences and smoking patterns. Clinical studies have demonstrated that NRTs can significantly increase the chances of successful smoking cessation, compared to placebo or no treatment. They are often recommended as part of a comprehensive cessation program that includes behavioral support and counseling[5,6].
Historically, increases in NRT sales have coincided with major public health campaigns and policy changes, such as the implementation of smoke-free laws, tax increases on tobacco products, and mass media anti-smoking advertising[7,8]. These interventions often motivate smokers to attempt quitting, leading to a higher demand for cessation aids[9]. Conversely, stagnation or decline in NRT sales may indicate diminishing public interest, market saturation, changes in public health policy, or competition from alternative products. Despite the availability of NRTs, smoking cessation remains challenging, and relapse rates are high[10,11].
E-cigarettes have introduced a complex variable into this landscape, and the appeal of e-cigarettes soon extended to young adults, and even adolescents[12−14]. Between 2015 and 2017, JUUL became the leading e-cigarette brand in the US, surpassing tobacco industry competitors, with increased competition prompting strategic pricing adjustments[15−18]. Similarly, the unit prices of NRT products have experienced variations over the years. While inflation-adjusted prices have remained relatively stable, the introduction of generic alternatives and over-the-counter options has increased accessibility and affordability for consumers[19]. The 2019 EVALI outbreak raised safety concerns, prompting investigations into e-cigarette aerosols, yet e-cigarettes remain a major market presence, requiring ongoing public health research[20,21]. These pricing trends have influenced consumer choices between traditional NRTs and e-cigarettes, impacting overall sales volumes and market shares. Some evidence suggests that e-cigarettes may serve as substitutes for traditional NRTs for certain individuals attempting to quit smoking[22]. However, the lack of regulatory oversight, variations in product quality, and inconsistent evidence regarding their efficacy in smoking cessation pose challenges[23]. Continued research into the factors affecting NRT utilization, including seasonal trends, is essential for enhancing the support provided to individuals attempting to quit smoking, and for developing targeted interventions that address the barriers to successful cessation.
Purpose of the study
-
This study aims to investigate the trends and seasonal patterns in the sales of FDA-approved NRT products in the US from February 2006 to November 2020. By conducting a comprehensive analysis of sales data across different seasons, the research seeks to understand how consumer demand for various NRT products—specifically nicotine patches, gum, and lozenges—fluctuates throughout the year[24].
The study examines whether significant differences in NRT sales exist over the years and among the four seasons (Winter, Spring, Summer, and Fall), as well as exploring potential reasons behind these variations. By identifying which NRT products exhibit notable seasonal fluctuations, the research aims to provide insights into periods when individuals are more likely to attempt quitting smoking, and the type of cessation aids they prefer during these times.
-
This study utilized weekly sales data for FDA-approved over-the-counter NRT products[25], obtained from NielsenIQ, covering the period from February 2006 to November 2020. Data was accessed through the University of Chicago Booth School of Business (USA) via the Kilts Center, using the Globus cloud environment. The dataset included sales figures across the US for nicotine patches, gum, and lozenges, providing a comprehensive overview of NRT utilization over 15 years. The NRT products analyzed in this study included nicotine patches, which were available in 7, 14, and 21 mg strengths; nicotine gum, available in 2 and 4 mg strengths; and nicotine lozenges, available in 2 and 4 mg strengths. Inhalers and nasal sprays were excluded because they are prescription-only products, and also, they have negligible sales volumes and incomplete data regarding nicotine strength and quantity per package.
For each week, total sales were calculated both in monetary value (US dollars), and total nicotine content (in milligrams, mg) for each product type and strength. To account for inflation and ensure comparability over time, all sales data were adjusted to the Consumer Price Index (CPI) of November 2020, using data from the US Bureau of Labor Statistics[26]. This adjustment allowed for accurate analysis of sales trends in real terms.
The weekly data were then aggregated by year and season to examine trends and potential seasonal variations. Seasons were defined based on the months listed in the date column, as the variability in the week start dates made it challenging to identify the exact date of the 21st of each month, to align perfectly with seasonal definitions. Accordingly, seasons were defined as winter, which included December, January, and February; spring encompassed March, April, and May; summer consisted of June, July, and August; and fall included September, October, and November. Then the year period was considered from December to November. Within each season, descriptive statistics were calculated for total sales, and total nicotine content sold.
Statistical analysis
-
The Seasonal and Trend decomposition using the LOESS (STL) method was utilized for decomposing time series data using locally weighted regression (LOESS)[27]. STL internally applies LOESS with algorithmically generated weights, based on the distance of each point from the target value, typically using a tri-cube weight function. In Time Series Analysis, decomposition is a comprehensive technique used to break down a time series into its underlying components, such as trend, seasonality, and random noise, to better understand its structure. The STL method was chosen due to its flexibility in handling non-linear trends and irregular seasonality, making it particularly suitable for complex time series data. Unlike traditional decomposition methods, STL can effectively manage outliers and adapt to changes in seasonal patterns over time, ensuring more accurate and robust results for forecasting and analysis[27].
An Analysis of Variance (ANOVA) was conducted to test significant differences in mean total sales and mean total nicotine content sold among the four seasons for each NRT product type and for all products combined. The ANOVA assessed whether the observed differences in means across seasons were statistically significant.
The specific analyses performed included assessing total sales (in US dollars), and total nicotine content sold (in milligrams). For total sales, the analysis was first conducted for all NRT products combined to test for overall trends and seasonal differences in sales revenue. Separate ANOVAs were then performed for each NRT product type (i.e., nicotine patches, gum, and lozenges) to identify product-specific trends and seasonal patterns. Similarly, for total nicotine content sold, the analysis was conducted for all NRT products combined to assess trends and seasonal differences in the total amount of nicotine sold.
For each ANOVA, the F-statistic and corresponding p-value were calculated. A p-value less than 0.05 was considered statistically significant. When significant differences were found, post hoc tests (e.g., Tukey's Honest Significant Difference) were conducted to determine which seasons differed from each other.
-
During the study period, the highest sales of NRT products were recorded in 2007, totaling
${\$} $ ${\$} $ The seasonal average of all NRT sales declined from 2006 to 2014. In contrast, nicotine quantity exhibited an upward trend, despite experiencing dips in 2010 and 2014 (Fig. 1).
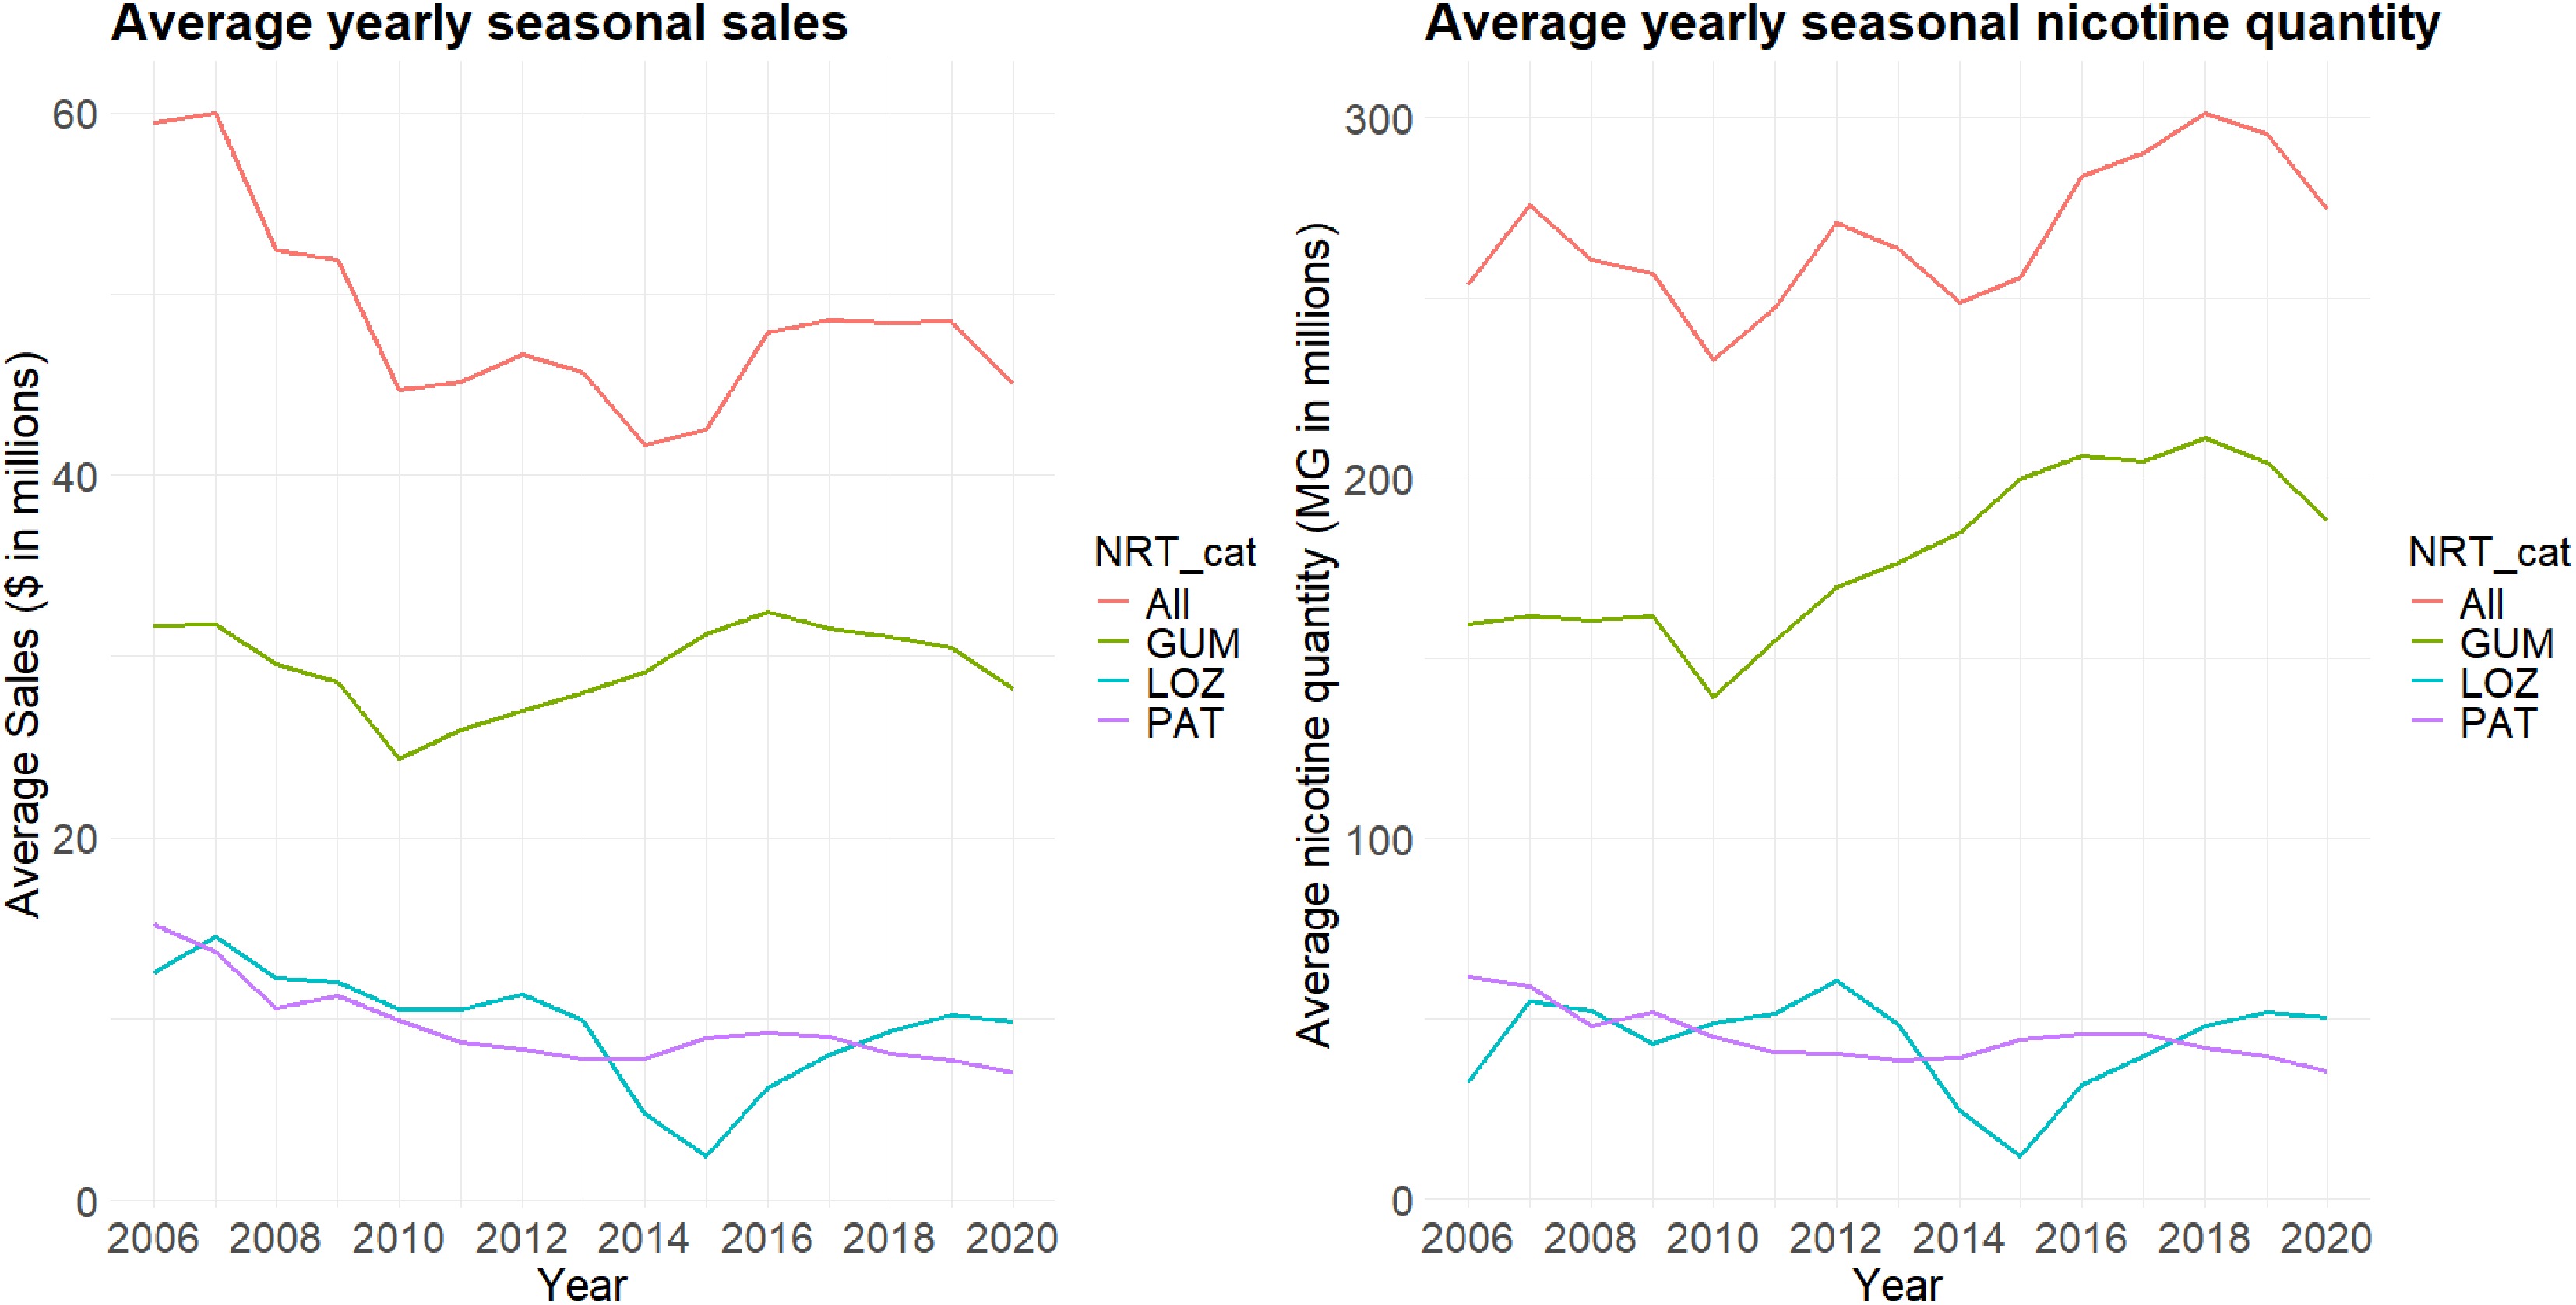
Figure 1.
Average yearly seasonal CPI adjusted NRT sales in million dollars, and average yearly seasonal nicotine quantity in million milligrams for all NRT products.
The analysis of average seasonal sales across all products revealed that the standard deviation was highest in Spring and Winter, indicating greater sales variability during these seasons. For nicotine patches, the standard deviation of sales and nicotine content was also higher in Winter and Spring, reflecting the significant seasonal fluctuations observed (Table 1).
Table 1. Seasonal NRT sales and nicotine quantity.
NRT product Season Mean Median sd Min Max F (p) CPI adjusted NRT sales in million dollars Nicotine replacement gum Winter 29.40 29.84 2.60 25.51 33.34 0.784 (0.508) Spring 30.16 30.87 2.54 25.59 32.86 Summer 29.06 29.61 2.56 23.77 32.06 Fall 28.80 29.44 2.66 22.46 31.99 Nicotine replacement lozenges Winter 9.80 10.23 3.68 0.22 15.81 0.169 (0.917) Spring 9.96 9.79 3.50 1.74 15.53 Summer 9.30 10.25 3.19 2.01 13.87 Fall 9.23 10.30 3.21 0.61 12.97 Nicotine replacement patches Winter 10.36 10.05 2.48 7.80 17.88 2.207 (0.098) Spring 10.15 8.99 2.82 7.14 16.59 Summer 8.79 8.06 1.95 6.62 13.82 Fall 8.58 7.92 2.11 6.47 15.10 All NRT products Winter 49.56 48.21 5.65 41.51 65.06 1.463 (0.235) Spring 50.27 47.95 6.86 41.28 63.65 Summer 47.15 46.74 5.15 36.98 57.65 Fall 46.60 46.23 5.00 37.13 58.40 Nicotine quantity in million milligrams Nicotine replacement gum Winter 183.12 173.27 25.95 147.18 220.52 0.379 (0.768) Spring 182.06 179.41 18.98 147.17 206.14 Summer 176.12 174.35 24.33 133.76 216.44 Fall 175.84 175.22 25.73 128.91 218.42 Nicotine replacement lozenges Winter 46.55 49.55 15.85 1.33 67.44 0.395 (0.757) Spring 44.39 47.54 13.67 8.35 63.80 Summer 41.57 49.13 14.14 10.51 57.17 Fall 41.72 48.14 13.91 3.77 56.07 Nicotine replacement patches Winter 51.68 49.60 10.27 41.59 81.63 5.89 (0.001) Spring 47.14 43.46 9.94 35.20 67.76 Summer 41.19 40.02 6.19 33.36 56.81 Fall 40.20 39.59 6.67 32.39 60.85 All NRT products Winter 281.35 279.38 25.82 240.71 323.02 3.578 (0.012) Spring 273.59 281.16 15.84 243.77 292.21 Summer 258.88 263.48 25.04 218.76 307.08 Fall 257.76 255.88 24.84 218.02 309.65 Looking at specific products, nicotine gum showed slight variation in average total sales across seasons, ranging from USD
${\$} $ ${\$} $ For nicotine lozenges, there was minimal seasonal variation in both sales and nicotine content. Total average sales ranged from USD
${\$} $ ${\$} $ Nicotine patches, however, exhibited pronounced seasonal differences. Average total sales were lowest in the Fall (USD
${\$} $ ${\$} $ ${\$} $ ${\$} $ Applying STL to the aggregated NRT seasonal sales data revealed distinct components of trend, seasonality, and residual variations (Fig. 2). The 'data' panel represents the original time series, and the 'remainder' (or residual) component captures irregular spikes and drops, reflecting variations not explained by the identified trends or seasonality. The seasonal component demonstrated consistent annual fluctuations, with peak periods generally occurring in the Winter. The residual component captured irregular spikes and drops, reflecting variations not explained by the identified trends or seasonality. All NRT sales significantly declined from 2006 to 2014, followed by a slight increase through 2020, with the trend mostly flattening and showing a slight downward trajectory toward the end of 2020. Nicotine gum recorded its lowest sales in 2010, while lozenges reported their lowest in 2014. Nicotine patch sales consistently exhibited a downward trend from 2006 to 2020. In contrast, the nicotine quantity across all products showed a mixed pattern over time, with notable lows in 2010 and 2014, and a peak in 2018, reporting the highest nicotine quantity for all products (Fig. 3).
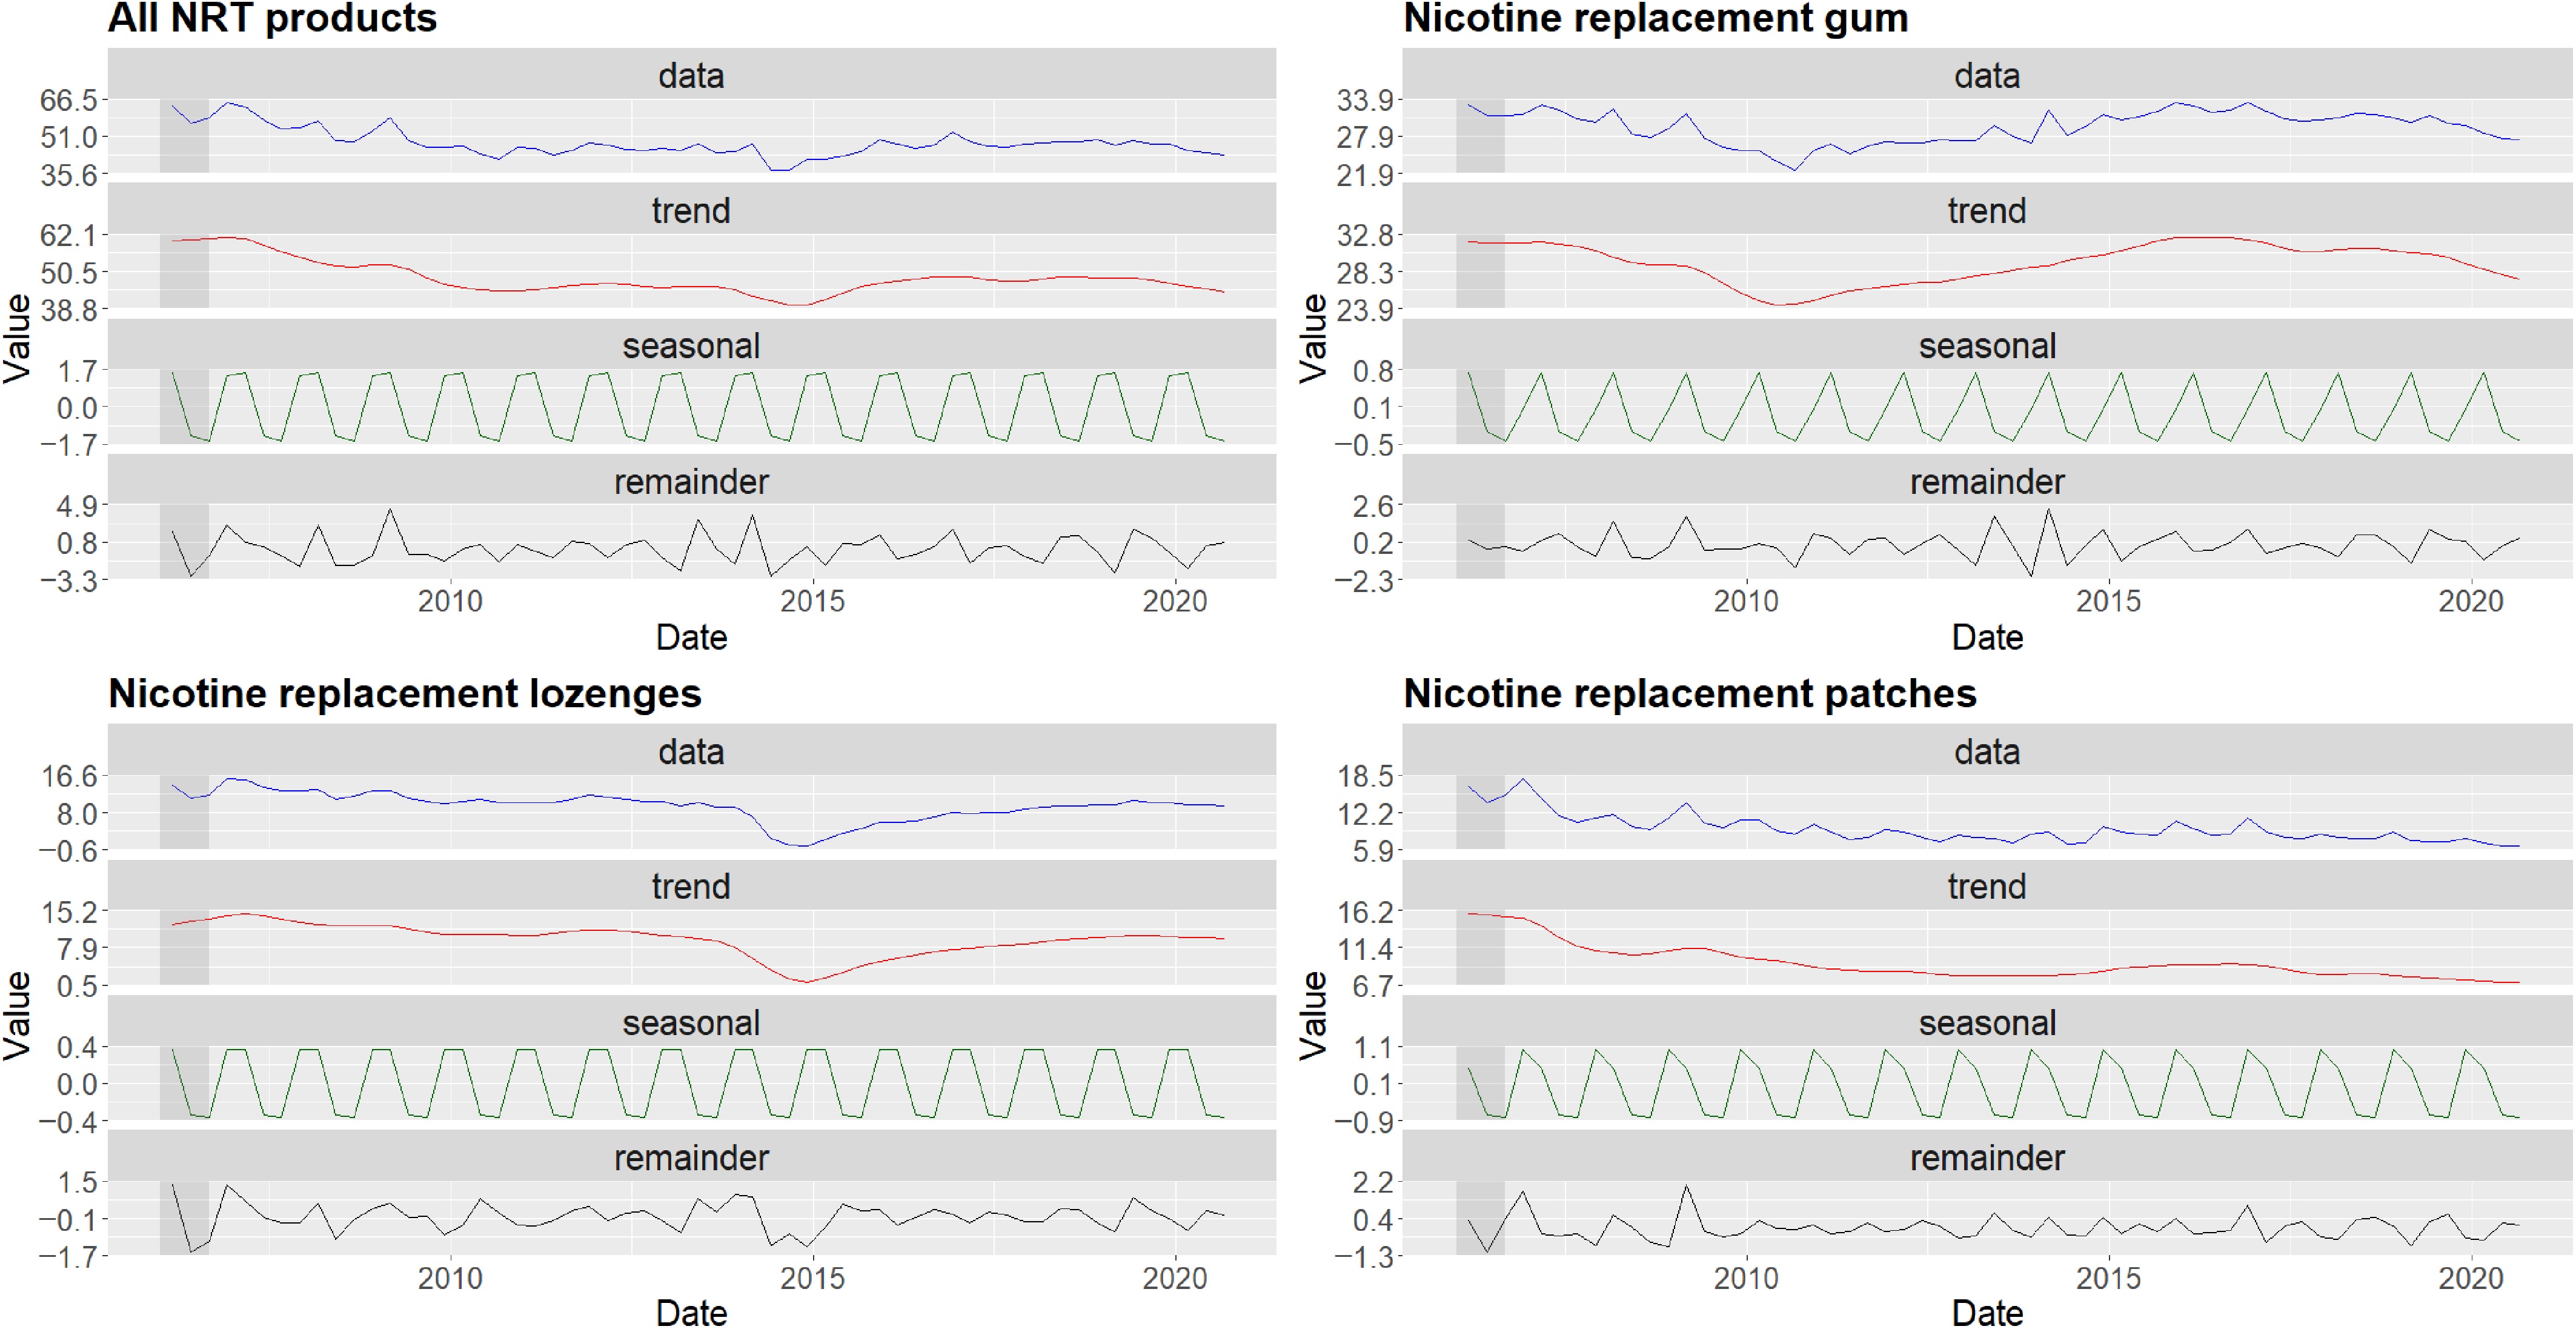
Figure 2.
STL decomposition of CPI adjusted NRT sales in million dollars by season for all NRT products, nicotine replacement gum, nicotine replacement lozenges, and nicotine replacement patches.
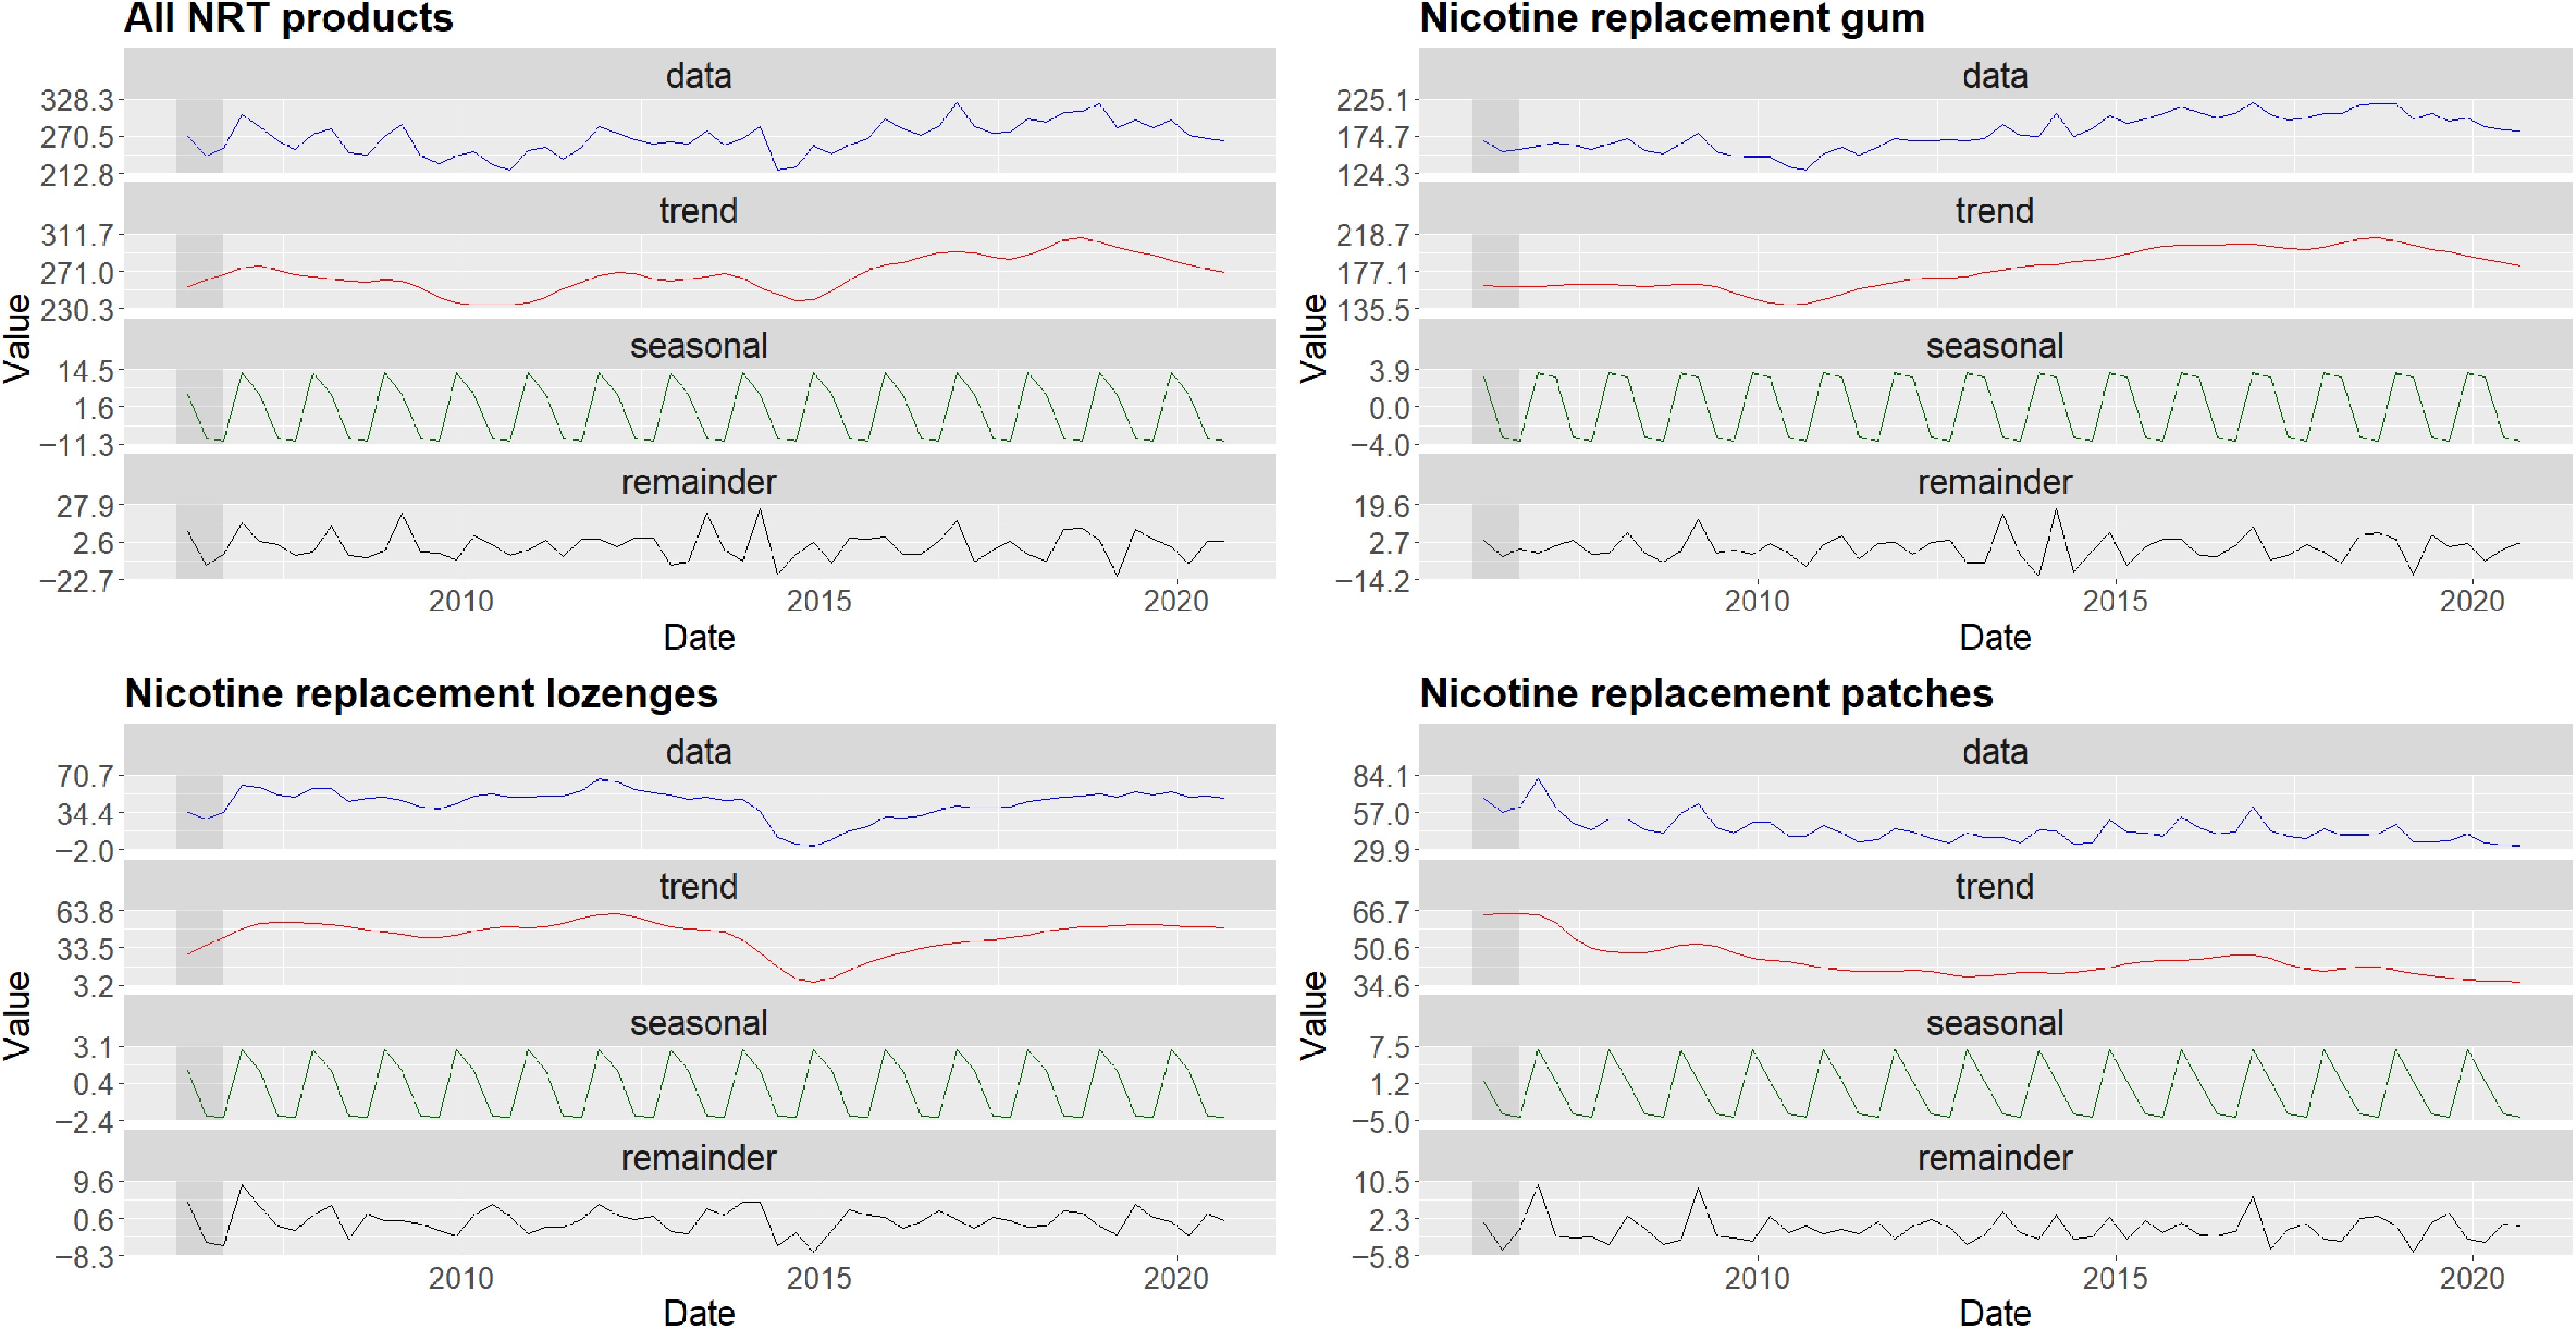
Figure 3.
STL decomposition of nicotine quantity in million milligrams by season for all NRT products, nicotine replacement gum, nicotine replacement lozenges, and nicotine replacement patches.
For specific product types, the STL decomposition highlighted varying trends and seasonality. For nicotine gum, the trend component showed a steady increase until 2018, mirroring the overall NRT sales trend. Seasonal peaks were particularly pronounced in the early months of each year, indicating a recurring pattern of higher sales in those periods. In the case of nicotine lozenges, the trend component showed a sharp decline until 2014, followed by a recovery phase. The seasonality was less consistent, and the residual component exhibited higher variability, reflecting fluctuating sales patterns across years. For nicotine patches, a clear downward trend was evident, with minimal seasonal variation. The residual component remained relatively stable, suggesting consistent sales patterns with little external disruption. The decomposition analysis of nicotine content followed similar trends and seasonal patterns to those observed in the NRT sales data.
The ANOVA test indicated that these differences in average total sales across seasons were not statistically significant for all products combined (F = 1.463, p = 0.235) (Fig. 4). However, when examining the total nicotine content sold, average values ranged from 281.35 million mg in Winter to 257.76 million mg in the Fall (Table 1) with the ANOVA test revealing a statistically significant difference in total nicotine sold among seasons for all products combined (F = 3.578, p = 0.012), suggesting that the amount of nicotine sold varied by season (Fig. 5).
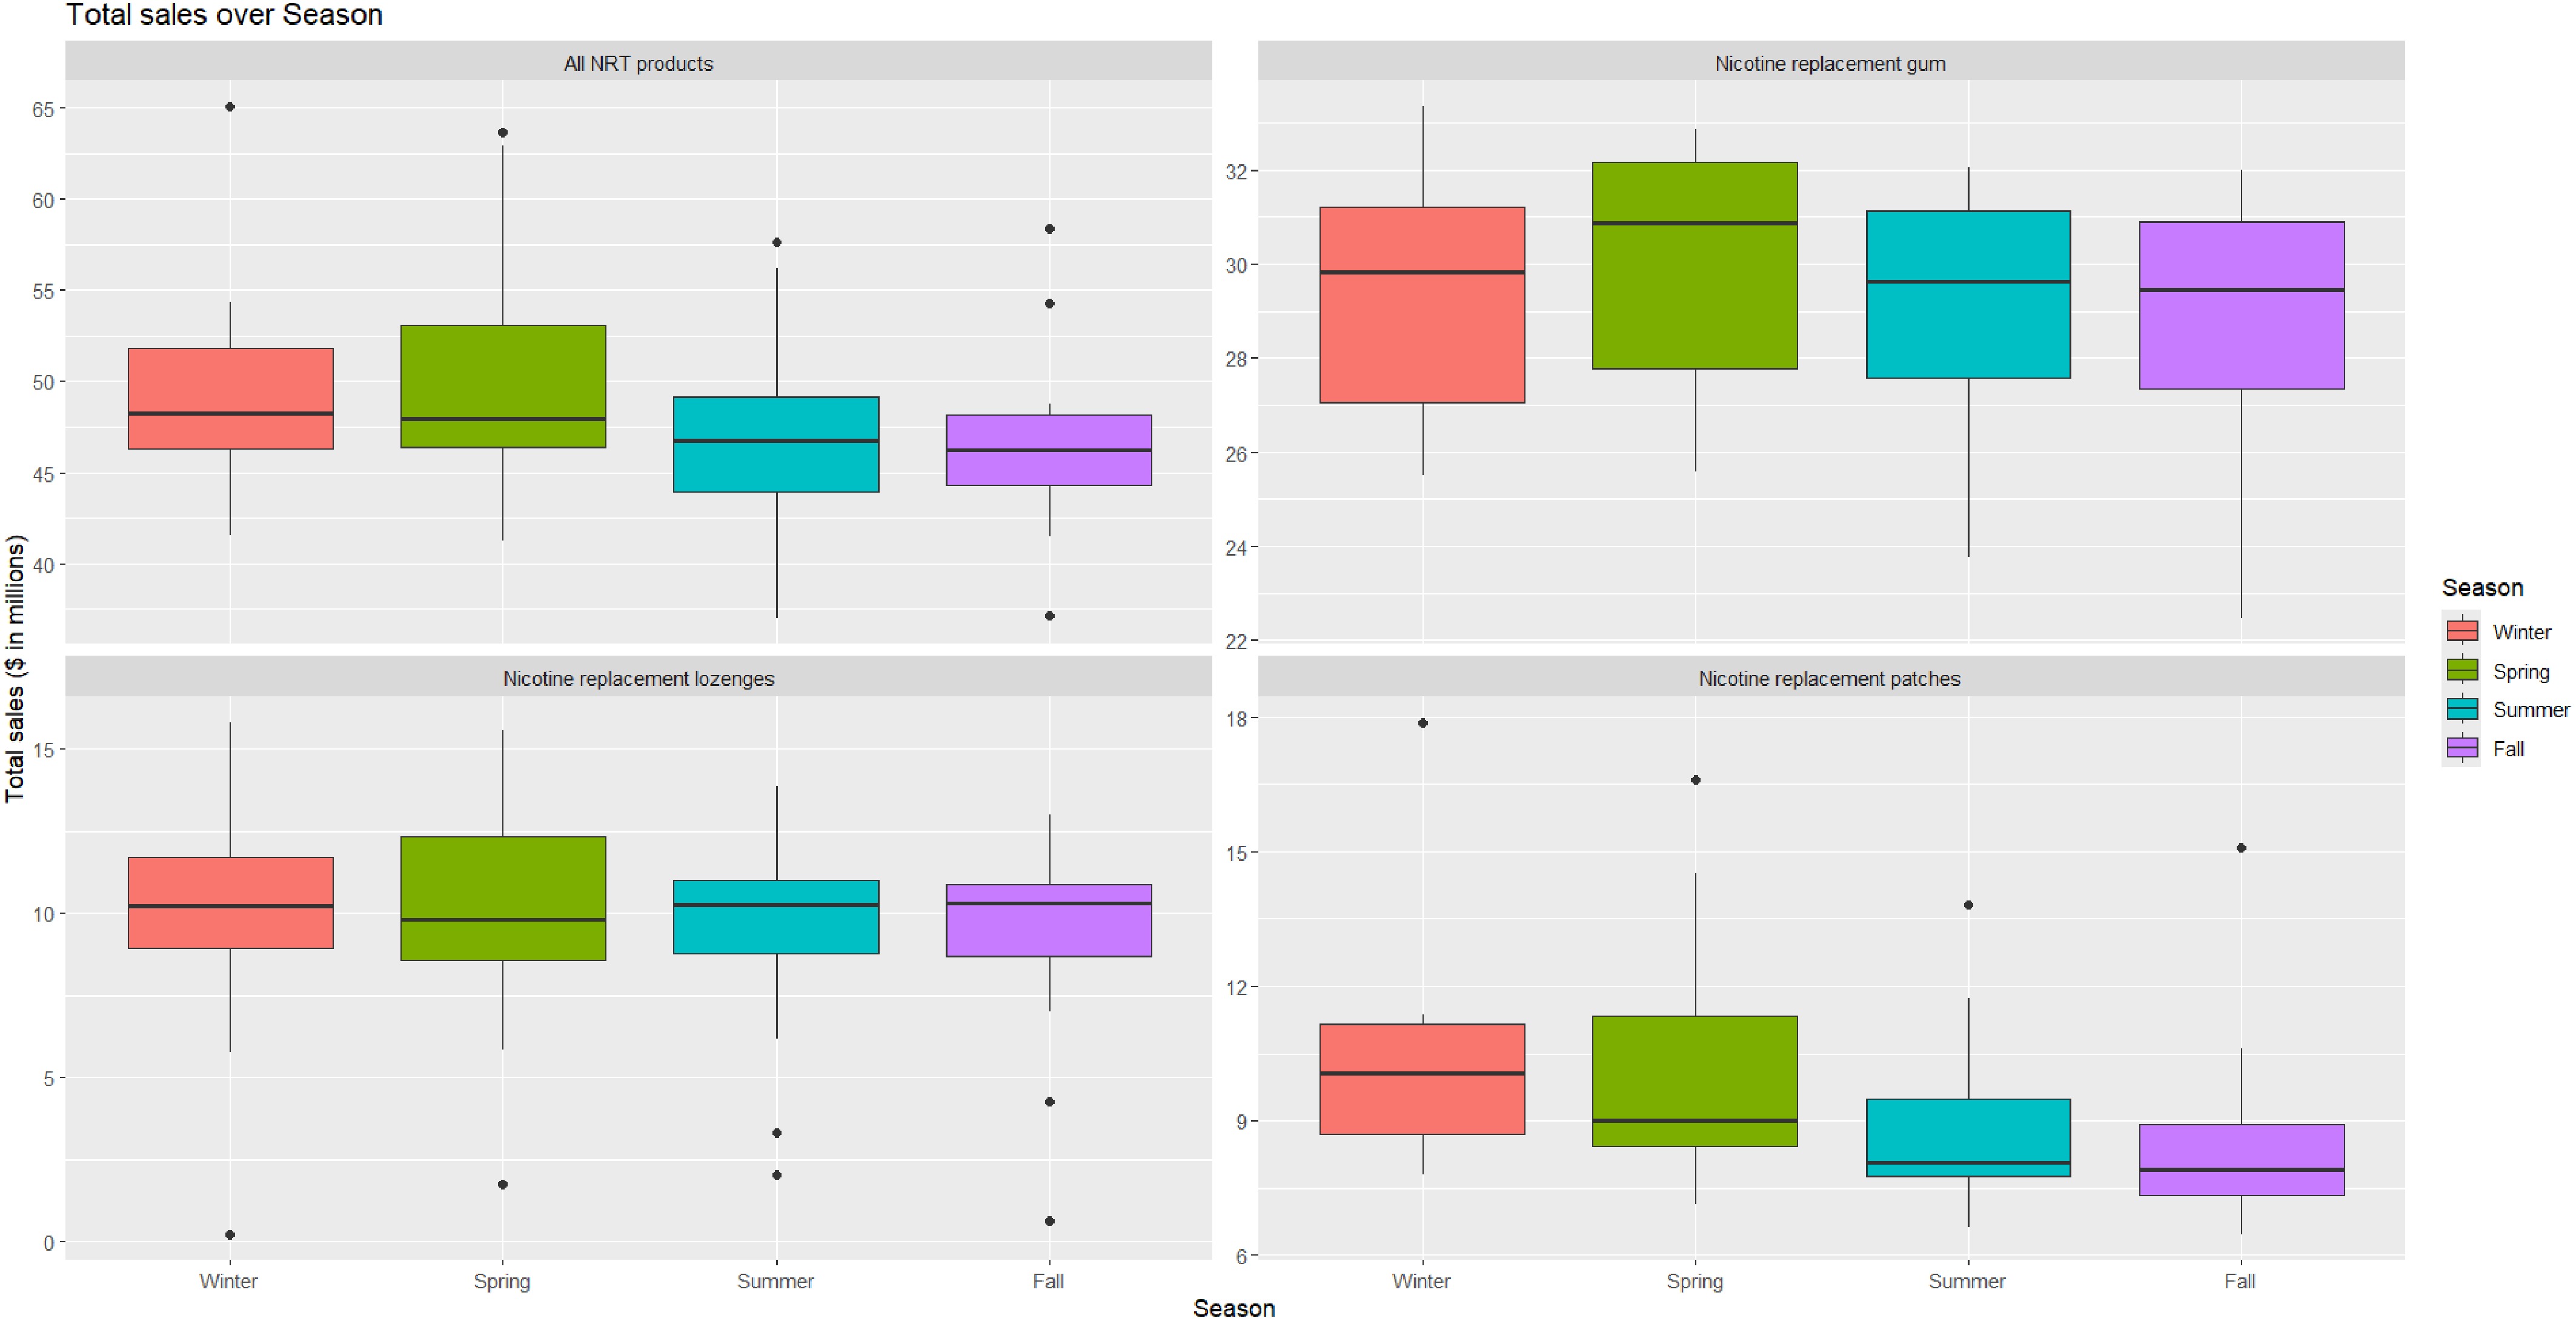
Figure 4.
Boxplot of CPI adjusted NRT sales in million dollars by season for all NRT, GUM, LOZ, and PAT.
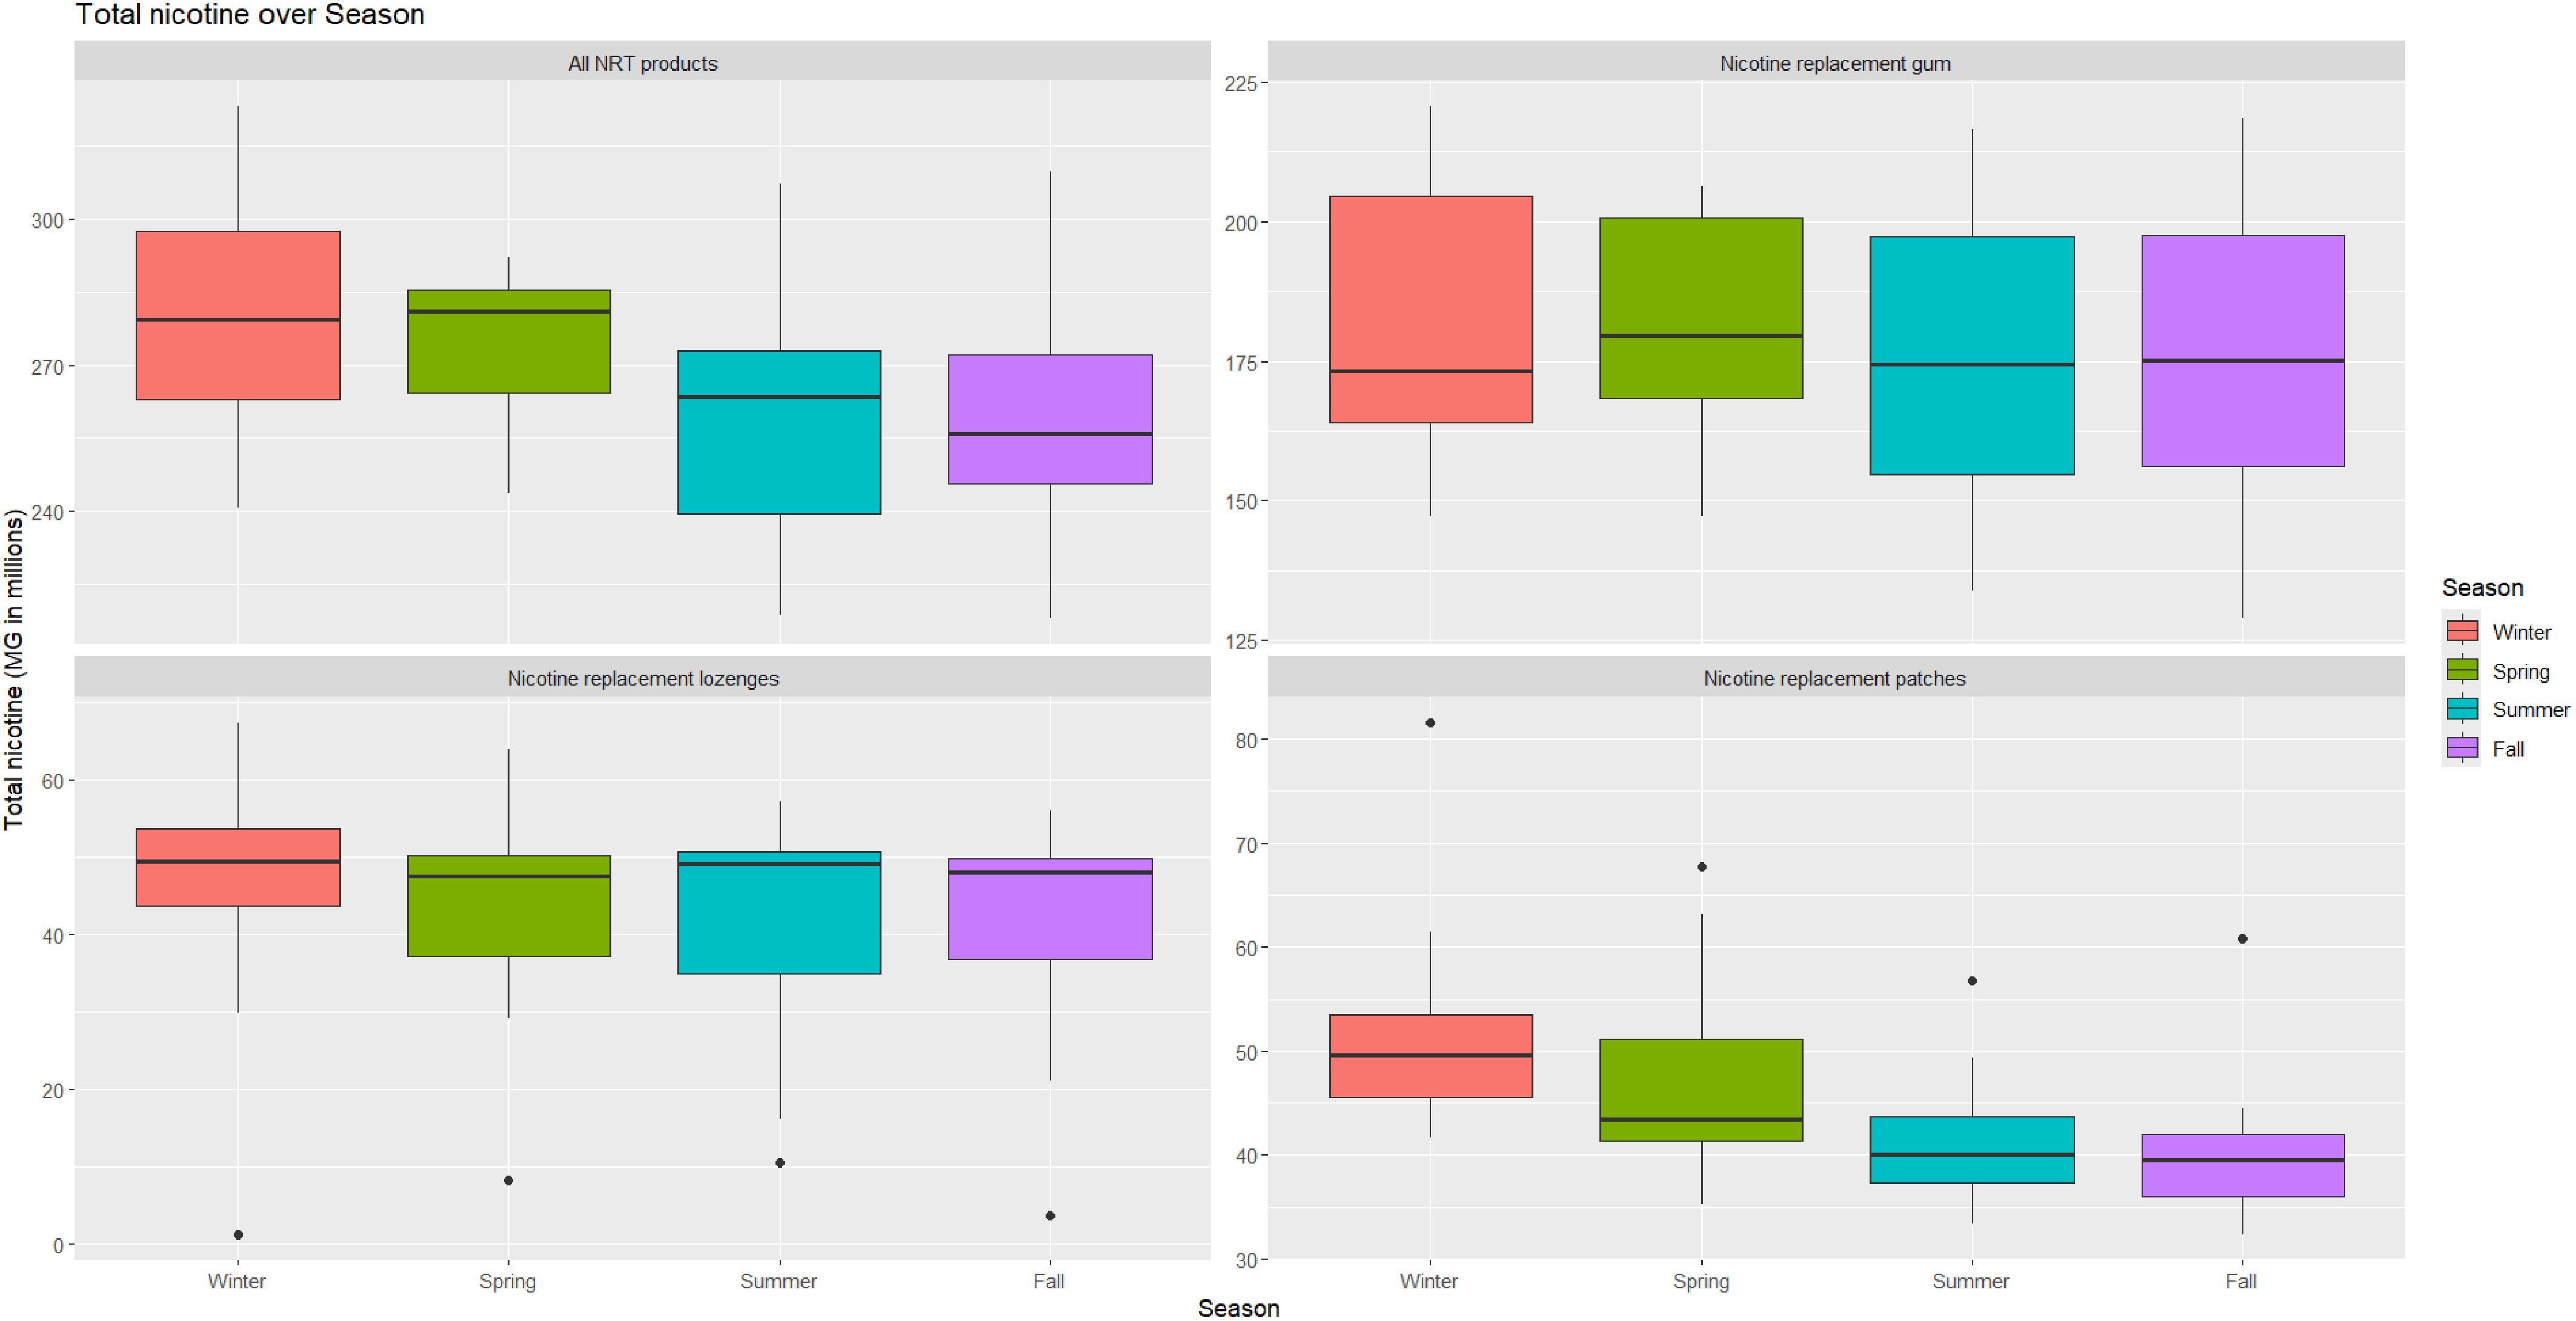
Figure 5.
Boxplot of nicotine quantity in million milligrams by season for all NRT, GUM, LOZ, and PAT.
-
This study analyzed both seasonal and overall trends in the sales of FDA-approved NRT products in the US from December 2006 to November 2020. The findings revealed that total NRT sales and total nicotine content sold were generally higher in the Winter and Spring seasons compared to Summer and Fall. This pattern may reflect seasonal factors influencing consumer behavior, such as increased quit attempts at the beginning of the year (e.g., New Year's resolutions), and during periods of colder weather. Specifically, nicotine patches exhibited statistically significant seasonal differences in total nicotine content sold, peaking in Winter and Spring. The significant ANOVA results for nicotine patches indicate that sales of this product type are more sensitive to seasonal variations compared to nicotine gum and lozenges. The lack of significant seasonal differences for gum and lozenges suggests more stable sales throughout the year for these products.
Sales data on smoking cessation products offer valuable insights into consumer behavior, market dynamics, and the effectiveness of public health initiatives. Understanding these trends and seasonal patterns is crucial for informing public health strategies and optimizing the timing, focus, and resource allocation of smoking cessation campaigns. By doing so, this analysis contributes to the broader effort of reducing smoking prevalence and promoting better health options and outcomes for individuals and communities. The seasonal peaks in NRT sales observed in the first and fourth quarters of each year align with previous findings of significant seasonal variations in the demand for smoking cessation treatments[28]. Studies have indicated higher enrolments and better treatment outcomes during specific seasons, suggesting that factors such as weather changes and traditional holiday periods can affect individuals' motivation and decision to quit. These climate and contextual influences, ranging from colder weather confining people indoors to common New Year's resolutions can collectively shape smoking cessation behaviors by altering daily routines, and providing added impetus for change.
Several randomized controlled trials, and large reviews have demonstrated that, when used together with behavioral support, e-cigarettes are more effective than NRT in smoking cessation overall[29−31], and in certain subgroups, such as pregnant women[32]. However, it is essential to recognize that e-cigarettes and NRT play distinct roles in smoking cessation. Public health campaigns should emphasize that NRTs are evidence-based, approved interventions for quitting smoking. On the other hand, e-cigarettes are still not universally endorsed for smoking cessation by health authorities due to their potential harm, which require ongoing assessment given the evolving evidence[33]. Therefore, NRTs should continue to be promoted for their proven safety in reducing nicotine dependence in a controlled manner. Healthcare providers have a critical role in helping smokers select the most appropriate cessation method for their individual needs. A balanced approach that prioritizes individual needs is essential in addressing this issue.
Additionally, the trend analysis highlighted an overall decreasing trend in NRT sales, with certain fluctuations occurring around the time that e-cigarettes rose in popularity and sparked public debates regarding their harms and benefits[34]. This observation is based on the temporal overlap between the introduction and rapid growth of e-cigarette use, as documented by national surveys and prior studies[12,13,19], and the corresponding dips and rebounds in NRT sales. However, because the present dataset does not include e-cigarette usage data or measure these debates directly, definitive causal links cannot be drawn, underscoring the need for integrated research examining both NRT and e-cigarette markets.
The observed seasonal peaks in NRT sales, particularly for nicotine patches, may reflect periods when individuals are more motivated to quit smoking, such as the onset of the new year with resolutions for behavior change and the approach of warmer seasons encouraging lifestyle changes. These periods may indicate heightened public awareness or a social push toward healthier habits. The trend analysis further elucidates how the introduction and market saturation of e-cigarettes may have coincided with shifts in NRT sales, raising questions about the shifting landscape of smoking cessation. However, whether this decline in NRT sales truly indicates fewer cessation efforts overall or a shift toward alternative methods (e.g., e-cigarettes) remains unclear. Initially, the rise of e-cigarettes provided an alternative nicotine product, potentially reducing reliance on traditional NRTs. However, as negative perceptions and health concerns regarding e-cigarettes emerged, a resurgence in NRT utilization was observed, as evidenced by the increasing trend post-2018. The increase in NRT gum and lozenge sales after 2015 may be attributed to the growing market presence of e-cigarettes, alongside the significant role of media in promoting e-cigarettes, with social media and TV serving as key platforms through which e-cigarette brands targeted consumers[19].
These dynamics are supported by Huang et al., who illustrated the cyclical nature of NRT and e-cigarette usage patterns[19]. The data suggested that public health perceptions, and the evolving landscape of nicotine products, play critical roles in shaping consumer behavior toward cessation methods. The fluctuations in NRT sales, particularly the unaccounted-for spikes and drops in the residual component, suggest that external factors, such as macroeconomic changes, broader public health messaging, or the timing of regulatory changes, are key drivers behind these patterns. For instance, aggressive anti-smoking campaigns or changes in tobacco-related legislation may temporarily push consumers toward NRTs, while the introduction of new e-cigarette models, or shifts in media messaging, could sway preferences toward alternatives. While the present data do not allow for a direct assessment of these influences, recognizing their potential impact underscores the need for integrated analyses that consider policy, market dynamics, and public perception.
Public health and policy implications
-
Understanding both trend and seasonal patterns in NRT sales provides valuable insights for public health strategies. The alignment of peak NRT sales with periods of increased quit attempts suggests that timing cessation campaigns during these seasons could enhance their effectiveness. However, given the competition from e-cigarettes and other emerging nicotine products, policymakers and healthcare providers should consider specific strategies to maintain or boost the use of proven cessation aids like NRT. For instance, public health campaigns could emphasize the clinical effectiveness of NRT, dispel misconceptions about its safety relative to e-cigarettes, and highlight the importance of combination therapy (e.g., behavioral counseling plus pharmacotherapy) for successful cessation.
To enhance the effectiveness of NRT, and encourage smoking cessation, several measures should be considered. First, increased funding and visibility through expanded mass media campaigns can help promote NRT usage while educating the public about the relative risks and benefits of e-cigarettes, used as both consumer products and cessation aids, compared to FDA-approved cessation products. Additionally, regulatory measures should be explored to control the marketing and advertising of e-cigarettes, limiting misleading claims that may prevent smokers from opting for proven cessation methods. Healthcare providers should also be encouraged to actively offer NRT, either alone or in combination with other methods, to smokers seeking to quit, and incorporate updated guidelines into electronic health records. Lastly, collaboration with insurers is essential to reduce out-of-pocket costs for NRT products, ensuring that they are covered equally alongside other cessation aids, such as counseling and prescription medications.
By reinforcing the role of NRT within a comprehensive quit strategy, policymakers can help ensure that the growing popularity of e-cigarettes does not inadvertently reduce the use of traditional cessation aids or derail evidence-based public health initiatives. Future work should assess how these recommendations impact both cessation rates and the broader landscape of nicotine product usage.
Limitations and future research
-
Several limitations should be considered when interpreting these findings. First, although sales data was used as as a proxy for NRT usage, it does not definitively capture actual consumption behaviors. External factors, such as stockpiling, promotional sales, or retailer inventory practices, could inflate or deflate sales figures. Second, regional variations in NRT sales were not analyzed; factors such as local smoking prevalence and regulations, cultural differences, and state-level policies could influence sales trends. Third, the exclusion of other NRT forms like inhalers and nasal sprays means the analysis does not encompass all cessation aids. Fourth, external factors such as economic fluctuations, policy changes, or major health events (e.g., the COVID-19 pandemic) were not accounted for but could have impacted sales. Therefore, sales data may overestimate or underestimate true NRT usage patterns. Fifth, the analysis is restricted to the US, limiting the ability to compare with other nations that have different regulatory frameworks for NRT or varying degrees of e-cigarette acceptance. Examining global data, particularly from countries like the UK or Australia, that have distinct NRT policies, e-cigarette regulations, and public health campaigns, could reveal how different policy environments shape NRT sales and usage. Future cross-country comparisons would help contextualize our findings, and evaluate whether the seasonal and trend patterns observed in this study are generalizable to other regions.
A key limitation of this study is the absence of empirical sales data for e-cigarettes. Although such data are available, this study focused exclusively on NRT sales. While the present time series analysis of NRT sales covers the period of the gradual rise of e-cigarettes in the US market, the lack of corresponding e-cigarette data prevents us from establishing a direct causal link between the two trends. Therefore, the observed decremental trend in NRT sales can only be discussed in a correlational context, alongside other potential factors such as economic fluctuations and the timing of anti-smoking media, in addition to public health campaigns and policy changes. Future research could benefit from integrating e-cigarette sales data to better understand the competitive dynamics between these products and their combined impact on smoking cessation efforts.
Future studies should incorporate individual-level data to gain a deeper understanding of the motivations and behaviors underlying trend and seasonal variations in NRT utilization. Qualitative research could explore why certain products are preferred during specific seasons or time periods. Additionally, extending the analysis beyond 2020 would capture more recent trends, including the impact of the COVID-19 pandemic on smoking behaviors and cessation efforts. Comparative research that includes multiple countries with varying tobacco control policies would further illuminate how global contexts and regulatory differences influence patterns in NRT sales. Investigating the interplay between NRT sales and the use of alternative nicotine products such as e-cigarettes could provide a more comprehensive understanding of the nicotine market. Understanding whether e-cigarette usage exhibits similar seasonal patterns or affects NRT sales seasonally would inform both public health strategies and regulatory policies.
-
The study highlights an overall decline in NRT sales during 2006–2020, along with significant seasonal variations, particularly for nicotine patches, with higher sales and nicotine content sold in Winter and Spring. These findings suggest that smokers are more likely to initiate quit attempts during these seasons, emphasizing the importance of timing in smoking cessation efforts. Public health initiatives and policies should consider these seasonal variations and trends to optimize the effectiveness of cessation programs and support services year-round.
-
The requirement for ethical review and approval was waived, as this study used secondary analysis of de-identified data.
-
The authors confirm contribution to the paper as follows: study conception and design: Kumbalatara C, Jayawardene W; data collection: Kumbalatara C; analysis and interpretation of results: Kumbalatara C, Jayawardene W, Manietta L, Cortez D; draft manuscript preparation: Manietta L, Jayawardene W, Kumbalatara C, Cortez D. All authors reviewed the results and approved the final version of the manuscript.
-
NielsenlQ data are not publicly available due to confidentiality agreements, and may require a license or subscription.
-
Researcher(s)' own analyses calculated (or derived) based in part on data from Nielsen Consumer LLC and marketing databases provided through the NielsenIQ Datasets at the Kilts Center for Marketing Data Center at The University of Chicago Booth School of Business. The conclusions drawn from the NielsenIQ data are those of the researcher(s) and do not reflect the views of NielsenIQ. NielsenIQ is not responsible for, had no role in, and was not involved in analyzing and preparing the results reported herein. Funding for this secondary data analysis was provided by the Illinois Department of Public Health (IDPH) (Grant No. 33281072K).
-
The authors declare that they have no conflict of interest.
- Supplementary Table S1 Total annual sales and total nicotine content for nicotine replacement therapies*.
- Copyright: © 2026 by the author(s). Published by Maximum Academic Press, Fayetteville, GA. This article is an open access article distributed under Creative Commons Attribution License (CC BY 4.0), visit https://creativecommons.org/licenses/by/4.0/.
-
About this article
Cite this article
Kumbalatara C, Manietta L, Cortez D, Jayawardene W. 2026. Trends and seasonal fluctuations in the sales of nicotine replacement therapy products in the United States, 2006−2020. Journal of Smoking Cessation 21: e001 doi: 10.48130/jsc-0025-0013 

Trends and seasonal fluctuations in the sales of nicotine replacement therapy products in the United States, 2006−2020
- Received: 05 December 2024
- Revised: 12 December 2025
- Accepted: 25 December 2025
- Published online: 27 January 2026
Abstract: Variations in consumer demand for Nicotine Replacement Therapy (NRT) products and impacts of e-cigarettes on NRT use can provide insights into cessation interventions. This study aimed to examine trends and seasonal patterns in the sales of NRT products in the US during 2006–2020, by analyzing weekly sales data from NielsenIQ, adjusted to inflation, and aggregated by season. Trend analysis was conducted to assess changes over the 15-year period. Seasonal and Trend decomposition using the LOESS (STL) method was utilized for time series data using locally weighted regression. NRT sales and nicotine content sold were higher in Winter and Spring compared to Summer and Fall. The total nicotine content sold as nicotine patches significantly increased in Winter and Spring, while sales of nicotine gum and lozenges did not exhibit significant seasonal variations. A decreasing trend observed in NRT sales, with notable shifts, may be influenced by various external factors, including the emergence of e-cigarettes and subsequent debates related to their harms and benefits. These findings suggest that smokers initiate quit attempts during Winter and Spring, and that alternative nicotine products may influence NRT utilization. Public health strategies and tobacco control efforts should consider these seasonal patterns and trends to enhance the effectiveness of cessation interventions and allocate resources efficiently.
-
Key words:
- NRT /
- Tobacco cessation /
- Trends and seasonal fluctuations