












-
Forests, as the largest terrestrial ecosystem, provide various ecosystem services, including carbon sequestration, climate mitigation, biodiversity conservation, and the provision of timber resources[1−3]. Timely and accurate monitoring of forest status and changes is critical for effective forest management and the design of conservation policies[4,5]. Forest inventories, which are essential for obtaining key forest parameters such as diameter at breast height (DBH), tree height, and volume, play a vital role in forest management.
Conventional forest surveying methods, which primarily involve manual, on-site measurements using diameter tapes and altimeters, are not only costly and time-consuming, but also prone to large errors in complex terrain and stand conditions[6]. To address these drawbacks, recent advancements have seen the adoption of technologies such as Light Detection and Ranging (LiDAR). LiDAR, in particular, stands out for its ability to penetrate forest canopies, offering a significant edge in lower-cost and accurate forest surveying[7−10].
LiDAR systems on ground platforms are increasingly used for investigating forest attributes. These systems are commonly classified as ground-based LiDAR systems, such as Terrestrial Laser Scanning (TLS), and mobile LiDAR systems (MLS). TLS can accurately capture three-dimensional forest structure point cloud data[11], widely applied in forest inventories to extract parameters like DBH, tree height, and volume in plantations and urban parks (RMSE = 0.7–4.2 cm)[12,13]. The reconstruction of stem taper curves using TLS has become a critical approach for structural parameters estimation. Recent studies have demonstrated that individual tree stem curve reconstruction and volume estimation can be effectively conducted using backpack LiDAR systems[14]. Under the condition of complete structural coverage of the stem, the combination of model fitting and point cloud density optimization has yielded high accuracy, with rRMSE values below 10%[14,15]. However, single-site TLS may face occlusion issues, resulting in incomplete tree trunk point cloud data. Consequently, multiple-site scanning is often required to obtain a comprehensive forest point cloud[16−18]. Nevertheless, this approach can reduce the efficiency and portability of TLS[19].
MLS offers a larger scanning range and increased flexibility, enabling operators to collect data with reduced understory occlusion and improved efficiency[20]. However, the backpack-type systems face limitations like heavier equipment and operational challenges in complex, steep forest plots. Additionally, in extremely complex environments, point cloud reconstruction may encounter difficulties, requiring the combined use of Simultaneous Localization and Mapping (SLAM), and Global Navigation Satellite Systems (GNSS), to successfully reconstruct dense point clouds[21]. SLAM-based reconstruction algorithms may struggle in extremely intricate environments. In contrast, handheld portable LiDAR is lighter and more portable, adapting better to diverse terrains and complex forest settings. Both mobile LiDAR systems have been successful in measuring DBH and stand volume. Studies indicate that handheld mobile laser scanning (HMLS) performs well in estimating DBH, but it cannot accurately scan the canopy top, thus hindering precise tree height estimation and subsequently affecting timber volume calculations[22,23]. Moreover, one of the challenges in using HMLS is the presence of understory vegetation, which can partially obstruct the scanning of the lower trunk section. Although HMLS provides high-resolution point clouds near the ground, dense or tall understory vegetation may obscure parts of the trunk, reducing the completeness of stem point clouds. This incomplete coverage can affect the accuracy of stem taper reconstruction and subsequently influence tree height estimation based on model fitting[24,25].
The main challenge of HMLS is its limited scanning range, which can be shorter than tree height[26]. This limitation restricts their effectiveness in capturing complete canopy trunk data in complex forest stand conditions, resulting in underestimation of tree height[14,26]. In this study, 'complex forest stands' and 'dense canopy environments' refer to forest structures characterized by high stem density, multi-layered canopies, and significant understory vegetation. These structural factors, particularly in the upper sections of trees, lead to imbalances or deficiencies in canopy point clouds. The accuracy and scanning distance constraints of HMLS make it difficult to accurately capture the full forest structure from the restricted canopy point cloud data. Although HMLS can penetrate gaps between leaves, dense canopies can lead to imbalances or deficiencies in canopy point clouds, especially in the upper sections of trees, making it challenging to estimate key forest parameters.
To address the limited canopy point clouds and understory effects, a common limitation of the HMLS LiDAR system, current practices involve fusing LiDAR data from multiple platforms[27,28]. This approach generates a comprehensive and holistic point cloud dataset. Typically, this process combines ground-based LiDAR, which scans from the forest floor upwards, with aerial LiDAR capturing data from the canopy downwards. Through advanced fusion techniques, this integration significantly improves the accuracy of estimating forest parameters. For instance, with the consolidated point cloud data, breast diameter measurements can be precisely determined using techniques such as the Hough transform circle detection, convex hull algorithm, least squares method, and cylinder fitting. Similarly, tree height can be accurately calculated by subtracting the coordinates of the top and bottom points[29].
Combining LiDAR data from different platforms presents challenges in reconstructing tree stem curves, primarily due to variations in point cloud density and scan angles, which can result in registration errors affecting the precision of forest parameter measurements[30,31]. Moreover, the limited overlap between ground and aerial data, especially in intricate forest terrains, adds complexity to point cloud registration, thereby raising uncertainty levels. While the dual-platform approach improves forest resource surveys, it also increases time and labor expenses.
Regardless of the type of LiDAR point cloud employed, the underlying approach remains fundamentally data-driven for forest parameter retrieval, often overlooking the inherent growth patterns and biological characteristics of trees and forest stands. In contrast, forest sciences offer well-established structural and process-based knowledge that captures physiological constraints and developmental relationships governing stem form and stand dynamics. Examples include stem taper models such as the Kunze curve[32] and stand-level DBH-height relationships. This domain knowledge provides an essential context for interpreting purely data-driven methods of forest parameter extraction. Effectively integrating the two is key to achieving accurate and ecologically meaningful estimation of forest attributes, which not only harness the strengths of large-scale point cloud data, but also incorporates existing silvicultural and growth models. Consequently, the fusion of tree- and stand-level models with LiDAR point cloud data represents a major focus of contemporary research.
In response to the practical limitations of HMLS point clouds in areas with insufficient canopy penetration, this study proposes a hybrid strategy that integrates stem taper modeling, an allometric H-D (height-diameter) growth model, and HMLS data to explore. By relying solely on low-density and partially occluded HMLS point clouds, the method achieves complete estimation of tree height and volume through partial stem fitting combined with model-based height compensation. The approach demonstrates stable performance across both natural and plantation forests. Using plots across the subtropical zone in Shengnongjia Forest Park, the study aimed to address two specific questions: (1) how can the stem curve be reconstructed using forest models and HMLS laser data? and (2) what is the performance of this approach in both planted and natural forests?
-
The study was conducted in the Shennongjia Forest area (31°15' N–31°57' N, 109°56' E–110°58' E), located in the western part of Hubei Province, China (Fig. 1). The Shennongjia Forest area is one of the richest areas of endemic genera in China, with considerable biodiversity. The forest area has diversity topographic environment, the elevation ranges from 1,500 m to 3,105.4 m, and contains high mountains and steep slopes. The dominant tree species are Pinus armandii, Cunninghamia, Larix gmelinii Abies fargesii, Quercus glauca, and Betula albosinensis.
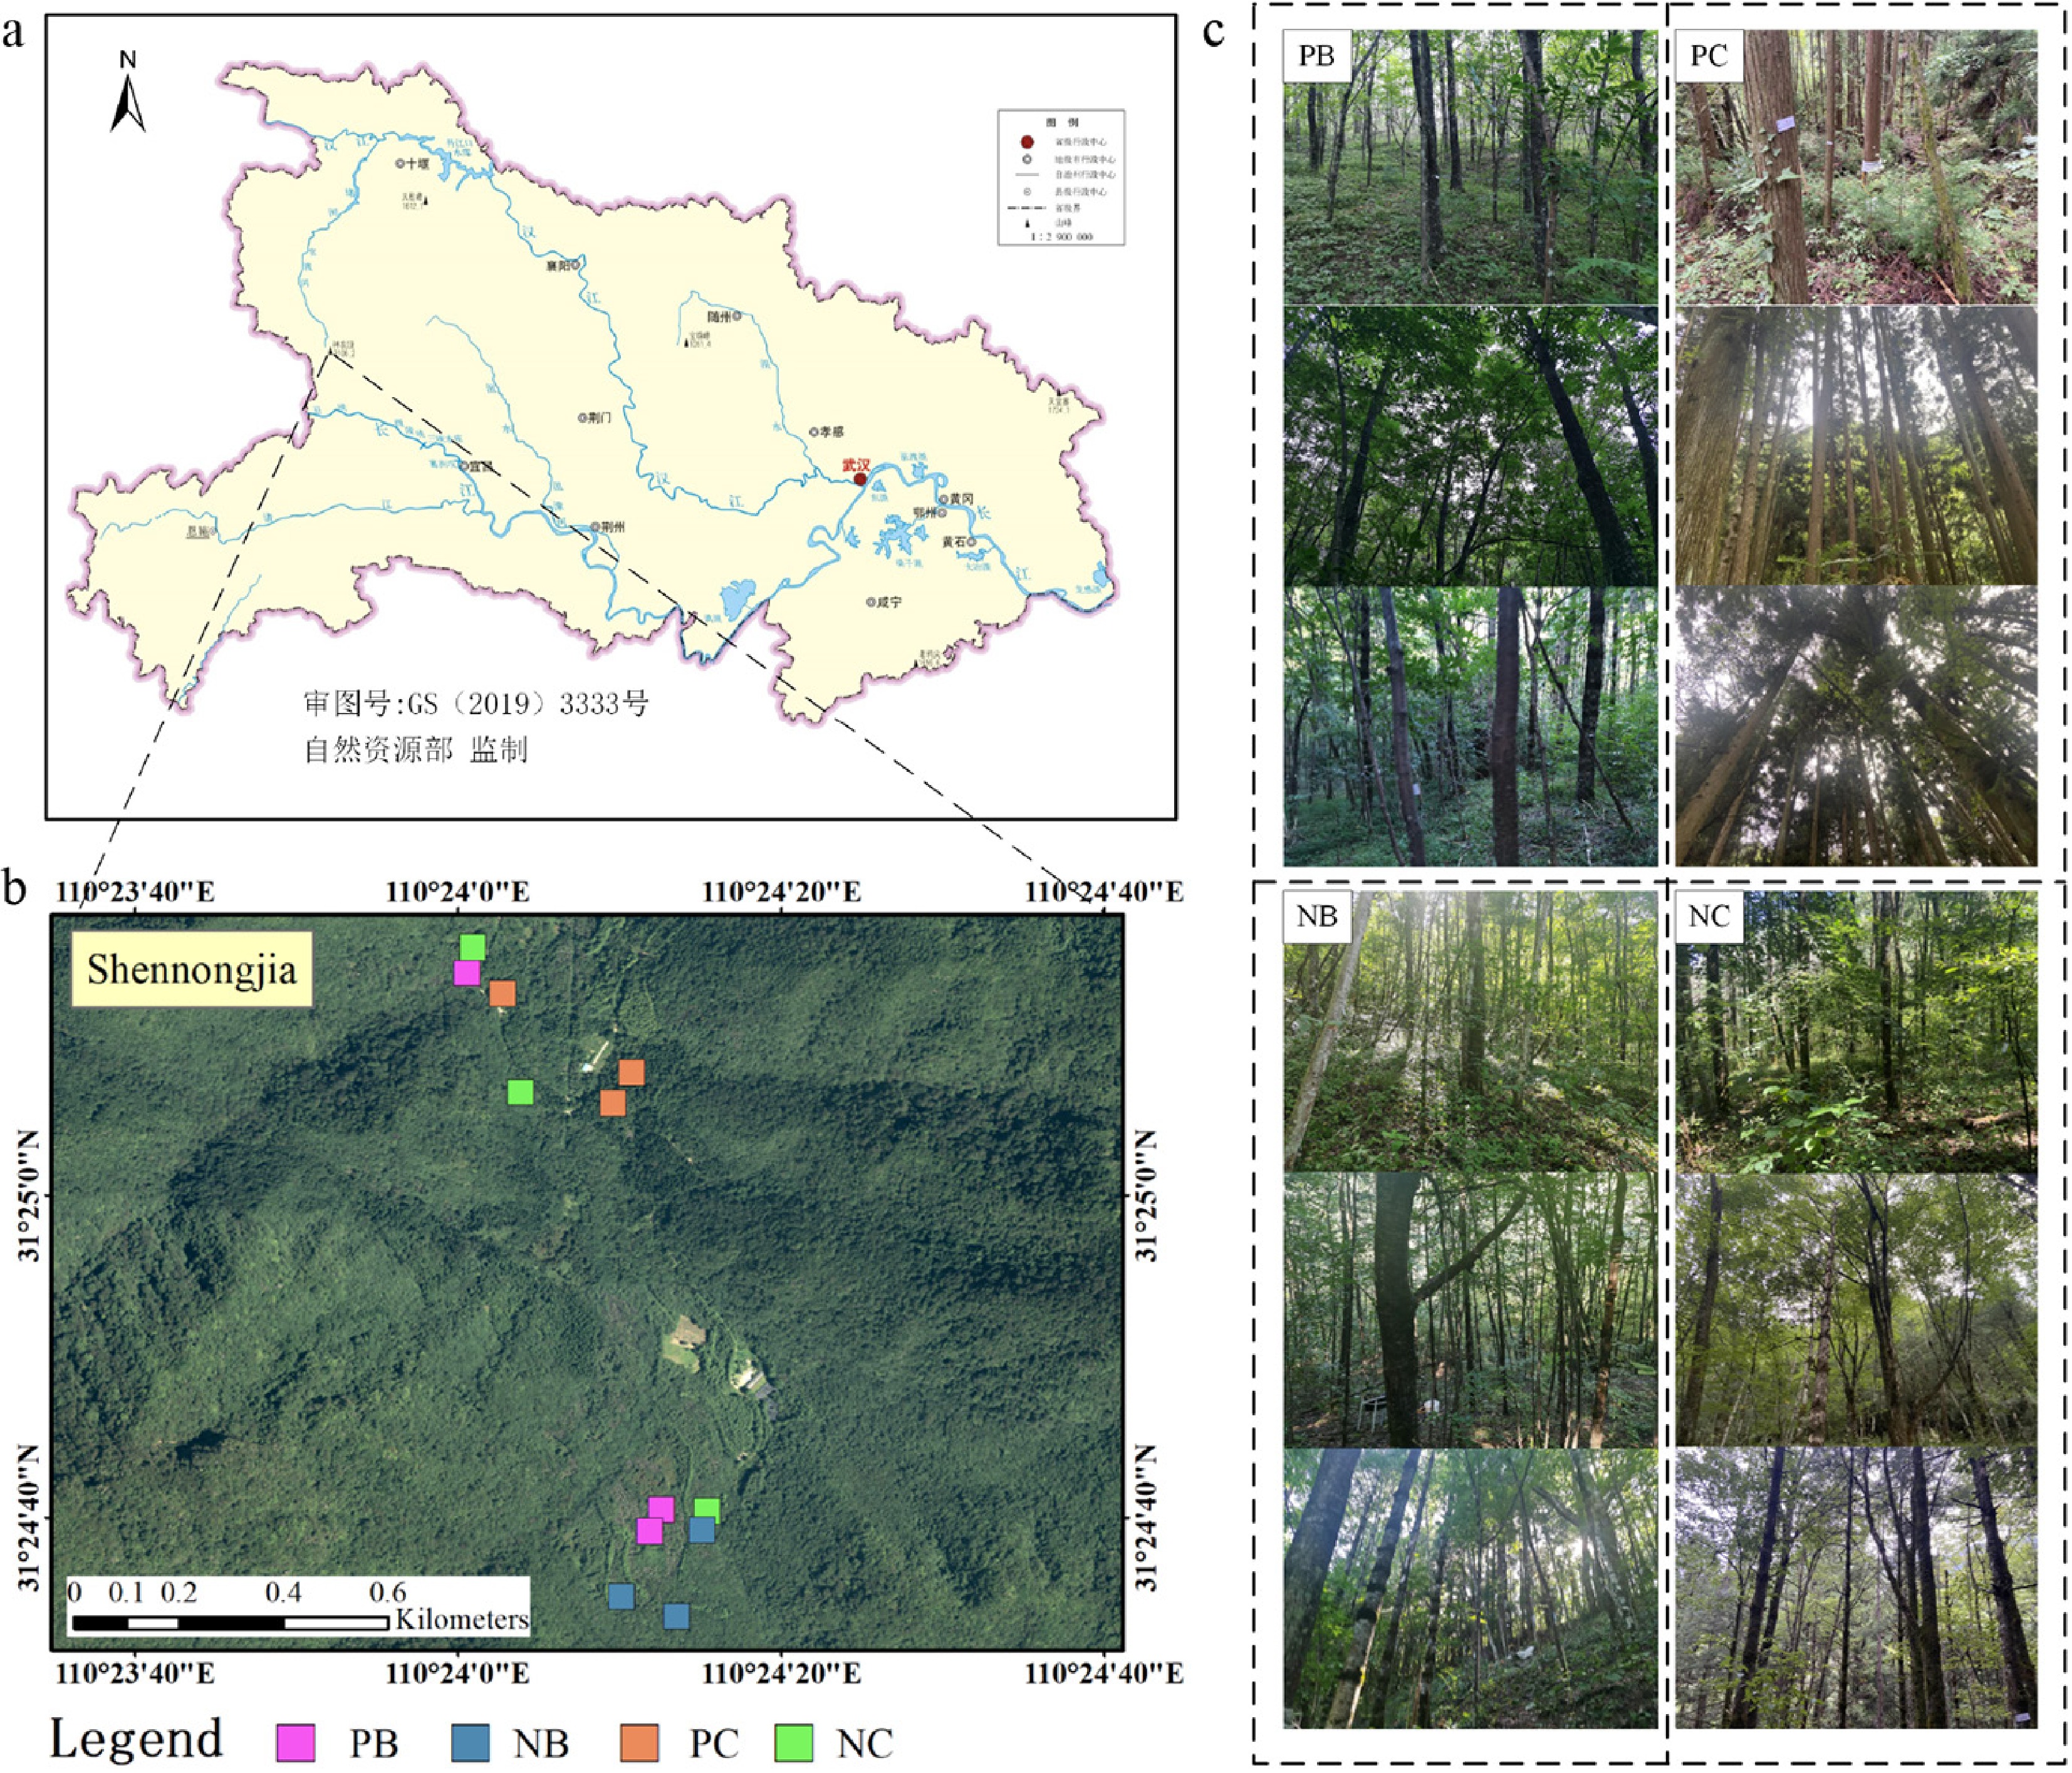
Figure 1.
Spatial distribution of different complex plots with various forest types. (a) Location of study area in Hubei; (b) plots in subtropical zone, located in Shennongjia, Hubei Province; (c) on-site photos of the 12 plot forest types with different complexity levels; PB and PC represents the planted broad-leaved and planted coniferous forest with a small amount of understory and medium visibility, respectively; NB and NC represent the natural mixed broad-leaved forest, and the natural mixed coniferous forest, with a large amount of understory and poor visibility. Source:
http://bzdt.ch.mnr.gov.cn/index.html Data collection
Field data
-
The field work was carried out from August 25 to September 30 2022 with square plots. In total, 12 plots were collected across study regions. Considering the species composition and origin of the forest, the plots can also be divided into planted broad-leaved (PB), planted coniferous (PC), natural mixed broad-leaved (NB), and natural mixed coniferous (NC) forest stands. The plot size was set to 30m × 30 m. In each plot, we collected the position of each individual tree by a Postex laser sonar locator (Haglöf Sweden AB, Sweden). DBH was measured by a breast diameter ruler for trees with DBH > 5 cm, and the height of each tree was measured by a Vertex IV Hypsometer (Klockargatan, Sweden), and the corresponding species was recorded (Table 1).
Table 1. Information from forest plot surveys of varying complexity.
Plot ID Characteristics of plots Number of trees Stem density
(stems/ha)DBH (cm) Height (m) Slope (°) Canopy cover Stem volume (m3) Stand volume
(m3/ha)1 PB 69 767 15.6 ± 11.1 10.5 ± 5.1 18 0.7 0.27 ± 0.69 141.1 2 PB 66 733 18.5 ± 12.8 10.9 ± 5.6 16 0.8 0.28 ± 0.50 140.7 3 PB 56 622 17.1 ± 10.7 10.4 ± 5.3 14 0.5 0.22 ± 0.44 79.2 4 PC 60 667 26.2 ± 10.2 17.5 ± 6.7 21 0.7 0.66 ± 0.61 429.3 5 PC 61 678 28.8 ± 6.9 16.2 ± 5.3 23 0.8 0.54 ± 0.39 355.1 6 PC 56 622 30.8 ± 8.2 21.0 ± 7.3 25 0.6 0.89 ± 0.55 518.3 7 NB 78 867 19.7 ± 11.9 12.7 ± 5.2 16 0.7 0.36 ± 0.57 206.3 8 NB 61 678 21.1 ± 14.6 13.9 ± 6.7 17 0.6 0.54 ± 1.13 152.4 9 NB 48 533 25.4 ± 16.2 11.6 ± 6.1 13 0.5 0.54 ± 1.15 91.5 10 NC 82 911 25.1 ± 9.7 15.0 ± 7.3 20 0.6 0.49 ± 0.50 410.7 11 NC 56 622 21.1 ± 8.2 12.8 ± 4.5 22 0.7 0.30 ± 0.39 158.0 12 NC 88 978 21.9 ± 9.4 12.5 ± 5.3 26 0.8 0.36 ± 0.57 203.1 Note: plot characteristics are defined by origin (P: planted, N: natural), and forest type (B: broad-leaved, C: coniferous). HMLS data
-
HMLS point cloud data was performed using the ZEB-Revo handheld LiDAR scanner (GeoSLAM, UK), which consists of a 2D laser scanner with a field view of 360 × 270°, combined with an inertial measurement unit (IMU). The scanner operates at a rate of 43,200 points per second with a 100 Hz line speed, and a measurement range of 30 m. To ensure high-quality data in dense forest environments, we focused on the effective range of 15–20 m[22,33]. In order to avoid the missing points in collecting, we maintained a constant walking speed of approximately 0.5 m/s along an 'S' trajectory to ensure comprehensive coverage. The start and end points were coincident to form a closed loop for the SLAM matching algorithm[22] (Fig. 2). Each plot took approximately 20 min to scan. To determine the boundaries of the study area and the positions of individual trees, nine evenly spaced target spheres with a height of 1.3 m were inserted into the ground at the designated locations within the study site (Fig. 2). The raw data collected by ZEB-Revo (GeoSLAM, UK) were processed with the software GeoSLAM Hub, which used the simultaneous localization and mapping algorithm to locate the scanner in an unknown environment and register the whole 3D point clouds[34]. The average raw point density across the 12 plots reached approximately 3,500 pts/m2.
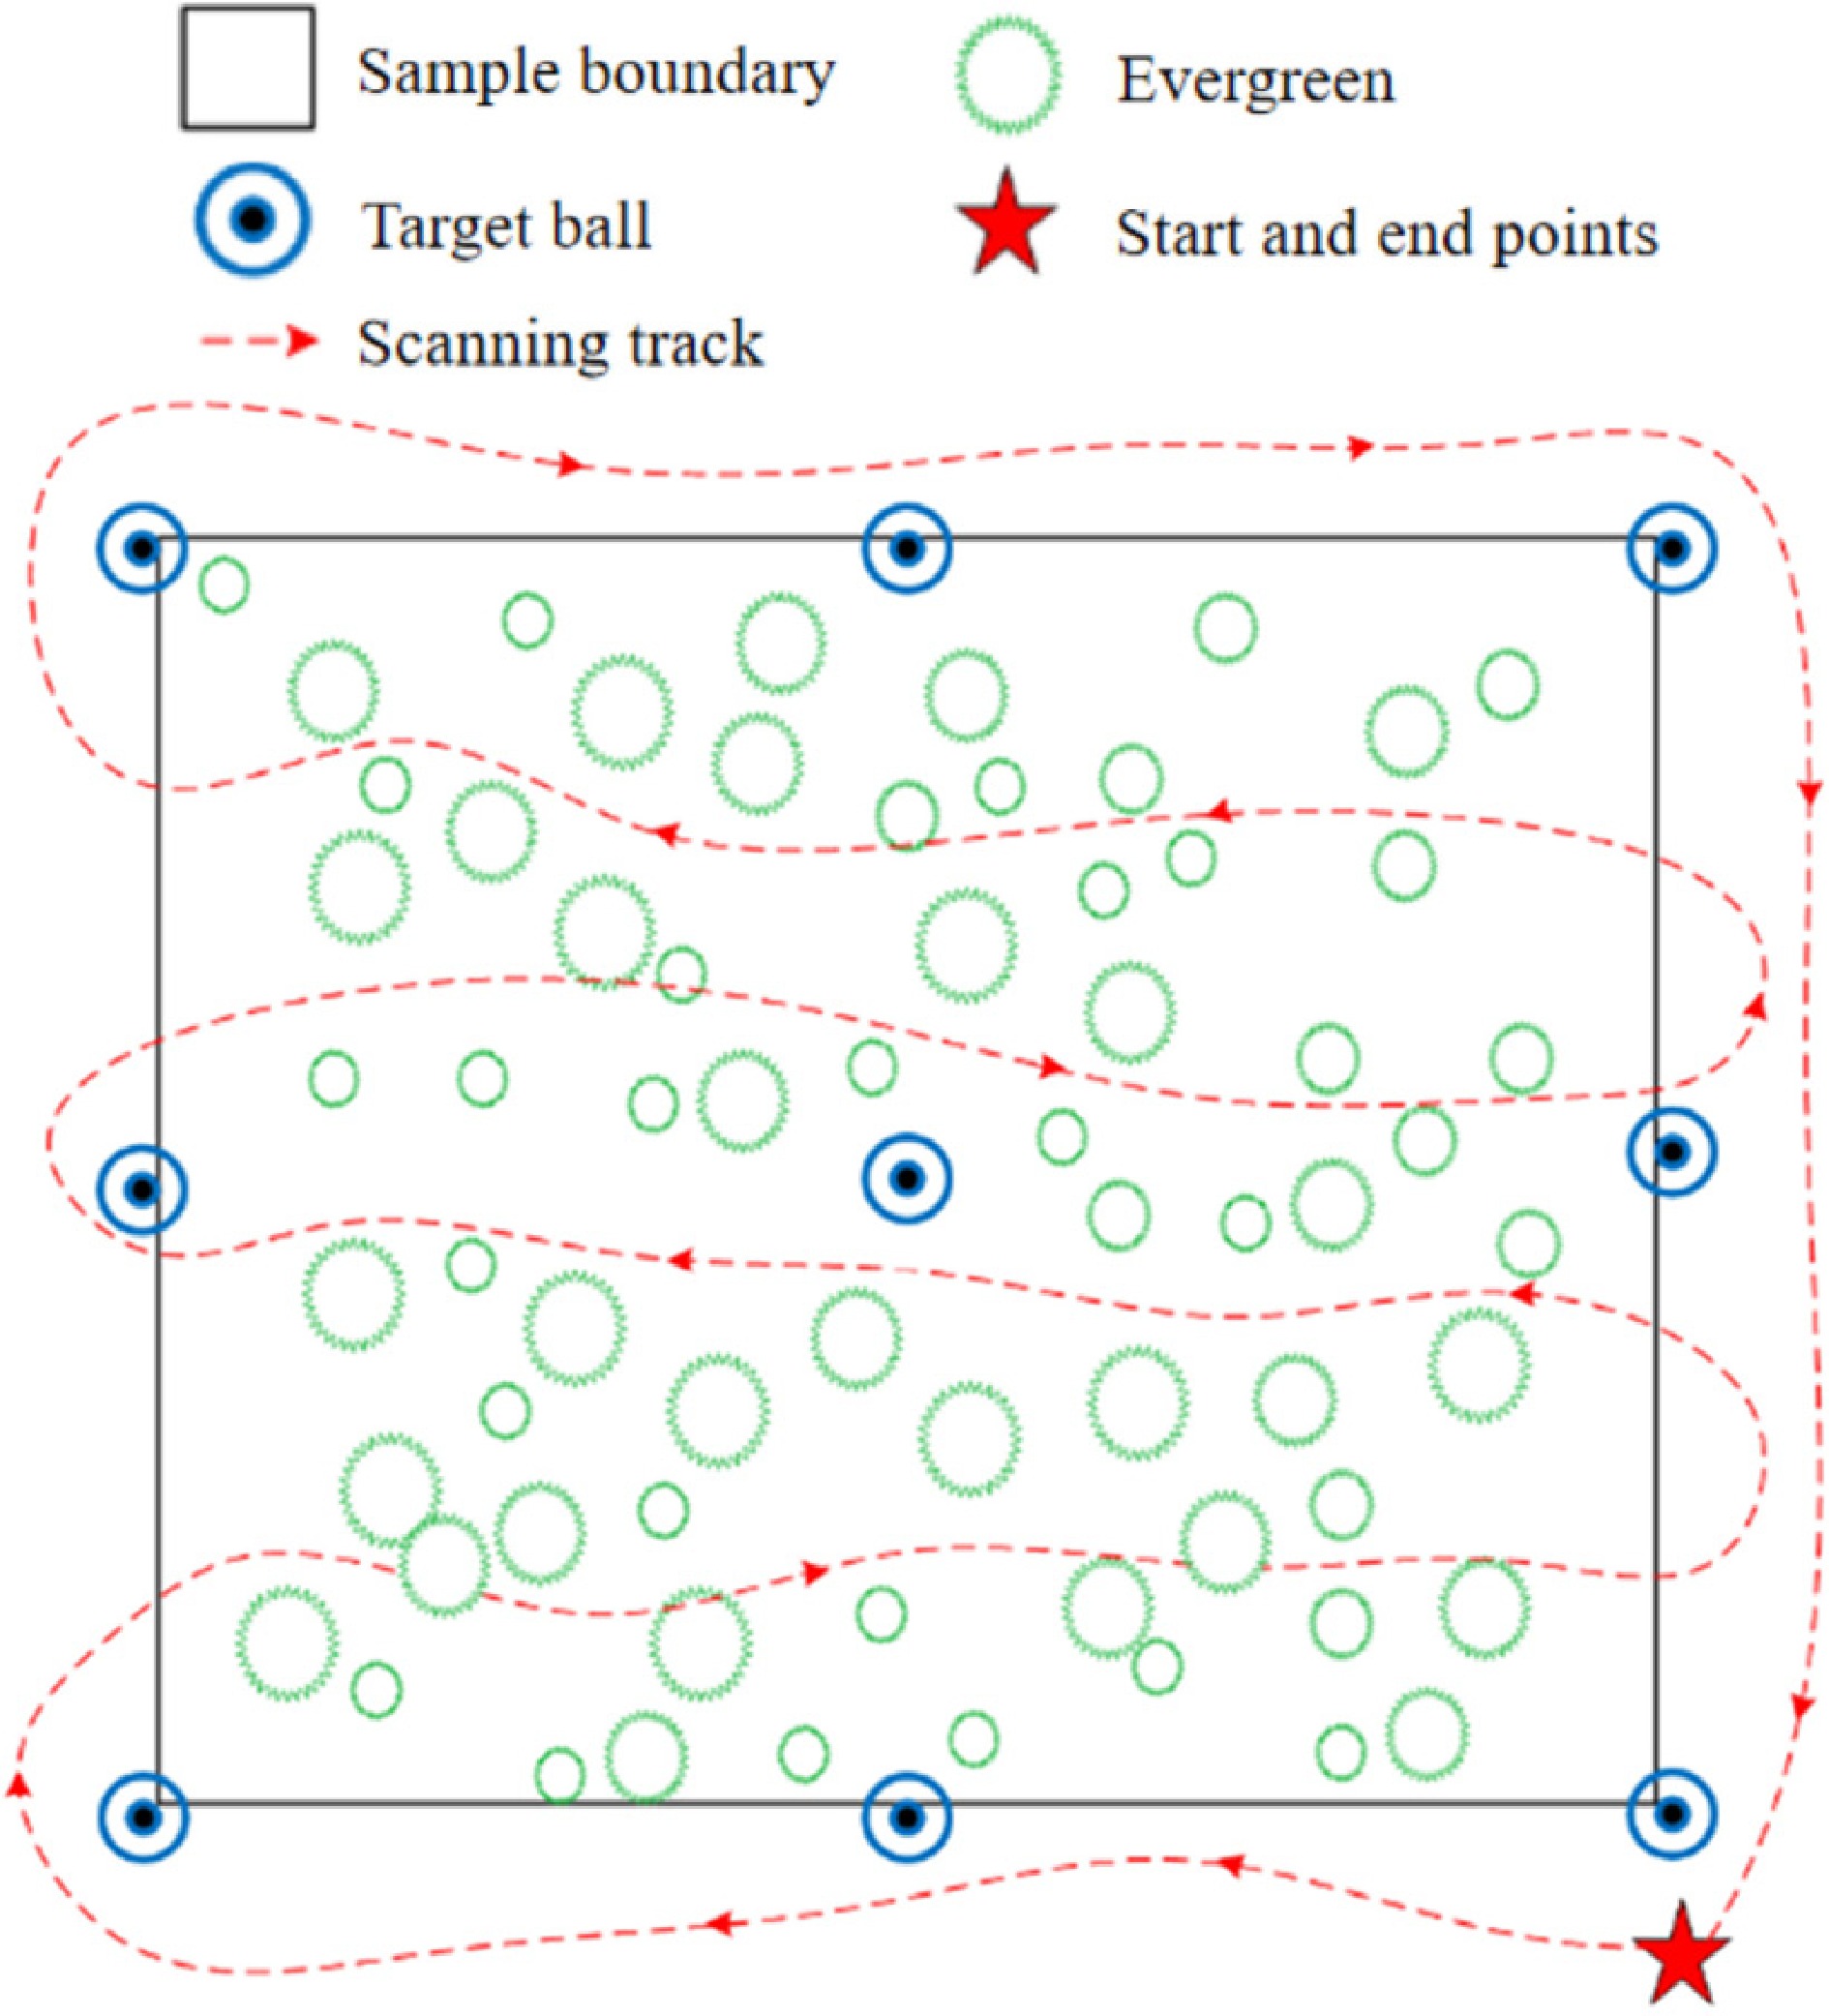
Figure 2.
Schematic diagram of the handheld LiDAR scanning path.
Methods
-
The point cloud acquired by HMLS may have some occlusion, limiting the acquisition of tree height (Fig. 3). To solve this problem, we proposed a workflow (Fig. 4) to reconstruct stem and stand information. In summary, this integrated approach involves four steps: stem segmentation to extract the main stem point cloud; using Kunze's relative stem taper curve to construct tree stems; rebuilding an H-D model at the stand level to calculate tree heights that could not be constructed earlier; and finally, calculating forest attributes at both the tree and stand level. From Fig. 4, the first stand cloud points data was collected by HMLS. After performing stem segmentation from step (a) to step (b), partial trunk point clouds can be extracted, facilitating the estimation of diameters at specific height levels. By combining this data with a stem curve model like Kunze's relative stem taper curve[32], a stem curve model can be created using discrete diameter measurements at corresponding heights. Although the goal is to construct trunk morphology curves, challenges such as trunk segmentation errors, diameter extraction errors, irregular tree distribution, topographical variability, and occlusion can hinder this process. For trees that cannot be reconstructed using stem point clouds, a regional height-diameter allometric growth model (H-D) was developed based on results from step (b) to predict missing tree heights, following a generalized approach commonly used in forestry stand surveys.
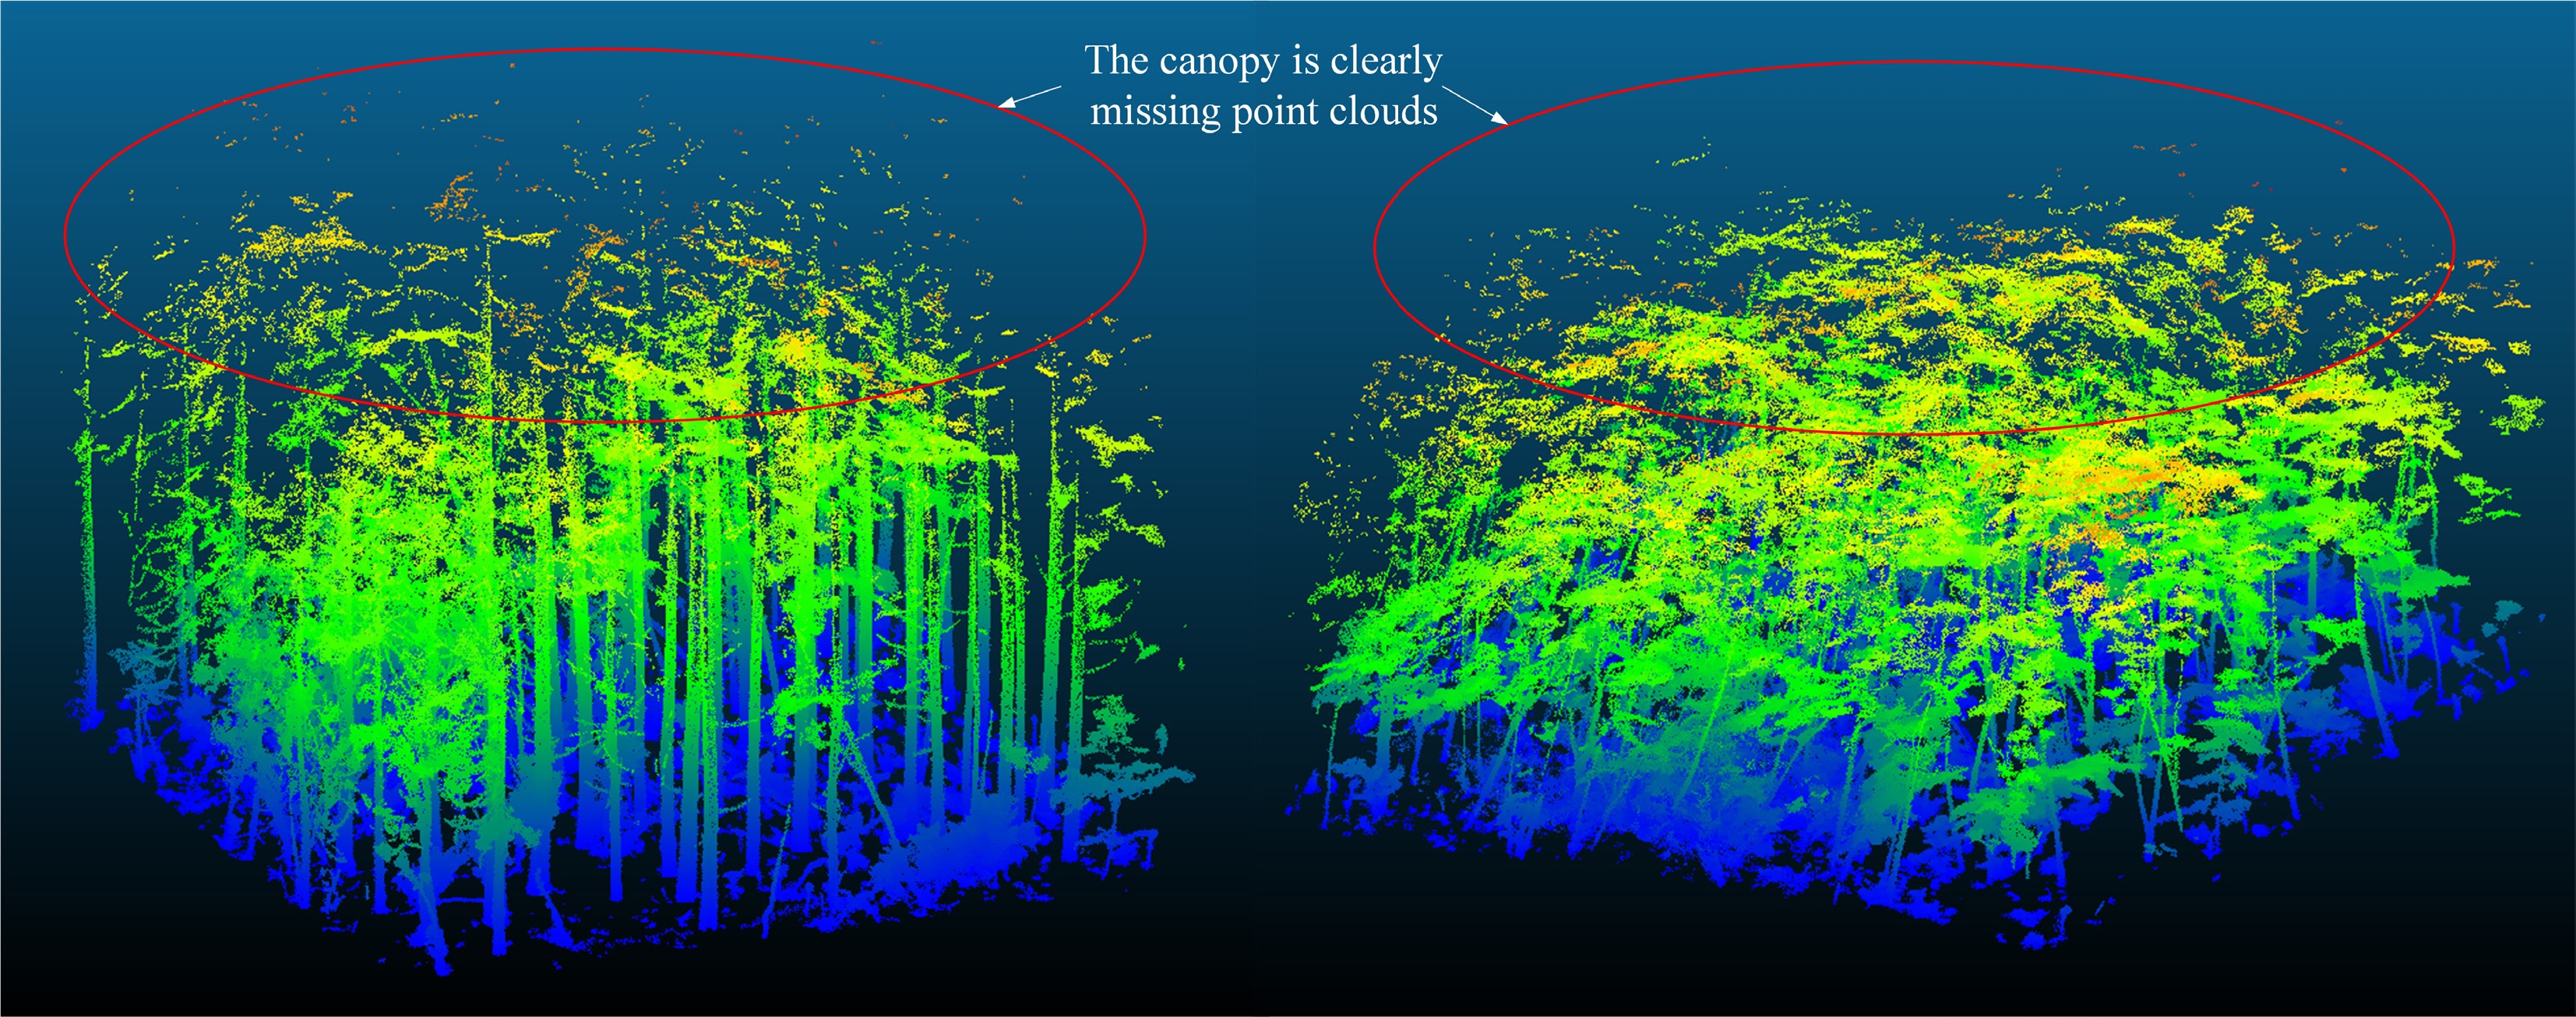
Figure 3.
Illustration of upper-canopy occlusion in point clouds acquired by HMLS.
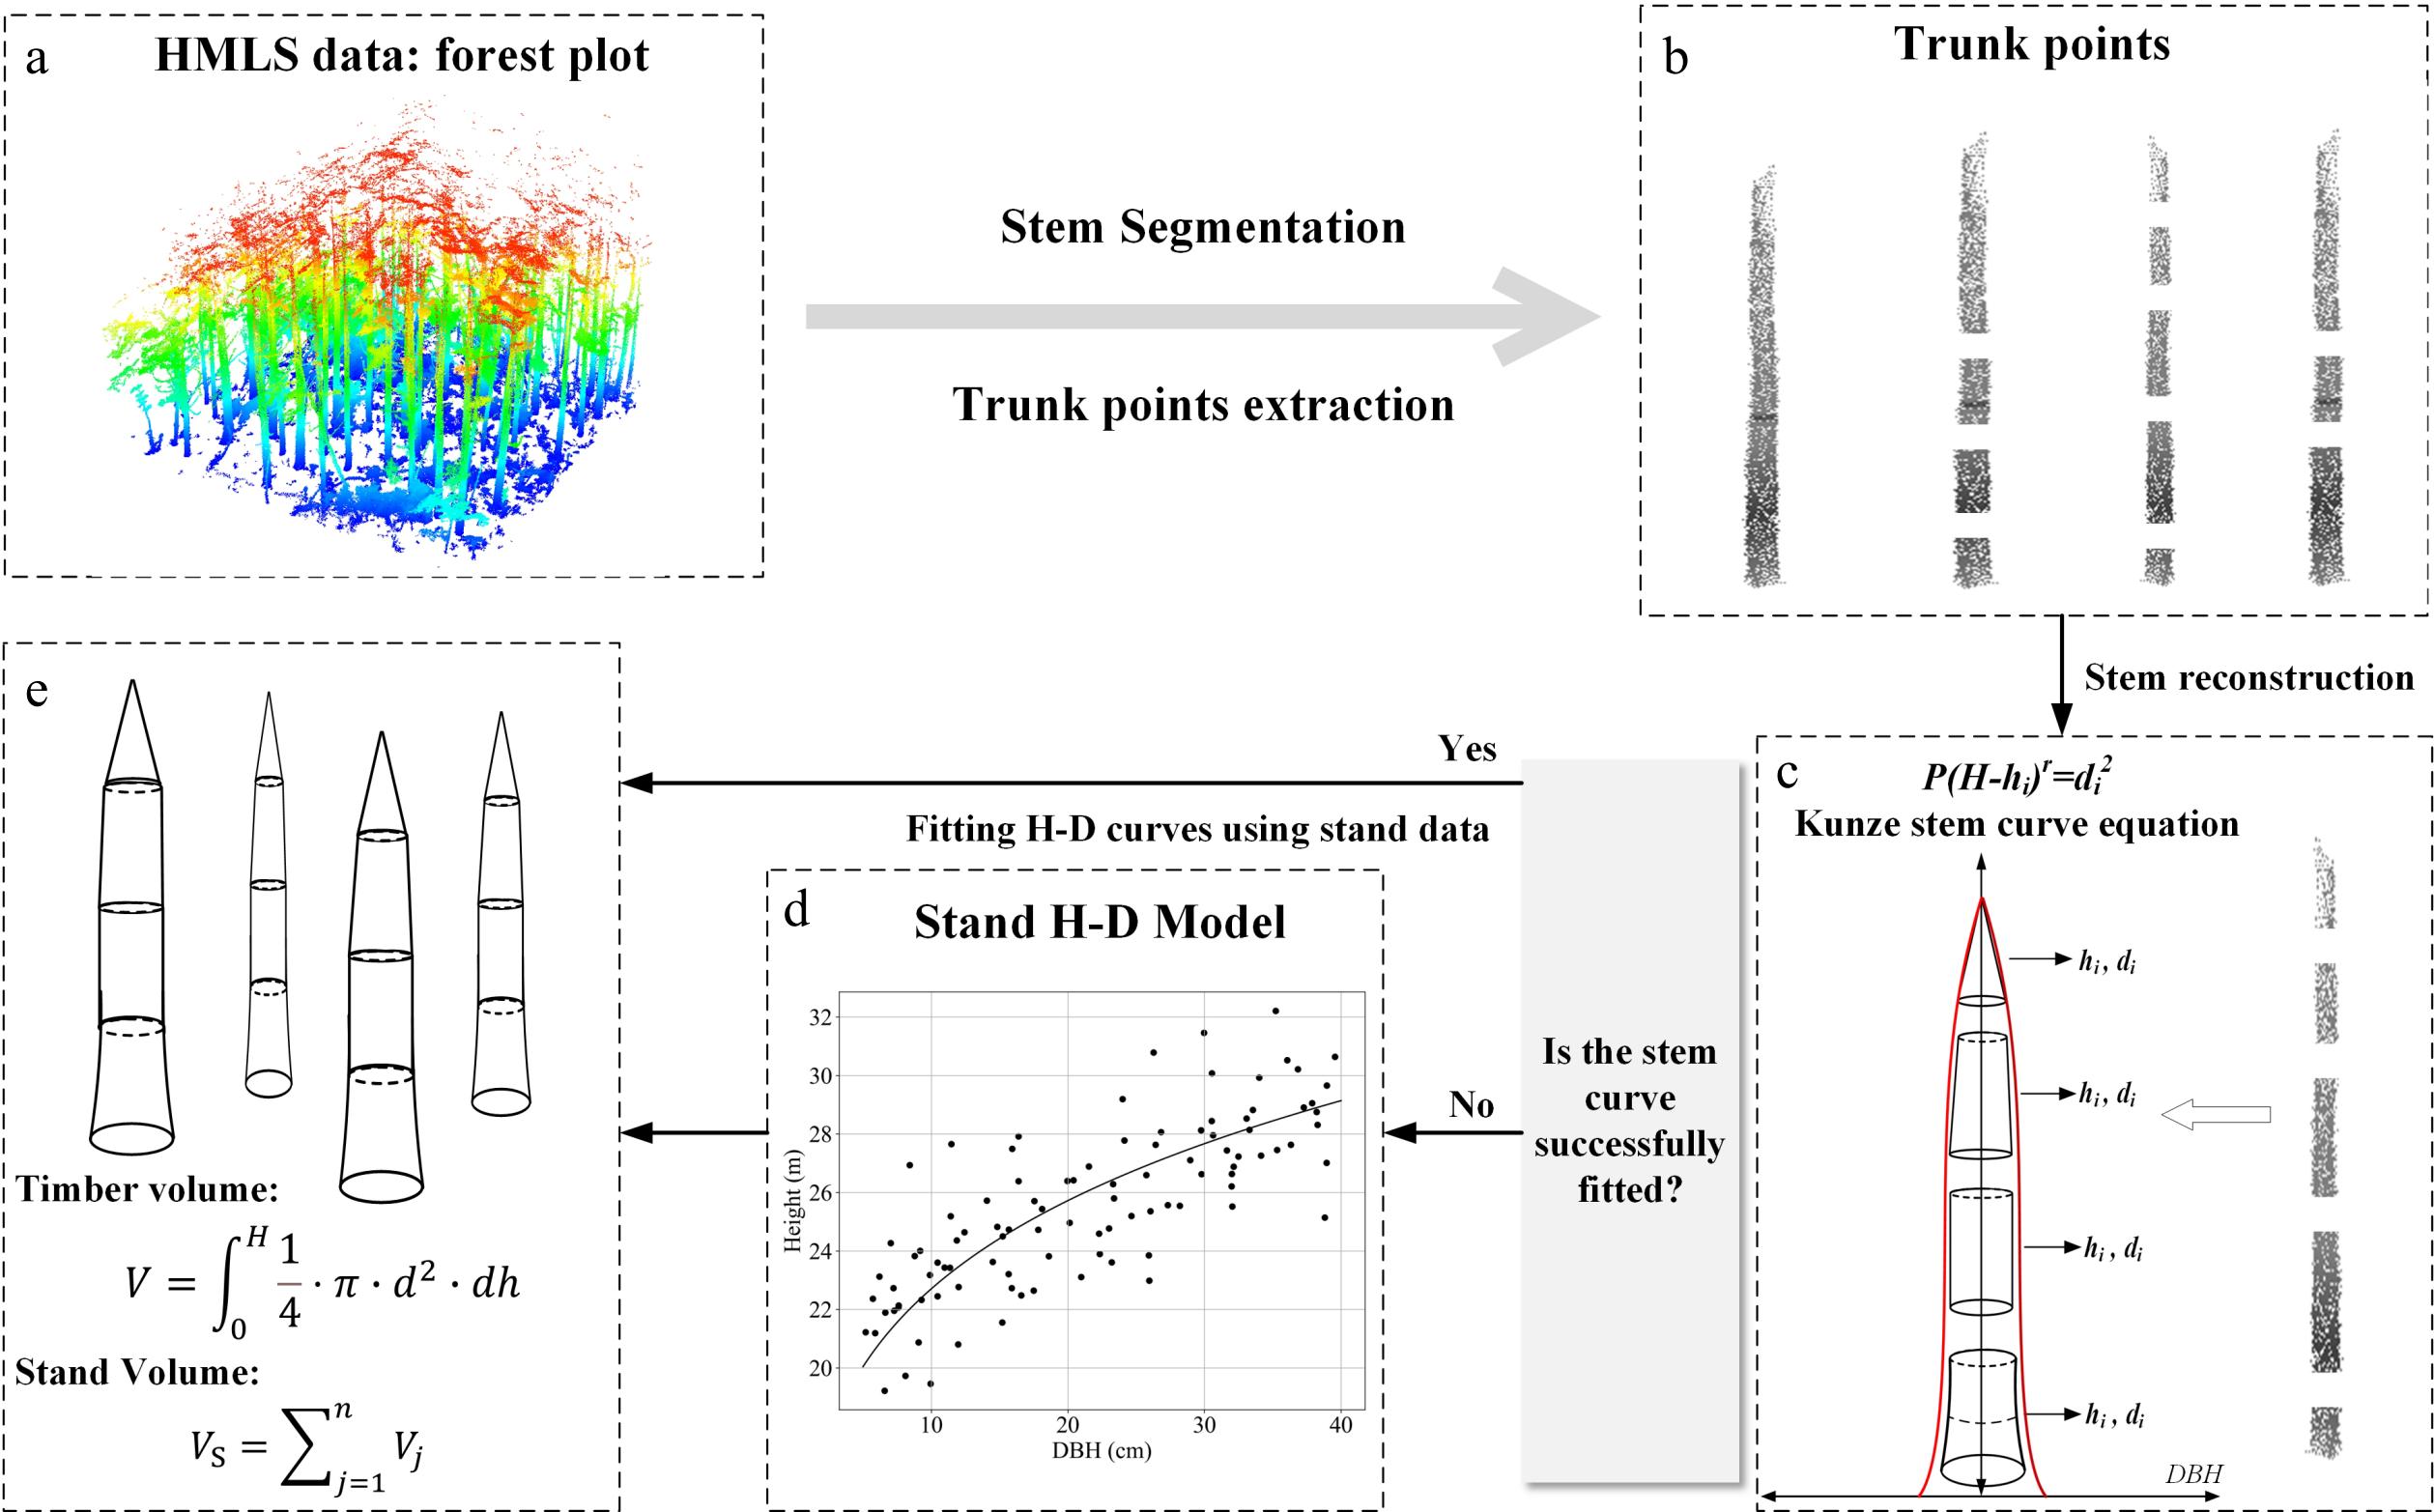
Figure 4.
Flowchart of the proposed method: (a) HMLS point cloud of forest plot with occlusions; (b) stem segmentation and trunk points extraction; (c) stem reconstruction using Kunze's stem curve equation; (d) stand H-D model development; (e) timber and stand volume calculation.
Ground and non-ground points separation
-
In order to enhance the computational efficiency of HMLS point cloud data, preprocessing was conducted. Due to variations in vegetation growth, height, and direction caused by different terrain, a cloth simulation filter (CSF) method is employed for ground separation and height normalization of the point cloud,with a cloth resolution of 0.5 m, a maximum of 500 iterations, and a classification threshold of 0.1 m[35]. Considering the localization errors of SLAM-based systems in forest environments, a statistical outlier removal method is employed to denoise the point cloud, eliminating measurement outliers and associated errors through parameterized filtering, with the number of neighboring points set to 30, and a standard deviation multiplier of 2.0[36].
Stem segmentation
-
To construct the trunk stem of every single tree, it is essential to extract numerous point clouds from the trunk to minimize occlusion effects. Various methods were synthesized for trunk extraction using ground-based LiDAR. For datasets with limited crown point clouds, a region-growing method was employed to automatically extract trunk point clouds. This method involves identifying seed points and growing rulers with these seeds[18,37]. Initially, point features such as curvature and vertical angle index in the point cloud were computed using k-nearest neighborhood[38]. Subsequently, seed points were generated using the density-based spatial clustering of applications with the noise (DBSCAN) algorithm. Horizontal slice points with a 10 cm thickness at a specific height were obtained from the original point cloud data and clustered using DBSCAN based on curvature and vertical angle indexes to identify potential trunks. Unlike Zhang's approach[37], our method classifies points in clusters as trunks if they exhibit low variation and a smaller flatness index, indicating more cylindrical and vertically consistent structures that are typical of tree stems[39]. Points most likely belonging to trunks are then extracted. Finally, a region growing algorithm was applied for trunk point cloud extraction[40]. A hypothesis is proposed that suggests points in the neighborhood surrounding the seed point exhibit similar curvature and vertical angles as the seed point. These neighboring points are merged into the same group as the seed point, while new points continue to expand in all directions from the seed. Horizontal growth is constrained within a fixed range (< 15 cm), with vertical growth being the primary direction. Ultimately, points within each group are considered part of the stem.
Diameter extraction at different heights
-
Starting from the base of the stem point clouds, horizontal slices with a thickness of 10 cm were extracted at 0.5 m intervals to determine diameter. A random sample consensus (RANSAC) cylinder fitting algorithm was utilized to fit the diameter by detecting cylindrical shapes based on the spatial distribution patterns of the point cloud. This approach addresses the limitations of two-dimensional DBH estimation methods, which struggle to accurately estimate DBH when trees are tilted[41]. Specifically, the DBH was determined in a similar manner, and if the point cloud at 1.3 m was obscured, it was estimated through linear interpolation using the two nearest diameters at 1.3 m. The DBH values were then interpolated with the closest diameters. This process resulted in a collection of diameters and their corresponding heights, which will be used to construct the tree stem curve.
Stem curve modeling
-
Tree trunks typically exhibit cylindrical and parabolic forms, with minimal concave curve bodies and cones. Comparison of individual tree trunk point clouds with rotational bodies showed a predominant parabolic shape, with trunks being thicker at the base and tapering towards the canopy. The Kunze taper model features a concise functional form and requires only a small number of parameters to describe the tapering of the stem from base to top, making it well-suited for estimation under limited HMLS point cloud conditions where the full stem cannot be captured. Moreover, the model has been widely applied in stem reconstruction studies at the individual tree level, demonstrating strong adaptability[32]. This study utilized Kunze's relative stem taper curve for analysis (Eq. [1]):
$ d_{i}^{2}=P{\left(H-{h}_{i}\right)}^{r} $ (1) where,
$ P $ $ H $ $ {d}_{i} $ $ {h}_{i} $ $ r $ $ r $ The parameters
$ P $ $ H $ $ {d}_{i} $ $ {h}_{i} $ $ H $ (1) Fit Eq. (1) with the
$ {d}_{i} $ $ {h}_{i} $ $ {d}_{i} $ (2) If RMSE is less than or equal to
$ T $ $ T $ (3) If RMSE is exceeding
$ T $ $ {d}_{i} $ $ {h}_{i} $ (4) Repeat step 1.
While Kunze's model can partially address the challenges of fitting tree height under high canopy closure conditions, where treetop cloud points are missing, certain trees may still pose difficulties due to their irregular growth or errors in extracted diameter and height data. A broader vertical coverage of the stem—especially when including segments close to the treetop—provides more constraints for curve extrapolation and leads to better height predictions. In contrast, when the upper portion of the stem is missing due to occlusion or low point density, the extrapolation becomes more dependent on the assumed taper model and may introduce bias. We ensured the fitting quality by using RMSE and retained only those curves with RMSE ≤ 2.0 m[44]. These combined constraints help reduce uncertainty and improve the robustness of the estimated tree height.
To account for the impact of site conditions on stand tree height, we developed an H-D model specifically for plots with similar stand conditions, using data from well-fitted stem curve trees. The H-D model was constructed using trees with complete point clouds as a representative subset of the stand. Since these trees share the same site conditions with the occluded trees within the same plot, the localized H-D relationship remains biologically valid for height compensation. This model was employed to estimate the tree heights of trees that could not be directly fitted to stem curves using point cloud data. In our study, we opted for a hyperbolic model to redefine the H-D relationship (Eq. [2]), and the parameters
$ {(a}_{1}, {a}_{2}, {a}_{3}) $ $ H={a}_{1}-\dfrac{{a}_{2}}{DBH+{a}_{3}} $ (2) where,
$ H $ $ {a}_{1} $ $ {a}_{2} $ $ {a}_{3} $ Forest attribute estimation
-
By substituting the Kunze taper equation (Eq. [1]) into the standard sectional integration formula, the stem volume is calculated. The individual tree volume is then estimated with Eq. (3), ultimately leading to the calculation of stand volume for a single plot using Eq. (4).
$ V=\int\nolimits_{0}^{H}\dfrac{1}{4}\cdot \pi \cdot {d}^{2}\cdot dh=\dfrac{\pi }{4}P\int\nolimits_{0}^{H}{\left(H-h\right)}^{r}\cdot dh $ (3) $ {V}_{{s}}=\sum\nolimits_{j=1}^{n}{V}_{j} $ (4) where,
$ V $ $ V_s $ $ H $ $ P $ $ d $ $ h $ Accuracy assessment
-
At the individual and stand level, the field data was used to assess the performance of the proposed method. The tree detection rate, the errors of DBH, tree height, the individual timber volume and stand volume were evaluated with the following statistical analysis. The tree detecting rate (DR) and commission rate (CR) were used for evaluating the accuracy of tree detection, which were defined as Eqs (5) and (6). The coefficient of determination (
$ {R}^{2} $ $ DR=N_{rd}\ /N_r $ (5) $ CR=1-N_{rd}\ /N_{t\mathrm{ }} $ (6) where,
$ N_{rd} $ $ N_r $ $ N_t $ $ {R}^{2}=1-\dfrac{\displaystyle\sum\nolimits_{i=1}^{n}\,\,{\left({y}_{i}-{\hat{y}}_{i}\right)}^{2}}{\displaystyle\sum\nolimits_{i=1}^{n}\,\,{\left({y}_{i}-\overline{y}\right)}^{2}} $ (7) $ {\rm{bias}}=\dfrac{\displaystyle\sum\nolimits_{i=1}^{n}\,\,\left({{{\hat{y}}_{i}}-y}_{i}\right)}{n} $ (8) $ {\rm{rbias}}=\dfrac{\rm bias}{\overline{y}} $ (9) $ {\rm{MAE}}=\dfrac{\displaystyle\sum\nolimits_{i=1}^{n}\,\,\left| {{{\hat{y}}_{i}}-y}_{i}\right| }{n} $ (10) $ {\rm{rMAE}}=\dfrac{\rm MAE}{\overline{y}}\times 100{\text{%}} $ (11) $ {\rm{RMSE}}=\sqrt{\dfrac{\displaystyle\sum\nolimits_{i=1}^{n}\,\,{\left({y}_{i}-{\hat{y}}_{i}\right)}^{2}}{n}} $ (12) $ {\rm{rRMSE}}=\dfrac{\rm RMSE}{\overline{y}}\times 100{\text{%}} $ (13) where,
$ n $ $ {\hat{y}}_{i} $ $ {y}_{i} $ $ \overline{y} $ Comparison with the conventional method
-
To evaluate the optimization effect of the integrated approach, a comparative analysis was conducted against the conventional direct extraction method using LiDAR360 software (v9.0, GreenValley International). This comparison was specifically limited to the subset of trees for which stem curves were successfully fitted. This selection was necessary because conventional methods rely on sufficient point cloud visibility of the tree apex; for trees with severe canopy occlusion, these methods typically fail to detect the individual trees, or produce invalid height measurements[29,46]. By comparing the two methods on this fitted subset, we aimed to quantify the accuracy improvement provided by stem taper modeling over standard point-to-point extraction. In LiDAR360, individual tree segmentation (ITS) was performed using a search radius of 1.0 m and a minimum height threshold of 2.0 m.
-
The evaluation of single tree detection rate and DBH accuracy was conducted across all plots initially. Table 2 provides a detailed overview of the DBH accuracy metrics for each plot. The HMLS data exhibited a high efficacy in tree detection within the sample plots, with detection rates exceeding 91% in most cases and commission error rates below 10%. Plot 10 demonstrated the highest forest tree detection accuracy, with a detection rate of 98.68% and a commission error rate of 1.23%. In contrast, plot 9 displayed the lowest accuracy, with a detection rate of 86.05% and a commission error rate of 14.29%. The
$ {R}^{2} $ $ {R}^{2} $ $ {R}^{2} $ Table 2. The accuracy of DBH in each plot.
Plot ID DR (%) CR (%) R2 bias (cm) rbias (%) MAE (cm) rMAE (%) RMSE (cm) rRMSE (%) 1 91.04 9.52 0.98 0.13 0.90 0.67 4.60 1.31 8.95 2 91.80 8.20 0.99 0.16 0.99 0.31 1.93 0.66 4.15 3 94.30 5.66 0.96 −0.09 −0.57 1.10 7.26 1.63 10.71 4 98.31 1.69 0.97 0.41 1.57 1.05 4.00 1.97 7.53 5 98.31 1.67 0.97 0.51 1.95 0.94 3.58 1.78 6.81 6 96.30 3.70 0.97 0.08 0.27 0.67 2.18 1.31 4.27 7 95.89 4.00 0.98 0.02 0.12 0.54 3.09 1.27 7.22 8 88.89 10.91 0.99 0.02 0.12 0.11 0.61 0.20 1.11 9 86.05 14.29 0.99 −0.08 −0.42 0.21 1.08 0.55 2.82 10 98.68 1.23 0.94 0.67 2.75 1.18 4.81 2.12 8.66 11 96.15 3.70 0.94 0.29 1.43 1.11 5.58 1.88 9.45 12 96.20 3.53 0.89 0.76 3.76 1.11 5.47 2.12 10.47 Note: DR represents detection rate; CR represents commission rate. 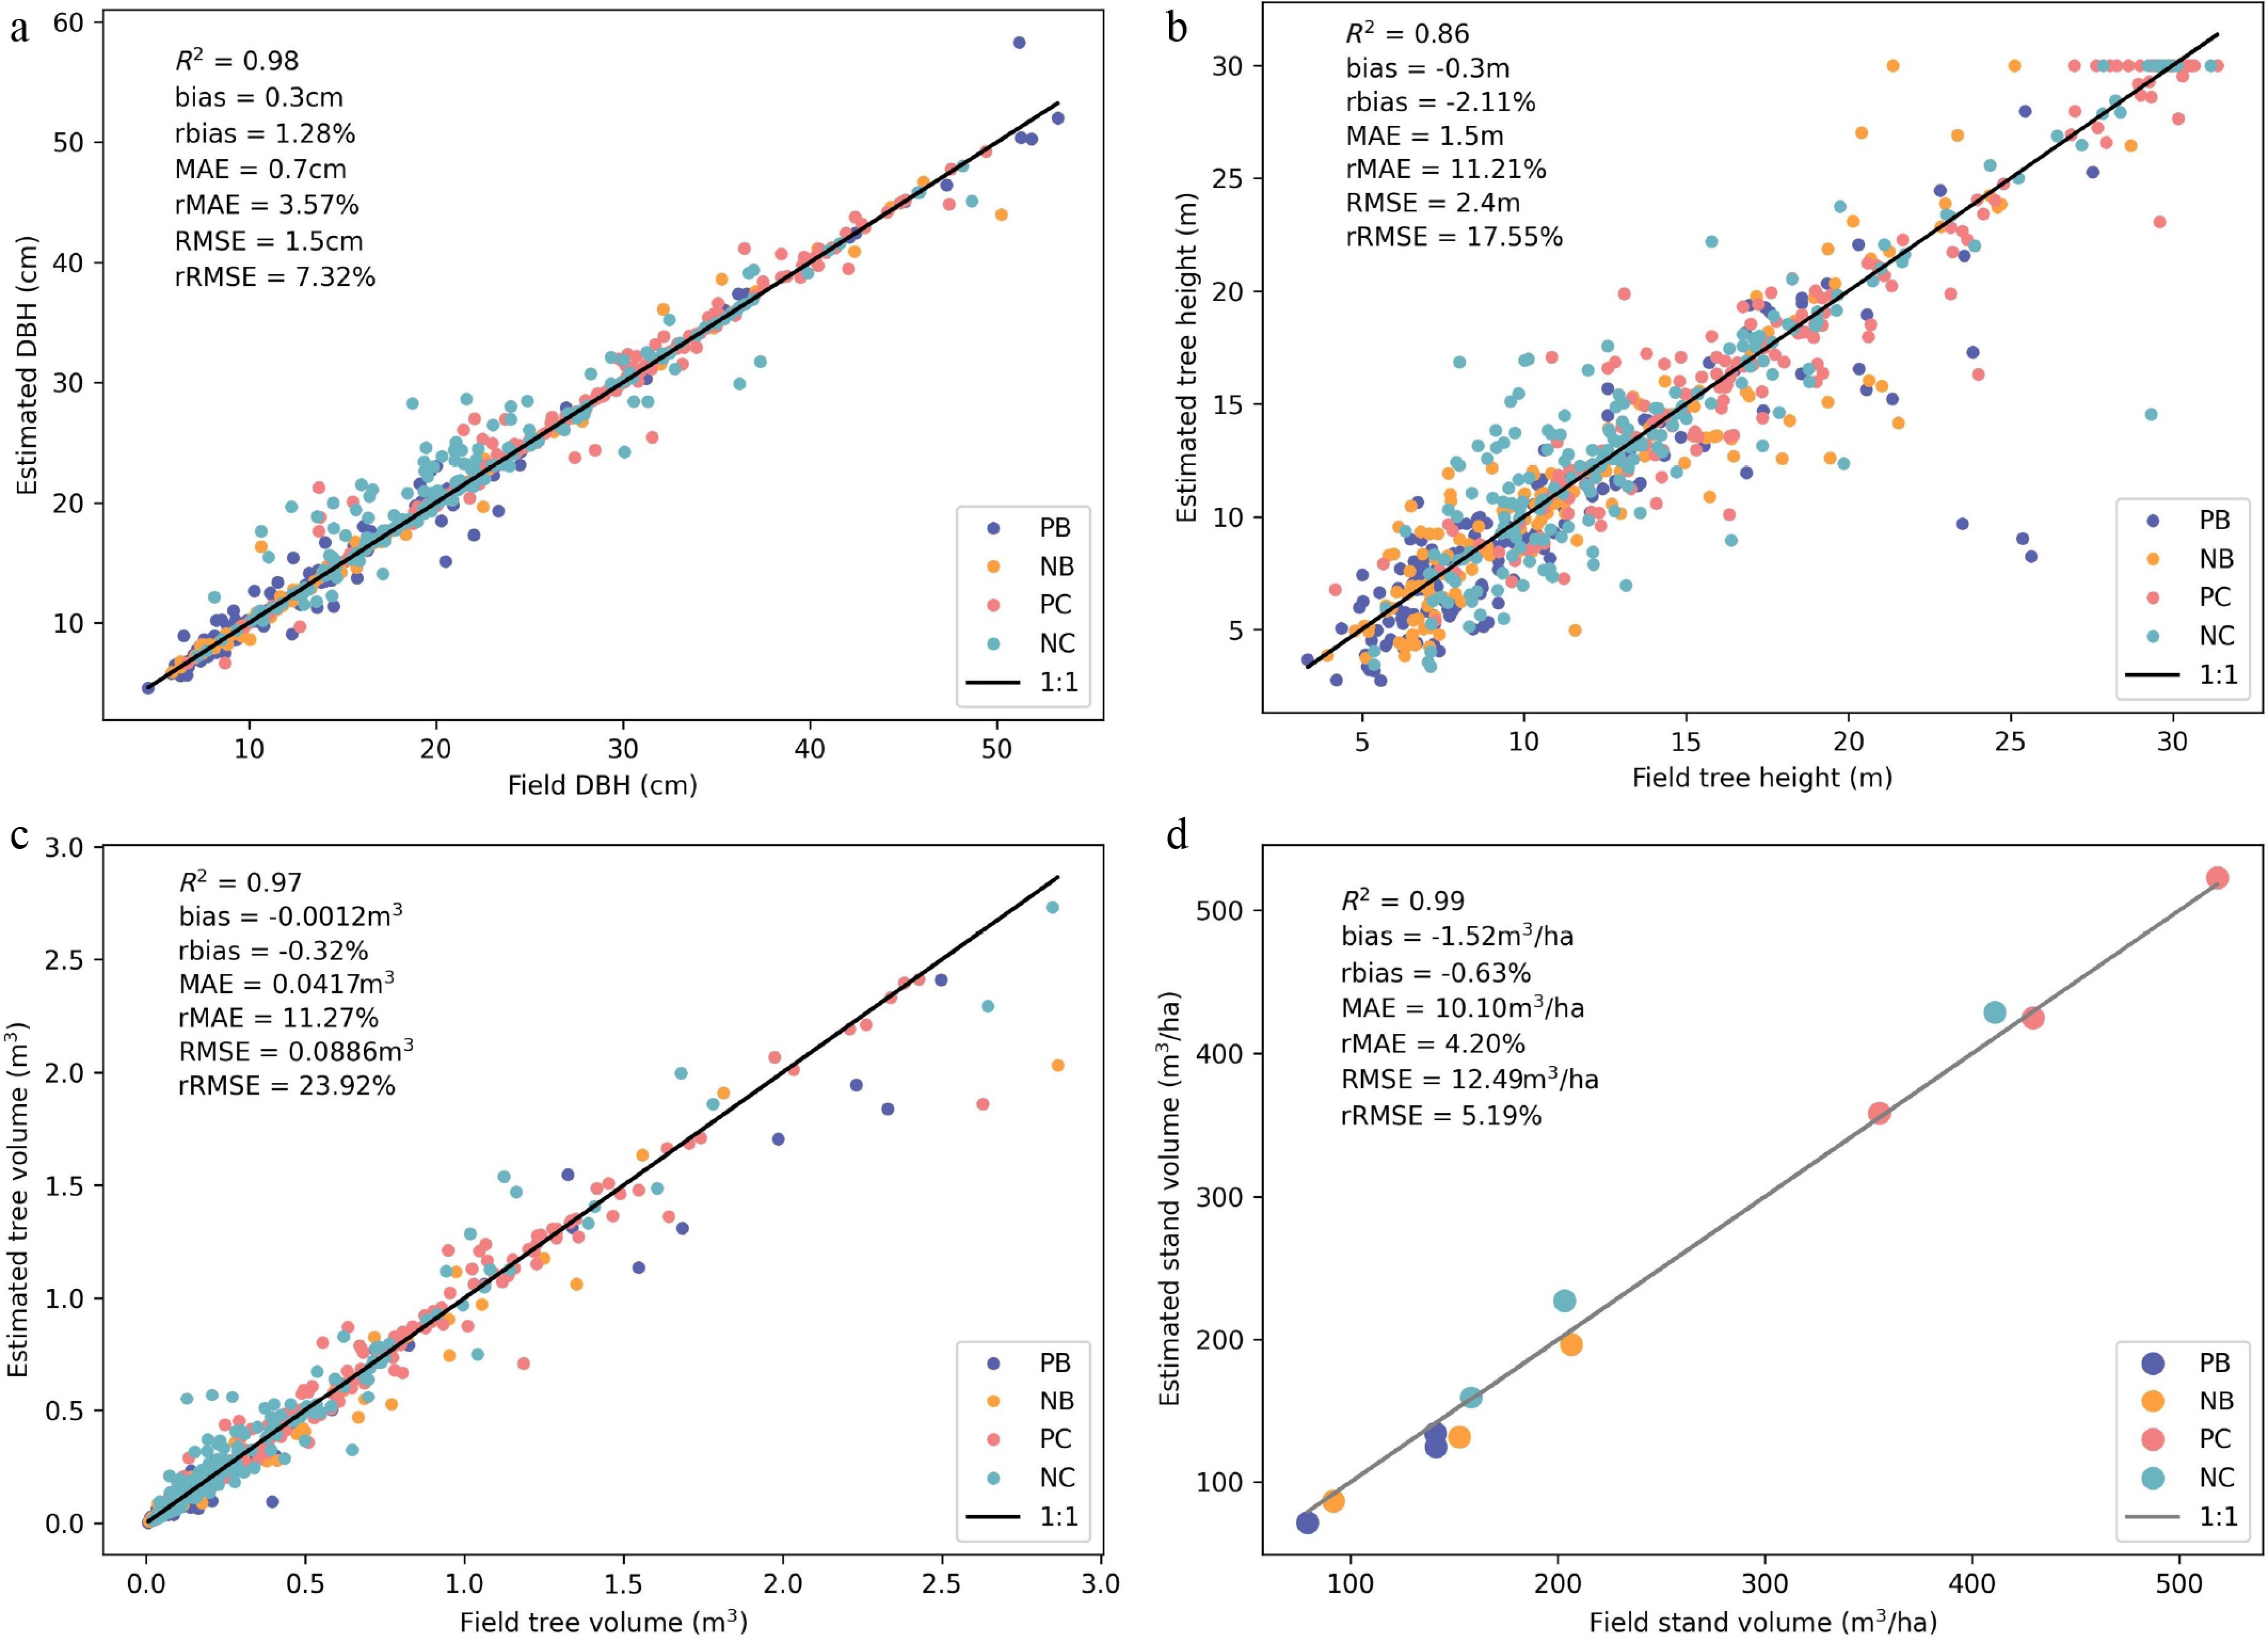
Figure 5.
Scatter plots of LiDAR-extracted forest attributes vs measured forest attributes across plots: (a) diameter at breast height (DBH), (b) tree height, (c) stem volume, and (d) stand volume.
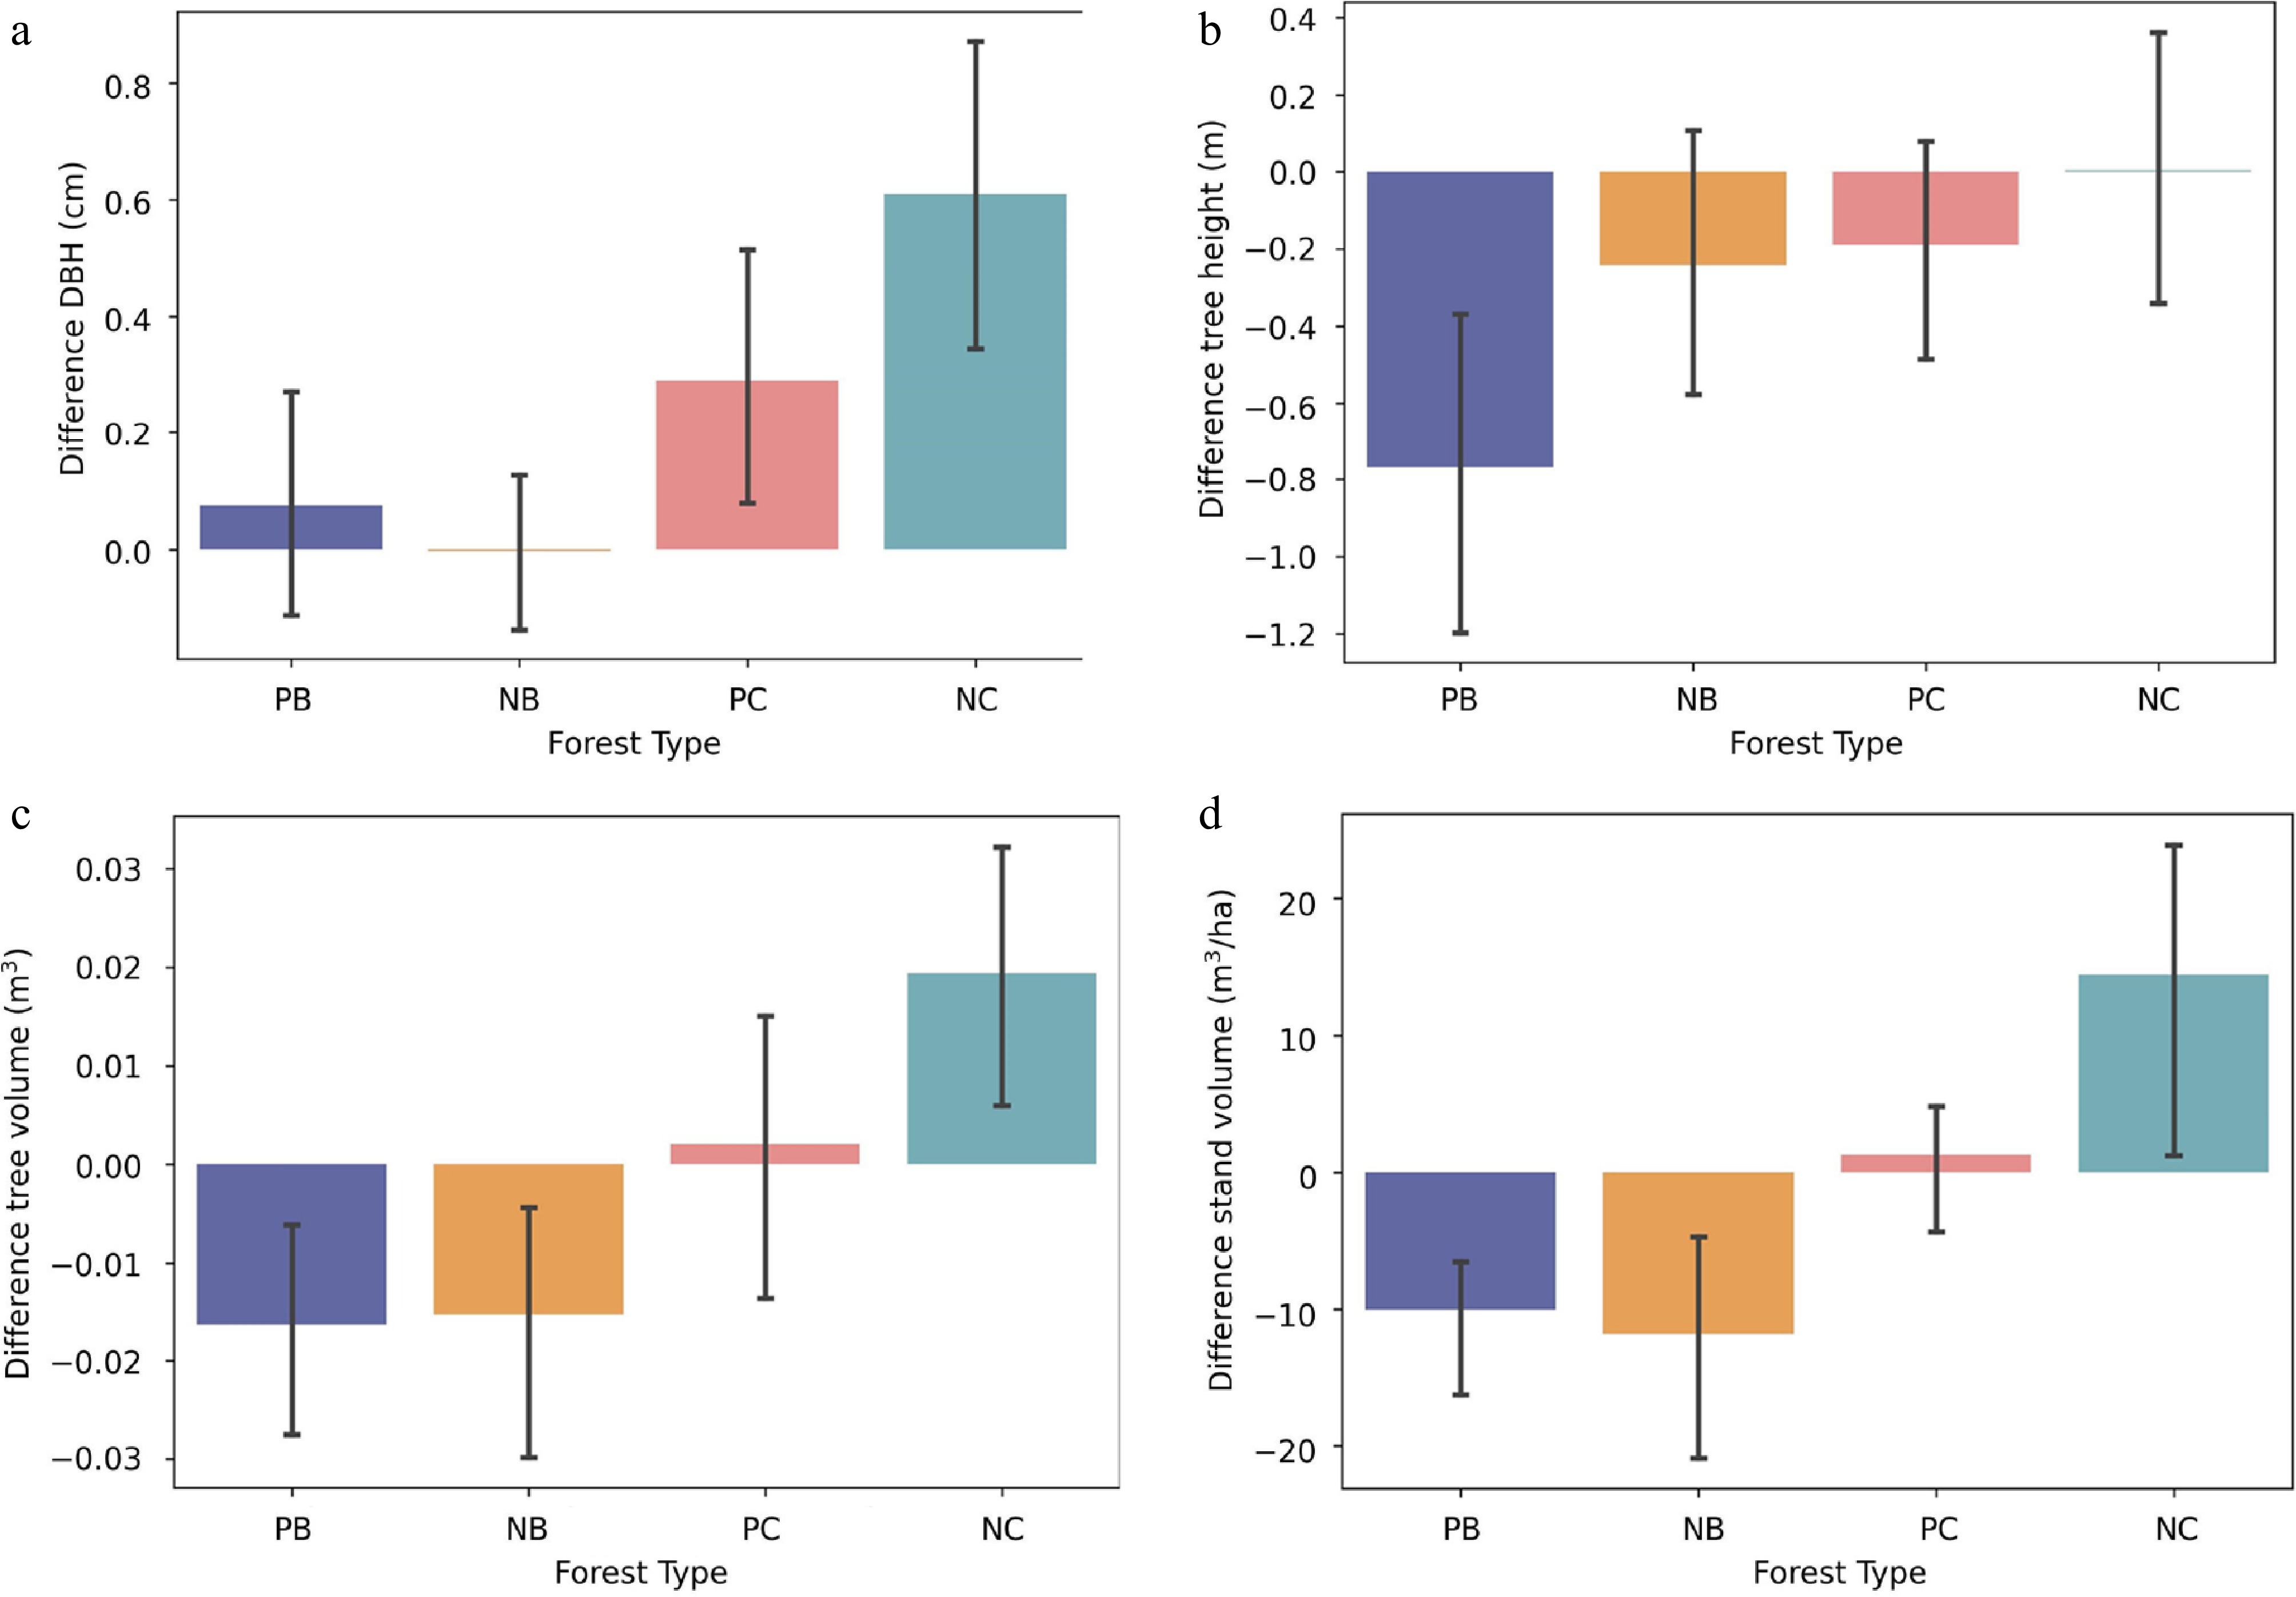
Figure 6.
Bar plots of bias errors for LiDAR-extracted vs measured forest attributes across plots: (a) diameter at breast height (DBH), (b) tree height, (c) stem volume, and (d) stand volume.
Accuracy of tree height
-
We compared tree height estimation using two methods: the stem curve model (Table 3) and the H-D model (Table 4). Stem curve construction rates varied across plots, with a maximum of 91.89% in plot 9 and a minimum of 42.62% in plot 1, both in planted forests. Natural forests (plots 7–12) also showed varying stem curve construction rates, ranging from 54.00% to 91.89%. Plot 9 had the highest successful construction rate at 91.89%, with an estimated tree height R2 value of 0.97, MAE of 0.62 m, and rMAE of 6.09%, indicating high accuracy. On the other hand, plot 1 had the lowest successful construction rate at 42.62%, with an
$ {R}^{2} $ $ {R}^{2} $ $ {R}^{2} $ $ {R}^{2} $ Table 3. The accuracy of tree height from stem curve constructed in plots.
Plot ID Successful stem curve constructed rate (%) Tree height for stem curve constructed R2 bias (m) rbias (%) MAE (m) rMAE (%) RMSE (m) rRMSE (%) 1 42.62 0.90 −0.20 −2.14 1.20 12.89 1.41 15.09 2 83.93 0.89 −0.61 −5.77 1.36 12.79 1.63 15.39 3 84.00 0.89 −0.56 −5.67 1.35 13.72 1.58 16.06 4 81.03 0.97 −0.17 −0.97 0.92 5.23 1.21 6.92 5 82.76 0.95 −0.34 −2.05 0.90 5.48 1.23 7.45 6 88.46 0.97 0.04 0.20 0.95 4.45 1.28 5.97 7 55.71 0.80 0.24 1.80 1.74 13.07 2.64 19.83 8 64.58 0.94 −0.44 −3.92 1.15 10.19 1.45 12.86 9 91.89 0.97 −0.34 −3.29 0.62 6.09 0.96 9.40 10 74.67 0.97 −0.06 −0.36 0.94 5.88 1.37 8.64 11 54.00 0.93 −0.62 −4.59 0.88 6.50 1.35 9.94 12 64.47 0.86 −0.59 −4.91 1.14 9.47 1.54 12.76 Table 4. The accuracy of tree height from stand H-D model in plots.
Plot ID Tree height from H-D model R2 bias (m) rbias (%) MAE (m) rMAE (%) RMSE (m) rRMSE (%) 1 0.78 −0.71 −6.75 1.33 12.67 2.08 19.80 2 0.25 −3.28 −24.75 5.25 39.64 8.18 61.72 3 0.04 −2.07 −16.69 3.60 29.10 5.42 43.82 4 0.41 −2.18 −12.18 3.27 18.31 3.67 20.53 5 0.30 0.73 4.78 2.95 19.20 3.73 24.25 6 0.27 1.17 6.91 2.55 15.00 3.45 20.32 7 0.68 0.41 3.84 1.46 13.54 1.96 18.19 8 0.50 −1.80 −12.38 3.29 22.59 3.65 25.10 9 0.06 −2.87 −19.22 3.92 26.28 4.65 31.17 10 0.36 0.71 5.02 3.61 25.55 4.91 34.75 11 0.60 −0.10 −0.80 2.38 18.65 3.02 23.61 12 0.33 1.43 12.26 2.72 23.32 3.61 30.96 Table 4 presents the accuracy of tree height estimates using the H-D model at the stand level, aiding in estimation of tree heights not derived from the stem curve model. Notably, sample plot 1 demonstrates the highest accuracy in tree height estimation, with an
$ {R}^{2} $ $ {R}^{2} $ $ {R}^{2} $ $ {R}^{2} $ $ {R}^{2} $ Figure 5b displays a scatter plot comparing the extracted tree height with the field-measured tree height. The statistical analysis reveals a strong correlation between the two with an
$ {R}^{2} $ Individual wood volume estimation
-
The stem volume estimates derived from HMLS data demonstrated high accuracy and consistency with field measurements across most plots, with
$ ({R}^{2}) $ $ ({R}^{2}) $ $ ({R}^{2}=0.77) $ $ ({R}^{2}) $ Table 5. The accuracy of stem volume in each plot.
Plot ID Stem volume R2 bias (m3) rbias (%) MAE (m3) rMAE (%) RMSE (m3) rRMSE (%) 1 0.96 −0.0240 −11.55 0.03 15.91 0.0978 46.99 2 0.98 −0.0105 −4.65 0.03 11.44 0.0645 28.52 3 0.88 −0.0131 −9.19 0.03 19.52 0.0549 38.51 4 0.96 −0.0067 −1.01 0.06 8.69 0.1205 18.08 5 0.98 0.0052 0.95 0.03 6.32 0.0579 10.52 6 0.97 0.0083 0.93 0.06 6.84 0.1020 11.37 7 0.94 −0.0125 −4.71 0.04 13.44 0.1087 40.99 8 0.95 −0.0392 −13.70 0.05 17.48 0.1365 47.77 9 0.97 −0.0115 −5.15 0.02 8.82 0.0460 20.64 10 0.96 0.0218 4.43 0.06 12.60 0.1011 20.52 11 0.96 0.0022 0.78 0.04 15.32 0.0748 26.32 12 0.77 0.0283 11.77 0.05 20.52 0.0970 40.30 A scatter plot in Fig. 5c illustrates the relationship between estimated stem volume and field-measured stem volume. The statistical analysis reveals a strong correlation with an
$ {R}^{2} $ Stand volume estimation
-
The accuracy of stand volumes across 12 plots was seen in Fig. 5d. The correlation between the estimated and measured stand volume was high, with
$ {R}^{2} $ Comparison of accuracy across forest types
-
To assess methodological robustness, we aggregated data into four forest categories for statistical comparison (Table 6). Across all groups, DBH extraction remained highly stable, yielding
$ {R}^{2} $ Table 6. The accuracy for forest attributes across four forest types.
Attribute Forest type R2 bias rbias (%) MAE rMAE (%) RMSE rRMSE (%) DBH PB 0.98 0.08 0.50 0.68 4.46 1.25 8.21 PC 0.97 0.29 1.05 0.71 2.55 1.44 5.19 NB 0.99 0.00 −0.02 0.33 1.86 0.90 5.10 NC 0.93 0.61 2.81 1.13 5.22 2.06 9.49 Tree height PB 0.70 −0.77 −7.37 1.64 15.77 2.76 26.47 PC 0.93 −0.19 −1.04 1.26 6.91 1.85 10.18 NB 0.83 −0.24 −2.04 1.51 12.79 2.21 18.75 NC 0.80 0.00 0.03 1.64 12.07 2.53 18.69 Stem volume PB 0.97 −0.02 −8.34 0.03 14.96 0.08 39.11 PC 0.97 0.00 0.30 0.05 7.31 0.10 13.88 NB 0.95 −0.02 −6.47 0.03 13.20 0.08 36.02 NC 0.95 0.02 5.61 0.05 15.24 0.09 27.09 Stand volume PB 0.86 −10.04 −8.34 10.04 8.34 10.97 9.12 PC 0.99 1.28 0.30 4.17 0.96 4.21 0.97 NB 0.92 −11.77 −7.84 11.77 7.84 13.58 9.05 NC 0.98 14.44 5.61 14.44 5.61 17.36 6.75 Units for bias, MAE, and RMSE correspond to the respective attributes: cm for DBH; m for tree height; m3 for stem volume; and m3/ha for stand volume. Other metrics (rbias, rMAE, and rRMSE) are expressed as percentages (%). Conversely, tree height and volume estimations were more sensitive to forest structure. Planted coniferous forests (PC) achieved the highest accuracy, with an rRMSE of 10.18% for height and 13.88% for stem volume. The highest relative errors occurred in planted broad-leaved forests (PB), where the rRMSE for height and stem volume reached 26.47% and 39.11%, respectively, due to complex branch architectures and severe occlusion.
At the stand level, the estimation of stand volume was exceptionally reliable, particularly for coniferous stands where error metrics were consistently lower than those in natural forests. Overall, while the integrated approach effectively compensates for forest parameters when canopy information is difficult to obtain, its accuracy remains higher in simpler plantation structures than in diverse natural forests.
Comparison of the proposed and conventional method
-
Table 7 presents a comparative analysis of tree height estimation results obtained from the conventional direct extraction method using LiDAR360 and the proposed integrated approach. This comparison focuses exclusively on the subset of trees for which both methods yielded valid numerical estimates. Within this subset, the conventional method demonstrated a strong correlation with field-measured heights, achieving an
$ {R}^{2} $ Table 7. Accuracy comparison for tree height estimation.
Method R2 bias (m) rbias (%) MAE (m) rMAE (%) RMSE (m) rRMSE (%) LiDAR 360 0.85 −0.40 −3.57 0.61 5.48 0.81 7.33 Integrated 0.92 −0.19 −1.04 1.26 6.91 1.85 10.18 In contrast, the proposed integrated model substantially improved estimation accuracy. The coefficient of determination increased to 0.92, while the bias decreased to −0.1895 m and the rbias improved to −1.04%. Although the conventional method yielded a slightly lower absolute root mean square error (RMSE) of 0.8129 m within this specific subset, its principal limitation lies in a high omission rate, particularly in dense canopy environments. For trees subject to severe occlusion, LiDAR360 was unable to extract valid height parameters. Conversely, the integrated approach addressed these data gaps by incorporating a stand-level height-diameter (H-D) model, thereby providing reliable height estimates. Consequently, the integrated method not only delivers a more biologically consistent fit for detected stems, but also enhances the overall completeness and reliability of forest inventories in complex terrain conditions.
-
HMLS has demonstrated significant potential in forest resource surveys due to its efficient data collection capabilities[47]. Previous research has indicated that handheld mobile LiDAR is commonly used to extract DBH parameters in forest surveys, showing good results in both artificial and natural forests. However, it is important to acknowledge that handheld mobile LiDAR systems may not achieve 100% accuracy in data extraction from all trees. Our study found instances of missed detections and errors in both artificial and natural forests, with detection errors influenced by the forest stand structure. Particularly in natural forests, the rate of missed and false detections tends to be higher, consistent with prior research. While some researchers have utilized handheld mobile LiDAR systems to extract tree height, most agree that this method faces challenges. Due to factors such as high canopy density and occlusion, obtaining a complete point cloud of the top of the trunk is often unfeasible, hindering accurate tree height extraction. However, our proposed method, which combines LiDAR point cloud data with a forest stem curve and a stand DBH tree height model has shown promising results in reconstructing the stem curve for tree height extraction. Across various forest stands, the root mean square error of tree height extraction can be kept below 2.4 m, with the average median error in artificial forests remaining within 1.5 m.
With a relatively accurate tree height, better results will be achieved in terms of single tree volume and stand accumulation. The study in this article also reveals that the root mean square error and relative root mean square error of single wood volume can be controlled at 0.0886 m3 and 23.92%. When considering the volume of a single tree, broad-leaved forests tend to have an overall underestimation, while coniferous forests tend to have an overall overestimation. Artificial coniferous forests show the highest estimation accuracy for volume. This trend is also observed in forest stands and their storage. By integrating HMLS data with forestry models, we can effectively derive forest parameters in diverse terrain and stand conditions. This methodology is not only applicable to the specific study area but also holds promise for wider use in various forest types. The portable and flexible nature of HMLS equipment makes it well-suited for data collection in remote or challenging terrain forests, overcoming the constraints of conventional methods in such environments.
The effects of site and forest stand characteristics
-
Stand complexity represents a primary constraint on the accuracy of HMLS-derived forest attributes. Our study reveals significant disparities in extraction precision between planted and natural forests. In plantations, which are typically characterized by uniform tree spacing and single-species composition, the simpler canopy structure allows for more consistent laser pulse penetration and higher stem detection rates. Conversely, the structural diversity of natural forests leads to increased laser signal attenuation and irregular point cloud distribution.
This disparity is further accentuated by tree architectural differences. Notably, coniferous forests yielded more accurate height and volume estimations than broad-leaved forests. The intricate crown structures and spreading branches of broad-leaved species create severe occlusion zones, hindering the scanner from capturing the complete stem profile.
Furthermore, the undulating terrain and high vegetation density in mountainous plots significantly hindered signal reflection, resulting in reduced data accuracy. We found that while HMLS meets necessary standards for moderate-height trees, the estimation accuracy for trees exceeding 20 m decreases due to the limited scanning range and perspective of the handheld device. These findings underscore the importance of integrating modeling techniques to compensate for the inherent physical limitations of HMLS in topographically and biologically complex environments.
Factors influencing the accuracy of the stem curve model
-
The accuracy of extracting different height diameters significantly affects the modeling of dry curves. The irregular structure of forest stands and the shape of tree trunks play a crucial role in the extraction process. For example, in sample plots 3 and 6, the presence of curved trees in the forest greatly reduces the accuracy of trunk height extraction. Conversely, while the stems in plots 7, 8, and 9 are relatively straight, the abundance of side branches and twigs complicates complete removal during extraction, leading to significant discrepancies in trunk diameter and tree height accuracy. Furthermore, non-vertical tree growth affects the extraction of the section profile curve, resulting in discrepancies between actual and extracted trunk height changes, thereby impacting trunk curve fitting accuracy. Moreover, highly concentrated extracted diameters present challenges for direct fitting, with extraction errors affecting the overall fitting outcome.
-
HMLS is increasingly utilized for forest inventory because of its efficiency and convenience. However, extracting forest attributes remains challenging in complex stand structures where canopy occlusion limits point cloud penetration. To address these limitations, our method integrates two modeling approaches: Kunze's stem curve fitting for trees with clear trunk points, and stand-level H-D models to predict heights for trees with occluded canopies. This hybrid framework significantly improves the accuracy of stem and stand volume estimations compared to methods relying solely on raw point cloud geometry.
Specifically, our integrated approach is highly effective for forest inventory in rugged mountainous regions with high canopy closure, such as the Shennongjia Forest area. In these environments, the high density of foliage often leads to severe laser occlusion for both HMLS and aerial LiDAR, while steep slopes limit the use of heavy tripod-based scanners. Our method overcomes these challenges by using HMLS for rapid ground-level data acquisition and employing localized modeling to compensate for missing canopy information.
Our results indicate that estimation accuracy is highly sensitive to forest type, with plantations yielding higher precision than natural forests. This disparity is primarily due to the simpler stand structures and lower stem densities in plantations, which reduce signal occlusion and facilitate more robust stem segmentation. Furthermore, a consistent overestimation of DBH and underestimation of tree height were observed. The former is likely caused by point cloud thickness resulting from laser beam divergence and bark roughness, while the latter results from the terrestrial scanning geometry of HMLS, where dense foliage prevents the scanner from capturing the tree apex. Consequently, volume estimation errors varied; the height underestimation in broad-leaved forests led to a volume underestimation, whereas in coniferous forests, the DBH overestimation had a more pronounced impact on the final volume. Ultimately, this approach enhances the utility of handheld LiDAR in dense forests and supports the broader transition towards precision forest management and sustainable silvicultural practices.
-
The authors confirm their contributions to the paper as follows: conceptualization: Dian Y; methodology: Dian Y, Li ZL, Yang Z; software: Li ZL, Yang Z; formal analysis: Dian Y, Zhang Z, Li ZM; validation: Zhang Z, Zhou X, Guo Z; investigation: Guo Z, Hu L, Huang L; data curation: Li ZM, Li ZL, Hu L; writing − original draft: Zhang Z, Zhou X, Li ZL; writing − review and editing: Dian Y; visualization: Zhang Z, Zhou X, Huang L; supervision, project administration, funding acquisition, resources: Dian Y. All authors reviewed the results and approved the final version of the manuscript.
-
The datasets generated during or analyzed during the current study are available from the corresponding author on reasonable request.
-
This research was funded by the National Natural Science Foundation of China (Grant No. 32071683), the Project of Fundamental Research Funds for the Central Universities (2662023YLPY003), and the Hubei Forestry Science and Technology Innovation Project (Grant No. [2025] LKZC11).
-
The authors declare that they have no known competing financial interests or personal relationships that could have appeared to influence the work reported in this paper.
- This article is an open access article distributed under Creative Commons Attribution License (CC BY 4.0), visit https://creativecommons.org/licenses/by/4.0/.
-
About this article
Cite this article
Zhang Z, Zhou X, Li Z, Li Z, Yang Z, et al. 2026. An integrated approach for estimating forest attributes by combining handheld mobile laser scanning with forest models in dense canopy environments. Smart Forestry 1: e012 doi: 10.48130/smartfor-0026-0008 

An integrated approach for estimating forest attributes by combining handheld mobile laser scanning with forest models in dense canopy environments
- Received: 22 January 2026
- Revised: 26 March 2026
- Accepted: 17 April 2026
- Published online: 03 July 2026
Abstract: Accurate estimation of forest attributes is essential for sustainable forest management. While handheld mobile laser scanning (HMLS) enables efficient data collection, its application in complex terrain with dense canopies remains challenging. This study developed an integrated method combining forest models with HMLS data to estimate key forest attributes. The approach involves two steps: (1) reconstructing stem curves from multi-height diameters, and (2) applying stand-level height-diameter (H-D) models to estimate heights for unreconstructed trees. The method was validated using 12 plots in the Shennongjia Forest area encompassing diverse forest characteristics. Results showed that the bias, relative bias (rbias), mean absolute error (MAE), relative MAE (rMAE), root mean square error (RMSE), and relative RMSE (rRMSE) for diameter at breast height (DBH) were 0.3 cm, 1.28%, 0.7 cm, 3.57%, 1.5 cm, and 7.32%, respectively. For tree height, the bias, rbias, MAE, rMAE, RMSE, and rRMSE were −0.3 m, −2.11%, 1.5 m, 11.21%, 2.4 m, and 17.55%, respectively. Stem volume showed a bias, rbias, MAE, rMAE, RMSE, and rRMSE of −0.0012 m3, −0.32%, 0.0417 m3, 11.27%, 0.0886 m3, and 23.92%, respectively. The stand volume exhibited a bias, rbias, MAE, rMAE, RMSE and rRMSE of −1.52 m3/ha, −0.63%, 10.10 m3/ha, 4.20%, 12.49 m3/ha, and 5.19%, respectively. Overall, DBH was slightly overestimated, height was underestimated, and volume accuracy varied by forest type, with plantations demonstrating higher accuracy than natural forests. This approach demonstrates the potential of integrating HMLS with modeling techniques to reliably estimate forest attributes even under dense canopy conditions.
-
Key words:
- Handheld Mobile Laser Scanning /
- Forest attributes /
- Dense canopy /
- Stem curve model /
- Tree height /
- Volume