


-
How do living organisms perceive and adapt to novel environments, ultimately giving rise to phenotypic novelty and evolution? This fundamental question has intrigued biologists for several centuries and can be understood by applying the concept of developmental modularity[1−8]. For example, an ornamental plant develops and evolves like a factory in which different units operate autonomously under their internal rules but are coordinated as a cohesive whole through an overall strategy. The autonomous units of the organism form distinct modules, each representing a structural and functional context, which are subsequently assembled into more complex arrangements[5,8,9]. One form of such modularity can be seen in plants’ response to drought conditions. When an ornamental plant receives a drought signal from the soil, its root module would reinforce the growth of root apical meristems through intra-modular interactions to approach a deep water table[10]. This process simultaneously informs the leaf module to allocate and transport more carbohydrates for root expansion. Long-term adaptation and selection via such modularity in a drought soil can result in the plant evolving into elongated and widely spread root systems for maximum uptake of water[11], accompanied by succulent and shape-varying leaves that can better balance between photosynthesis and water use[12−14].
Although the fundamental ideas behind developmental modularity may date back at least as early as Darwin’s time, it has emerged as a prominent subject of evolutionary biology only in the last two decades[15,16]. Most current studies have focused on the impact of morphological integration and modularity on phenotypic complexity and the evolutionary processes that have created that complexity[6,17]. Morphological traits that function together within a module covary phenotypically[18,19], and the developmental and genetic mechanisms that cause such phenotypic covariation and evolution have been extensively explored by quantitative and molecular genetic approaches[17,20−23]. Different sets of quantitative trait loci (QTLs) responsible for trait correlations, have been identified and mapped to specific chromosomes in various species[24−26]. In particular, pleiotropic control mechanisms of QTLs that affect different traits simultaneously have been investigated experimentally and validated through theoretical simulation[1,7,20,26].
The formation and evolution of modularity are also regulated by ecological mechanisms since the capacity of an organism to respond to environmental perturbations through this developmental phenomenon critically depends on how different component traits interact with each other[27,28]. It has been recognized that the constituent traits of a module are internally integrated by ecological interactions among the traits, but are relatively independent from those from other modules. By viewing the modularity as an ecosystem of developmental traits, its organization and function can be described by evolutionary game theory[29,30]. According to evolutionary game theory, different traits within a module interact and coordinate with each other through two opposite “strategies”, competition and cooperation[31,32], which determines the fitness of modularity, i.e., “payoffs”[33]. By implementing with kinetic models, game theory can be expanded to describe the developmental behavior of modularity over a sequence of time points[32]. Ordinary differential equations have proven to be a powerful tool for constructing dynamic interactions in which the changing rate of phenotypic value of each trait is set as functions of both itself and other interacting traits parties[34−37].
Here, we describe a conceptual framework by which to study developmental modularity and its evolutionary origin as an interactive game. We review the basic principle of evolutionary game theory and its critical role in characterizing and predicting the dynamic changes of modular structure and organization. We further formulate a general procedure of integrating evolutionary game theory into a systems QTL mapping paradigm, enabling the quantitative test of how genes determine a network of internal interactions, manifested as competition, cooperation and altruism, among different traits within and across modules. To this end, we pinpoint several emerging areas of biology which can greatly benefit from the new modeling framework of developmental modularity.
-
For the purpose of evolvability to generate adaptive heritable variation, multicellular organisms often organize their functions and structures into multiple interconnected modules. Each module requires the proper coordination of its constituent parts for full functionality based on the principle of cooperation. Thus, developmental modularity can be examined in light of an ecosystem and its component traits. In such an ecosystem, a trait competes for resources and cooperates with other traits to better survive, function and grow. A dynamic equilibrium, known as homeostasis, is established to maintain the balance of different components during ontogeny and phylogeny. However, as a result of actions by evolutionary forces, such as mutations, gene recombination, genetic drift and so on, this equilibrium can be disrupted to seek for a new state of equilibrium, thus leading to the production of novel phenotypes and functions[16]. This disruption could also occur due to environmental changes. To maximize the evolutionary fitness of the organism but at a minimum cost, different parts of the organism would not evolve at the same rate[27] and, as such, modularity is thought to play an important role in such phenotypic changes.
Modularity may operate through either variational modules or functional modules[8]. Although these two kinds of modules are not exclusive from one another, a variational module describes the morphological and anatomical covariation of some related traits whereas a functional module focuses on the physiological and functional similarity of a set of features. For both kinds of modules, the organization and function of modularity rely critically on how different components interact internally within a module and how these interactions are controlled by the so-called modular pleiotropy, i.e., the pleiotropic effects on a subset of functionally related traits[38]. Below, we show the implementation of evolutionary game theory to address these important issues.
Modular game theory
-
Our idea is elucidated by introducing a botanical paradigm, which is roughly broken down into root, stem, leaf and flower modules (Fig. 1). Many ornamental plants are grown in drought and saline environments. To maintain their survival, growth and reduction, these plants will adjust and coalesce their morphological, anatomical, and physiological characteristics on different modules into a cohesive whole. One of their first responses to drought and saline soils deeply extend roots that enable it to obtain the maximum uptake of underground water from deep soils, a phenomenon widely observed in many stress-resistant species in the desert, such as Euphrates poplar[11,39]. The leaves of many drought-resistant plants are heteroblastic; i.e., leaves on the same plant or even the same branch may have strikingly different shapes[13,14]. To intercept more radiation, their leaves on fertile branches at the upper position of a plant may be elliptic, ovate, or deltoid in shape, whereas leaf-blades on the sterile lower branches are linear to lanceolate, which helps to prevent the loss of water. After a series of development stages, these plants will reproduce fertile seeds for next progeny. To complete its entire lifetime from vegetative to reproductive growth phases, the plants need the proper coordination of different traits within and between modules. For example, functioning through the root modularity, the plants preferentially develop an elongated taproot to tap underground water or widely spread lateral roots to take up water at or near the surface of its habitat given a fixed amount of resource it can utilize. This fundamental question has interested plant ecologists for a long time[39−42].
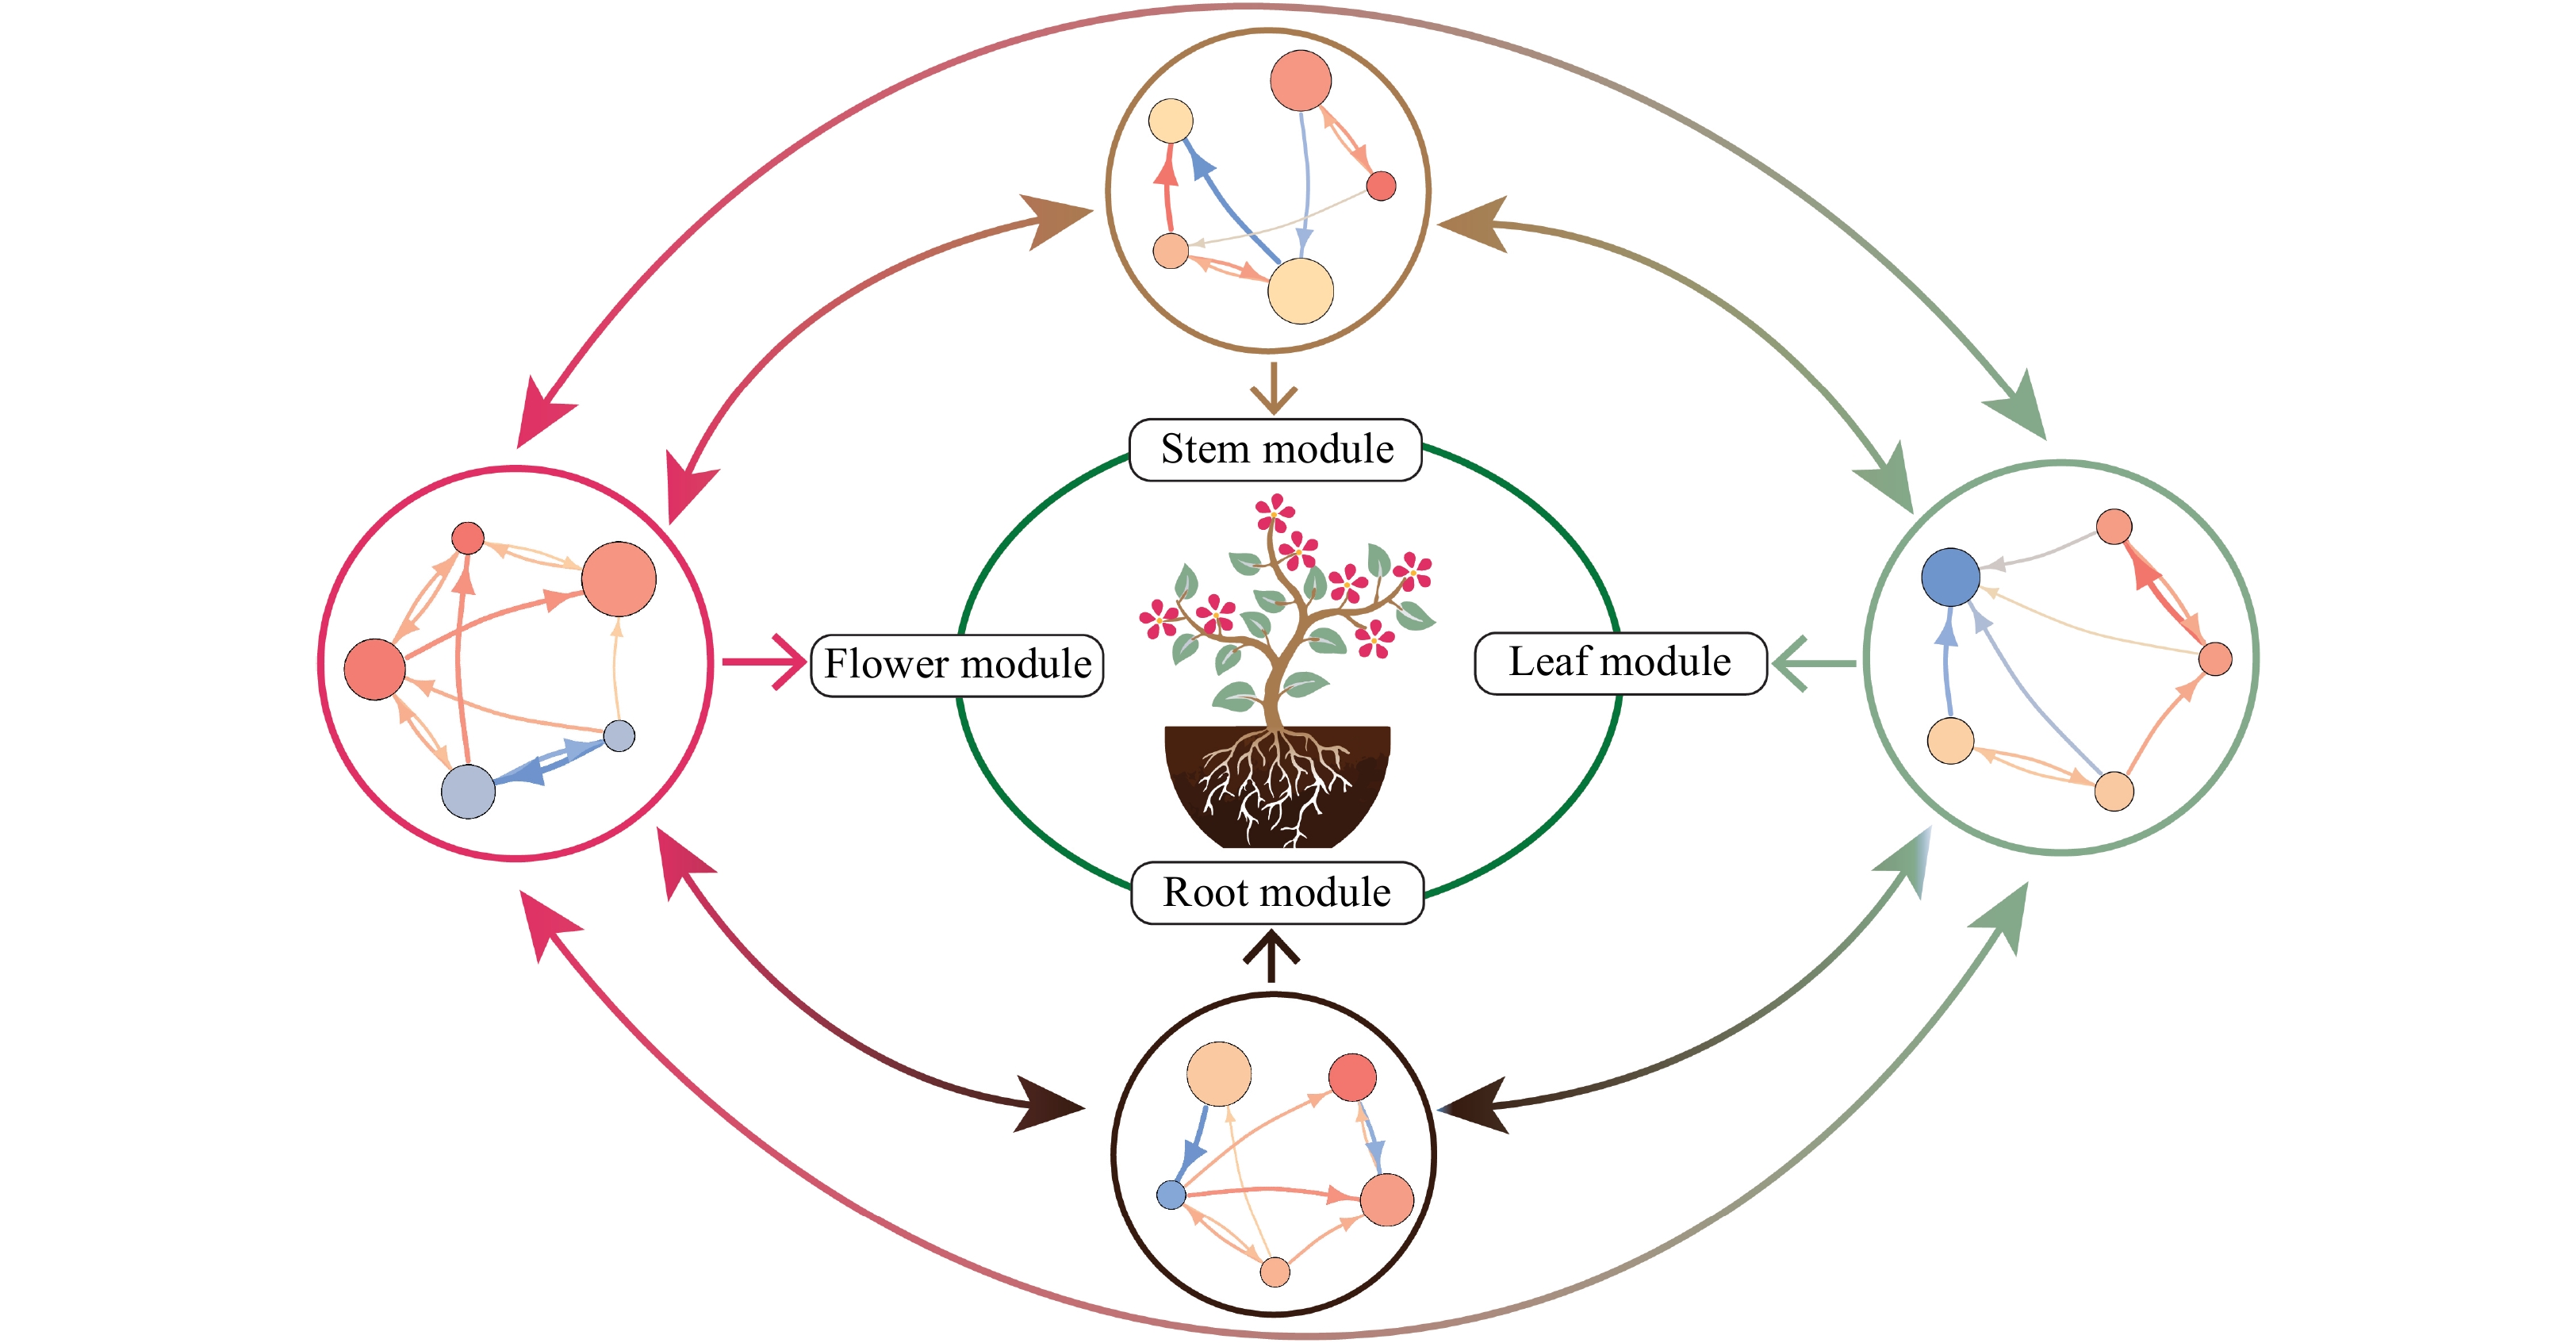
Figure 1. Schematic diagram of a growing ornamental plant. By viewing the whole plant as an ecological system, we dissect it into multi-level hierarchical communities or modules according to its morphological features, i.e., stem, root, leaf, and flower. Each module is composed of highly correlated traits that are relatively weakly related with those from other modules. Genetic networks that specifically affect a module are linked to form a multiscale, multilayer and multiplex network shaping the growth, reproduction, and evolution of the plant. Circles in the outer represent genetic networks for a module, in which nodes and edge stand for genes and directed gene-gene interactions, respectively. Red and blue arrowed lines represent upregulation and downregulation, respectively, with line thickness proportional to the strength of regulation.
As the study of conflicts of interest, game theory models the value of an action conducted by a decision maker that depends not only on its own strategies but also on those of others[33]. Our didactic example complies with the basic principle of game theory, in which the taproot and lateral roots of a drought-resistant plant, two interactive decision markers, adopt different strategies to obtain maximum payoff. The taproot may choose to either actively or inactively elongate depending on its interaction with the surrounding physical and biotic environments. Similarly, the lateral roots may use extensive or restricted spread as their strategies. The relative growth and trade-off of the taproot and lateral roots determine the overall behavior of the root module (i.e., payoff) for the plant to assimilate water (and nutrients). The analysis above can be described as a payoff matrix, expressed as
$ \begin{array}{l} \;\;\;\;\;\;\;\;\;\;\;\;\;\;\;\;\;\;\;\;\;\;\;\;\;\;\;\;\;\;\;\;\;\;\;\;\;\;\;\;\;\;\;\;\;\;\;\;\;\;\;\;\;\;\;\;\;\;\;\;\;\;\;\;\;\;\;\;\;\;\;\;\;\;\;\;\;\;\;\;\;\;\;\;\;{\rm{\;\;\;\;\;\;\;\;\;\;\;\quad\quad\;\;\quad\;\;Lateral\;}}\;{\rm{\;Roots\;}}\\ \;\;\;\;\;\;\;\;\;\;\;\;\;\;\;\;\;\;\;\;\;\;\;\;\;\;\;\;\;\;\;\;\;\;\;\;\;\;\;\;\;\;\;\;\;\;\;\;\;\;\;\;\;\;\;\;\;\;\;\;\;\;\;\;\;\;\;\;\;\;\;\;\;\;\;\overline {{\rm{\;\;\;\;\quad\;Extensive}}\;{\rm{spread}}\;\;\;\;\;\;\;\;\;\;\;\;\;\;\;\;\;{\rm{Restricted}}\;{\rm{spread\;\;\;\;\;\;\;\;\;}}} \\ \overline {{\rm{\;\;\;Taproot}}\;\;\;\;\;\;\;\;\;{\rm{Strong}}\;{\rm{elongation }}\left( + \right)\;\;\;\;\;\;\;\;\; + + {\rm{ }}\left( {{\rm{cooperation}}} \right)\;\;\;\;\;\;\;\;\;\;\;\;\;\;\;\;\;\;\; + -{\rm{ }}\left( {{\rm{altruism}}\;{\rm{for}}\;{\rm{taproot}}} \right)\;\;\;} \\ \underline {\;\;\;\;\;\;\;\;\;\;\;\;\;\;\;\;\;\;\;\;\;\;\;\;\;\;{\rm{Weak}}\;{\rm{elongation }}\left( - \right)\;\;\;\;\;\;\;\;\;\;- + {\rm{ }}\left( {{\rm{altruism}}\;{\rm{for}}\;{\rm{laterals}}} \right)\;\;\;\;\;\;-{\rm{ }}-{\rm{ }}\left( {{\rm{competition}}} \right)\;\;\;\;\;\;\;\;\;\;\;\;\;\;\;} \end{array} $ (1) If the taproot elongates rapidly down along with the extensive spread of lateral roots, a cooperative relationship occurs between the two decision makers, leading to the formation of a large root system. The strong elongation of the taproot at a cost of lateral root growth implies altruism for the former, whereas the inverse pattern is altruism for the latter. Competition takes place when both types of roots grow and proliferate at each other’s cost. Environment plays an important role in forming these interactions[42]. For example, if water is distributed at the surface of the soil, altruism for lateral roots should be predominant. On the other hand, altruism is for the taproot in the habit where there is only deep underground water available. For drought soils at both surface and underground positions, the taproot and lateral roots compete against each other for limited water. If water is not a limiting factor, both the taproot and lateral roots tend to cooperate with each other. Genetic factors should also play an important role in regulating the formation of interaction types. We integrate game theory and systems mapping to dissect the relative contributions of genes, environment and gene-environment interactions to the pattern of ecological interactions for the root system.
Developmental game theory
-
Trait interactions within a module vary over developmental time. Consider our didactic root module with the simplest structure, composed of only two traits, the taproot and lateral roots. A number of kinetic equations have been available in the literature to describe the growth of a single trait[43], but bi-variate or multivariate growth equations that can model developmental interactions between multiple traits have not been well developed. Fu et al.[34] generalized the principle of Lotka-Volterra equations and allometric scaling law[44] to quantify the dynamic relationship of stem primary and secondary growth in woody plants. The Lotka-Volterra equations composed of two coupling ordinary differential equations (ODEs) can be also used to characterize how the taproot and lateral roots interact dynamically within the root module. Each of these two equations represents the growth of a different trait, including two parts, independent growth and interactive growth. The independent growth of a given trait is the amount of its growth that is formed as if there is no interaction between traits, and the interactive growth reflects the growth of this trait affected by its interacting trait. The ratio of the interactive growth to independent growth is correlated with the strength of trait-trait interaction, although this ratio can be positive or negative.
Specifically, let g1 and g2 denote the growth of the taproot and lateral roots at time t. The two traits interact in a way that is specified by the Lotka-Volterra equations, expressed as
$\left\{ \begin{aligned}& \frac{{d{g_1}}}{{dt}} = {\alpha _1}\left( {1 - {{\left( {\frac{{{g_1}}}{{{K_1}}}} \right)}^{{r_1}}}} \right){\rm{ }} + {\beta _{1 \leftarrow 2}}g_2^{{s_{{}_{1 \leftarrow 2}}}}{\rm{ }} \\ & \frac{{d{g_2}}}{{dt}} = {\alpha _2}\left( {1 - {{\left( {\frac{{{g_2}}}{{{K_2}}}} \right)}^{{r_2}}}} \right){\rm{ }} + {\beta _{2 \leftarrow 1}}g_1^{{s_{{}_{2 \leftarrow 1}}} } \end{aligned} \right.$ (2) where the first and second terms at the right-hand side are the independent and interactive growth, respectively, both contributing to the observed growth rate of each trait. The independent growth is believed to follow a universal law[43], in which parameters α1 and α2 are independent growth rates of the taproot and lateral roots; K1 and K2 are maximum growth values of the two traits, respectively; and r1 and r2 describe how fast the two traits grow to the maximum value. The interactive growth describes the type and strength of dependence of one trait on the other, determined by interaction parameters β1←2 and β2←1, and interaction-evolving parameters s1←2 and s2←1. The type of dependence of the taproot and lateral root is determined by the sign of interaction parameters, i.e.,
(a) The two traits are mutualistic if both parameters are positive,
(b) The two traits are antagonistic to each other if both parameters are negative;
(c) Lateral roots are altruistic for the taproot if β1←2 is negative but β2←1 is positive;
(d) The taproot is altruistic for lateral roots if β2←1 is negative but β1←2 is positive;
(e) The taproot and lateral roots are independent from each other if β1←2 and β2←1 are both zero.
The strength of trait-trait dependence depends on both interaction parameters and interaction-evolving parameters, but the latter also determine how the interaction changes over development. This can be assessed as follows:
(a) The interaction strengthens with root growth if s1←2 and s2←1 are both positive;
(b) The interaction weakens with root growth if s1←2 and s2←1 are both negative;
(c) The interaction strengthens with taproot growth but weakens with lateral root growth if s1←2 is positive but s2←1 is negative;
(d) The interaction strengthens with lateral root growth but weakens with taproot root growth if s2←1 is positive but s1←2 is negative;
(e) The interaction does not depend on root growth if they are both zero.
By formulating ODEs and estimating and testing their parameters, game theory is equipped with a capacity to determine the mechanistic pattern of interactions between different traits within a module. The ODEs given in equation (2) that tackle two interacting traits, can be extended to specify the interrelationships among more than two traits, facilitating the construction of the network of interactions. For example, as a pathway to acquire and assimilate water and mineral nutrients, fine roots are a key component that constitutes the root module and should be involved in expanded ODEs. More traits can better reveal the morphological and physiological features of biological organs including the root system.
Case study: Seedling emergence of Euphrates poplar
-
To show the biological relevance of the ODEs in equation (2), we illustrate an example from a woody plant, Euphrates poplar (Populus euphratica Oliver), one of the very few trees that can survive and grow in the desert[45]. To adapt to drought and saline environments, Euphrates poplar is characterized by many unique features. It must possess deeply extended roots that enable it to obtain the maximum uptake of underground water from deep soils[11,39]. Zhang et al. [46] recently reported a QTL mapping experiment using a full-sib family of 370 F1 progeny between two Euphrates poplar trees sampled from a natural population. The seeds of these progeny were germinated into seedlings individually in glass tubes containing 350 ml 1/2 Murashige and Skoog medium (pH = 6.0). Each seedling was measured for shoot length, taproot length, total length of lateral roots, and the number of lateral roots repeatedly once every week until some fast-growing seedlings filled the tubes. These traits were organized into three hierarchical modules, the main axe module (MAM) composed of shoot and taproot, the root module (RM) containing taproot and lateral root, and the lateral root module (LRM) consisted of number and average length of lateral roots. ODEs (2) were found to well fit the average curves of two constituent traits within each module (R2 = 0.95–0.98; Fig. 2). On average, shoot growth of these seedlings is slightly affected by taproot growth, but taproot growth is remarkably inhibited by shoot growth (Fig. 2a), suggesting that, at the emergence stage of seedlings, shoot and taproot growth are mutually competitive although the above-ground is more aggressive than the below-ground. The observed growth of taproot length in tubes is much lower than as expected since its independent growth is shifted down by lateral root growth (Fig. 2b). The unfavorable effect on lateral root growth by taproot growth was also observed, but this effect seems to diminish with seedling development. The number of lateral roots does not affect their average length, but the average length promotes the number (Fig. 2c), showing that lateral length growth is altruistic to lateral number increase.
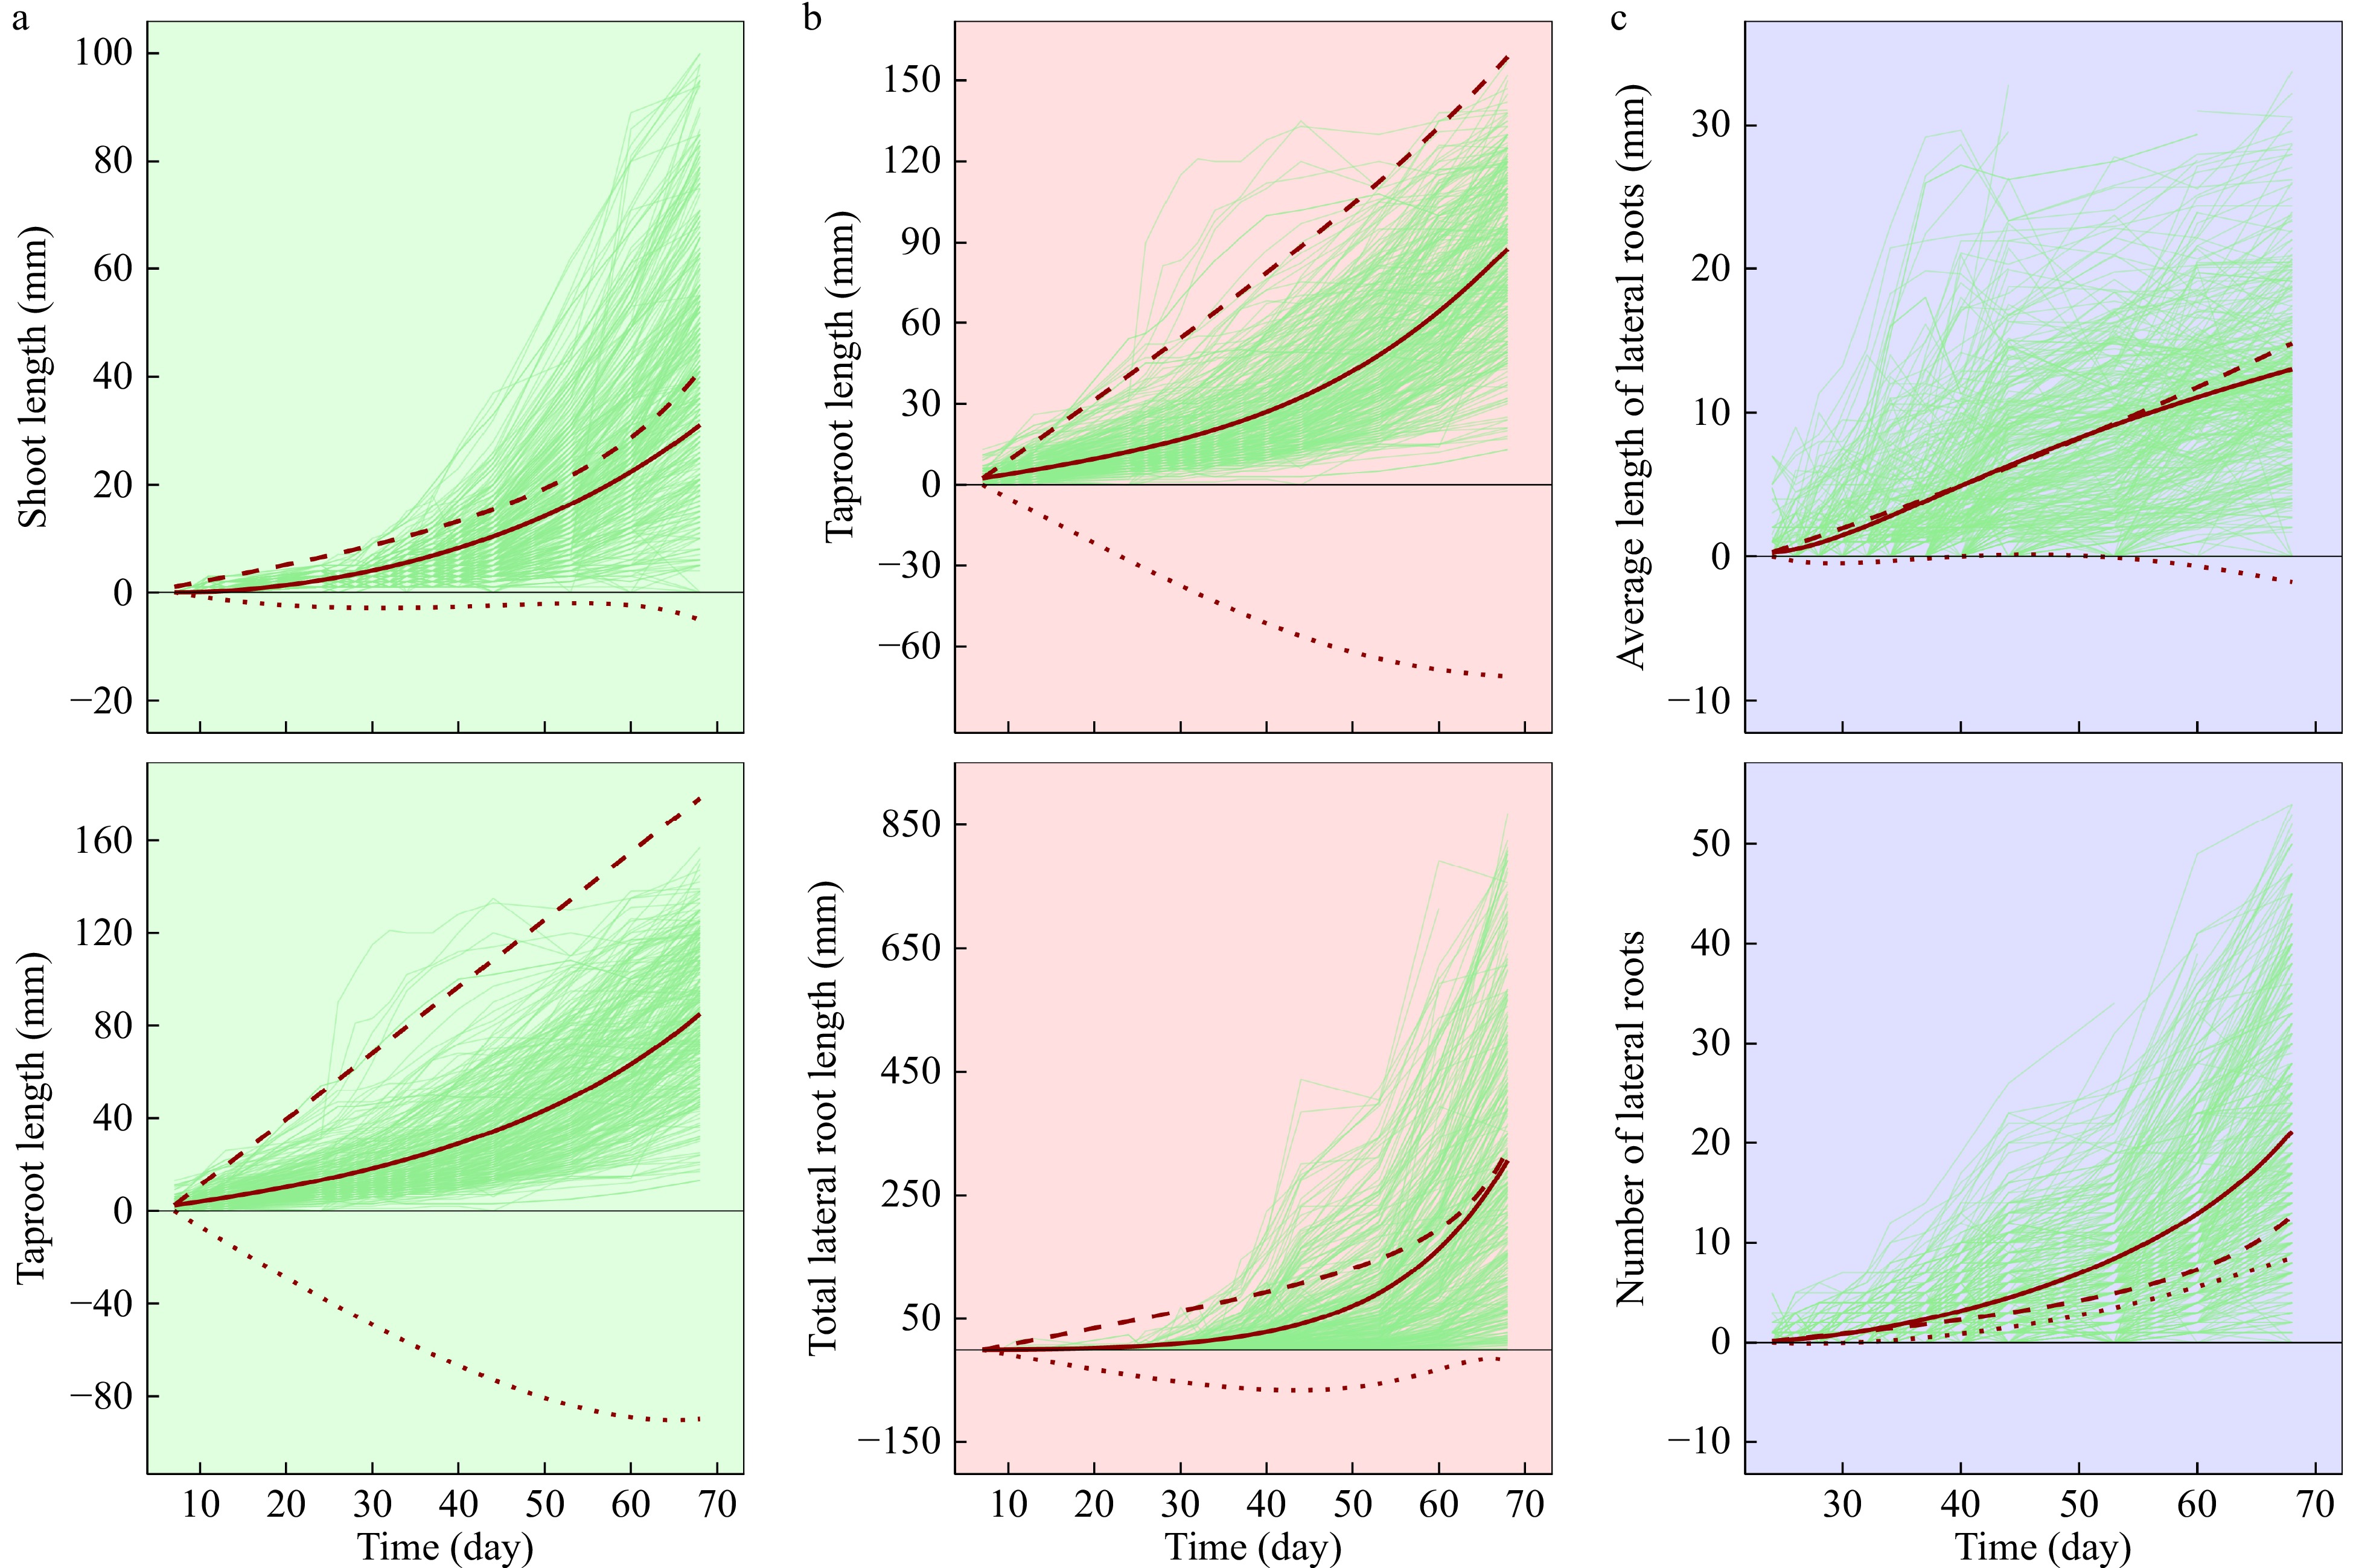
Figure 2. Trajectories of interacting growth traits within each of three hierarchical modules, the main axe module (a), the root module (b) and the lateral root module (c). Thick red lines are the overall mean growth curves of a trait, fitted by ODEs (2) to raw dynamic data (thin light green lines), within a module, hashed lines (---) are the independent growth curve of a trait as expected in isolation, and dotted lines (...) are the dependent growth curves of a trait upon its interacting trait. Data from a published study[46].
Taken together, the taproot is a “squeezed” trait repressed not only by the shoot, but also by the lateral roots. The taproot plays a keystone role in maintaining the balance of the above- and below-ground growth. As shown in Fig. 2, the growth trajectories of all traits studied have considerable variability, implying the possible existence of genetic variants that mediate the structure and organization of different modules.
-
Berg[47] used correlation pleiades, i.e., a set of highly intercorrelated traits, to define the morphological integration of traits within two distinct modules, vegetative and reproductive. The evolutionary success of higher plants depends on how they can balance vegetative and reproductive growth at the whole plant level in response to environmental change. The vegetative module can be divided into two functional modules, above- and below-ground. One can always divide a module into ones at the lower level. As an essential component of the above-ground module, the leaf submodule has been a focus of physiological and ecological research[41]. As an example of demonstration, game theory can be similarly implemented to dissect the leaf module of plants. As the root system evolves into a special structure for growth in drought soils, the leaves of the plant develop into considerable within-plant variation in size, shape and function to resist abiotic stresses[13]. For such a plant, leaf shape varies gradually from linear at its low crown through lanceolate at its middle crown to dentate broad-ovate at its up crown[14]. Consider two distinct leaf modules at the lower and upper crown of the plant, composed of lanceolate leaves and ovate leaves, respectively. The key morphological components of each of these modules include leaf number, leaf-blade length and width, single leaf area, and total leaf area. Game theory can explain how these traits coordinate to form maximum total leaf area within each module. Leaf length and width are two interacting traits, which determine single leaf area collectively. In a particular environment, the two traits may cooperate, but in others they may compete. Furthermore, the strategies of coordinating and compromising their relationship may be different for the lanceolate module and ovate module. Similarly, single leaf area and leaf number form a pattern of interaction at the higher level, which affects total leaf area of each module. Based on the principle of game theory, we can formulate a two-stage hierarchic platform of ODE groups for leaf length and width at the lower level and single leaf area and leaf number at the upper level. Similar to ODEs (2), these new ODEs at each level of the platform can be used to discern the cooperation, competition and altruism of two interacting traits, increasing our capacity to predict the mechanistic response of leaf traits to changing environment.
The reproductive capacity of a higher organism is a key to determine its evolutionary success in environmental disturbances. The reproductive module of a plant is constructed morphologically by the number and size of flowers. The allocation of resources to produce more flowers of a small size or large flowers of a small number determines whether a single plant can achieve its maximum fitness under a particular environmental condition[45]. For individual flowers, the number and size of their organs represent two interacting subcomponents within the reproductive module. Furthermore, an optimal tradeoff should exist between the number and size of seeds, direct indicators of Darwinian fitness. Game theory, integrated with a three-stage hierarchic ODE platform[48,49], can be incorporated to characterize the pattern of ecological interactions expressed at these three different levels of organization within the reproductive module. The ODE parameters can be specified within and between different levels, enabling the explanation of how different traits interact with each other at the same level and how they affect the expression of inter-trait interactions at the higher level.
Modeling interactions within and across modules
-
Although each module is relatively autonomous to perform its specific function, the proper connection of different modules is essential as a whole to behave in an optimal state. For example, when a plant decides to elongate its taproot into deep soil for more water intake, the leaves above ground are quickly informed and asked to supply and transport essential materials and energy for root elongation by producing carbohydrates under photosynthesis. Growing under stress conditions, the plant tends to produce an unusually large amount of seeds that help to assure its gene transmission and dispersal through harsh natural selection. However, over investment of resources to seed production will limit the growth of vegetative organs and, ultimately, inversely affect the fitness of the tree.
To illustrate our idea of modeling trait interactions across modules, we organize the whole organism of a plant into various modules expressed at different organizational levels. At level 1, the plant is organized into its vegetative and reproductive modules. The vegetative module is further decomposed into root and leaf modules at a lower level, and the reproductive module is composed of the size of flowers and their number. Let us consider four modules, i.e., main stem, roots, leaves, and flowers, within each of which component traits interact with each other and with those from other modules. A unifying model of informational flow across different modules should be built to better synthesize the overall function of the organism.
We implement multistage game theory, which has well been developed in economic research[50−53], to dissect trait interrelationships within and between modules. The pattern of interactions among these four modules is specified by deriving a set of four generalized Lotka-Volterra equations based on the time-dependent biomass of these modules. Each equation includes the independent growth of the target module and the interaction growth between the target and each of the three other modules. The sign and strength of the interaction growth is determined by a model parameter βk←l where k is the target module and l is the module with which the target interacts (k, l = stem, root, leaf, or flower). By estimating and testing βk←l, we can discern the cooperation, competition and altruism of growth between two particular modules.
Another set of kinetic equations is implemented to characterize the interaction between different traits expressed at the lower level within each module. A way to derive these kinetic equations is based on the integration of coordination theory and allometric scaling[44,54,55]. According to allometric scaling laws, the component trait of a module (part) scaled with the biomass of the module (whole) can be described by a power equation. Consider the lateral root module. Let L1 and L2 denote the growth of its first- and second-order lateral roots at time t. The kinetic rates of these two types of lateral roots can be expressed as
$\left\{ \begin{aligned}& \frac{{d{L_1}}}{{dt}} = {a_1}W_L^{{k_1}} + {b_{1 \leftarrow 2}}L_2^{{c_{1 \leftarrow 2}}} \\ &\frac{{d{L_2}}}{{dt}} = {a_2}W_L^{{k_2}} + {b_{2 \leftarrow 1}}L_1^{{c_{2 \leftarrow 1}}} \end{aligned} \right.$ (3) where the first term of equations at the right-hand side describes how lateral roots scale with the mass of the whole lateral root module (WL), described by parameters a1 and k1 for the first-order and a2 and k2 for the second order, and the second term characterizes the interaction effect on the target lateral root by its interacting counterpart, by interaction parameters b1←2 and c1←2 (the first order as a target) or b2←1 and c2←1 (the second order as a target). The interaction parameters describe the type and strength of interactions between the two types of lateral roots.
-
As a biological phenomenon, developmental modularity is thought to be under genetic control, despite no detailed illustration of its underlying genetic architecture[56−58]. Game theory, implemented with system mapping[44,59], provides a powerful means of charting the overall picture of genetic control mechanisms for modularity, its structure, organization and function. Consider a mapping population grown in two contrasting environments, normal and drought. Suppose we obtain genome-wide genotype information of the population and its environment-specific phenotypic data at a multitude of time points in terms of component traits constituting modules. By scanning genotypic markers over the genome, modularity-based system mapping can detect and identify significant QTLs that contribute to the structural and functional variation of individual modules in response to environmental change. This model can address the following questions of interest to developmental and evolutionary biologists:
(a) What is the relative contribution of independent growth and interactive growth to the overall growth trajectories of a specific trait within a module? This can be illustrated by the two component curves of ODEs (2) or (3), in a comparison with the overall ODE curve.
(b) Does cooperation or competition exist between different traits and how does a specific QTL modulate such trait-trait relationships to affect the function of modules? These can be answered by estimating interaction parameters for each genotype and comparing these parameters across different genotypes.
(c) How does cooperation or competition alter its pattern in response to environmental change? In general, drought stress may cause the competition of the taproot and lateral roots, whereas these two types of roots tend to cooperate in normal soils. This argument can be tested by estimating interaction parameters of traits for each environment and testing how these parameters vary across normal and stress environments.
(d) How do gene-environment interactions affect cooperation and competition? This is due to the variation of environment-dependent plasticity among different genotypes[60].
To show the result interpretation for questions (a) and (b), we reanalyzed the mapping data of the F1 full-sib family for Euphrates poplar[46] by the game-theoretic systems mapping model. The model identifies three sets of QTLs for different modules, 51 for MAM, 52 for RM and 18 for LRM, from 8,305 SNPs genotyped at the whole genome level (Supplemental Fig. S1, Table S1). We chose three QTLs, lm_ll_11234, for MAM, nn_np_7983 for RM, and lm_ll_8106 for LRM, to explain how a QTL mediate the structure and behavior of a module. Fig. 3 elucidates the growth trajectories of each trait from each module for two alternative genotypes at each of the three QTLs chosen. Overall, the shoot and taproot growth compete with each other and, also, such a mutual combat strengthens with seedling development in tubes (Fig. 3a). However, the strength of bilateral competition depends on the genotype of lm_ll_11234. Shoot growth faces stronger competition from taproot growth for ll than lm, but taproot growth is battled by shoot much more intensely for lm than ll. It appears that different genotypes at nn_np_7983 vary in the competitive relationship of taproot and lateral root growth, although the genetic effect of this QTL is not obvious as much as that of lm_ll_11234 in the main axe module (Fig. 3b).
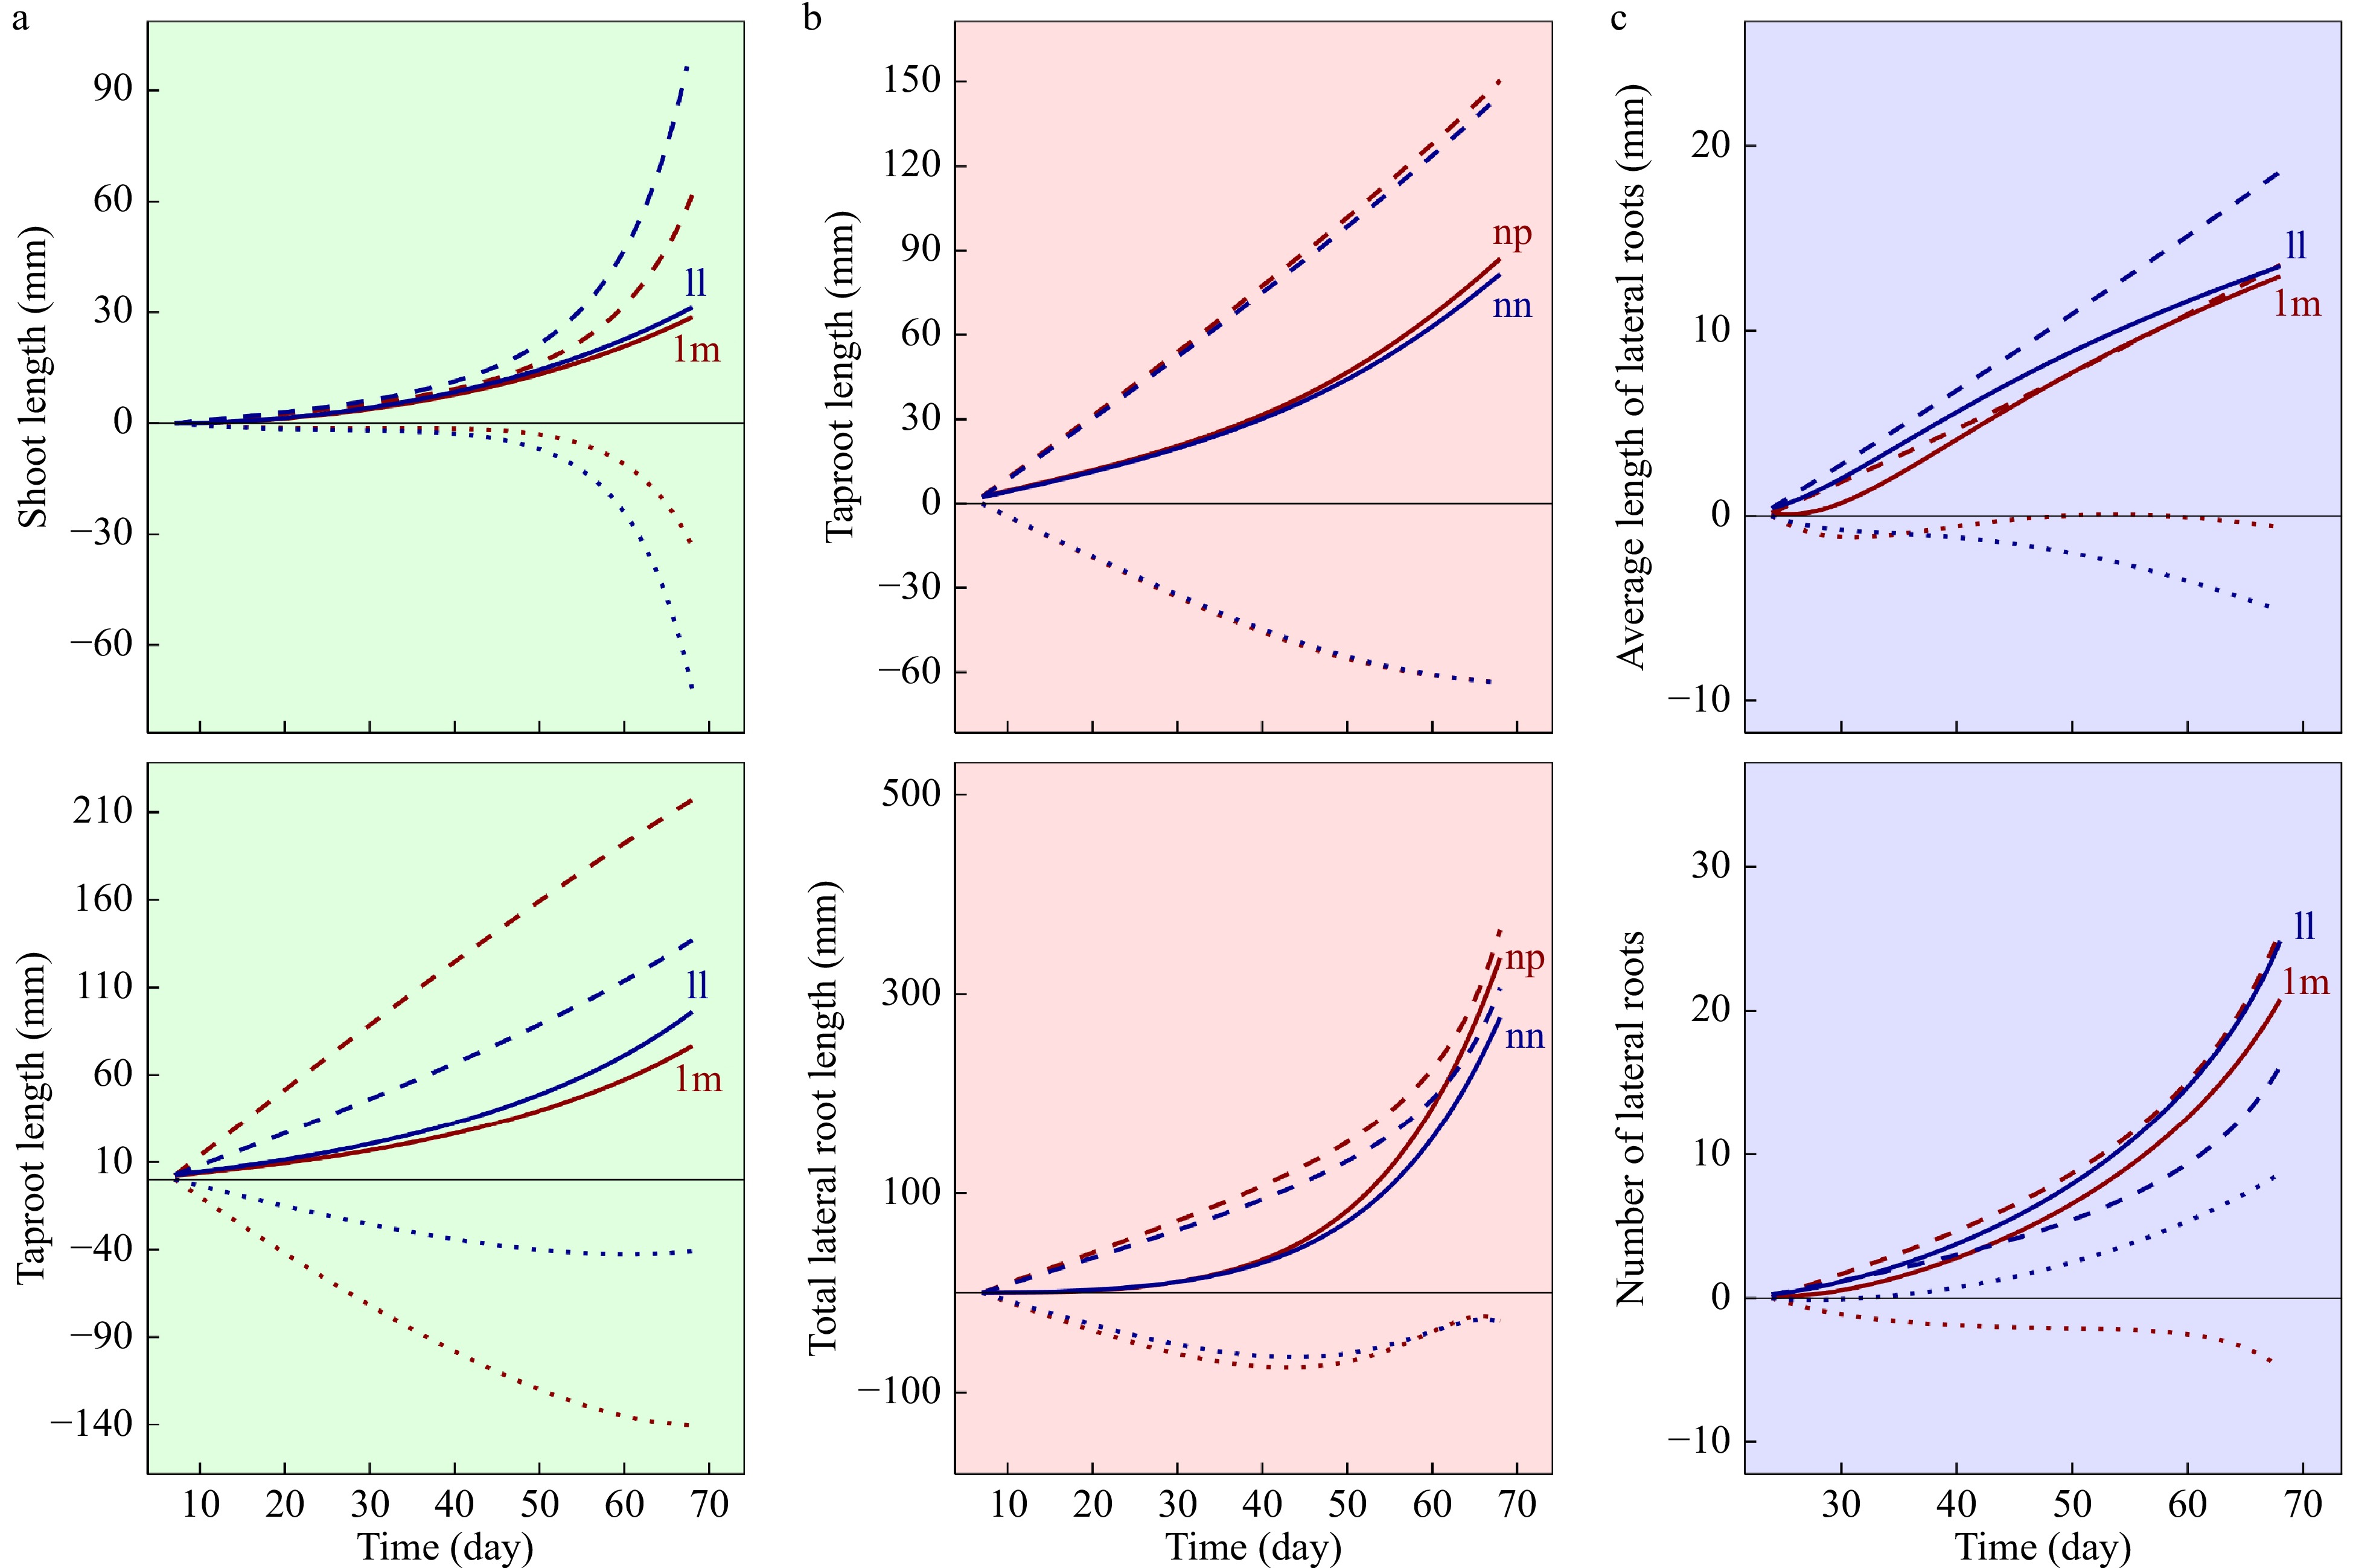
Figure 3. Genetic control of a QTL detected on the dynamic change of interacting traits within a module, the main axe module (a), the root module (b) and the lateral root module (c). Thick lines are the overall mean growth curves of a trait, hashed lines (---) are the independent growth curve of a trait as expected in isolation, and dotted lines (...) are the dependent growth curves of a trait upon its interacting trait. Red and blue represent two different genotypes at each QTL.
It is interesting to see the pattern of genetic effect by QTL lm_ll_8106 on the lateral root module (Fig. 3c). For genotype ll, suppressed by the number of lateral roots, average length growth of lateral roots promotes the growth of the former, suggesting a predatory or parasitic relationship. It seems that genotype lm encourages the number of lateral roots to form a symbiotic relationship with the average length growth, but it supports the predation of average lateral root length to lateral root number.
Questions (c) and (d) can be answered by growing the same mapping population of Euphrates poplar in two or more environments. A set of phenotypic traits from the same modules are measured over environments, and different schedules of measurement are allowed and can be incorporated into the modeling framework.
Genetic network of modular networks: Functional module meets variational module
-
When a group of traits vary together more closely than with other traits forming a variational module[5], a question has naturally arisen about what is the underpinning of this covariation. Corresponding to the concept of variational module, a functional model has been proposed to define a set of genes or proteins that coordinate to carry out a function that is semiautonomous from other functions[8]. Thus, joint modeling of variational module and functional module can glean new insight into developmental genetic and evolutionary mechanisms, although this is not feasible using traditional approaches that can only detect single genes or pathways for modularity[1].
Game-theoretic system mapping provides a powerful tool to systematically characterize the genetic architecture of this phenomenon. More recently, statistical approaches for reconstructing genetic networks from dynamic data have been developed on the basis of ODEs[61,62]. We can modify and implement these approaches to reconstruct the genetic networks of all QTLs for the interconnections of traits within and between modules. For each module, we need to define a character that can describe its holistic behavior. The holistic trait is denoted by the sum of shoot and taproot length for the main axe module, the sum of taproot and lateral root length for the root module and the total length of lateral roots for the lateral root module. Then, we calculated the dynamic genetic effects of all QTLs from the three modules and further used this information to reconstruct QTL networks based on ODE approaches.
It is interesting to find that genetic networks of QTLs are modularized in agreement with morphological modules (Fig. 4), suggesting that variational modularity in Euphrates poplar can be well explained by its functional modularity. In the multilayer network of QTL control, different QTLs within each module interact strongly with each other in a complex web to determine the holistic behavior of this module. SNPs lm_ll_6295, hk_hk_899, and nn_np_5908 are three hub QTLs for MAM that have numerous links with other QTLs in such that they play a keystone role in mediating the QTL network. The network structure and function may change to a large extent if the expression of these QTLs is promoted or repressed. More hub QTLs were detected for RM, including hk_hk_983, lm_ll_7030, nn_np_8541, lm_ll_11763, nn_np_9112, and lm_11_7615, whereas LRM at the lowest level of organization involves only one hub QTL lm_ll_9747.
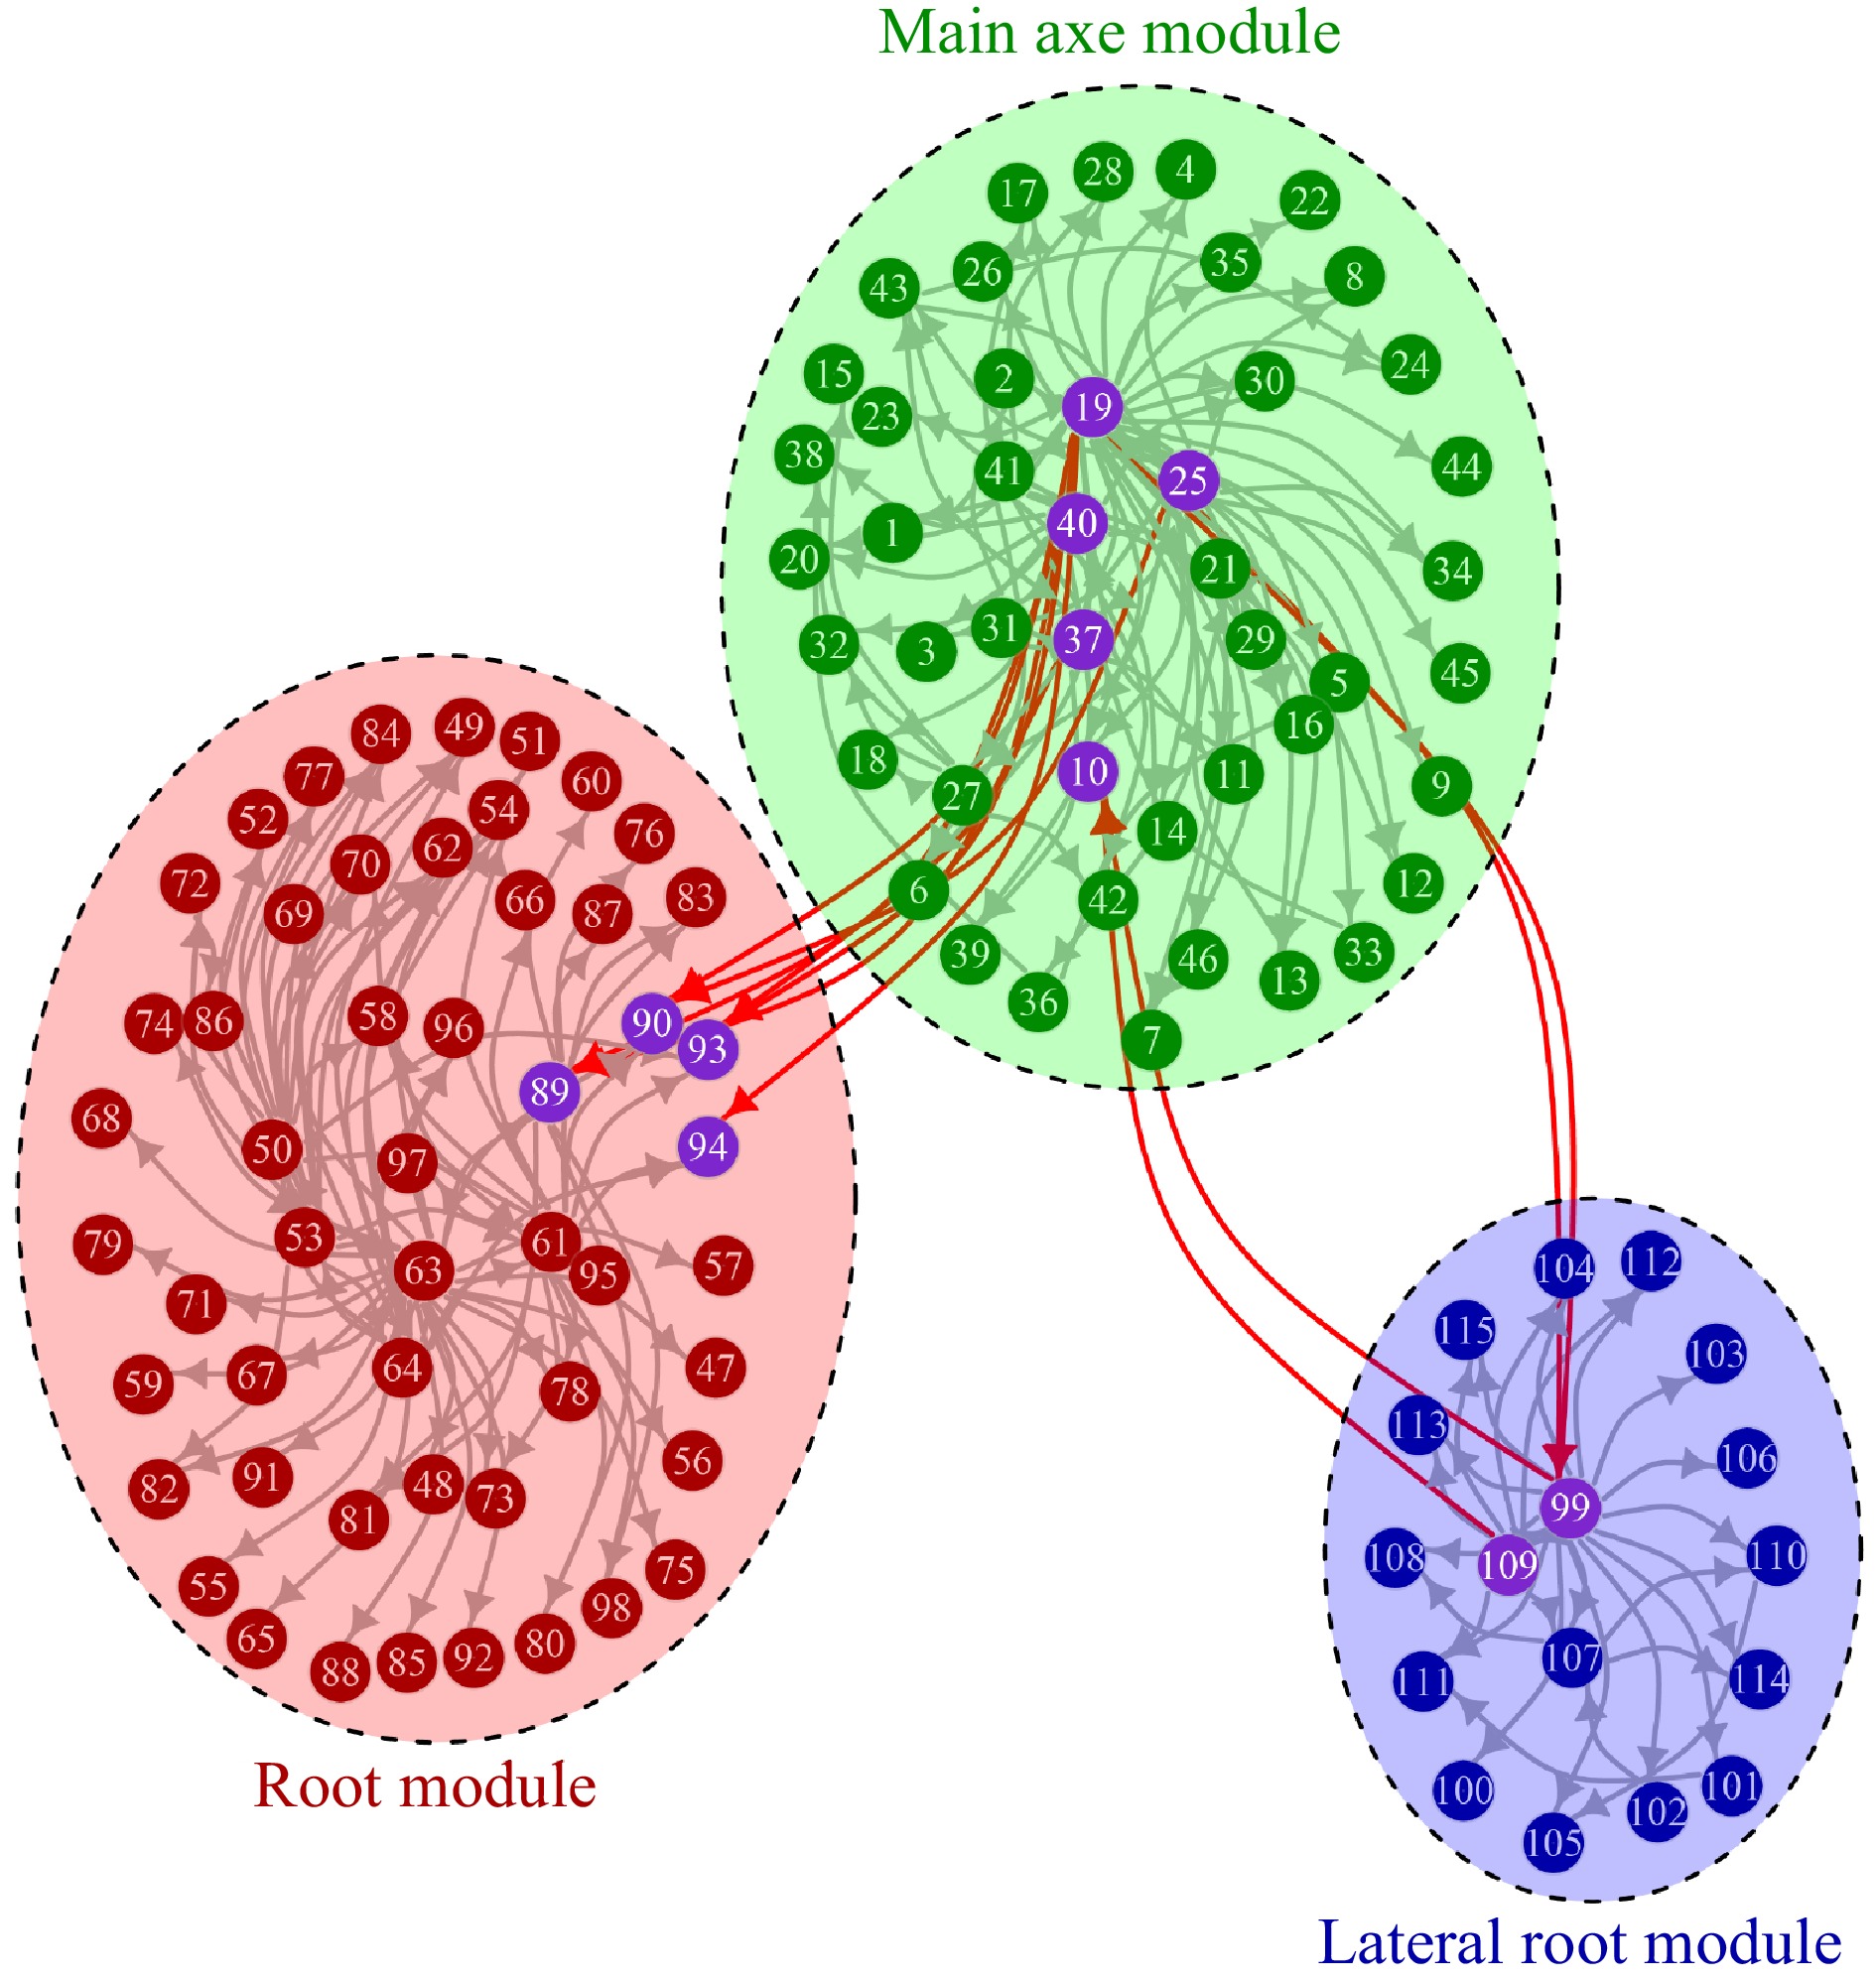
Figure 4. The genetic network of QTLs detected to control three hierarchical modules, each represented by an elliptic circle. Each dot represents a QTL, and an arrow denotes the direction of activation from one QTL to others.
It was observed that some QTLs play a communication role between different modules (Fig. 4). Four QTLs, 19, 40, 37 and 25, from MAM promote the expression of four QTLs, 90, 93, 94 and 84, acting within RM through seven connections. 19, as a hub QTL of MAM, are linked with three different RM QTLs, one of which, 89, is a hub QTL of RM. Meanwhile, this RM hub QTL is also activated by another MAM hub QTL 40. Three QTLs from MAM were found to connect with two QTLs within LRM. Two MAM QTL, 19 and 25, activate a hub QTL of LRM, 99, whereas this LRM QTL, along with another sub-hub LRM QTL, 109, has a feedback activation to a MAM QTL 10. Although we did not identify any QTLs that directly connect RM and LRM, two hub QTLs (19 and 25) within MAM play an indirect role in RM-LRM link by activating QTLs within RM and LRM simultaneously. Based on the above analysis of functional modules, MAM could be regarded as a hub module that manipulates the modules at the lower level of organization. Although more SNPs by deep sequencing are needed to prove the hub role of MAM and chart a detailed topology of genetic controls within and between different modules, the integration of multiplayer network theory[63] and system mapping offers an untapped potential to gain new insight into the architecture and dynamics of modular complexity.
CONCLUSION
-
In living systems, cells or organisms are often organized into modules that function as a coherent whole to perceive and respond to developmental and environmental perturbations. However, despite its fundamental significance to developmental evolutionary biology, our understanding of how modularity and integration evolves through genes remains poorly understood. In this article, we have shown that this issue can be resolved by integrating evolutionary game theory into a system mapping context, allowing the identification and mapping of specific QTLs that modulate ecological interactions among traits within and between modules.
As a concept pioneered by John Maynard Smith and George R. Price as early as the 1970s, evolutionary game theory, i.e., the application of game theory to study evolution, has been widely recognized. However, how to implement this theory to study evolvability through developmental modularity has received less attention. This implementation has been stimulated by the need of an understanding of why and how cells and organisms evolve in the organized pattern of modules as well as the advance of high biotechnologies that can collect data at various levels of organization. Also, the new development of mapping complex traits as a dynamic system is an incentive of this conceptual implementation. According to game theory, internal interactions of various components within a module can be classified as the cooperation or competition of these “decision makers.” Mathematical equations that model a system’s structure and organization are then used to quantify and discern these interrelationships within a genetic mapping setting, thus enabling the identification of genetic variants that determine cooperation or competition and the resulting evolution.
Although our formulation of game theory was based on morphological traits of organs, this idea can be generalized to model any module that exists on a wide range of levels of organization from proteins and RNA to cells to complex organisms[64,65]. In each case, the type of association is different, but the modular pattern follows some common rules[7]. Modules may manifest in terms of hierarchically arranged regulatory, developmental and morphological structures, in which case modules at a larger scale can be divided into multiple modules at lower scales. Multi-stage game theory, developed in economic research, can be implemented to model ecological interactions within and between modules across different levels of scales.
- This study was supported by the National Natural Science Foundation of China (No. 31870689), Forestry and Grassland Science and Technology Innovation Youth Top Talent Project of China (No. 2020132608), and the National Key Research and Development Program of China (2018YFD1000401).
- The authors declare that they have no conflict of interest.
- Supplemental Fig. S1 The Manhattan plot of significance tests for QTLs that mediate the structural axe module (outer circle), the root module (middle circle) and the lateral root module (inner circle). The full-sib family contains two types of marker segregation: testcross (segregating due to one heterozygous parent with the other being homozygous) and intercross (segregating due to both heterozygous parents)78-80. The critical thresholds for each marker type were determined from 1,000 permutation tests.
- Supplemental Table S1 List of significant QTLs detected for the structural axe module, the root module and the lateral root module. Portion of the QTLs detected can be annotated to candidate gene regions.
- Copyright: © 2021 by the author(s). Exclusive Licensee Maximum Academic Press, Fayetteville, GA. This article is an open access article distributed under Creative Commons Attribution License (CC BY 4.0), visit https://creativecommons.org/licenses/by/4.0/.
-
About this article
Cite this article
Wen Z, Jiang L, Li M, Dong A, Ye M, et al. 2021. Mapping the genetic architecture of developmental modularity in ornamental plants. Ornamental Plant Research 1: 3 doi: 10.48130/OPR-2021-0003

Mapping the genetic architecture of developmental modularity in ornamental plants
- Received Date: 10 February 2021
- Accepted Date: 23 April 2021
- Published Online: 30 April 2021
Abstract: Developmental modularity, i.e., coherent organization and function of developmentally related traits, is an emergent property of organismic development and evolution. However, knowledge about how modular variation and evolution are driven genetically is still limited. Here, using ornamental plants as an example, we propose a computational framework to map, visualize and annotate the genetic architecture of trait modularity by integrating modularity theory into system mapping, a statistical model for multifaceted genetic mapping of complex traits. A developmental module can be viewed as an ecosystem, in which the constituting components compete for space and resources or cooperate symbiotically to organize its function and behavior. This interactive process is quantified by mathematical models and evolutionarily interpreted by game theory. The proposed framework can test whether and how genes regulate the coordination of different but interconnected traits through their competition or cooperation to downstream developmental modularity.
-
Key words:
- Modularity /
- QTL /
- Evolutionary game theory /
- Ecosystem /
- Systems mapping /
- genetic architecture