


-
The herbaceous peony (Paeonia lactiflora Pall.), a member of the family Paeoniaceae, is a traditional herb flowering plant and has a long history of cultivation in China. It used to grow in the Imperial Palace Garden and is known as the 'Prime-Minister of flowers'[1]. The P. lactiflora flower is elegant and beautiful with a high ornamental value. Its flowers have not only single petal, double petal, golden pistil, crown, and other flower types but also rich colors, such as white, green, pink, and yellow. Regulation of flowering of herbaceous peony can be manipulated in protected cultivation, but the production cost is high. P. lactiflora loses the stems and leaves in autumn but survives in winter as a dormant root mass as the herbaceous peony is deciduous[2]. To break the dormancy of buds in spring, it needs a long time of low temperature during dormancy to meet the winter-cold requirements[3−5]. In addition to the low temperature, application of GA3 can promote flowering[6]. For the early flowering cultivar Dafugui, 4−5 axillary buds on the top of the terminal bud developed into a primordium shape in the overwintering state. 'Dafugui' experiences flower bud differentiation, bract primordium differentiation, petal primordium formation, stamen primordium emergence and development, and pistil primordium formation from early September to April of the following year[7]. Information on flower bud differentiation and flowering regulation of herbaceous peony is helpful to provide the theoretical basis for promoting flowering.
Flowering marks the transition from vegetative growth to reproductive growth, and the time of flowering affects a plants commercial value[8]. At the same time, regulation of the flowering period is also essential for plant seed setting. Compared to other species, the molecular mechanism of flowering in Arabidopsis is relatively well understood[9]. In Arabidopsis, there are six response pathways including photoperiod, vernalization, autonomic, temperature, gibberellin, and age pathway, to regulate flowering[10]. Both endogenous and exogenous factors determine the flowering time of plants. Endogenous factors are mainly related to the genes that regulate flowering transformation. For example, FT[11], FLC[12], LFY[13] and SOC1[14] are called flower induction switches. Among them, FT protein is a globular protein with 175 amino acids, both mRNA and FT protein can regulate flowering. FT gene is regarded as a florigen gene[15], which is conservative. It was previously reported that the FT protein could be transported between cells through phloem and transported to the apical meristem, inducing plant flowering[16]. It does not work alone, but interacts with other proteins to regulate flowering.
Currently, FT and its homologous genes are found to promote flowering in winter wheat, barley[17], rubber tree[18], rice[19,20], vanda hybrid[21], chrysanthemums[22] and other plants. It is reported that the LFT1 gene of Lilium was most homologous to the AtFT gene and showed peak expression in shoot apices, which promotes flowering in Arabidopsis[23]. The regulation of flowering by FT is also influenced by photoperiod induction and other proteins. Recently, Jing et al. found that PKL could interact with CO and bind to FT to mediate FT response to photoperiod induced flowering and counteract the inhibitory activity of PcG protein, resulting in appropriate FT expression and flowering response[24]. FT has some changes in species evolution, so not all FT homologous genes have or only have a promotive effect. A study on onion has shown that the up-regulation of AcFT2 can induce vernalization and promote flowering, while AcFT1 and AcFT4 are related to bulb formation[25]. In addition, GmFT1a was found to inhibit flowering in soybean, which was a flower inhibitory factor[26].
Transcriptome sequencing is a high-throughput technology for analyzing gene sequence data and can be divided into three categories: synthetic sequencing, solid-state sequencing, and single-molecule sequencing[27]. Illumina platform is the most widely used platform based on data quality, quantity and cost[28]. As an efficient and high-throughput method for functional gene mining and pathway analysis, transcriptome sequencing was introduced into many studies of horticultural research. There were many types of research on mining flowering genes through transcriptome in some species including sweet potato[29], bamboo[30,31], Lagerstroemia indica[32], Ipomoea nil[33] and Eichhornia paniculate[34]. For example, in Singh & Jain's previous research, the RNA-seq of various stages of flower development and few vegetative tissues in chickpea found differentially expressed genes related to various biological processes and molecular functions during flowering[35]. Zhang et al. reported that 110 citrus flowering-time genes homologous with known elements of flowering-time pathways were identified by sequencing and bioinformatics analysis in Poncirus trifoliata (L.) Raf[36]. High throughput transcriptome sequencing plays an important role in the study of flowering regulation.
In this study, transcriptome sequencing technology was used to analyze different gene expression during the flowering of P. lactiflora and to identify those involved in regulation of flower development. An important gene, PlFT was isolated and cloned for genetic transformation in Arabidopsis. Its expression in relation to flower development in Arabidopsis indicated that PlFT could play an important role in regulating flowering in P. lactiflora.
-
Nine cDNA libraries (three biological repeats) were constructed by collecting samples from T1, T2 and T3 to elucidate P. lactiflora 'Dafugui' flowering mechanism (PRJNA723469). T1 is the critical period of flower bud differentiation, T2 is the period of flower bud morphogenesis, and T3 is the period of flower opening (Fig. 1a). A total of 92.53 GB of data were obtained by the Illumina Hiseq platform. After assembling the original data and removing the redundancy of low quality, joint pollution, and high content of unknown base N in the original data, the filtered reads quality statistics were obtained, as shown in Supplemental Table 1. After filtering, the percentage of reads was > 92.6%, and the percentage of Q20 (%) > 97.9%. Overall, the percentage of bases with low quality was lower, indicating that the sequencing quality was sound. Since P. lactiflora has no reference genome, it was necessary to splice the clean reads to obtain the reference sequences for subsequent analysis; the results are shown in Supplemental Table 2. A total of 81,788 unigenes containing 93,770,651 nt were obtained, with an average length of 1,146 nt. N50, N70, and N90 were 1,780 bp, 1,193 bp and 520 bp, respectively. Fig. 1b shows the length distribution statistics of unigenes. The sequence length of unigenes ranged from 200 nt to 3,000 nt. With the increase of sequence size, the number of unigenes gradually decreased, but there was no apparent separation. All the above results indicated that RNA sequencing has good continuity and high quality.
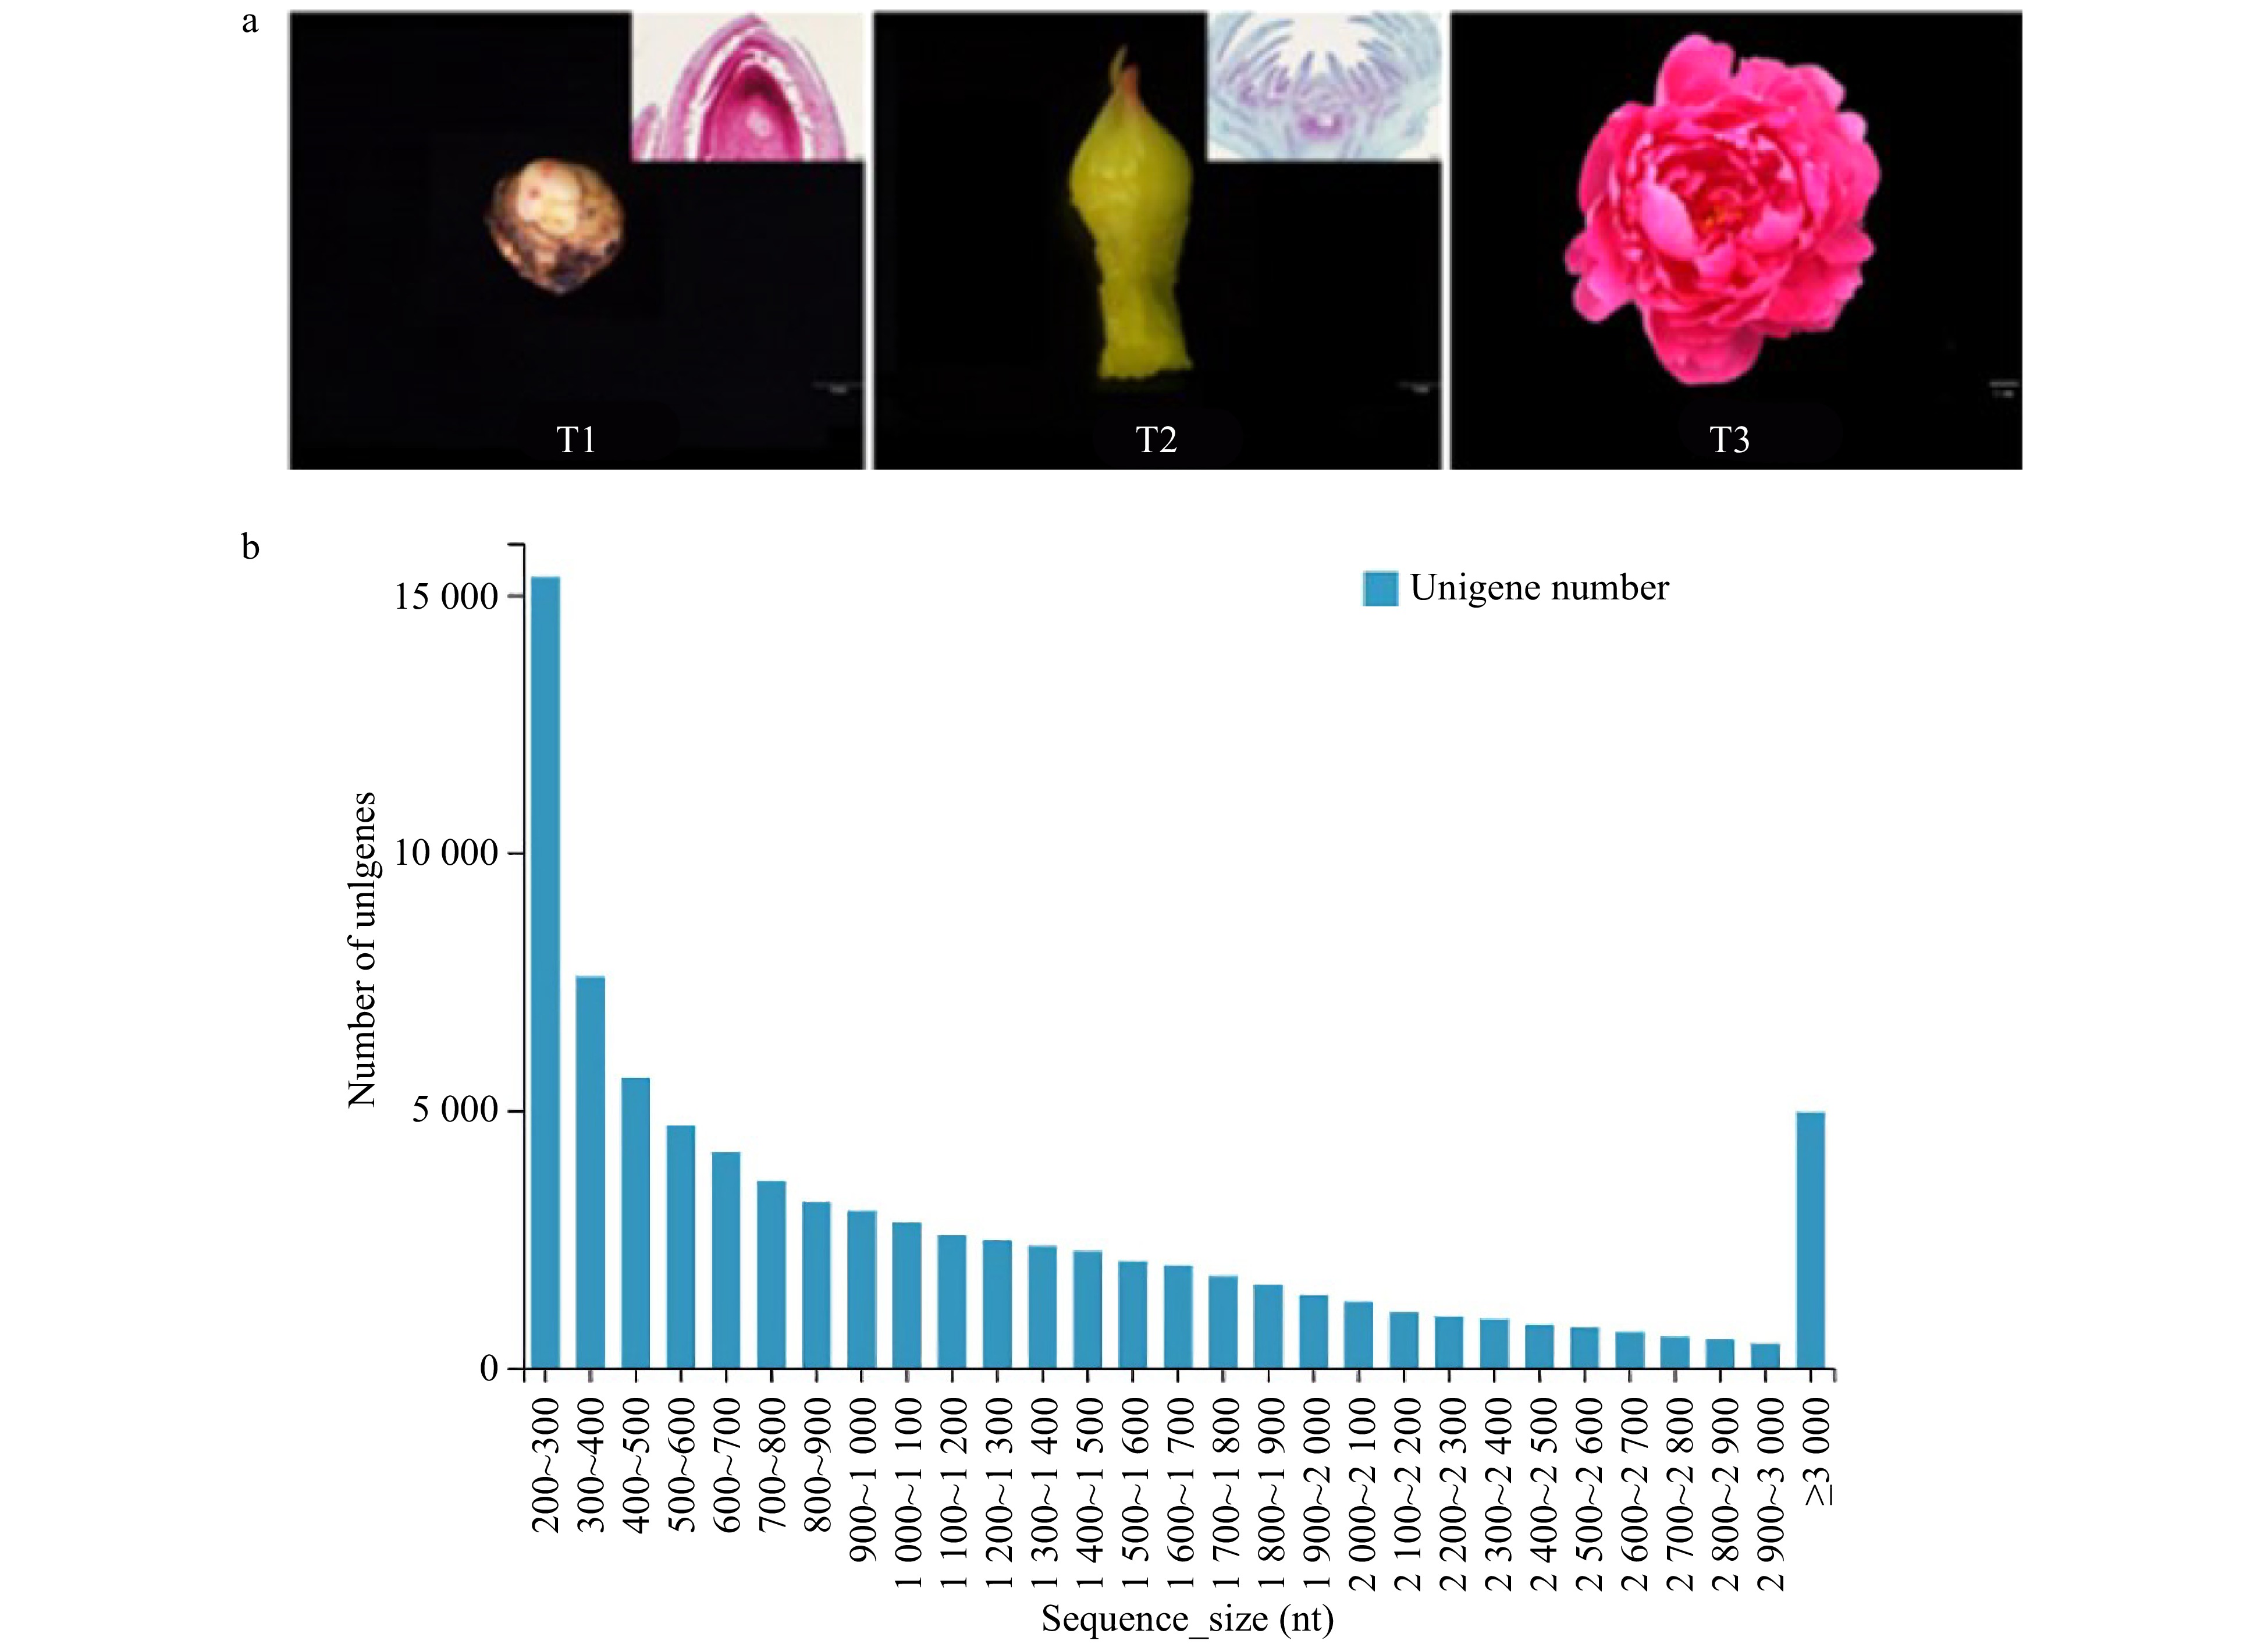
Figure 1. Transcriptome sequencing of 'Dafugui'. (a) Materials of 'Dafugui' in three periods. T1, critical period of flower bud differentiation; T2, flower bud morphogenesis; T3, peak flowering. (b) Unigene length distribution.
Gene functional annotation
-
The assembled unigenes were compared to seven function databases (KEGG, GO, NR, NT, SwissProt, Pfam and KOG) for annotation to understand the function information. Finally, 52,323 (NR: 63.97%), 35,949 (NT: 43.95%), 39,639 (SwissProt: 48.47%), 43,118 (KOG: 52.72%), 41952 (KEGG: 51.29%), 40,116 (GO: 49.05%) and 40,206 (Pfam: 49.16%) unigenes were annotated. Fig. 2a shows the Venn diagram of the number of unigenes annotated by KEGG, GO, NR, Swissprot, and KOG.
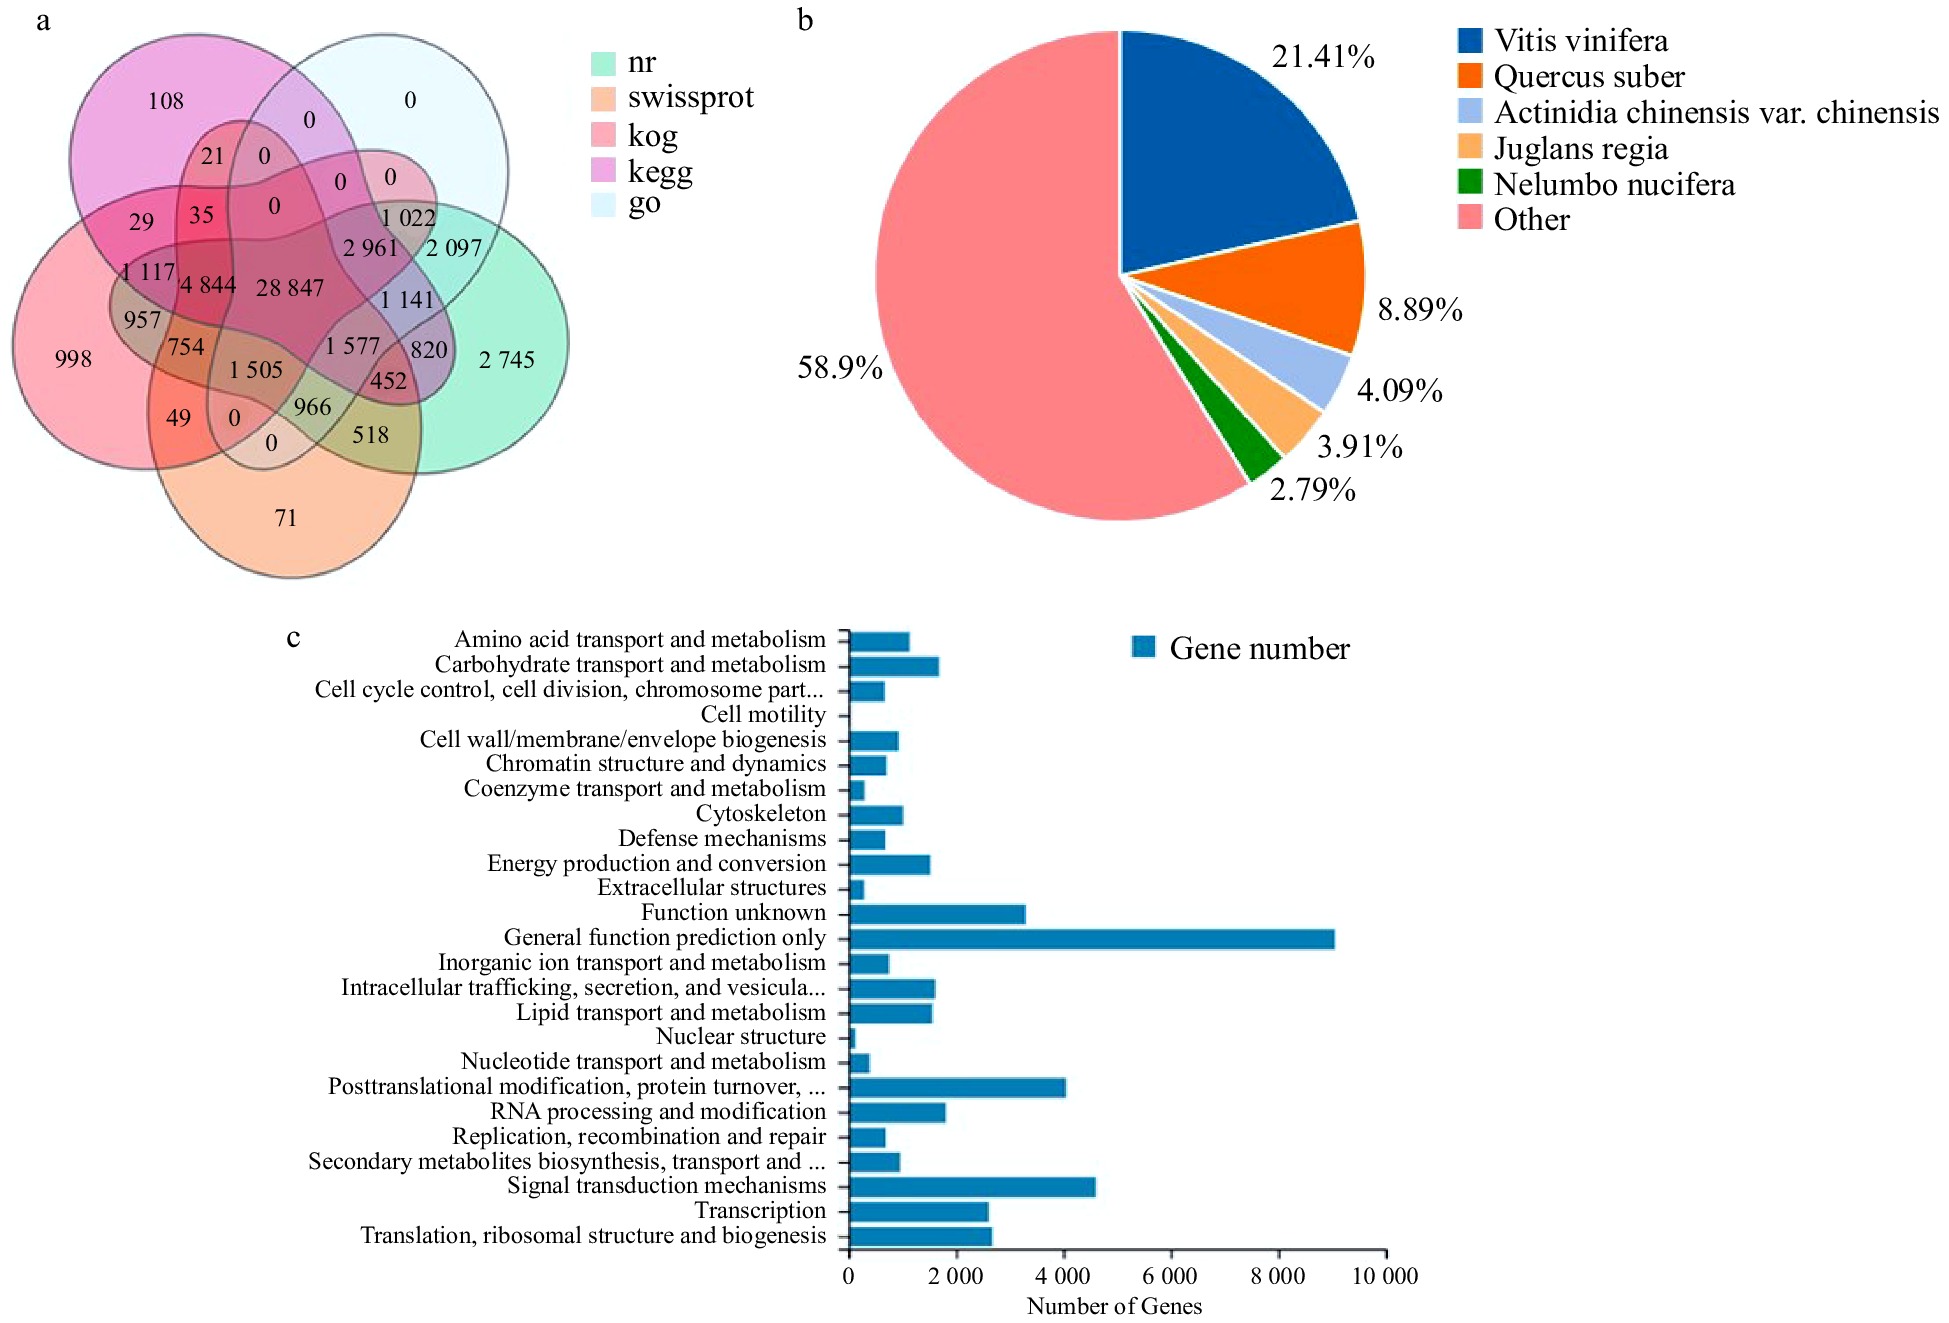
Figure 2. Gene functional annotation. (a) Venn diagram of the number of unigenes annotated in different public databases. (b) Species distribution of NR annotation. (c) Functional classification of KOG annotation. The x-axis represents the corresponding number of Unigene, the y-axis represents the KOG function classification name.
The corresponding functional annotation was obtained by comparing unigenes sequences with the NR database. According to the results of NR functional annotation, the proportion of different species in unigenes annotation was counted, and the species distribution map was drawn (Fig. 2b). The unigenes of P. lactiflora 'Dafugui' were similar to those of five plants, Vitis vinifera (21.41%), Quercus suber (8.89%), Actinidia (4.09%), Juglans regia (3.91%) and Nelumbo nucifera (2.79%).
Unigenes were annotated into the KOG database and were classified into 25 functional processes (Fig. 2c). Among them, 9,048 unigenes were compared to the 'general function prediction only', followed by 4,598 unigenes to the variety of 'signal transmission mechanisms', and 4,048 unigenes to the category of 'posttranslational modification, protein turnover, and chaperones'.
Analysis of differentially expressed genes for the development of herbaceous peony 'Dafugui' flowers
-
The FPKM values of unigenes from different stages (T1, T2, and T3) were compared. The DEGs were screened to obtain the flowering-related genes of P. lactiflora. The differences between the T1, T2 and T3 groups are shown in Supplemental Fig. 1. The number of differentially expressed genes is shown in Supplemental Table 3. Compared with T1 and T2, there were 28,075 DEGs, including 19,821 up-regulated and 8,254 down-regulated. Compared with T1 and T3, there were 40,666 DEGs, including 22,171 up-regulated and 18,495 down-regulated. There were 37,230 DEGs between T2 and T3, of which 15,064 up-regulated and 22,166 down-regulated.
GO and KEGG Pathway analysis of DEGs
-
All DEGs were annotated by GO and were classified into three functional categories: molecular function, cellular component, and biological process (Fig. 3a). Moreover, all DEGs were also annotated by the KEGG pathway. The top 20 pathways are shown in Fig. 3b. During the three periods, five metabolic pathways were enriched, including 'circadian rhythm-plant', 'carotenoid biosynthesis', 'flavonoid biosynthesis', 'isoflavonoid biosynthesis' and 'MAPK signaling pathway'.
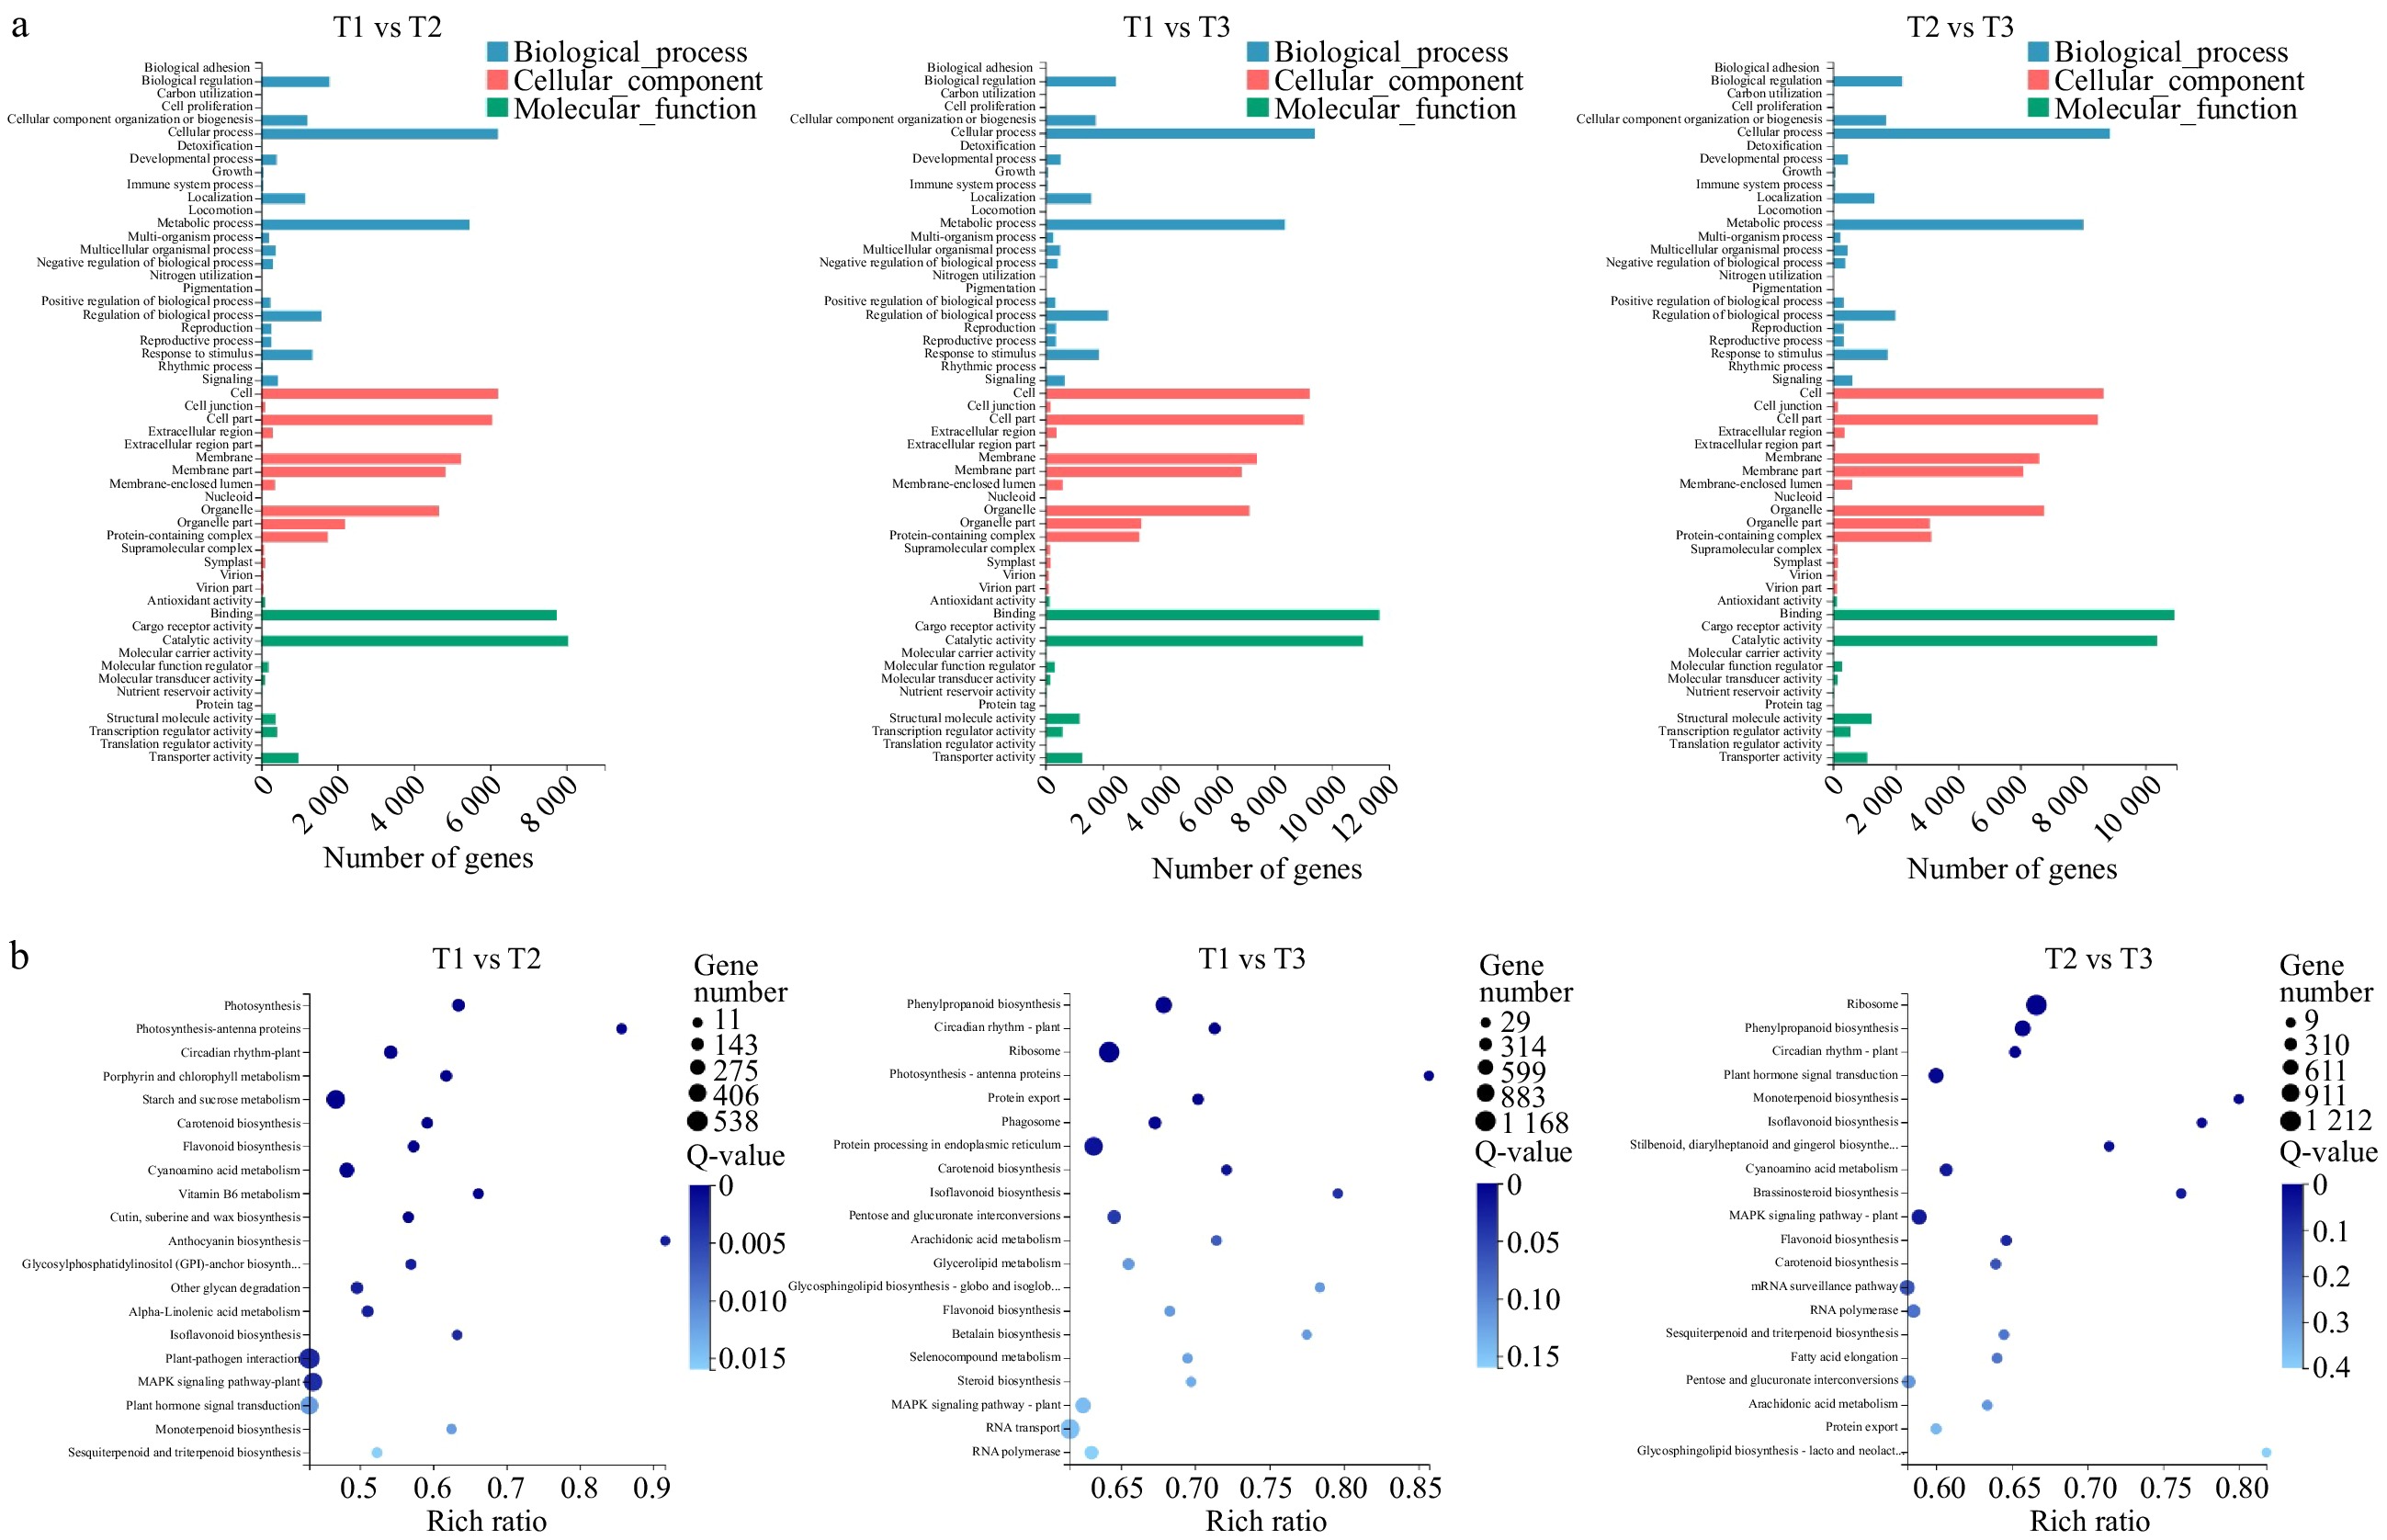
Figure 3. GO and KEGG Pathway analysis of DEGs. (a) Functional distribution of DEGs annotated GO. The x-axis represents the number of genes annotated GO and the y-axis represents the functional distribution of GO. (b) Bubble diagram of enrichment of DEGs KEGG pathway. The x-axis is enrichment ratio, the y-axis is KEGG Pathway, the bubble size indicates the number of genes annotated on one KEGG pathway, the color represents enrichment Q-value, and darker color represents smaller Q-value.
To explore the key genes of flowering regulation during flower bud differentiation of P. lactiflora 'Dafugui' and the molecular mechanism of flowering regulation, the DEGs in T1 vs T2, T1 vs T3, and T2 vs T3 were analyzed, and the up-down relationship was marked (Table 1). Twenty three DEGs were screened and annotated by KEGG, including CHE, PHYB, LHY, CO, PRR5, PRR7, FKF1, CDF1, PHYA, PAP1, HY5, TOC1, ELF3, GI, FT, CRY1, CRY2, ZTL, SPA1, FLC, FUL, AP1 and SOC1, which were related to flower development.
Table 1. Analysis of main DEGs for KEGG pathway related with flowering of 'Dafugui' samples in different periods.
Gene ID Entry Name log2(T2/T1) log2(T3/T1) log2(T3/T2) T1 vs T2 T1 vs T3 T2 vs T3 CL1090.Contig1_All K16221 TCP21, CHE −1.22 −1.88 down down CL1090.Contig2_All −1.70 −2.21 down down Unigene12923_All −3.09 −2.39 down down Unigene15030_All 2.53 2.33 up up Unigene17026_All −1.13 down Unigene19482_All −3.00 −3.60 down down Unigene6346_All 2.27 1.44 up up CL1148.Contig1_All K12121 PHYB 4.43 11.10 6.68 up up up CL1148.Contig4_All 1.58 7.06 5.48 up up up CL1516.Contig10_All 2.70 7.40 4.70 up up up CL1516.Contig11_All 4.12 8.90 4.78 up up up CL1516.Contig2_All 2.97 1.25 −1.72 up up down CL1516.Contig3_All 5.19 9.32 4.12 up up up CL1516.Contig4_All 6.56 6.69 up up CL1516.Contig5_All −2.89 −6.12 down down CL1516.Contig6_All −8.14 −8.16 down down CL1516.Contig7_All −3.44 5.73 9.17 down up up CL1516.Contig8_All 1.11 −1.54 −2.65 up down down CL1516.Contig9_All 1.84 5.98 4.13 up up up CL175.Contig2_All 2.40 2.36 up up CL175.Contig4_All 2.26 1.91 up up CL5438.Contig1_All −1.79 −8.85 −7.07 down down down CL6053.Contig1_All 1.19 up CL6053.Contig2_All 2.58 4.17 1.59 up up up CL6053.Contig3_All −1.34 1.94 3.28 down up up CL6068.Contig1_All 4.60 4.51 up up CL6900.Contig1_All 1.30 −7.36 −8.65 up down down CL6900.Contig2_All 1.09 1.36 up up CL7074.Contig1_All 8.14 8.04 up up CL7690.Contig3_All −1.93 −2.80 down down CL7690.Contig4_All 1.01 −7.93 −8.94 up down down CL7690.Contig5_All 1.54 up Unigene12459_All 1.26 −1.04 up down Unigene12460_All 6.55 6.45 up up Unigene12461_All 3.70 8.02 4.32 up up up Unigene1351_All 9.45 9.35 up up Unigene15547_All 9.58 9.48 up up Unigene24958_All −4.59 2.60 7.20 down up up Unigene25706_All 8.96 7.86 up up Unigene39640_All −1.07 down Unigene6288_All 1.24 up Unigene6289_All 1.29 up CL1150.Contig3_All K12133 LHY 3.80 3.14 up up CL1150.Contig4_All 3.98 4.05 up up CL1150.Contig5_All 6.15 6.25 up up CL1150.Contig7_All 4.35 4.23 up up CL1184.Contig1_All 2.71 −2.01 up down CL5076.Contig1_All −1.34 down CL5076.Contig3_All −1.62 down CL5076.Contig4_All −2.16 −7.47 −5.31 down down down CL5076.Contig5_All −1.21 down CL8141.Contig1_All −1.09 2.51 3.60 down up up CL8141.Contig2_All 2.33 2.79 up up CL1267.Contig1_All K12135 CO 1.16 2.88 1.72 up up up CL1672.Contig2_All 1.13 up CL3591.Contig1_All 1.59 −1.09 −2.68 up down down CL3591.Contig2_All 2.67 −2.06 −4.73 up down down CL3591.Contig3_All 2.35 −6.78 −9.13 up down down CL3591.Contig4_All 3.10 −1.09 −4.19 up down down CL3591.Contig5_All −1.60 −2.47 down down CL409.Contig3_All −1.11 −1.56 down down CL409.Contig4_All −1.39 down CL409.Contig5_All 1.21 −1.52 up down CL4357.Contig1_All 7.30 8.69 1.38 up up up CL4357.Contig2_All 4.39 3.23 −1.16 up up down CL4357.Contig3_All 9.23 11.51 2.28 up up up CL4357.Contig4_All 2.96 4.33 1.37 up up up CL4357.Contig5_All 5.08 1.55 −3.52 up up down CL6692.Contig3_All 2.25 −4.50 −6.75 up down down CL7718.Contig1_All 1.65 −1.49 −3.14 up down down CL7718.Contig2_All 1.44 −1.29 up down CL7917.Contig1_All −1.38 down CL7917.Contig2_All −1.28 −1.01 down down CL7917.Contig3_All −1.75 −1.79 down down CL7932.Contig1_All 1.92 2.14 up up CL7932.Contig2_All 1.95 2.86 up up Unigene11310_All 2.14 −2.24 up down Unigene1286_All 1.84 1.25 up up Unigene14242_All 3.42 7.71 4.29 up up up Unigene17669_All 6.48 4.58 −1.90 up up down Unigene32926_All 4.14 −5.07 up down Unigene410_All 5.11 5.13 up up Unigene496_All 2.47 −2.83 up down Unigene9300_All 1.86 7.00 5.14 up up up CL3891.Contig1_All K12130 PRR5 7.17 4.47 −2.70 up up down CL3891.Contig2_All 3.36 −7.07 up down CL3891.Contig3_All 2.69 −2.64 up down CL3891.Contig4_All 2.56 −2.46 up down CL6193.Contig1_All 4.75 3.70 −1.05 up up down CL6193.Contig2_All 4.31 2.52 −1.78 up up down Unigene8183_All 2.55 −2.91 up down Unigene8184_All 3.33 −2.79 up down CL4229.Contig1_All K12129 PRR7 1.21 2.86 1.65 up up up CL4229.Contig10_All 1.44 3.38 1.94 up up up CL4229.Contig2_All 1.59 3.96 2.38 up up up CL4229.Contig3_All 1.46 2.59 1.13 up up up CL4229.Contig4_All 1.83 1.78 up up CL4229.Contig5_All 4.09 4.59 up up CL4229.Contig6_All 3.02 −6.05 −9.07 up down down CL4229.Contig7_All 3.20 6.69 3.48 up up up CL4229.Contig8_All 2.51 2.28 up up CL4229.Contig9_All 6.17 7.13 up up CL7872.Contig1_All 1.32 2.56 1.24 up up up CL7872.Contig2_All 2.34 3.67 1.33 up up up Unigene6980_All 4.16 2.26 −1.90 up up down CL4436.Contig1_All K12116 FKF1 −1.34 −1.58 down down CL4436.Contig2_All 1.13 −1.20 up down CL4719.Contig1_All K16222 CDF1 −1.27 1.27 down up CL5753.Contig1_All 3.95 2.85 down down CL5753.Contig2_All −2.77 −3.64 down down down CL5837.Contig1_All −1.83 −2.67 up up up CL5837.Contig2_All −3.49 −5.83 up up up CL6631.Contig2_All −3.77 −3.58 down down CL8648.Contig1_All −1.90 down down down CL8648.Contig2_All −1.36 down down down Unigene10801_All 10.91 −7.84 up up Unigene11044_All −2.71 −8.05 −5.34 up Unigene12006_All 7.60 5.50 up down Unigene12046_All −2.30 −1.32 up up up Unigene12573_All −2.04 −4.46 −2.43 down down up Unigene14940_All 7.05 10.78 3.73 up down Unigene14950_All 7.24 13.54 6.30 down down down Unigene695_All −2.86 −2.83 up up Unigene972_All −2.18 −6.64 −4.47 up up Unigene15046_All −2.45 −5.86 −3.41 up down CL5158.Contig1_All K12120 PHYA 1.44 1.08 up up CL9769.Contig1_All 1.65 down down CL9769.Contig2_All 1.95 −1.86 down down CL9769.Contig3_All 4.27 5.83 1.56 down down Unigene14810_All −3.09 −1.66 1.43 down down Unigene2317_All 2.03 −2.02 down Unigene2317_All −3.39 −5.28 −1.89 down CL5739.Contig1_All K16166 PAP1, MYB75 1.94 2.48 up down CL5739.Contig3_All 1.89 1.64 down down down Unigene15771_All 1.81 −1.74 up up CL6391.Contig1_All K16241 HY5 3.25 2.69 up up CL6391.Contig2_All 4.25 1.38 −2.87 up up down CL6391.Contig3_All 5.39 −4.60 up down CL9659.Contig1_All −1.22 −1.90 down down Unigene6996_All 8.00 7.61 up up CL6767.Contig1_All K12127 TOC1, APRR1 2.28 1.49 up up CL6767.Contig2_All −1.25 −1.37 down down CL6767.Contig3_All −2.52 −3.05 down down CL835.Contig1_All 2.93 −2.80 −5.73 up down down CL835.Contig2_All −3.37 −3.31 down down CL835.Contig3_All −2.37 −1.71 down down CL835.Contig4_All −5.89 −5.70 down down CL835.Contig5_All 2.05 −3.30 −5.35 up down down CL835.Contig6_All −3.41 −3.94 down down CL835.Contig7_All 1.25 −2.26 −3.51 up down down Unigene15499_All 6.55 1.10 −5.45 up up down CL7407.Contig1_All K12125 ELF3 −6.46 −5.48 down down CL8526.Contig1_All K12124 GI 1.48 −1.02 up down CL8526.Contig2_All 2.59 −3.56 −6.16 up down down CL8526.Contig3_All 1.65 1.11 up up CL8526.Contig4_All 1.51 up CL8783.Contig1_All K16223 FT 9.27 6.48 −2.78 up up down CL8783.Contig2_All 6.12 3.64 −2.48 up up down CL8783.Contig3_All 7.57 5.02 −2.55 up up down Unigene18266_All −5.81 −4.83 down down Unigene23647_All −5.49 −2.51 down down Unigene30306_All 7.14 7.05 up up Unigene35531_All −8.42 −8.44 down down Unigene36039_All −3.55 −7.15 down down Unigene235_All K12118 CRY1 5.47 4.40 −1.07 up up down Unigene236_All 5.01 3.70 −1.31 up up down CL926.Contig1_All K12119 CRY2 2.81 2.28 up up CL926.Contig11_All 3.01 2.38 up up CL926.Contig2_All 2.37 3.07 up up CL926.Contig3_All 1.71 1.69 up up CL926.Contig4_All 1.12 2.06 up up CL926.Contig5_All 1.04 3.57 2.53 up up up CL926.Contig6_All 1.22 5.43 4.20 up up up CL926.Contig7_All 2.79 2.28 up up CL926.Contig8_All 2.09 5.79 3.70 up up up Unigene2881_All −1.41 1.19 2.60 down up up Unigene21537_All K12115 ZTL 1.57 up Unigene32913_All 1.25 up Unigene8078_All −1.24 1.58 down up Unigene8082_All 1.96 up Unigene8325_All −1.95 −2.92 down down Unigene6219_All K16240 SPA1 2.77 1.31 −1.45 up up down CL773.Contig1_All K01184 FLC 3.09 −6.44 −9.54 up down down CL773.Contig3_All 4.41 −4.89 −9.29 up down down CL773.Contig4_All 4.24 −4.90 −9.14 up down down CL773.Contig5_All 3.79 −6.37 −10.16 up down down Unigene16702_All 3.22 −6.84 −10.07 up down down Unigene16704_All −4.77 −5.08 down down CL7416.Contig1_All K09264 FUL 3.39 3.44 up up CL7416.Contig2_All 3.51 3.34 up up Unigene18421_All 4.66 −4.95 up down Unigene44881_All 5.31 3.57 −1.75 up up down Unigene44883_All 4.71 −7.96 up down Unigene7311_All K09264 AP1 7.44 12.69 5.25 up up up CL8905.Contig1_All K09260 SOC1 2.35 −3.64 −5.99 up down down Unigene7203_All −3.22 −7.68 −4.46 down down down Verification of transcriptome reliability by qRT-PCR
-
qRT-PCR was used to verify the reliability of transcriptome sequencing. Nine DEGs related to flowering were randomly selected, and the samples of T1, T2 and T3 were used to analyze their expression. The nine DEGs were TCP21, CHE, CO, PRR5, PAP1, MYB75, HY5, ELF3, GI, FT and CRY1. As shown in Fig. 4, the expression changes of nine random genes of three periods were highly consistent with the transcriptome sequencing results, indicating that the transcriptome sequencing results obtained were accurate and reliable.
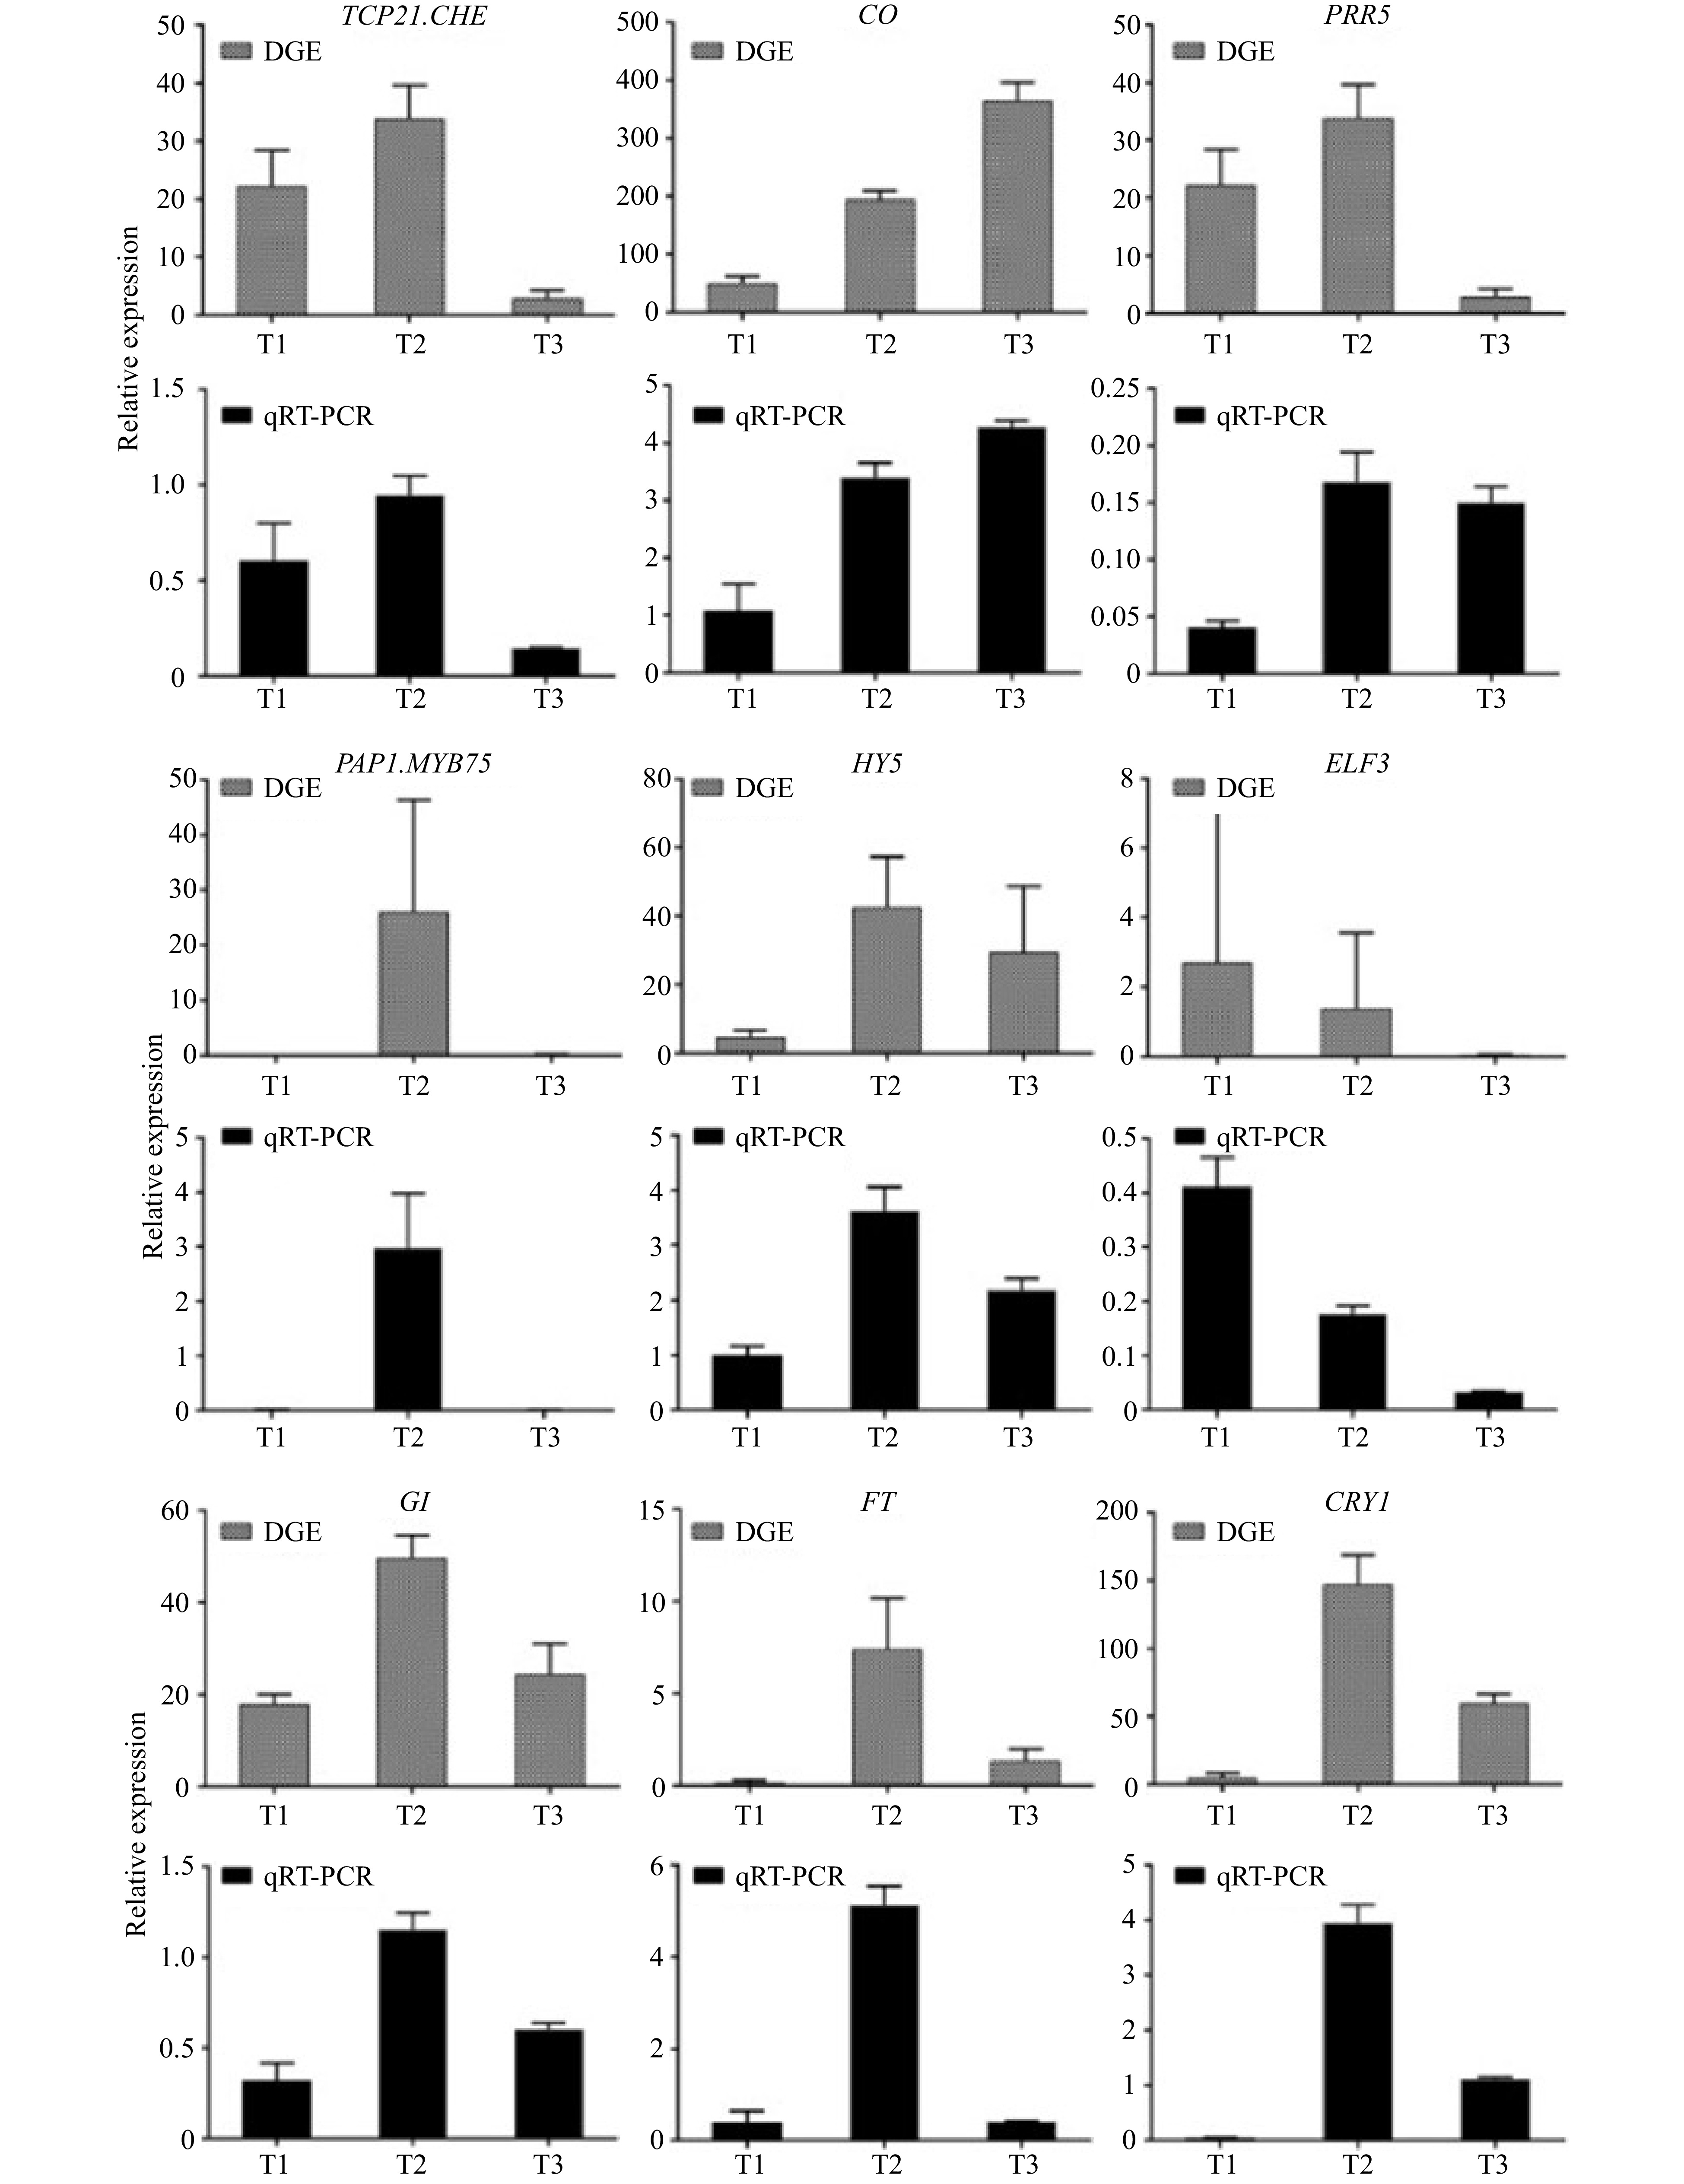
Figure 4. qRT-PCR validations of expression levels of DEGs.
Sequence analysis of one flowering-related gene in Paeonia lactiflora
-
Florigen (FT), known as a flowering hormone, plays a crucial role in the flowering gene network. FT protein is synthesized in plant leaves, transported over a long distance, and accumulated at the shoot apical meristerm (SAM) to trigger the process of flower bud differentiation. In our transcriptomic data, PlFT gene expression was significantly different in flower developmental stages, which might indicate that it could play an important role in the formation of peony flowers. Therefore, we isolated PlFT and carried out further functional research. The total length of the PlFT gene was 592 bp, whose complete open reading frame was 522 bp and encoded 173 amino acids. The amino acid sequences of PlFT were compared with those of Paeonia suffruticosa, Rosa chinensis, Malus domestica, and Petunia x hybrida by DNAMAN software (Fig. 5a). The amino acid sequences of PlFT were 99%, 93%, 93%, and 89% similar to those of PsFT (AHM25242.1), RcFT (XP_024189593.1), MdFT (NP_001280810.1) and PhFT (AZL87173.1), respectively. The similarity between FT and PsFT (AHM25242.1) was the highest, reaching 99%. The similarity between FT and PhFT (AZL87173.1) was the lowest, reaching 89%. The PlFT gene sequence was registered in the NCBI database with the accession number of MT249229. To study the phylogenetic relationship between PlFT and other species, the phylogenetic tree of PlFT protein and FT protein of other species is shown in Fig. 5b. The results showed that the evolutionary relationship between PlFT and PsFT was the closest, followed by VvFT and HnFT, and relatively far from MdFT.
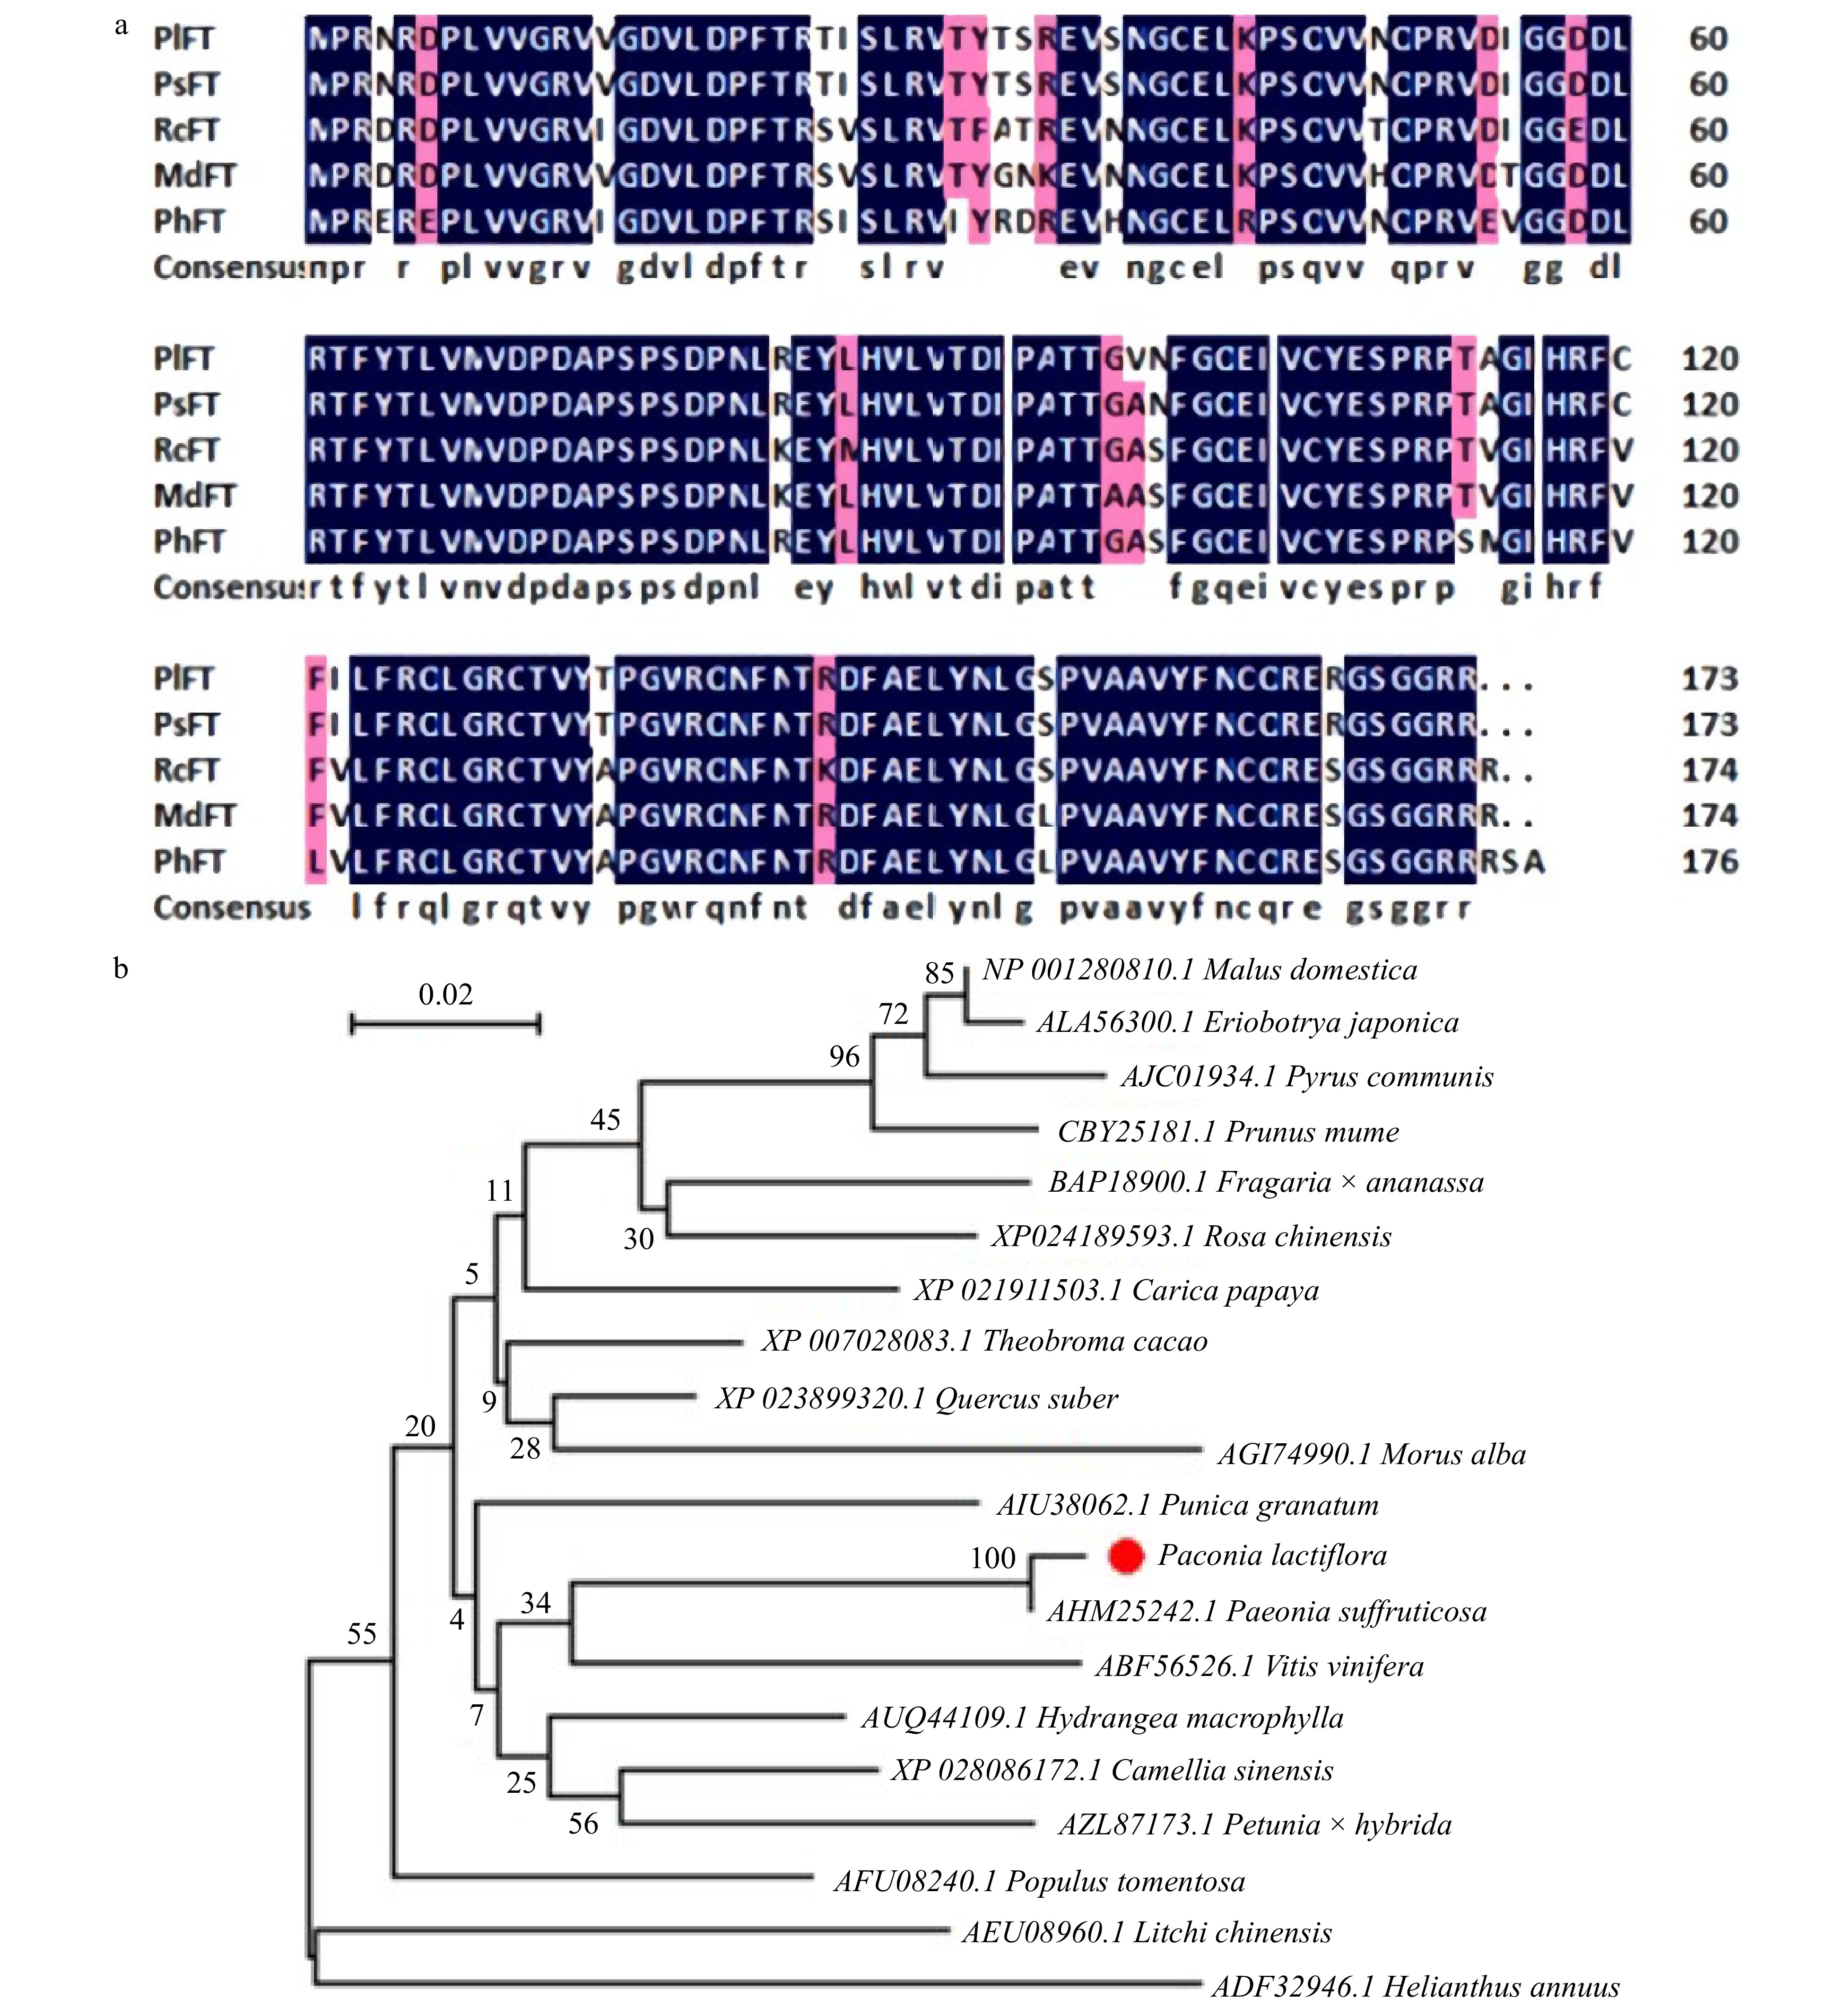
Figure 5. Sequence analysis of PlFT. (a) Amino-acid comparision between PlFT and FT homologues from other species. (b) Phylogenetic tree based on the amino acid sequences from PlFT and other species. AHM25242.1 [Paeonia suffruticosa]; AFU08240.1 [Populus tomentosa]; BAP18900.1 [Fragaria × ananassa]; AUQ44109.1 [Hydrangea macrophylla]; XP_023899320.1 [Quercus suber]; XP_028086172.1 [Camellia sinensis]; AIU38062.1 [Punica granatum]; XP_007028083.1 [Theobroma cacao]; XP_024189593.1 [Rosa chinensis]; AGI74990.1 [Morus alba]; XP_021911503.1 [Carica papaya]; ABF56526.1 [Vitis vinifera]; NP_001280810.1 [Malus domestica]; AZL87173.1 [Petunia × hybrida]; ALA56300.1 [Eriobotrya japonica]; AJC01934.1 [Pyrus communis]; AEU08960.1 [Litchi chinensis]; CBY25181.1 [Prunus mume]; ADF32946.1 [Helianthus annuus].
Genetic transformation of PlFT gene in A. thaliana
-
An overexpression vector carrying PlFT (pCAMBIA1301-PlFT) was transformed into Agrobacterium tumefaciens strain EHA105 by the freeze-thaw method, which was transformed into Arabidopsis mutant ft-10 by the floral dip method as there is currently no peony transformation system available. Mature seeds were collected and recorded as T0. The seeds of T0 generation were screened on MS medium containing hygromycin (25 mg/L). The well-developed plants as the transformed T1 generation Arabidopsis (Supplemental Fig. 2) were transplanted to the plug and cultured in the light incubator. After flowering and seed set, the seeds were collected and recorded as the T2 generation. The T2 generation was further seeded on hygromycin-resistant medium for screening, and the control wild-type Col-0 and mutant ft-10 were transplanted and seeded on MS medium without resistance. A total of 35 T2 generation transgenic Arabidopsis with FT gene of P. lactiflora were obtained. One complete flowering mutant ft-10 and one wild-type Col-0 Arabidopsis thaliana were selected as controls. At the same time, T2 generation PlFT transgenic plants 4, 17, and 28 lines were chosen for GUS staining analysis (Fig. 6a). The mutant ft-10 and wild-type Col-0 did not exhibit blue. At the same time, the selected transgenic plants showed blue, which indicated that wild-type and mutant plants did not contain the GUS gene, while those stained with blue were transgenic plants carrying the PlFT.
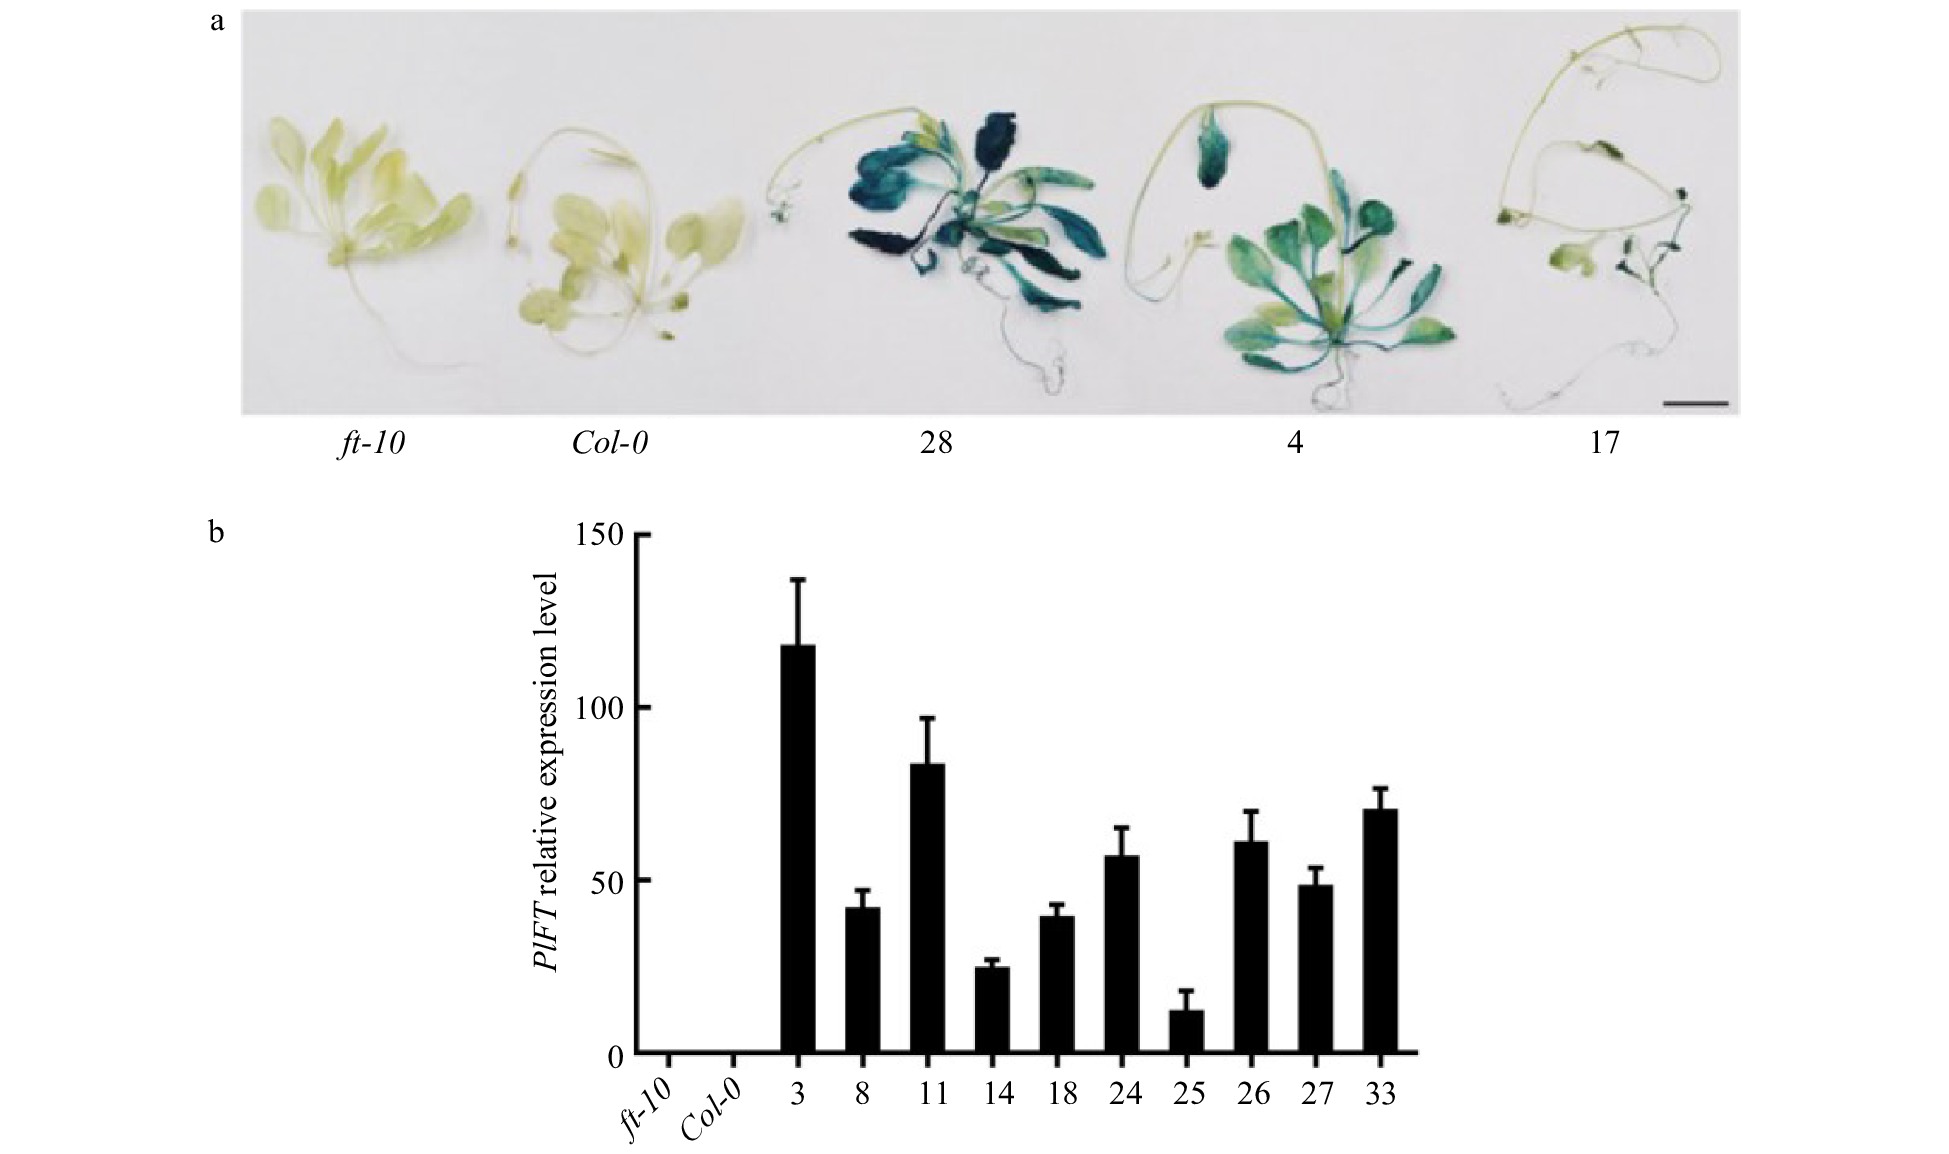
Figure 6. Identification of the PlFT gene in A. thaliana. (a) GUS staining results of transgenic Arabidopsis lines with PlFT gene. (b) Relative expression level of target genes in transgenic lines. ft-10 is mutant plant, Col-0 is wild-type plant, other numbers are PlFT transgenic plants.
qRT-PCR was used to detect the expression of the PlFT gene in Arabidopsis thaliana. The mutant ft-10 and wild-type Col-0 plants were used as the control group. Ten PlFT transgenic ft-10 mutant Arabidopsis (3, 8, 11, 14, 18, 24, 25, 26, 27 and 33 lines) were randomly selected and analyzed. The expression levels of these plants are shown in Fig. 6b. The expression levels of the PlFT gene in ten transgenic lines were highest, suggesting that the PlFT gene was overexpressed in mutant ft-10 Arabidopsis driven by ubiquitin promoter.
The phenotypes of T2 generation transgenic Arabidopsis and its control are shown in Fig. 7a. ft-10 was in the vegetative growth stage, Col-0 was budding, while transgenic Arabidopsis showed early flowering phenotype. The flowering time (Fig. 7b) and rosette leaves (Fig. 7c) of transgenic Arabidopsis and the control were counted. The results showed that the flowering time of the mutants ft-10 was about 70 DAE (days after emergence), the number of rosette leaves at bolting mainly was 30–35. The flowering time of wild-type Col-0 was 57 DAE, and the number of rosette leaves at bolting was 16–23. PlFT complemented the late flowering phenotype of mutant ft-10. The flowering time of transgenic ft-10 was about 45 DAE, and the number of rosette leaves at bolting decreased to 8–15. The difference in the flowering time between transgenic Arabidopsis and control was significant. The number of rosette leaves of mutant ft-10 was the most, followed by wild-type Col-0, and transgenic Arabidopsis was the least. Because of the deletion of the FT gene, the flowering of mutant ft-10 was later than that of wild-type Col-0. However, after the PlFT gene was transferred, the functional complementation was obtained. The flowering time was significantly earlier than that of wild-type, which was consistent with the statistical results of leaf disc number.
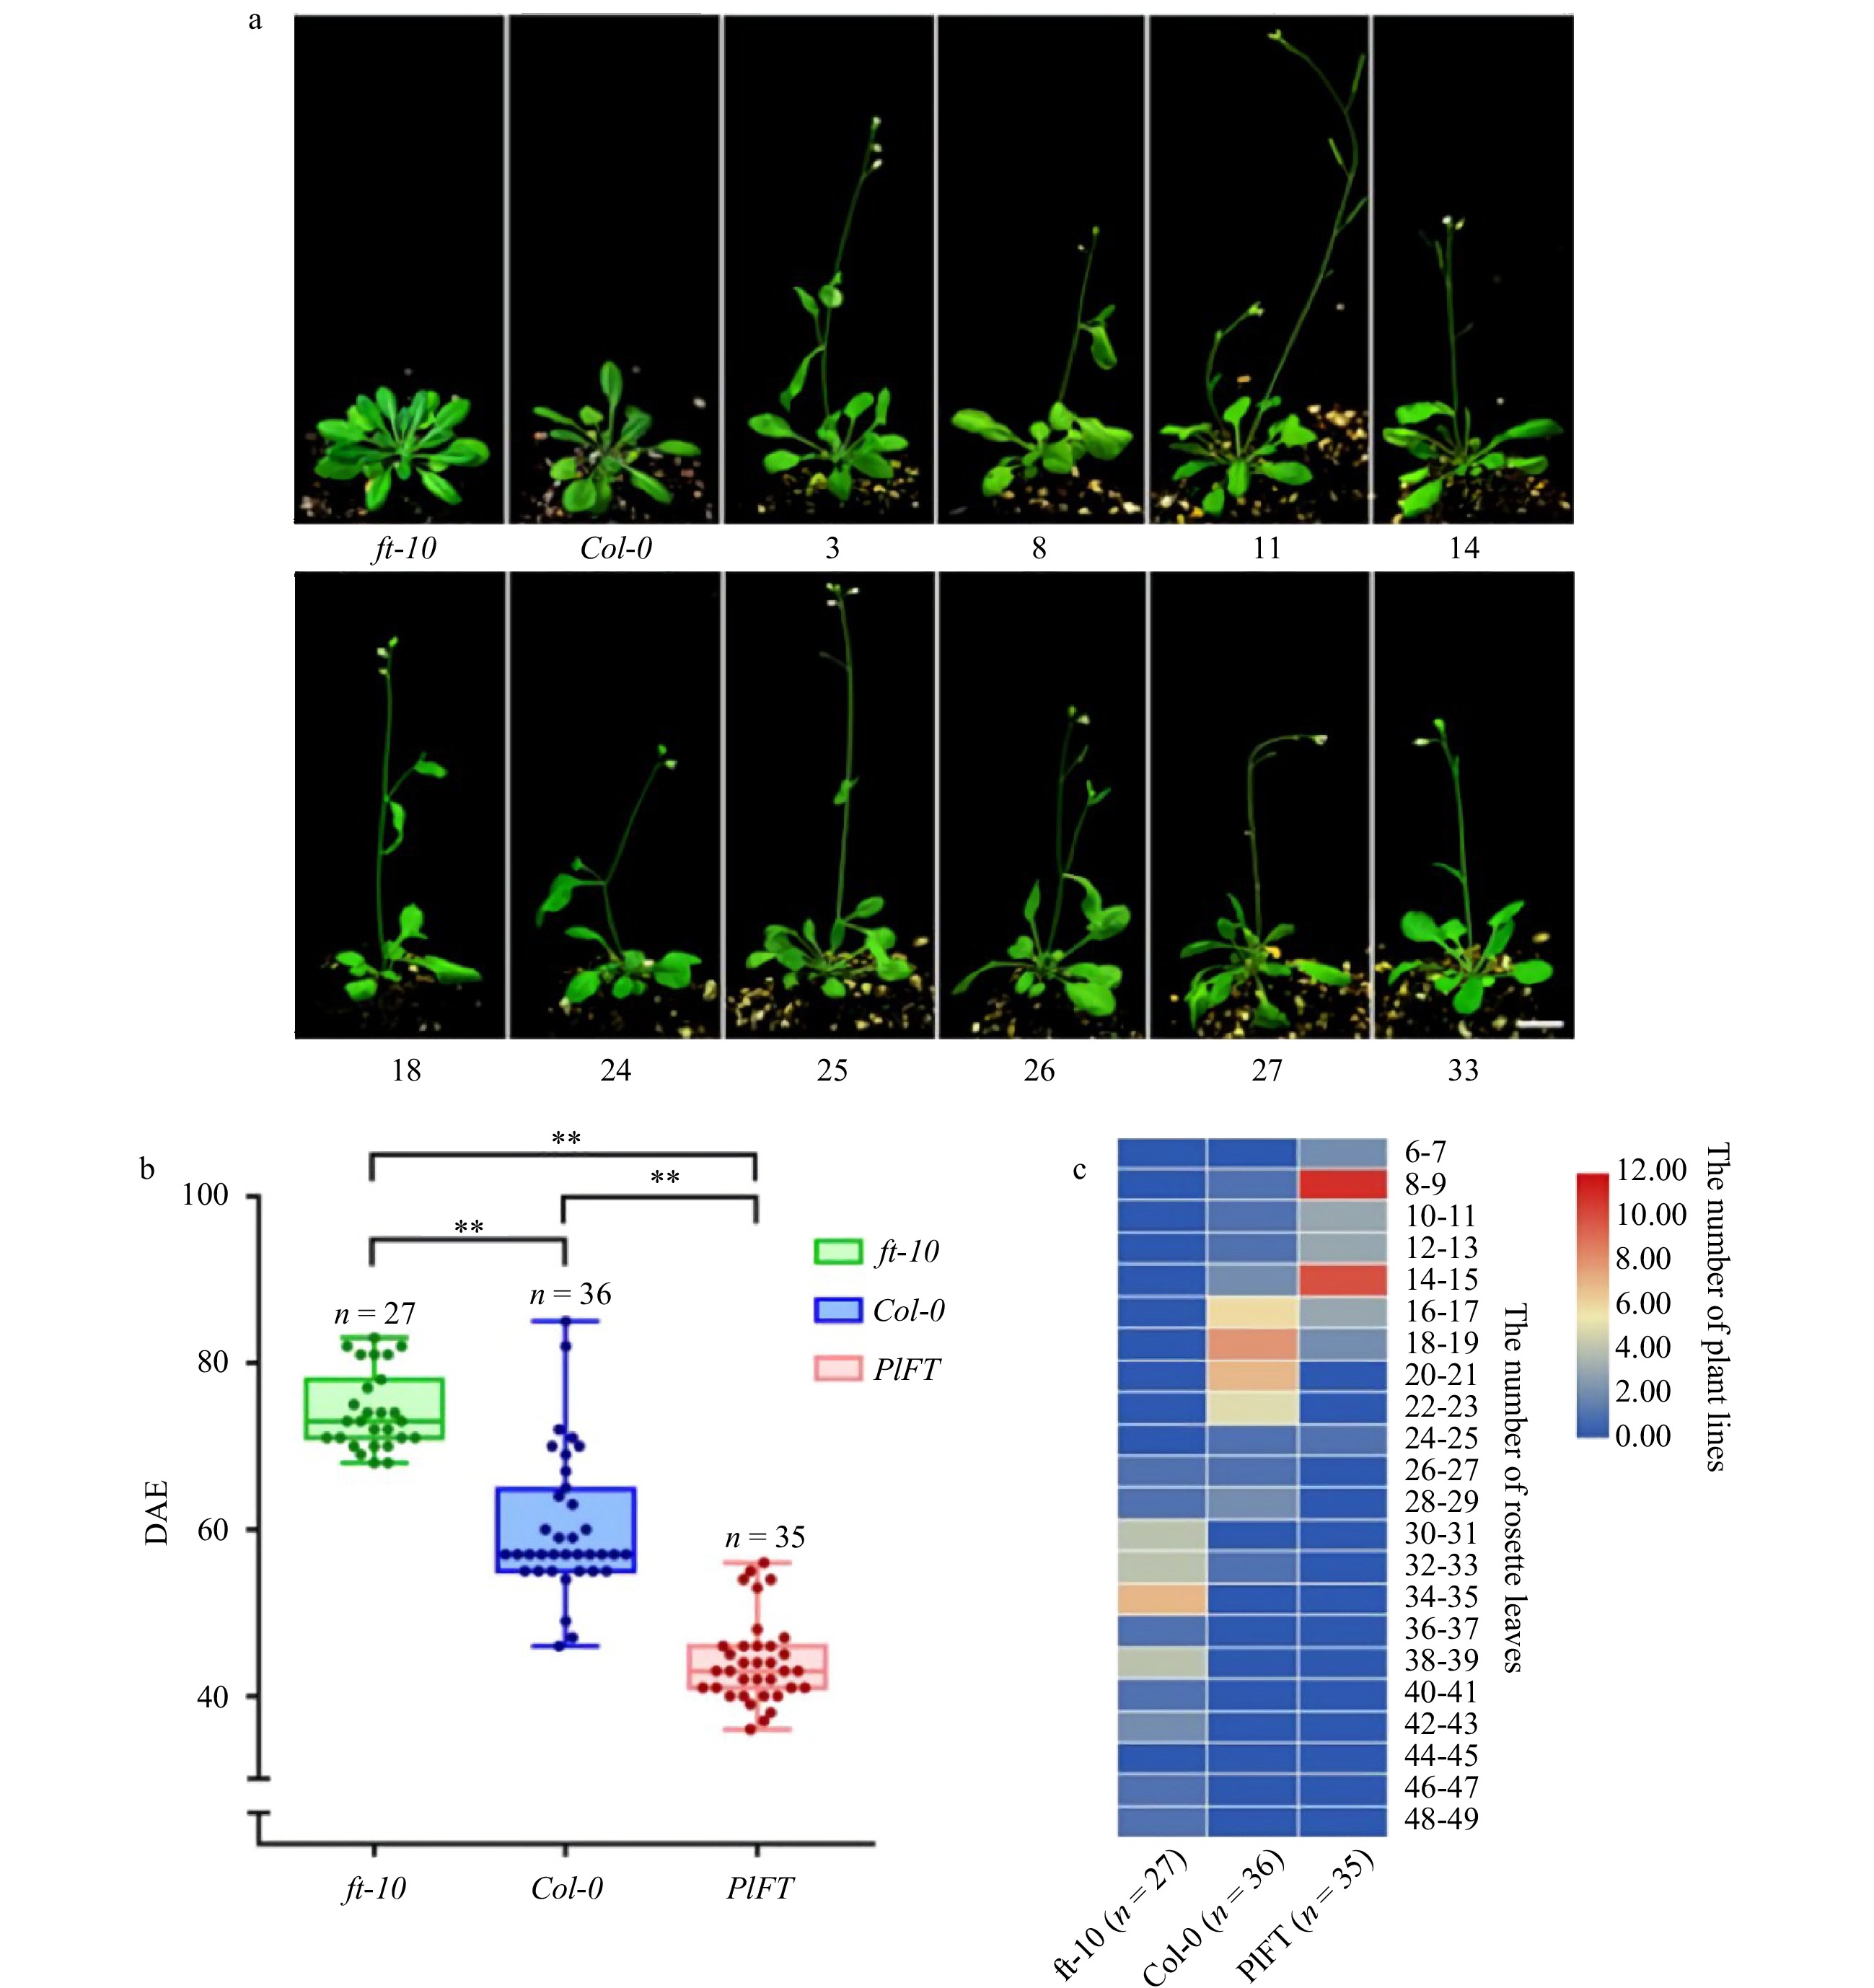
Figure 7. Phenotypic analysis of the PlFT gene in A. thaliana. (a) Phenotype of transgenic Arabidopsis (Scale = 1 cm). (b) Flowering time of Arabidopsis DAE in the figure indicates the days after emergence and indicate significant differences (P < 0.01). (c) Heat map of the leaves of the rosette of Arabidopsis thaliana.
-
Paeonia lactiflora has become an important cut flower plant, but current research has been largely focused on physiological levels of flower bud differentiation, and there have been no transcriptome studies on flower development. However, transcriptome studies have been performed on other floral plants. For example, transcriptome analysis was conducted on the flowering process of 'Old Brush'. From which 85,663 single genes and 1,637 differentially expressed genes (DEGs) were obtained. FRI, FY, DRM1, ELIP, COP1, CO and COL16 related to the circadian rhythm or autonomic pathway were screened[37]. A complex genetic network comprising of several coordinated flowering pathways was identified which control the developmental transition of flowering[38]. In Arabidopsis, more than 200 genes associated with flowering have been identified and characterized[10, 39]. In this study, a total of 23 DEGs were identified to regulate peony flowering, including CHE, PHYB, LHY, CO, PRR5, PRR7, FKF1, CDF1, PHYA, PAP1, HY5, TOC1, ELF3, GI, FT, CRY1, CRY2, ZTL, SPA1, FLC, FUL, AP1, and SOC1 from Illumina Hiseq platform transcriptome data. These genes were involved in various flowering pathways and regulatory networks, including the photoperiod, vernalization, and aging pathway[10, 39]. This study is the first transcriptome analysis of P. lactiflora 'Dafugui' at different flowering stages, which provides a scientific basis for further screening of flowering regulation genes and for elucidating the mechanism underlying flower development of P. lactiflora.
It is well known that the FT gene plays a vital role in plant growth and development, affecting the flower opening and morphogenesis. Böhlenius et al. found that the CO/FT regulatory module controls flowering time and the short-day-induced growth cessation and bud set occurring in the autumn[40]. In tomato, SFT induced flowering in day-neutral tomato and altered flower morphology[41]. The FT orthologue in rice, the Hd3a gene, participated in the regulation of potato types to tuberize[42]. Moreover, overexpression of FT can activate the H+-ATPase to open stomata in plants[43]. Because of the critical role of FT in plants, we chose PlFT as the essential flowering-related gene. Our results proved that the PlFT gene played an important role in regulating flowering of P. lactiflora.
Overexpression of PlFT could promote the flowering of plants, which is important for the development of Arabidopsis. It is suggested to use the FT gene to regulate the inflorescence of P. lactiflora. For example, overexpression of LsFT from lettuce (Lactuca sativa L.) can restore the late flowering phenotype of ft-2 mutant Arabidopsis[44]. Transgenic cassava plants with MeFT1 showed an early flowering phenotype compared with non-transgenic control. qRT-PCR analysis indicated that MeFT1 triggered flowering by regulating downstream flower meristem recognition genes[45]. FT does not act alone but alongside environmental and endogenous signals that regulate downstream genes to promote flowering. Studies found that FT induces the transcription of SWEET10, which encodes a bidirectional sucrose transporter, specifically in the leaf veins. It changes the metabolism of flowering plants and is activated by long-term illumination. Ectopic expression of SWEET10 leads to increased transcription levels of genes associated with flowering time in shoot tips, leading to early flowering of plants[46]. In the upstream of FT, overexpression of CmBBX8 regulates genes expression related to photoperiod, and accelerates flowering. CmBBX8 has been confirmed to directly target CmFTL1 and promote the flowering of summer chrysanthemum[47]. However, not all FT functions were promoting flowering. Overexpression of LlFT and TgFT2 in Arabidopsis led to the decrease of early flowering and rosette leaves. The bulb-specific role of TgFT3 was speculated through observation and phylogenetic analysis[48]. These results indicate the complexity of flowering time regulation and the functional diversity of the FT gene.
In this study, the upstream and downstream genes and action sites of PlFT regulation in P. lactiflora need to be further explored. Because the FT gene is related to light and photoperiod, its application could make plants bloom earlier and expand the geographical scope of its production. According to relevant reports, different GmFT2a and GmFT2b haplotypes significantly affect the diversity of soybean flowering time at different latitudes[49]. The CsFT locus is the primary source for cucumber to adapt to high latitude, which provides an important perspective for flowering time control and latitude adaptation of cucumber and may help encourage breeding cucumber in the cold temperate zone[50]. Thus, the multi-function of FT could make it a valuable resource for regulating the flowering time of P. lactiflora. The overexpression of PlFT could accelerated the flowering of A. thaliana and reduced the rosette leaves. PlFT function study will help us to understand the molecular mechanism of flowering in P. lactiflora and provide important resources for genetic improvement of P. lactiflora as one of the important cut flower plants.
-
Plants of Paeonia lactiflora 'Dafugui' had cultivated for three years in the germplasm repository of the Horticulture and Plant Protection College, Yangzhou University, Jiangsu Province, P.R. China (32°39′N, 119°42′E). Shoot apical meristem (T1), flower buds (T2) and flowers (T3) were separately collected on June 17, 2018, March 9, 2019 and May 9, 2019. They were stored at −80 °C for RNA extraction. RNA was separately extracted for these samples using the Mini BEST RNA Extraction Kit (TaKaRa), and RNA samples was checked using Nanodrop 2000C (Thermo Scientific).
cDNA library construction and sequencing
-
After total RNA was extracted from 'Dafugui', the sampling time points included three stages with three biological repeats in each step. A total of nine samples were used to construct cDNA library and de novo sequencing. The total RNA was performed by mRNA enrichment or rRNA removal. The obtained mRNA was fragmented by adding an appropriate amount of interruption reagent under high temperatures. A strand of cDNA was synthesized by using the interrupted mRNA as a template, the two-strand cDNA was then synthesized by configuring a two-strand synthesis reaction system. The purified cDNA was recovered, and the sticky end was repaired. The 3 'end of the cDNA was added with a base 'A' and connected to the connector. The fragment size was then selected, and PCR amplification was performed. Agilent 2100 Bioanalyzer and ABI StepOnePlus Real-Time PCR system were used to detect the constructed library. Finally, the RNA was sequenced after qualification.
Sequencing data filtering and assembly
-
The filtering software SOAPnuke (v1.4.0) and trimmatic (v0.36) were used for statistics and filtering respectively, and RSEM (v1.2.8)[51] was used to calculate the expression levels of genes and transcripts.
Trinity (v2.0.6) software (https://github.com/trinityrnaseq/trinityrnaseq/wiki) was used for de novo assembly of clean reads. Tgicl clustered the transcript to obtain Unigene. The Unigene is divided into two parts. One is clusters, which is the result of further redundancy. To study multiple samples, we used Tgicl to cluster the Unigenes of each sample again to obtain the final Unigene for subsequent analysis.
Functional annotation and classification
-
Seven functional databases (KEGG, NR, GO, NT, SwissProt, Pfam and KOG) were annotated to obtain the protein function annotation and metabolic pathway annotation of Unigene. Blastn is used to annotate Unigene in NT, and Blastx annotates Unigene in NR, KOG, KEGG and Swiss-Prot. Blast2Go and NR are used to annotate GO, and InterProScan5 is used to annotate InterPro.
Analysis of differentially expressed genes (DEGs)
-
The FPKM values of different genes in each comparison group were clustered. According to the detection results of DEGs, hierarchical clustering analysis was performed by the heat map function in R software. According to GO annotation and official classification, the results of differential gene detection were classified into parts. According to KEGG annotation results and official type, the results of differential gene detection were classified into biological pathways. At the same time, the hyper function in RESM software was used for enrichment analysis, then, P-value was calculated and was corrected by FDR (false discovery rate). DEGs analyzed the data of KEGG pathway in different periods. log2 (FPKM of treatment group /control group) > 0 indicates that the gene expression of the treatment group is up-regulated compared with that of the control group, and < 0 indicates down-regulation.
Quantitative real-time PCR analysis
-
Total RNA from all samples in P. lactiflora extracted by a MiniBEST Plant RNA Extraction Kit (TaKaRa, Japan) was used to synthesize cDNA by PrimeScript RT reagent Kit With gDNA Eraser (TaKaRa, Japan)[52] to anlayze expression levels with a BIO-RAD CFX Connect Optics Module (Bio-Rad, Des Plaines, IL, U.S.A.). The 2−ΔΔCt comparative threshold cycle (Ct) method was referred to calculate their values. 12.5 μL 2 × SYBR Premix Ex Taq, 2 μL cDNA solution, 2 μL mix solution of primers, and 8.5 μL ddH2O in a final volume of 25 μL are the system to perform qRT-PCR. The amplification conditions are 95 °C for 30 s, 40 cycles at 95 °C for 5 s, 52 °C for 30 s, and 72 °C for 30 s.
qRT-PCR was performed to analyze the expression levels of flowering-related DEGs and to detect the expression of the PlFT gene in Arabidopsis thaliana. All used primers are listed in Supplemental Tables 4 and 5.
Sequence analysis of one flowering-related gene
-
Total RNA was extracted from the fresh leaves of 'Dafugui' with a Plant RNA kit (TaKaRa, Japan). According to PrimeScript® RT reagent Kit with gDNA eraser (Perfect Real Time), RNA was reserved into cDNA. Using 5' and 3' end primers synthesized commercially (Genery, China) were designed based on the ORF sequence of the full-length sequence of DEGs FT (gene ID CL8783.Contig2_All) in transcriptome data. PCR reaction was as follows: one cycle of 94 °C for 3 min; 35 cycles of 94 °C for 30 s, 59 °C for 30 s, 72 °C for 1 min; and one cycle of 72 °C for 10 min. After testing by 1 % (w/v) agarose gel electrophoresis, the PCR products were cloned into the pClone007 Vector and sequenced. All gene-specific primers (Supplemental Table 5) were designed by Primer Premier 5.0. DNAMAN 7.0.2 was used to assemble multiple alignments of protein sequences of gene ID CL8783.Contig2_All with those from other species. A Neighbor-Joining phylogenetic tree was generated with MEGA 7.0, using the Poisson correction method and 1000 bootstraps.
Expression vector construction
-
The recombinant plant transgenic vector was based on the obtained full-length sequence of the target gene, combined with the restriction site of the binary expression vector pCAMBIA1301 UbiNOS (Supplemental Fig. 3) constructed by single fragment homologous recombination. The Sac I and Kpn I restriction sites on the polyclonal site of pCAMBIA1301 were used to double cleave the vector (Supplemental Fig. 4). At the same time, the coding region of the PlFT gene was amplified with primers (Supplemental Table 5) containing a 15-20 bp sequence of linearization vector (Supplemental Fig. 5). The recombinant plasmid pCAMBIA1301-PlFT was constructed by ligating the target fragment to the vector with Exnase.
Transformation of flowering-related PlFT gene into A. thaliana
-
The expression vector pCAMBIA1301-PlFT plasmids were used for the transformation of competent cells of Agrobacterium tumefaciens strain EHA105. Arabidopsis Col-0 plants were transformed using the floral-dip method[53]. The inflorescence of A. thaliana was soaked with 1/2 MS infection liquid with transformed Agrobacterium for 1 min and then cultivated under dark conditions for 12 h. The seeds collected were recorded as T0 (the first generation) seeds. Transgenic seeds were all screened on MS medium containing 25 mg L−1 hygromycin (Hyg).
GUS staining
-
Using the GUS staining method, the T2 generation homozygous transgenic plants were selected, and the wild-type plants in the same period were used as the negative control. The appropriate amount of GUS staining solution was added to the penicillin bottle to completely immerse the tissue. After incubation at 37 °C for 1−24 h, blue gradually appeared with the prolongation of incubation time. When the expression level was high, the active site appeared blue. The sample was then immersed in 70 % ethanol for 1−3 h until the chlorophyll of the sample was removed.
- This work was supported by funding from the National Natural Science Foundation of China (31600564), Modern Agricultural Industrial Technology System in Jiangsu Province (JATS [2020]436), the Natural Science Fund of Jiangsu Province (BK20160460), the program of key members of Yangzhou University outstanding young teachers.
- The authors declare that they have no conflict of interest.
- Supplemental Table 1 Clean reads quality statistics.
- Supplemental Table 2 Quality metrics of unigenes of Paeonia lactiflora 'Dafugui'.
- Supplemental Table 3 Statistics of differential genes quantity.
- Supplemental Table 4 Gene-specific primers sequence for for qRT-PCR detection.
- Supplemental Table 5 Primers used in this study.
- Supplemental Fig. 1 Intergroup differential Volcano Plot. The X-axis represents the difference multiple value.
- Supplemental Fig. 2 Screening of transgenic Arabidopsis.
- Supplemental Fig. 3 The plasmid vector of pCAMBIA1301 UbiNOS.
- Supplemental Fig. 4 pCAMBIA1301 vector and its control after double enzyme digestion. M1. DL 2000 Maker; M2. DL 15000 Maker; 1−2. Linearized vector; 3. Circular vector.
- Supplemental Fig. 5 PCR amplification of target genes. M1. DL 2000 Maker; M2. DL 15000 Maker; 1−6. PCR amplification of PlFT.
- Copyright: © 2021 by the author(s). Exclusive Licensee Maximum Academic Press, Fayetteville, GA. This article is an open access article distributed under Creative Commons Attribution License (CC BY 4.0), visit https://creativecommons.org/licenses/by/4.0/.
-
About this article
Cite this article
Sun J, Chen T, Wu Y, Tao J. 2021. Identification and functional verification of PlFT gene associated with flowering in herbaceous peony based on transcriptome analysis. Ornamental Plant Research 1: 7 doi: 10.48130/OPR-2021-0007

Identification and functional verification of PlFT gene associated with flowering in herbaceous peony based on transcriptome analysis
- Received Date: 06 April 2021
- Accepted Date: 13 July 2021
- Published Online: 29 July 2021
Abstract: The herbaceous peony (Paeonia lactiflora Pall.) is considered to be a highly valued cut flower plant. It has large flower with rich colors. However, there has been little or no research into the genes related to its flower development. In this study, we used the Illumina HiSeq platform to analyze the RNA-Seq comparative transcriptome of the P. lactiflora 'Dafugui' in three different flowering periods. Nine cDNA libraries were established, from which 92.53 Gb data with 81,788 unigenes were obtained. We screened the genes related to P. lactiflora flowering, isolated and cloned the PlFT gene related to flowering. The total length of the PlFT gene was 592 bp, which had a complete open reading frame of 522 bp and encoded 173 amino acids. The accession number of the PlFT gene is MT249229. To test the role of PlFT, we constructed an expression vector for genetic transformation. Its expression in Arabidposis mutant indicated that PlFT was involved in the flowering of P. lactiflora. This is the first transcriptome analysis of flower development in P. lactiflora. Our results provide some fundamental information for further analyzing the molecular mechanism underlying flower development of P. lactiflora.
-
Key words:
- Paeonia lactiflora /
- transcriptome /
- FT /
- flowering regulation