


-
Cacao (Theobroma cacao L.) is a perennial crop cultivated by small-holder farmers in the tropical regions of the world[1]. Cacao is a worldwide commodity of great importance as its fermented dried seeds are the principal ingredient for making chocolate by the confectionary and food industries, and it is also used by cosmetic and pharmaceutical corporations. The Maya and Aztec civilizations widely cultivated cacao in Mesoamerica; however, its center of origin as well as its center of domestication is the upper Amazon area of South America[2,3]. West Africa is currently the leader in cacao production worldwide (76.0%), followed by the Americas (17.7%) and Asia (6.1%)[4].
Cacao belongs to the Malvaceae family and is a diploid organism (2n = 2x = 20)[5] with a genome size ranging from 411 to 470 Mbp[6,7]. Earlier classifications of cacao germplasm were conducted based mainly on morphological characteristics and it was divided into Criollo, Forastero and Trinitario (Criollo × Forastero)[8,9]. However, the development of molecular markers has facilitated a more detailed estimation of the cacao genetic diversity, which an initial study classified into ten genetic groups[10], with additional genetic groups discovered subsequently[11,12].
Mislabeling of cacao accessions has been an ongoing problem across cacao collections worldwide, and by using molecular markers (SSRs and SNPs) and selecting reference genotypes, several collections have been screened and off-types have been identified[13−15]. The consequences of the presence of off-type plants at the farmer level are that incorrect plant material usually results in unexpected and subpar economic performance. At the breeder level, segregating populations developed with the wrong parents negatively impacts the advancement of the cacao breeding program[16].
The cacao genome was initially sequenced in 2011[6,7] and since that time, the number of cacao genomes that have been sequenced, as well as the availability of sequence information, has grown substantially[17,18] and contributed to the discovery of SNPs and usage. The use of SNPs has also increased due to a reduction in sequencing costs and easy automation that allows the fingerprinting of one DNA sample with at least 5K SNPs using different next generation sequencing platforms[19,20]. Currently, there are more than 30,000 cacao accessions across all cacao collections according to the International Cocoa Germplasm Database (ICGD)[21]. Molecular authentication of cacao genotypes, therefore, is of critical importance for downstream research and development in the cocoa industry, including germplasm identification, verification of planting materials and authentication of cacao beans and cocoa products.
Single nucleotide polymorphism (SNP) markers have been increasingly used to assist cacao germplasm management, because they are amendable to high throughput systems, have a universal data comparability and lower genotyping cost[22,23]. Several attempts have been made to develop a core set of the most informative SNPs for the identification of off-types, parental and population identification, and determination of admixture levels of the different genetic groups in different cacao collections[24−30]. These small SNP panels, ranging from 48 to 192 SNPs, have been used to generate multi-locus profiles for individual cacao trees, based on the method of 'multi-locus matching', which was used to assess the genetic integrity of genotyped germplasm[23,31].
So far these SNP panels have not been evaluated for their efficacy in population and sub-population classification. This assessment is essential because inferring the population origin of a cacao germplasm can provide an additional dimension to support cacao germplasm identification. When cacao germplasm source or pedigree is unknown or the information is lost, SNP markers can help infer its probable origin and/or compared in better detail to other potential but under utilized germplasm. In many cases, a cacao germplasm accession (e.g., a breeding line) may not have a known reference standard. Therefore, the approach of 'multi-locus matching' cannot be used to ascertain whether this breeding line is mislabeled or not. In such circumstances, inferred parentage, or population origin, provided indirect evidence to assess the genetic integrity of this breeding line as previously reported[14,15]. In addition, population origin is important for cacao variety authentication, which is of considerable interest to the various stakeholders in the chocolate value chain. Production and marketing of differentiated (or specialty) high-value cocoa provides socioeconomic opportunities for cacao growers, the chocolate industry, and especially for consumers[25].
The original classification of cacao germplasm was based on SSR genotyping of 952 germplasm accessions, which led to the proposed classification of the primary gene pool into ten populations or genetic groups (Amelonado, Contamana, Criollo, Curaray, Guiana, Iquitos, Marañon, Nacional, Nanay, and Purús)[10]. In this study we genotyped a fraction of the same DNA samples utilized in the initial experiment[10] using 956 SNP markers, which were pre-selected from the 6 and 15K Theobroma cacao SNP Array[19,20]. The objectives of this research were: a) to compare the SNP-based population structure and genetic distances with the ones obtained with SSRs in the previous study; b) to select a SNP genotyping panel that is effective in cacao population classification and individual genotype identification and c) to establish reference genotypes for each one of the ten populations for cacao authentication. The results obtained in this research would provide much needed cacao germplasm references as well as a suitable SNP marker panel for gene bank management, crop genetic improvement, seed garden verification and cocoa traceability and authentication.
-
Leaf samples from 552 accessions (58%) out of the original 952 plant accessions previously used in identification of the ten genetic groups[10] were used in this research. The distribution of the samples based on genetic groups were as follows: Amelonado 65% (61/94), Contamana 51% (25/69), Criollo 3% (1/39), Curaray 75% (88/117), Guiana 63% (37/59), Iquitos 60% (70/117), Marañón 73% (104/143), Nacional 52% (27/52), Nanay 75% (114/152), and Purús 75% (83/110) (Supplemental Table S1). The cacao clones Matina 1-6, Criollo 22 and Pound 7 were used as controls.
DNA isolation and SNP genotyping
-
The DNeasy® Plant Mini kit (Qiagen Inc., Valencia, CA, USA) and the Fast Prep® Kit (MP Bio) were used to extract DNA from fresh and lyophilized cacao leaves. Leaf tissue was weighed; 100 mg for fresh and 20 mg for lyophilized tissue and added to the sample tube. A stainless-steel bead was added for the Qiagen method and garnet chips and a ceramic bead were added for the Fast Prep method. The tissue was ground in two 1-minute high-speed (30 Hz) shaking steps in a TissueLyser II (Qiagen) for the Qiagen method or the tissue was disrupted in a Fast Prep Homogenizer with three 30-second high-speed shaking steps for the Fast Prep method. After that, the protocol was followed from the manufacturers with the following modifications. 25 mg mL−1 polyvinylpolypyrrolidone was added to the DNeasy® kit buffer AP1 for the Qiagen method or to the CLS-VF for the Fast Prep® method. DNA was eluted from the silica column with two washes of 50 µL Buffer AE for the Qiagen method or with DES for the Fast Prep method, which were pooled, resulting in 100 µL DNA solution. DNA concentration was determined using a Qbit spectrophotometer (ThermoFisher) with absorbance at 260 nm.
A total of 956 Tcm SNP loci were used in this research (Supplemental Table S2). They were developed using Transcript-Based SNP identification, Genome-Based SNP Identification, the Matina 1-6 reference genome and Illumina Infinium SNP array technology[7,19,20]. Also, Tcm SNPs were selected based on their polymorphism between the cacao clones UF 273 Type 1 and Pound 7[32]. The distribution of SNPs across the cacao genome were as follows: Chromosome 1 (98), Chromosome 2 (97), Chromosome 3 (95), Chromosome 4 (99), Chromosome 5 (98), Chromosome 6 (98), Chromosome 7 (99), Chromosome 8 (76), Chromosome 9 (98), Chromosome 10 (98).
Libraries were prepared using the ThermoFisher AgriSeq technology. The DNA was normalized to 3.3 ng/μL for a total of 10 ng of DNA per 10 μL reaction before adding the Ion AgriSeq primer panel and the AgriSeq amplification master mix. The DNA targeted amplification was achieved with the following thermocycler profile: 99 °C for 2 min, then 15 cycles of 99 °C for 15 s and 60 °C for 4 min. The amplicons were then prepared for barcode addition using a pre-ligation enzyme reaction mix and the following program on a thermocycler: 50 °C for 10 min, 55 °C for 10 min, and 60 °C for 20 min. The IonCodeTM Barcode Adapters were ligated to the amplicons with the final thermocycler step: 22 °C for 30min; 72 °C for 10 min. The libraries were then purified with Agencourt® AMPure® XP magnetic beads and the DynaMag-96 side magnet rack (ThermoFisher). Libraries were pooled to create a final combined library stock by adding 3 μL of each of the prepared libraries into a single tube. Three hundred and eight-four cacao samples were represented in each tube. This tube was then put on the Ion Chef™ (ThermoFisher) which loaded them onto the Ion 540 chip. This chip was loaded onto the Ion GeneStudio S5 Plus™ (ThermoFisher) for sequencing. Amplicon sequences were aligned and scored with the Torrent Variant Caller plugin to determine the genotype call for each marker and sample.
Data analysis
-
Initial SNP analysis was performed using the Ion Torrent™ AgriSum Tool Kit (AST) plug-in that provided information about the coverage, call rate range of the samples and overall sequencing run metrics. Then, raw SNP loci data was exported to Microsoft Excel (Microsoft 365 applications), and samples that had more than 30% of missing data and SNPs loci with more than 10% of missing data were discarded. The final data used for further analysis was 420 DNA samples (accessions) and 865 Tcm SNP loci. GenAllex 6.5[33,34] was used to calculate allele frequencies for each locus of the study population, the number of alleles per locus (A), observed heterozygosity (HO), expected heterozygosity, (HE), polymorphic information content (PIC) as well as to perform pairwise genetic distance, Mantel test (SSRs vs SNPs) and SNP & Variation Suite 8.9.0[35] software was used to perform a linkage disequilibrium pruning analysis.
Population genetic structure and admixture levels were estimated utilizing the model-based Bayesian clustering methodology of Structure v2.3.4[36−38]. Since the genetic groups were previously determined by SSRs only, Criollo 22 and Matina 1-6 were additionally included as references in the analysis. The data were subjected to an admixture model. Ten independent runs were assessed for each fixed number of clusters (K value) ranging from 1 to 15, each consisting of a burn-in of 100,000 iterations and 200,000 Markov chain Monte Carlo repetitions. Results were analyzed using STRUCTURE SELECTOR[39] to identify the most likely number of clusters present based on the method of Evanno et al.[40] and Puechmaille[41]. The programs CLUMPP 1.1.2[42] and DISTRUCT 1.1[43] were used to visualize the results. Based on the result of population stratification, individuals with high assignment coefficient (Q > 0.75) were retained. Pairwise Fst, Analysis of Molecular Variance (AMOVA) and Principal Coordinate Analysis (PCoA) were performed on these populations with retained samples, using GenAllex 6.5[13,44].
Genetic relationship among the nine genetic groups was further examined using clustering analysis. Pairwise distances among populations were calculated using the Nei's[44] standard genetic distance as implemented in the program Microsatellite Analyser (MSA)[45] with 1000 boot strapping. The resulting distance matrix was then used to generate a dendrogram using the UPGMA (unweighted pair group method with arithmetic mean) algorithm[46] available in the program PHYLIP[47]. Thereafter, the dendrogram was visualized using FigTree program version 1.4.2[48].
To assess the efficacy of the selected SNP panel for population classification and individual identification, the result of STRUCTURE analysis and genetic distances generated in the present study was compared with the previous SSR-based result. The consistence of population assignment between the two marker systems was measured by Pearson's correlation. The consistency of the SNP and SSR-based distance matrix was measured using Mantel's Test, as implemented in GenAllex 6.5[33,34].
-
Raw data for the SNP loci and sample calls were organized in Microsoft Excel, (Microsoft 365 applications). Quality control was performed using the Quality Assurance Module from SNP Variation Suite version 8.9.0[35]. Any SNP having more than a 5% no-call rate was removed from the data set. SNPs that were in linkage disequilibrium (LD) with each other at r2 > 0.5 were also removed, resulting in a data set consisting of 219 Tcm SNPs for further analysis. These loci were randomly distributed across the cacao genome and their chromosomal locations are as follows: Chromosome 1 (23), Chromosome 2 (21), Chromosome 3 (15), Chromosome 4 (27), Chromosome 5 (21), Chromosome 6 (26), Chromosome 7 (24), Chromosome 8 (18), Chromosome 9 (15), and Chromosome 10 (29) (Supplemental Table S2).
Descriptive statistics
-
Four hundred and twenty DNA samples and three controls produced amplification (Supplemental Table S1). Summary statistics were computed based on the 420 samples and 219 selected Tcm SNP markers and the results are presented in Supplemental Table S2. The mean value for Shannon's information index was 0.617, ranging from 0.398 to 0.693. The mean observed heterozygosity (HObs) was 0.247, ranging from 0.118 to 0.400. The mean genediversity (expected heterozygosity) was 0.428, ranging from 0.235 to 0.500. The mean fixation index (FIS) was 0.419, ranging from 0.149 to 0.668. The mean minor allele frequency was 0.359, ranging from 0.150 to 0.500 (Supplemental Table S3). Mantel test showed a highly significant correlation (r = 0.718; P < 0.001) between these 219 SNPs and the 91 SSR markers reported in a previous study[10] (Fig. 1).
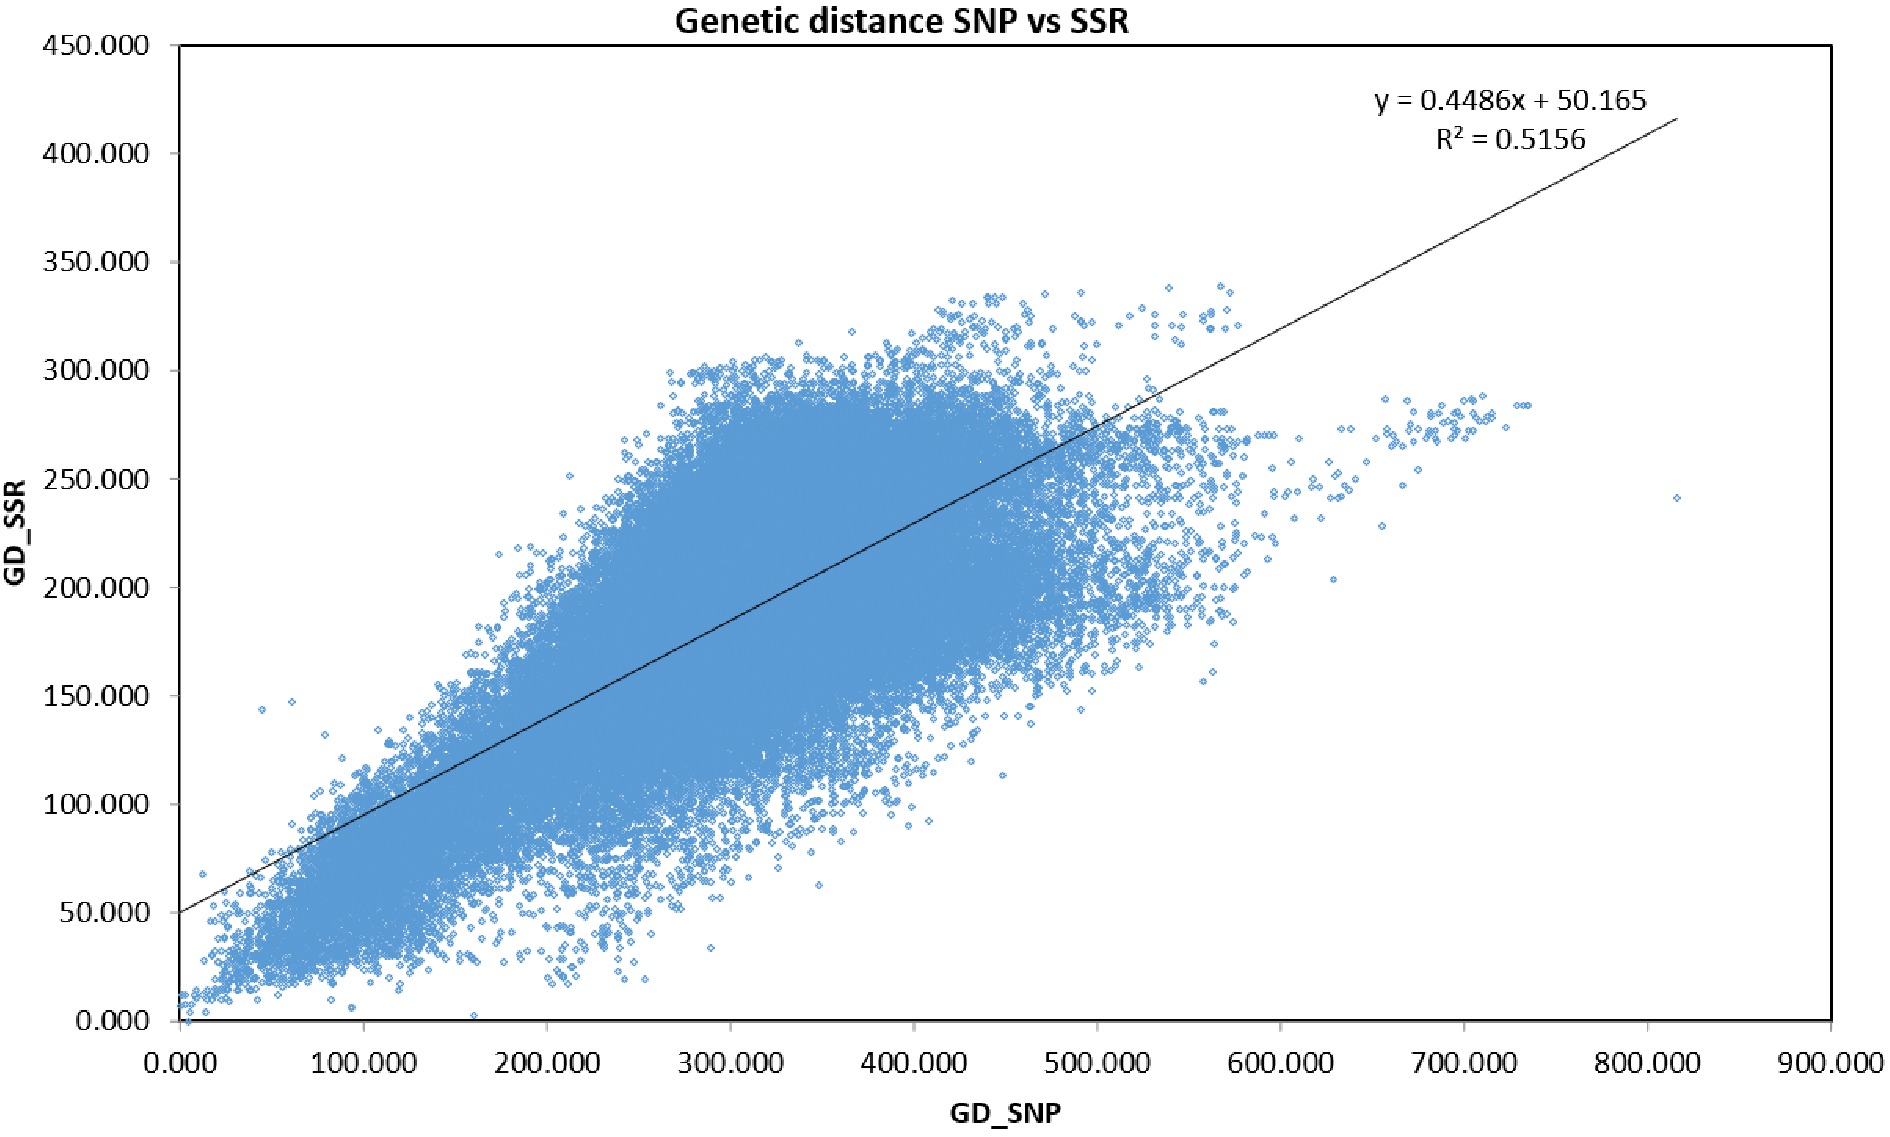
Figure 1.
Mantel test results indicating significant correlation (r = 0.718; P < 0.001) between SNPs and SSR markers.
Inference of population structure
-
From the STRUCTURE analysis, the most probable number of genetically distinct groups (K) was two (Fig. 2a) based on Evanno's Delta K value[40]. However, when the result of STRUCTURE was analyzed using the method of Puechmaille[41], as implemented in STRUCTURE SELECTOR[39], all the supervised estimators (Medmedk, Medmeank, Maxmedk and Maxmeank) suggested the optimum K of nine populations (Fig. 2b).
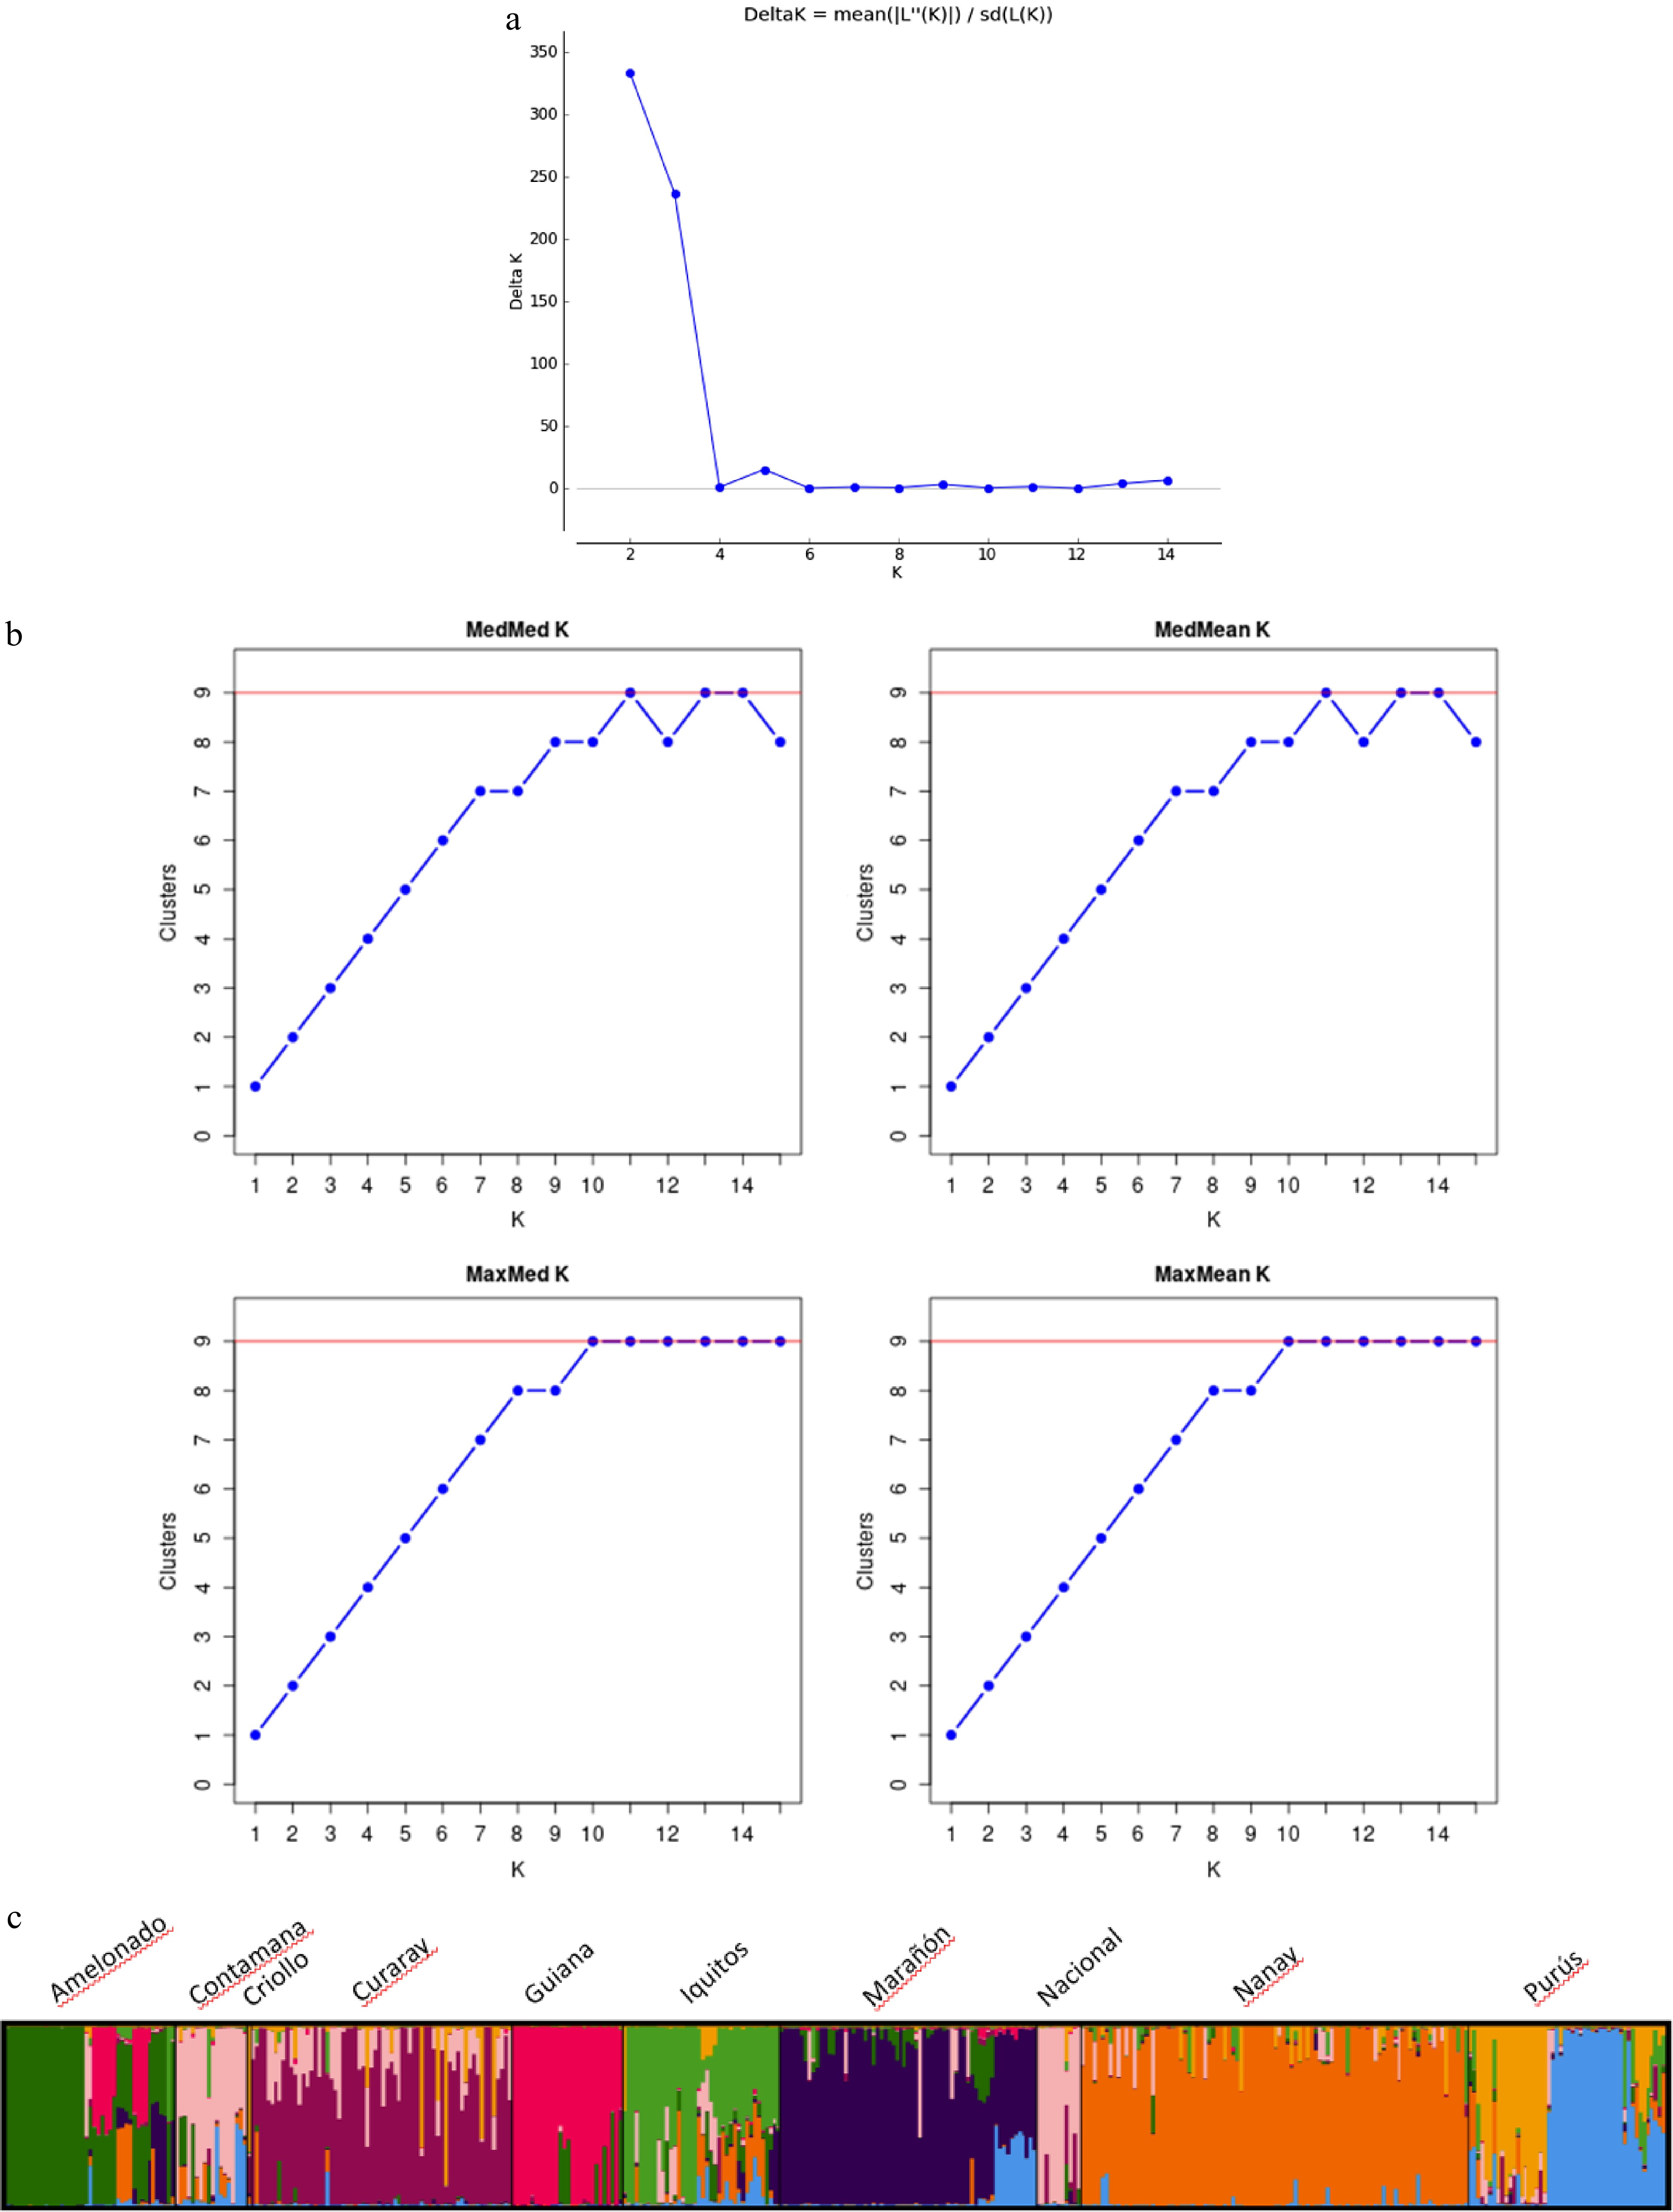
Figure 2.
(a) Number of clusters based on the Evanno's Delta K value[10]. (b) Inferred clusters obtained using the method of Puechmaille. (c) Population structure of the 420 cacao accessions (Theobroma cacao L.) germplasm collections containing representative genotypes of the nine cacao genetic groups obtained using Structure v2.3.3. Black vertical lines indicate the separation of the genetic groups. Multiple colors within the genetic group imply admixed individuals.
At K = 9, seven out of the ten populations had consistent assignment results as the SSR-based study reported previously[10]. These populations include: Amelonado, Curaray, Guiana, Marañon, Nanay, and Purús (Fig. 2c; Supplemental Table S4). However, the population Nacional and Contamana were grouped together. Moreover, discrepancy was found within the Iquitos population, the germplasm from Iquitos, Peru and those from Rio Salimoes, Brazil was separated into two distinct groups. This represents 76% of the 420 samples used (Supplemental Table S1) and constitutes 44% of the samples used in the initial classification of the ten genetic groups[10]. Their distribution based on the genetics groups is as follows: Amelonado 46% (43/94), Contamana 51% (18/69), Criollo 3% (1/39), Curaray 56% (66/117), Guiana 47% (28/59), Iquitos 34% (40/117), Marañón 45% (65/143), Nacional 21% (11/52), Nanay 64% (98/152), and Purús 45% (50/110). The highest DNA amplification was obtained in samples from the Nanay group and the lowest in the Criollo group. Due to this reason, the Criollo sample was not included in the PCA and Structure Analysis. The samples with Q-value ≥ 0.75 were selected as reference clones for each of the corresponding populations (Supplemental Table S3).
Relationship among different populations
-
Principal coordinate analysis based on the results of the STRUCTURE analysis is presented in Fig. 3a and 3b, which provides a complementary illustration of the relationship among the nine genetic groups. The plane of the first three main axes accounted for 23.1%, 7.6%, and 3.8% of total variation, respectively. The distinctiveness of the nine clusters was clearly revealed. The results of the analysis of molecular variance (AMOVA) provide additional evidence supporting the significant population differentiation (Table 1). The within-population molecular variance accounted for 47.0%, whereas among populations, molecular variance was 53.0%. The inter population differentiation was highly significant as shown by Phi-statistics[49] (P < 0.001) (Table 2). The Fst value ranged from 0.038 (Nacional vs Contamana) to 0.194 (Amelonado vs Nanay), with an average of 0.109 among all the populations (Table 3).
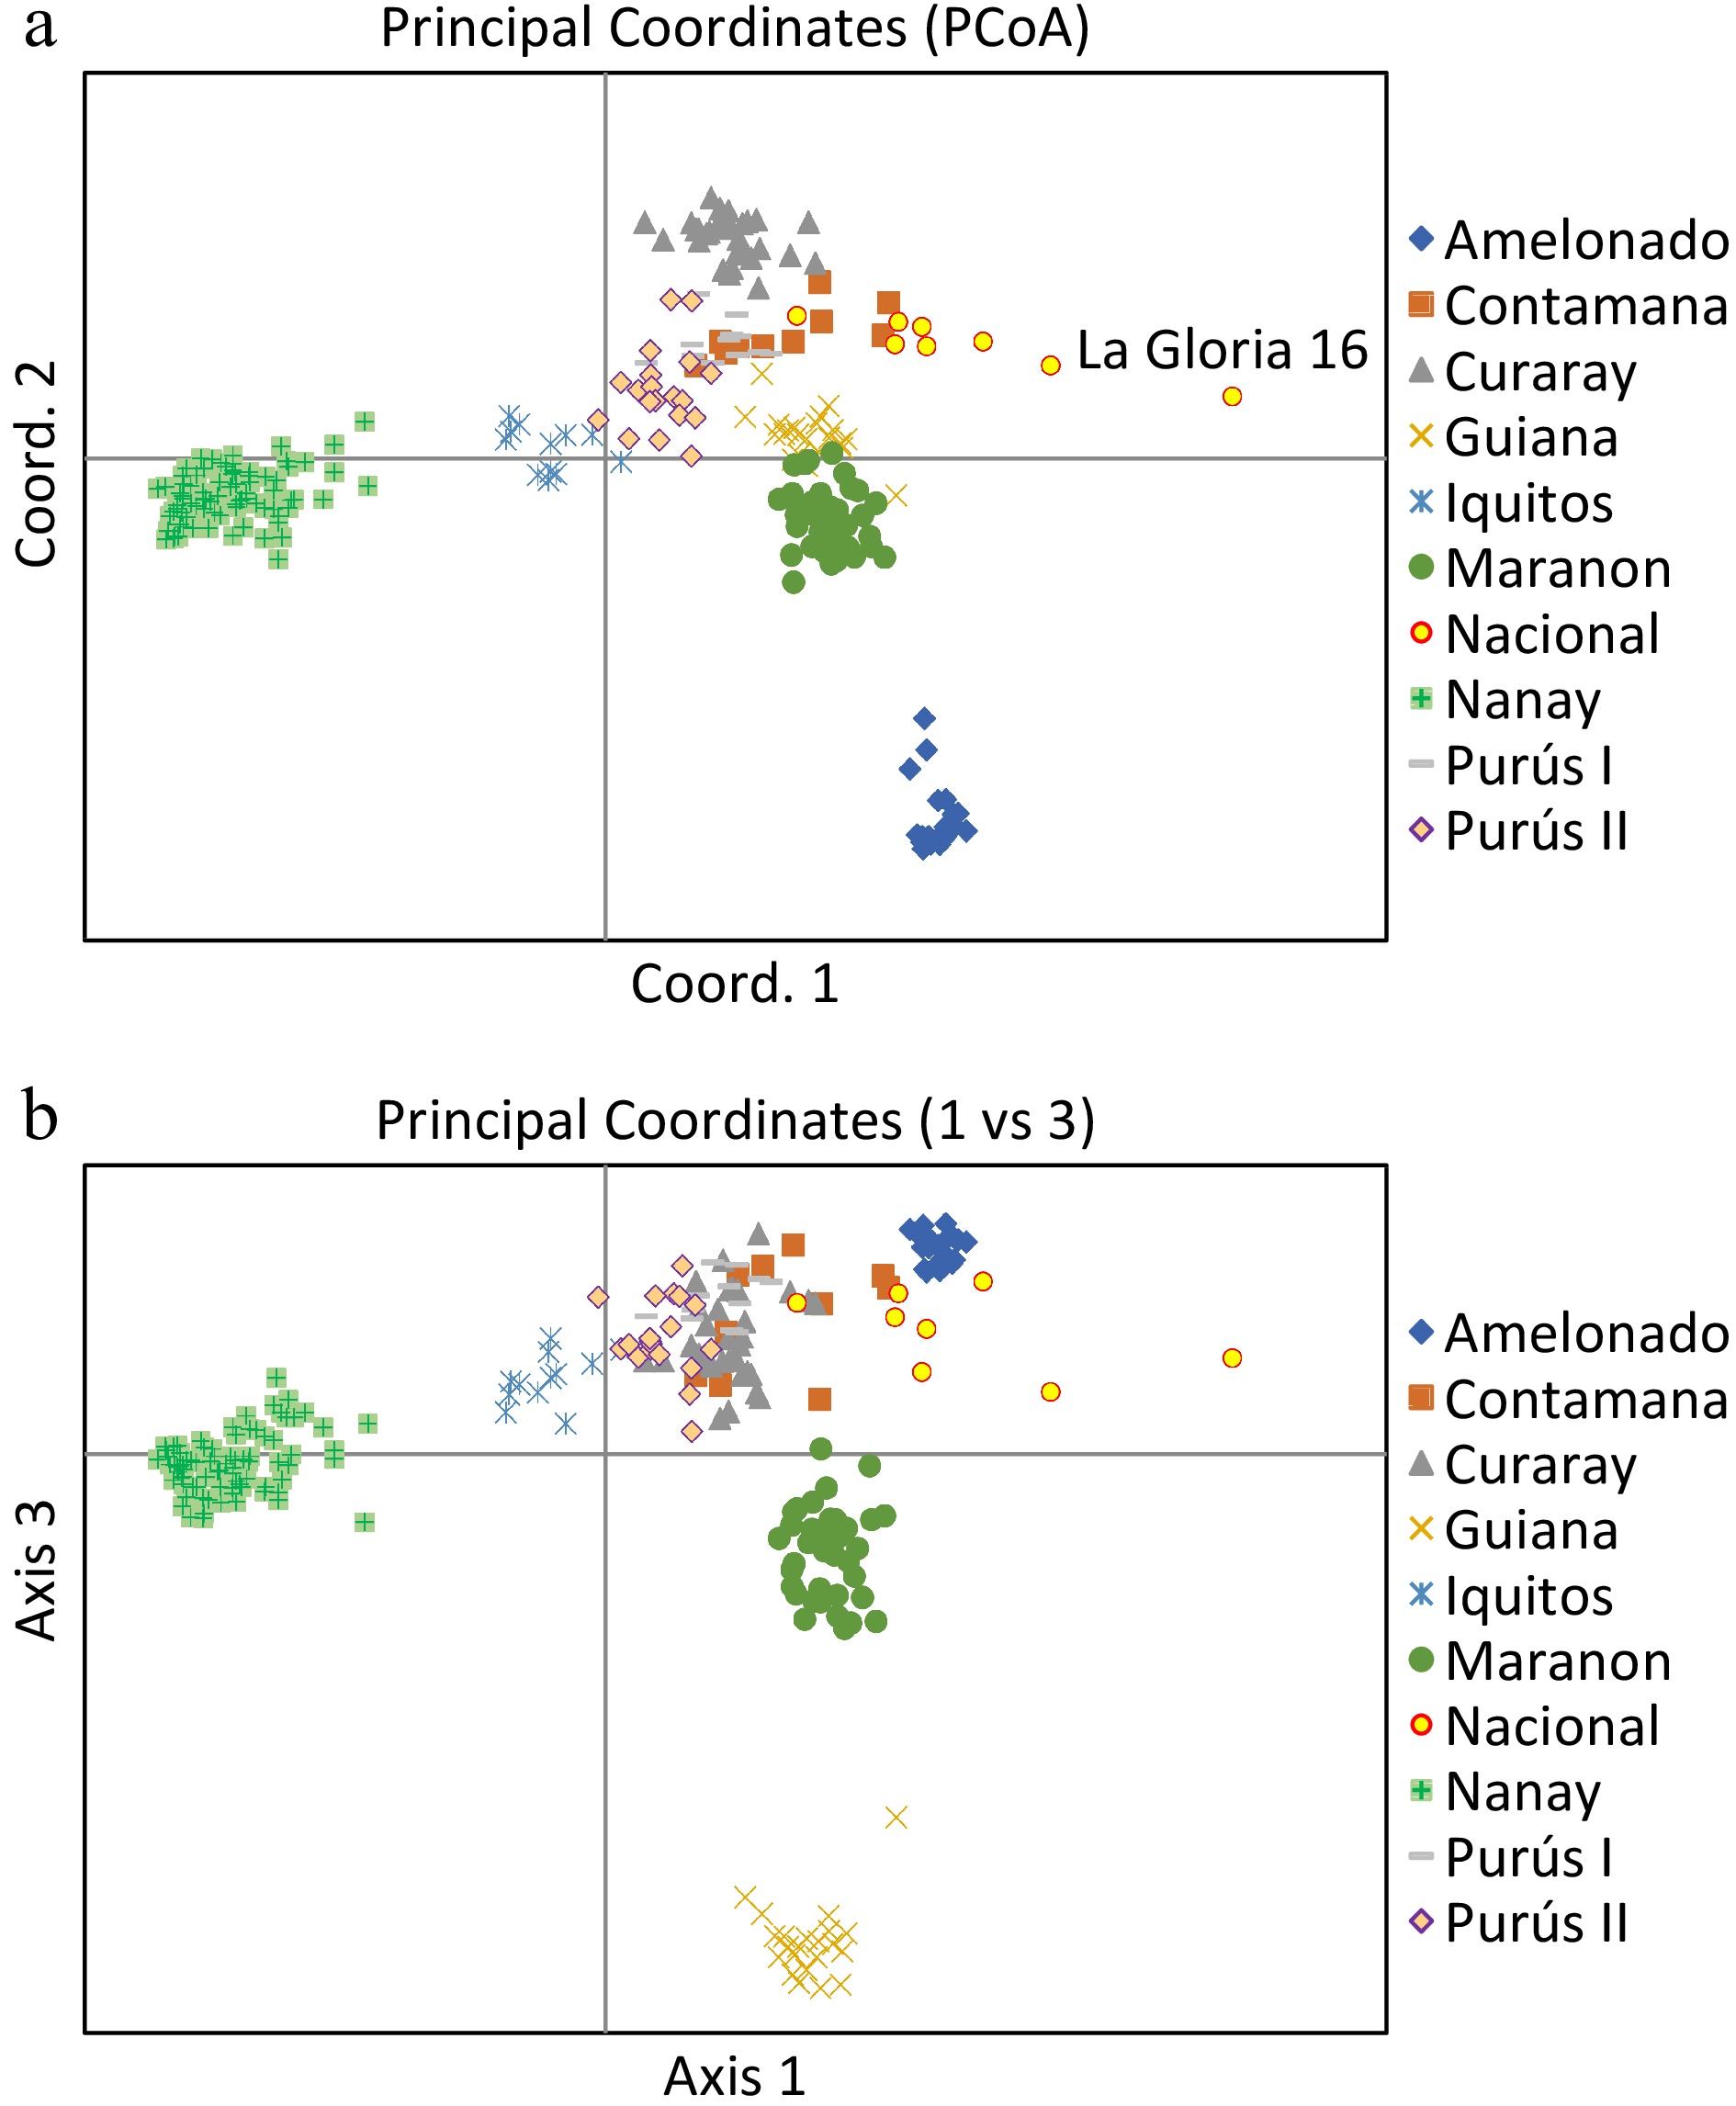
Figure 3.
Principal Coordinates Analysis plots of 420 cacao accessions belonging to nine genetic groups. The plane of the first three main axes accounted for: first axis = 23.1%, the second = 7.6% and the third = 3.8% of the total variation.
Table 1. Analysis of molecular variance (AMOVA) for the nine cacao genetics groups.
Source of variation d.f. Sum of squares Means squares Est. Var % Among populations 9 12,047.62 1,338.62 53.84 53 Within populations 215 11,874.38 47.69 47.69 47 Total 435 23,922.00 16.57380 101.53 100 Table 2. Pairwise Population PhiPT Values among nine cacao germplasm groups.
Populations Amelonado Contamana Curaray Guiana Iquitos Marañon Nacional Nanay Purús I Purús II Amelonado 0.000 0.001 0.001 0.001 0.001 0.001 0.001 0.001 0.001 0.001 Contamana 0.633 0.000 0.001 0.001 0.001 0.001 0.011 0.001 0.001 0.001 Curaray 0.645 0.407 0.000 0.001 0.001 0.001 0.001 0.001 0.001 0.001 Guiana 0.702 0.561 0.540 0.000 0.001 0.001 0.001 0.001 0.001 0.001 Iquitos 0.695 0.462 0.500 0.634 0.000 0.001 0.001 0.001 0.001 0.001 Maranon 0.539 0.406 0.443 0.477 0.444 0.000 0.001 0.001 0.001 0.001 Nacional 0.622 0.095 0.436 0.561 0.499 0.395 0.000 0.001 0.001 0.001 Nanay 0.712 0.593 0.558 0.644 0.489 0.547 0.673 0.000 0.001 0.001 Purús I 0.637 0.319 0.373 0.568 0.437 0.404 0.317 0.555 0.000 0.001 Purús II 0.577 0.300 0.382 0.508 0.360 0.367 0.336 0.483 0.268 0.000 Note: PhiPT Values below diagonal. Probability, P (r and ≥ data) based on 999 permutations is shown above the diagonal. Table 3. Pairwise Population Fst Values based on the result of population stratification. Within each population, samples with the assignment coefficient > 0.75 were retained for analysis.
Amelonado Contamana Curaray Guiana Iquitos Marañon Nacional Nanay Purús I Purús II Amelonado 0.000 Contamana 0.181 0.000 Curaray 0.179 0.092 0.000 Guiana 0.180 0.143 0.124 0.000 Iquitos 0.180 0.117 0.113 0.150 0.000 Maranon 0.129 0.094 0.095 0.104 0.098 0.000 Nacional 0.166 0.038 0.101 0.138 0.129 0.091 0.000 Nanay 0.194 0.135 0.121 0.150 0.087 0.115 0.176 0.000 Purús I 0.168 0.085 0.078 0.133 0.100 0.087 0.083 0.114 0.000 Purús II 0.157 0.083 0.086 0.125 0.082 0.077 0.094 0.092 0.065 0.000 The UPGMA tree (Fig. 4) provided complementary information regarding the inter-population relationships. The cluster pattern is largely consistent with the previous SSR-based result[10]. Same as the result of STRUCTURE stratification, Population Nacional and Contamana were grouped together, which is also compatible with the results of PCoA. In addition, population Guiana and Amelonado were grouped together in the UPGMA tree, whereas population Iquitos and Nanay fell in the same main group. Purús I and Purús II were grouped together. All the branches were supported by the bootstrapping value above 50%, ranging from 516 to 1000 in the consensus tree (Fig. 4).
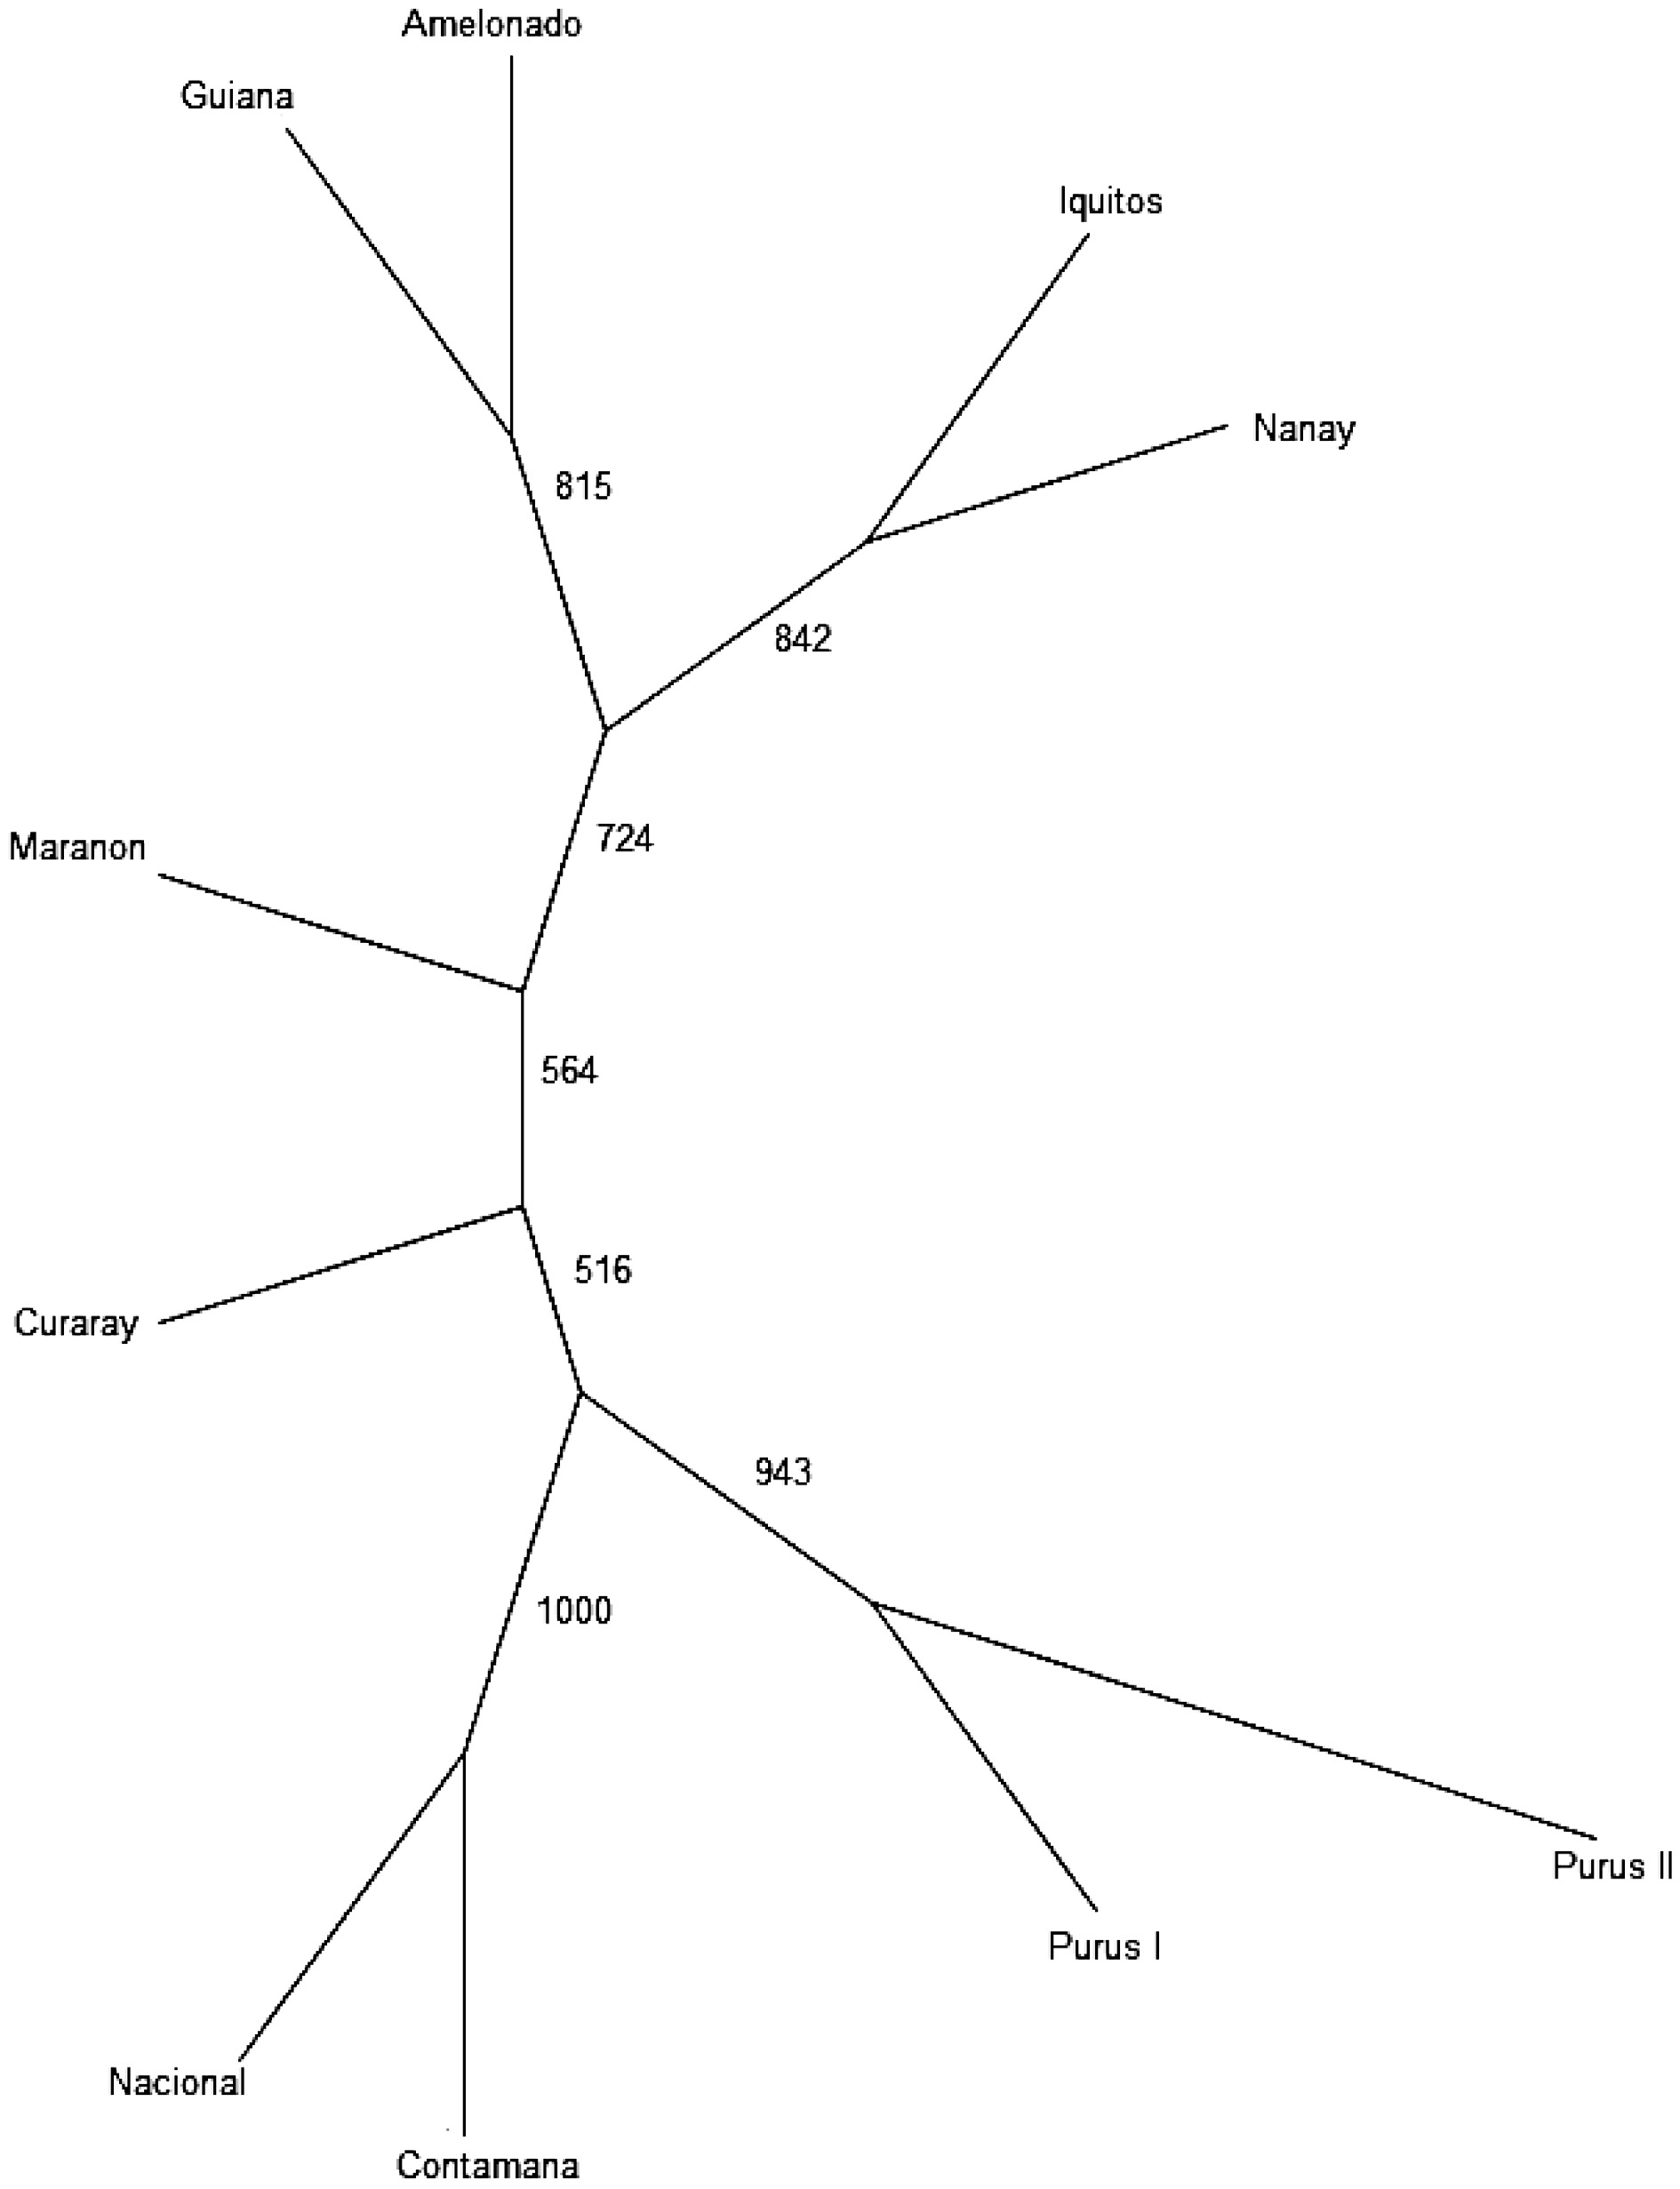
Figure 4.
UPGMA tree indicating the relationships among the genetic groups.
-
Despite great progress in genomics research on cacao, availability of cost-effective molecular tools to support routine germplasm management has been scarce. Developing SNP markers using available sequences could fill the gap between genomic research and downstream applications by cacao breeders and germplasm collection curators. In the present study, we genotyped 956 Tcm SNPs selected from the previously published arrays[7,19,20] and used them to genotype a diverse panel of 451 cacao accessions. These cacao accessions are all wild and were used in a previously reported SSR analysis of genetic diversity[10] in wild cacao populations, based on which the classification of cacao germplasm into ten populations (or genetic groups) were proposed. The repeated genotyping on the same genetic materials using SNP markers enabled direct comparison between the results obtained by both marker systems. It also allowed us to identify cacao germplasm that can serve as a reference standard in population stratification.
We obtained a high success rate (> 95%) for marker validation, which demonstrated that using the ThermoFisherAgriSeq technology targeted sequencing is an effective method for cacao genotyping. This technology is a targeted Genotype By Sequencing (GBS) that utilizes a multiplexed PCR chemistry where large numbers of markers can be targeted and uniformly amplified in a single reaction. The genotyping result showed that it is a suitable technology for large scale genotyping, which can serve as a complementary approach to the currently used methods (e.g., KASP, TaqMan-based quantitative PCR, DArT markers and Maldi-TOF mass spectrometry (MS) for cacao germplasm identification.
Population structure and inter-population relationships
-
The delta K calculated by Evanno's method[40] indicated K = 2 was the most likely genetic clusters in the 420 samples retained in data analysis. This discrepancy to the known genetic groups could be explained by the uneven sampling of the ten known populations, where some populations were not proportionally represented by enough samples, thus, were not classified as an independent genetic cluster by STRUCTURE[50]. Distinct subpopulations with reduced sampling tended to be merged, while at the same time, individuals from extensively sampled subpopulations were generally split, despite belonging to the same panmictic population[41]. Moreover, because the Delta K method detects the uppermost hierarchical level of genetic structure, this can also lead to underestimating the number of genetic clusters in this collection.
To correct the uneven sample size from different populations, we used the method of Puechmaille[41], as implemented in the program STRUCTURE SELECTOR. The four new supervised methods, 'MedMeaK' (median of means), 'MaxMeaK' (maximum of means), 'MedMedK' (median of medians) and 'MaxMedK' (maximum of medians) were applied when individual samples can be grouped based on prior knowledge (e.g., sampling location/region). A subpopulation was considered as belonging to a cluster if its arithmetic mean (for MedMeaK and MaxMeaK) or its median (for MedMedK and MaxMedK) membership coefficient to that cluster was greater than a threshold value (set to 0.5), thus ensuring that a subpopulation cannot belong to more than one cluster[41].
Using Puechmaille's method[41], a result of nine genetic clusters were obtained (with the threshold value set to 0.5), which differentiated population of Amelonado, Curaray, Guiana, Iquitos, Marañon, Nanay, and Purús. However, the populations of Nacional and Contamana were grouped together. This lack of differentiation was likely due to the sampling bias in the National population. The National population is native to the rainforest of Southern Ecuador. Still, the core member of this population was represented by the landraces from the cocoa producing regions in the Pacific coast, including La Gloria and Las Brisas. In the present study, there was only one sample ('La Gloria 16') which was included in the National population. As shown in the PCoA (Fig. 3a), La Gloria 16 was distanced away from the rest of the samples in the Nacional population which shared higher similarity with the Contamana population. The biased sampling led to a small estimation of Fst (0.038) between Nacional and Contamana in the present study.
At K = 9, the STRUCTURE analysis also split the Purús population into two clusters (Fig. 2c; Supplemental Table S3). The first cluster included most of the wild cacao collected from Napo river in the Ecuadorian Amazon. These samples were classified as members of Purús population, but they all had a low assignment coefficient (Q = 0.39−0.61) in the previous SSR-based analysis. The second Purús cluster comprised exclusively of the samples from Purús river, Brazil. Collecting sites of the two cacao groups are more than 1,000 km apart. Fst between the two groups is 0.065, showing that the two groups are substantially differentiated. Therefore, the separation of these two clusters is well justified and they probably can be considered as different populations.
The population relationship revealed by the UPGMA dendrogram (Fig. 4 ), together with the result of STRUCTURE stratification (Fig. 2c) and PCoA plot (Fig. 3a & b)), is compatible with the previous SSR-based result. These results demonstrated that these selected SNPs can be used to assess population origin for cacao germplasm. Such information is highly useful for cacao germplasm identification because it can also be used to infer ancestry/parentage/pedigree for cacao germplasm that may not have known identity or passport data. This approach can play a complementary role to the currently used method for cacao germplasm identification, which directly compare the candidate tree with the known cacao accession, based on the reference SNP profiles. Whereas this approach is highly effective for cacao germplasm identification, it lacks capacity to deal with germplasm that do not have reference standard. SNP marker-based information on population origin, ancestry, parentage, and pedigree, therefore, will be appreciated by cacao breeders, genebank curators and cacao research community in general.
Nonetheless, additional effort remains needed to assess the efficacy of these markers regarding the differentiation power at the level of subpopulations. More germplasm from each wild population, with reliable GPS data, need to be analyzed. Especially, in the SSR-based study, a significant fraction of the individual accessions did not have a high value of assignment coefficient (Q-value). A total of 217 samples (of the 952; 22.8%) had a Q value below 0.70 and 56 samples (5.6%) had a Q value below 0.50[10]. This low assignment coefficients indicates that structure of sub-populations in these wild populations needs further investigation. SNP markers that can efficiently detect these variations among sub-populations need to be selected and used for cacao germplasm identification. Now the major river systems in Peru have been sampled for wild cacao populations[51,52]. Further analysis that includes all the wild populations in these regions will likely provide more insight about the structure of subpopulations in the center of origin of this species.
-
Various SNP genotyping sets have been used for cacao germplasm identification. However, these panels have not been systematically evaluated for optimum genotyping efficiency, as well as for population and sub-population classification. The ideal genotyping panel should comprise a minimum number of SNP markers but have a maximum discriminating power. Moreover, the capacity to infer the population origin of a given cacao accession is essential to support cacao germplasm identification when the reference SNP profile is not available. For an efficient germplasm identification, Linkage Disequilibrium is one of the critical factors because each SNP marker is expected to be independently informative. In the present study, we evaluated 956 SNPs on 451 wild cacao samples with known population origin. Based on the criteria of LD ≤ 0.5, call rate > 95% and Minor Allele Frequency (MAF > 0.15), we selected a total of 219 SNPs. Population stratification demonstrated their efficacy in high compatibility with previously reported SSR markers. Mantel Test of distance matrix between SSR and SNP markers showed a high correlation (r = 0.718; P < 0.001). In addition, the present study generated complementary insight regarding the classification of wild cacao populations and sub-populations in the Amazon region. These newly selected SNPs can also be combined with the previously identified SNP markers, e.g., the TcSNPs that have been commonly used in cacao germplasm identification, to form different genotyping panels. The generated SNP profiles can be converted into a simple bar code and be used in many other downstream applications, such as nursery accreditation, clone registration and the authentication of geographically referenced cocoa beans. This is our pilot project for the development of SNP markers reflecting population origin for cacao (Theobroma cacao L.) germplasm identification. Marker evaluation is being continued with the emphasis on selecting SNP markers to detect sub-population structures in the primary gene pool of T. cacao.
The authors are grateful to Mr. Wilber Quintanilla and Ms. Ashley Johnson at USDA-ARS for their excellent technical assistance. This work has been supported by the USDA-ARS-SHRS Development and Application of Genomic-assisted Breeding Strategies to Produce Disease-resistant Cacao Genetic Resources (Project No. 6038-21000-025-000-D). Also funding for this projectwas provided by MARS, Inc.; Trust Agreement No. 6038-21000-025-12-T: Genomic Enhancement of Theobroma cacao.
-
The authors declare that they have no conflict of interest.
- Supplemental Table S1 List of accessions from different genetics groups and country of origin.
- Supplemental Table S2 SNP information. *Selected loci2.
- Supplemental Table S3 Information index, Observed heterozygosity, Expected heterozygoisty, Inbreeding coefficient and Minor Allele Frequency for the 219 SNP markers selected for cacao germplasm identification.
- Supplemental Table S4 Assignment coefficient for 420 cacao germplasm, representing nine known genetic groups at K=9.
- Copyright: © 2023 by the author(s). Published by Maximum Academic Press, Fayetteville, GA. This article is an open access article distributed under Creative Commons Attribution License (CC BY 4.0), visit https://creativecommons.org/licenses/by/4.0/.
-
About this article
Cite this article
Gutiérrez OA, Martinez K, Zhang D, Livingstone DS, Turnbull CJ, et al. 2021. Selecting SNP markers reflecting population origin for cacao (Theobroma cacao L.) germplasm identification. Beverage Plant Research 1: 15 doi: 10.48130/BPR-2021-0015 

Selecting SNP markers reflecting population origin for cacao (Theobroma cacao L.) germplasm identification
- Received: 30 September 2021
- Accepted: 26 November 2021
- Published online: 27 December 2021
Abstract: Cacao is one of the most economically important agricultural commodities in the world, providing the principal ingredient for the global chocolate industry. Accurate genotype identification is essential for effective conservation and utilization of cacao germplasm. Here, we report the screening of 956 candidate SNPs, pre-selected from the 6 and 15K Theobroma cacao SNP Arrays using targeted Genotyping-by-Sequencing on 451 cacao germplasm accessions, representing ten known genetic groups from the tropical Americas. Based on call rate (No call rate < 5%), Minor Allele Frequency (MAF > 0.15) and Linkage Disequilibrium (LD ≤ 0.5), a total of 219 SNPs were selected. The efficacy of these SNP markers for population classification was compared with the previous SSR-based analysis in cacao. The population assignment results of the retained 420 cacao accessions was highly comparable with the SSR study. The matrix of genetic distance between SSR and SNP markers is highly correlated (r = 0.718; P < 0.001). These results demonstrated the consistency in using the present SNP markers for cacao germplasm identification. This is our pilot project for the development of SNP markers reflecting population origin for cacao germplasm identification. These SNP markers and the selected reference germplasm for different populations are suitable for use in cacao germplasm management and crop improvement, including genotype identification, seed gardens and nursery accreditation, and cocoa authentication. Effort is being continued with the emphasis on selecting SNP markers for the detection of sub-population structures in the primary gene pool of T. cacao.
-
Key words:
- SNP /
- Theobroma cacao L. /
- Population structure /
- Genetic groups