


-
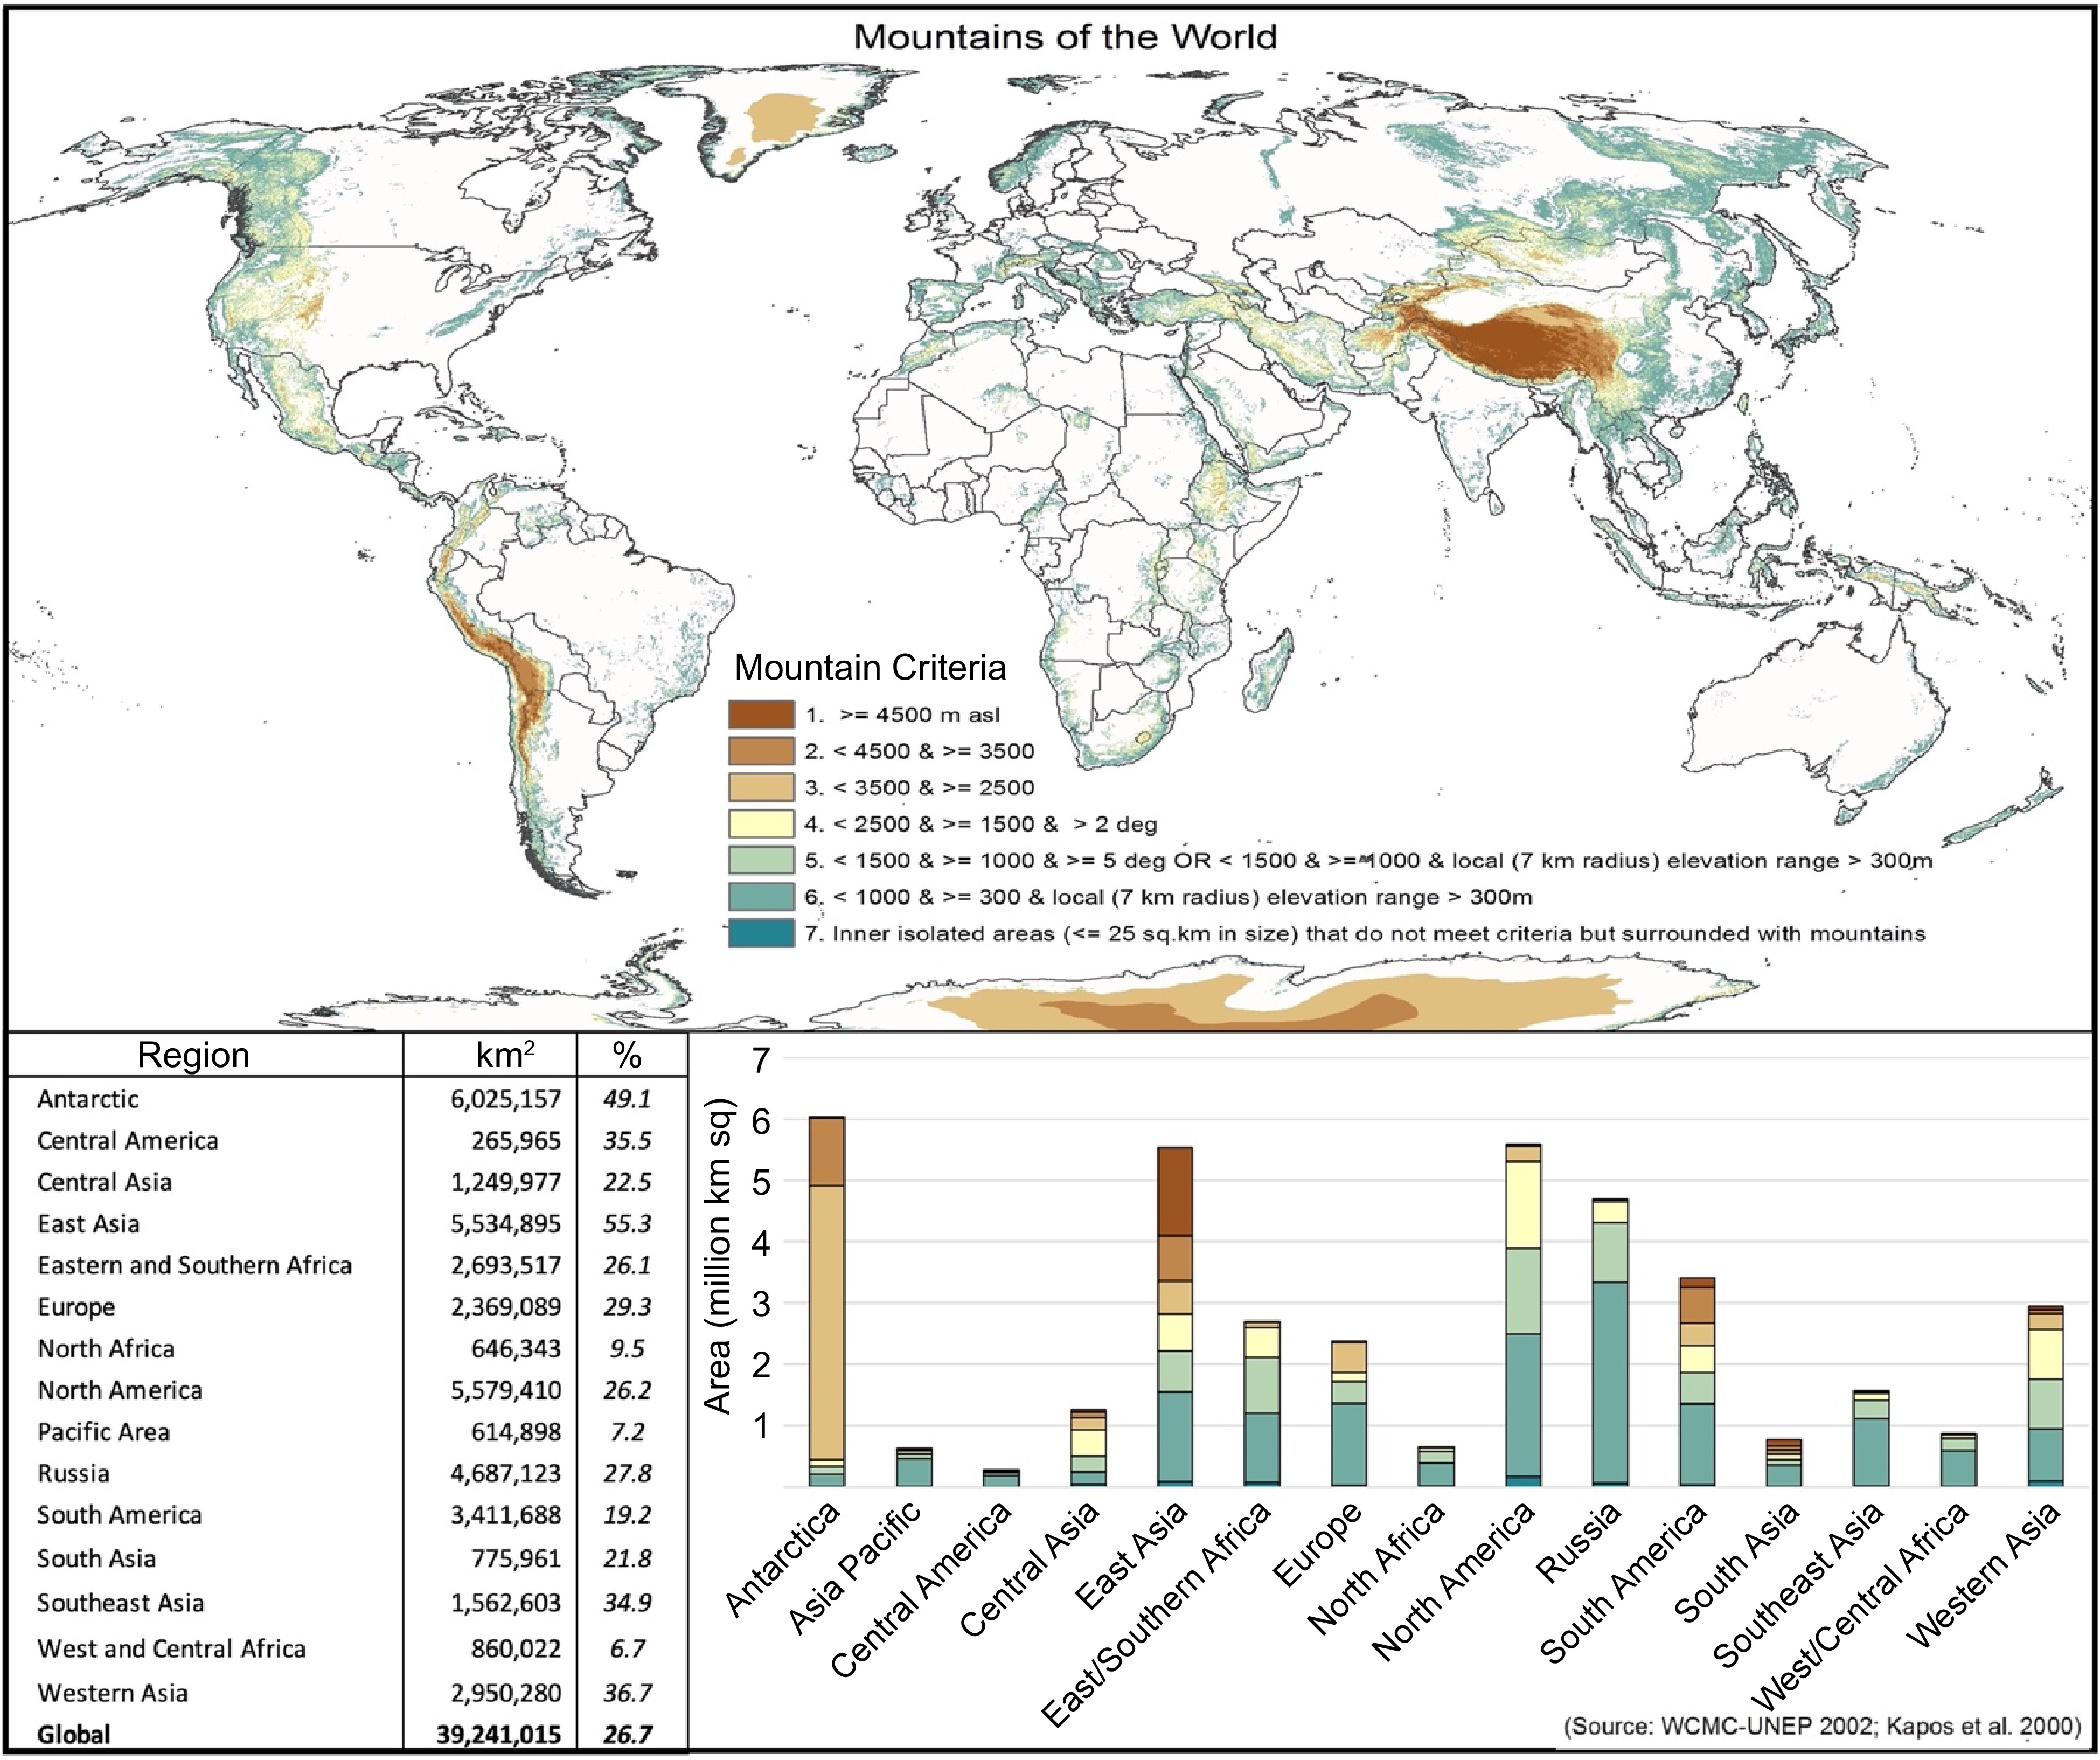
Mountains comprise approximately 26% of the world's land surface area and cover over 39 million km2 (Fig. 1). The global mountain population reached nearly 1.1 billion in 2017, accounting for 15% of the world's population, and increased by 89 million since 2012[1]. That increase added almost entirely (86 million) to the mountain population in developing countries, which reached one billion people in 2017. In addition, about half of humanity directly depends on mountain resources, primarily in the form of water[2,3]. Mountains provide 30%–60% of the fresh water downstream in humid parts of the world and provide 70%–95% in semi-arid and arid environments[4,5], in addition to the many goods and ecosystem services of local, regional, and global significance such as hydroelectricity, timber, mineral resources, recreation and tourism, flood management, and wildlife habitat. Mountains are home to around half of the world's 'biodiversity hotspots'—areas of particularly rich, unique, and threatened biodiversity—and about 30% of the world's 'key biodiversity areas', sites that contribute significantly to the global persistence of biodiversity[6,7]. Many of the important plant species that supply the world's food originated in the mountains, which still maintain high levels of genetic diversity for many crop species farmed and consumed worldwide. Mountain forests stretch over 9 million km2, representing 28% of the world's closed forest area, with almost 4 million km2 of mountain forests found above 1,000 meters[7], providing habitat for countless species, many of whom are threatened or endangered. Mountain forests are considered to be important terrestrial sinks of carbon dioxide[8,9]. These montane forests, woodlands and grasslands maintain and sequester substantial amounts of carbon, both as above and belowground biomass, and within mountain soils as soil organic carbon, much of it irrecoverable within any reasonable timeframe if lost through deforestation, conversion to agriculture, or otherwise degraded[10].
Carbon is a fundamental element in the structure and function of terrestrial ecosystems, while the carbon cycle[11] is central to, and an essential component of organic agriculture, circular agricultural systems, sustainable agro-ecosystem management, regenerative agriculture, and other natural climate solutions[12,13]. In the case of agricultural production, this can be seen as providing carbon inputs to offset carbon losses, and to maintain healthy soils and resilient ecosystem function[14]. High carbon density landscapes generally refer to old growth forests, deep prairie soils, or other long-term relatively undisturbed ecosystems where conditions have allowed for large amounts of carbon to be sequestered, for example, ancient forests in the Pacific northwest of North America, or the vast amounts of organic carbon stored in permafrost and in bogs under the circumpolar boreal forests[15]. Globally there is a generally positive relationship between carbon density and biodiversity[16]. Three key dimensions of ecosystem carbon stocks were described by Goldstein et al.[17] in 2020, and subsequently mapped by Noon et al.[18] in 2022, as relevant when considering prioritizing actions for climate mitigation: 1) Manageability: whether an ecosystem's carbon stock is affected primarily by direct human actions that either maintain, increase, or decrease its size (e.g., restoration or land conversion); 2) Magnitude of vulnerable carbon: carbon likely to be released to the atmosphere if the ecosystem is converted; 3) Recoverability of ecosystem carbon, if lost: the vulnerable carbon that could be recovered following a conversion event over a given timeframe. Ecosystem carbon stocks which have not recovered within that timeframe are considered as irrecoverable carbon. This is carbon lost to the atmosphere and not expected to be sequestered within the chosen timeframe, in this case, 30 years to align with the IPCC assessment of net zero emission by 2050. Goldstein et al.[17] found that at least 260 PgC of irrecoverable carbon, globally, is found within ecosystems highly affected by human land-use, with high carbon densities in peatlands, mangroves, old-growth forest and marshes. Since 2010, agriculture, logging and wildfire have caused emissions of at least 4.0 Gt of irrecoverable carbon, with the world's remaining 139.1 ± 443.6 Gt of irrecoverable carbon at risk from land-use conversion and climate change. Currently, 23.0% of irrecoverable carbon is within protected areas and 33.6% is managed by Indigenous peoples and local communities. Half of the Earth's irrecoverable carbon is concentrated on just 3.3% of its land, highlighting opportunities for targeted efforts to increase global climate security. However, mountains were not specifically addressed as distinct eco-geographic regions other than to notably point out the long recovery period (205 years) for converted montane grasslands. Using data provided by Noon et al.[18], manageable, vulnerable and irrecoverable carbon were mapped, analyzed, and tabularly articulated specifically for mountainous regions using the UNEP WCMC 'Mountains of the World'[4,5] delineation.
In an effort to understand and quantify the role of multifunctional agroforestry systems, and the potential for increasing tree cover in mountains and for protecting irrecoverable carbon by providing sustainable, biodiversity friendly, livelihood options for local mountain communities, through creating community forests, conservation buffer zones, connectivity corridors, or ecotourism, data and results from Zomer et al.[19,20] were used to map and quantify the above- and below-ground biomass carbon on mountain agricultural land. The potential for, and mitigation benefit of increasing tree cover within mountain agricultural systems was modelled and estimated, in terms of above- and below-ground biomass carbon, under several scenarios:
(1) Incremental change: from current practices, i.e., increasing tree cover within the existing or a slightly modified mountain agricultural system. These interventions increase tree cover within the agricultural landscape while not significantly changing existing agricultural practices;
(2) Systemic change: evaluates the benefits associated with a more substantial shift to agroforestry systems and approaches which incorporate trees as a core component of the agricultural production system, either at the field level, or within agricultural landscapes more generally.
The rapid onset of climate change impacts, particularly evident within mountainous regions[7,21−23], and a growing recognition of the importance of the landuse sector within proposed global adaptation and mitigation efforts[24,25] has brought agroforestry systems and the role of trees to the forefront of discussions in an array of international forums and development efforts. This emerging awareness of the relevance of agroforestry and increased tree cover on agricultural land to the climate change agenda[26−30] is evident in the global recognition of the need for transformative change in land management and food production systems[31−33]. Agroforestry and increased tree cover on agricultural land are widely seen as pathways to improved agricultural production systems[24,31] that reduce carbon emissions, sequester additional carbon, and minimize the environmental impact of agricultural production[34], with multiple environmental, ecological, and socio-economic benefits, while potentially contributing to at least nine of the 17 SDGs[35]. This paper explores and quantifies the mitigation potential and limits of increased tree cover in mountain agricultural systems and their role in protection of irrecoverable carbon, biodiversity, ecosystems, and ecosystem services in mountains.
-
The geospatial analysis was performed in ArcGIS v.11.1, using ArcPy, and programmed in Python programming language. All administrative boundaries, including continents, regions, and shorelines, were delineated using the GADM Global Administrative Areas Database, v.3.4[36]. Mountainous areas were by delineated as per the 'Mountains of the World' dataset provided by UNEP-WCMC[5]. Seven categories of mountain are provided, classified based upon the UNEP-WCMC definitions[4,5]:
1. elevation ≥ 4,500 meters
2. elevation < 4,500 & elevation ≥ 3,500
3. elevation < 3,500 & elevation ≥ 2,500
4. elevation < 2,500 & elevation ≥ 1,500 & slope > 2 degree
5. elevation < 1,500 & elevation ≥ 1,000 & slope ≥ 5 degree OR elevation < 1,500 & elevation ≥ 1,000 & local (7 km radius) elevation range > 300 meters
6. elevation < 1,000 & elevation ≥ 300 & local (7 km radius) elevation range > 300 meters
7. inner isolated areas (≤ 25 km2 in size) that do not meet criteria but surrounded with mountains
Estimates of manageable, vulnerable and irrecoverable carbon in mountains
-
Manageable, vulnerable, and irrecoverable carbon[17,18] within mountainous areas were mapped and analyzed using carbon density data provided by Noon et al.[18]. Mountainous areas were delineated and extracted using the UNEP-WCMC 'Mountains of the World' dataset, and further analyzed to produce a mountain-specific geospatial dataset and associated descriptive statistics.
Vulnerable and irrecoverable carbon are both subsets of manageable carbon. Manageable carbon is defined to be the carbon in natural ecosystems (mangroves, salt marsh, seagrass, forests, wetlands, peatlands, and grasslands) that are directly affected by anthropogenic land use. Manageable carbon:
• Excludes forest plantations, where carbon is lost through production cycles, e.g., tree/timber harvesting.
• Excludes built up/urban areas, as a 'non-natural' land cover type.
• Excludes bare areas, as a 'non-natural' land cover type.
• Excludes boreal permafrost and polar regions, where carbon is lost from climate change.
• Excludes agricultural areas, as a 'non-natural' land cover type.
Assessment of tree cover on mountain agricultural land
-
A publicly available global analysis of tree cover which used a MODIS 250 m resolution satellite remote sensing dataset from 2000 to 2010[37] was combined with the GLC 2000 database[38] to extract values from only specified agricultural landuse classes. Detailed methods and results for this analysis are available online in two working paper reports[39,40] , as is the geospatial dataset of global tree cover on agricultural land, and biomass carbon:
www.worldagroforestry.org/global-tree-cover/index.html . Three agricultural land use types from the Global Land Cover 2000 database were included in our 'Agricultural Land' class:• Cultivated and Managed Areas (agriculture — intensive)
• Cropland/Other Natural Vegetation (non-trees: mosaic agriculture/degraded vegetation)
• Cropland/Tree Cover Mosaic (agriculture/degraded forest)
The diversity of both the heterogenous terrain and mountain agricultural systems suggest that a variety of mountain agricultural production systems, including home gardens, silvo-pastoral and other mosaic landuse types scattered within the agricultural landscape matrix are not fully accounted for.
Estimates of biomass carbon in mountains
-
The 'Global Aboveground and Belowground Biomass Carbon Density Maps for the Year 2010' dataset produced by Spawn & Gibbs and Spawn et al.[41,42] were clipped using the WMC Mountain database, to give a global Tier-1 spatial mapping and tabulation, of biomass carbon on mountain agricultural land for the year 2010 at a resolution of 1 km2.
To geospatially assess the potential for biomass increases on mountain agricultural land we used the dataset and methodology produced and described in detail by Zomer et al.[19,20]. This dataset was produced using remote-sensing based analysis of tree cover on agricultural land[37,39,40] combined with IPCC Tier 1 default estimates for above- and below-ground carbon stocks articulated for a variety of land cover types across a range of eco-floristic zones[43−45].
The primary geospatial datasets used in both the previous global analysis of biomass carbon on agricultural land, and this current study, were:
• MOD44B MODIS Vegetation Continuous Field - Collection 5 (2000-2010): Percent Tree Cover[37]
• Global Land Cover 2000 (GLC 2000) Database[38]
• New IPCC Tier-1 Global Biomass Carbon Map for the Year 2000[43]
• Global Aboveground and Belowground Biomass Carbon Density Maps for the Year 2010[41,42]
• Aridity Index and Potential Evapotranspiration (ET0) Database[46−48]
Global IPCC Tier 1 biomass carbon estimates
-
Tier 1 global estimates of biomass carbon were extracted from the 'Global Aboveground and Belowground Biomass Carbon Density Maps for the Year 2010'[41,42]. Following the guidelines of the IPCC for National Greenhouse Gas Inventories[44,45], Ruesch & Gibbs identified a relatively low value (5 tC·ha−1) for agricultural land, which was applied uniformly and globally for Tier 1 estimates within the 'Global Biomass Carbon Map for the Year 2000' dataset[43]. To account for the added contribution of tree cover on agricultural land, Zomer et al.[19] used the default Tier 1 biomass carbon value for agricultural land (5 tC·ha−1) as the baseline value, i.e., at 0% tree cover the biomass carbon is 5 tC·ha−1 (in all carbon zones). This map is stratified into 124 'carbon zones' based on FAO eco-floristic zones and which continent that zone is found. The carbon value calculated for each GLC_2000 land use class in each of those zones was used to model our estimates of above- and below-ground biomass. The biomass carbon value of the GLC_2000 Mixed Forest class (or similar class in case this class is not present) in that same carbon zone was used as a surrogate biomass carbon value where there is full tree cover on agricultural land (i.e, tree cover percentage = 100). A linear increase in biomass carbon from 0 to 100 percent tree cover is assumed where within a specific grid cell and within a specific carbon zone:
• Biomass carbon is equal to the default Tier 1 value for agricultural land (5 tC·ha−1) when there are no trees on that land, i.e, tree cover = 0%).
• There is an incremental linear increase of tC·ha−1 proportionally as tree cover increases from the baseline (5 tC·ha−1 at 0% tree cover) up to the maximum value for Mixed Forest in that specific carbon zone, i.e, biomass carbon values on agricultural land with 100% tree cover are equal to the related Mixed Forest class. However, no grid cells exceeded 86% tree cover.
Results were tabulated and mapped globally, by global region, and by country.
Scenario modelling
-
Two landuse systems change scenarios were modelled:
1) The first scenario describes an incremental change from current practices on agricultural land, increasing tree cover within the existing or a slightly modified agricultural system. For example, adding trees on the border of fields, along roadways and canals, or within conservation easements but not fundamentally altering the agricultural system through the introduction of a tree component.
Two hypothetical subsets of the first scenario we're evaluated:
a) An increase in tree cover by 10% on all area below the median tree cover value. Areas less than 10% below the median tree cover increase up to the median value;
b) An increase of tree cover to the median value on all area below the median tree cover value. All areas less than median tree cover increase up to the median value, and all other tree cover values remain the same.
To evaluate the median and percentile of tree cover on agricultural land within regionally relevant and ecologically feasible bioclimatic and ecofloristic conditions, the carbon zones described above, based upon the 124 FAO ecofloristic zones, were further stratified by five aridity index zones[46,47], giving a total 495 unique strata globally. Above- and below-ground carbon values were then calculated, as described above based upon a prescribed increase in tree cover, using the scenario-based tree cover percentage values for each of the 495 unique carbon/aridity zones, geospatially articulated for all global terrestrial regions.
2) The second scenario proposes a more substantial shift to an agroforestry landuse system, or agroforestry approaches which incorporate trees as a core component of the agricultural production system. To describe the potential range of above- and below-ground biomass carbon increase with a shift to more agroforestry-type production practices, two approaches were used:
a) The increase in biomass carbon was evaluated along a range of increased tree cover percentages, i.e, a specified percentage over the current existing tree cover (2010) on that land, up to 10%, for all agricultural area, and calculated based upon carbon zone parameters particular to the geospatial location of that respective land area;
b) The increase in biomass carbon was evaluated along a range of tree cover percentiles, as calculated within the respective carbon zone stratified by the aridity zones of the respective land area.
Results were tabulated and mapped for all mountain regions, globally, by global region, and by country. Full tabular results are provided in the Supplemental Tables S1−S4.
-
Based on the 'Mountains of the World' dataset, there are ~39 million km2 of mountainous area globally (Fig. 1). Although Antarctica has by far the most mountainous area (~6 million km2), with more than 49% of the continent classified as mountains, we do not consider it further in this analysis. East Asia (with more than 55% of total area mountainous) and North America (with over 26%), each have over 5.5 million km2 of mountains. Other substantial areas of mountains are found in Russia (~28% of total area; almost 4.7 million km2), South America (19 % of total area, ~3.4 million km2), and Western Asia ~37% of total area; ~3 million km2). West and Central Africa (6.7% of total area; ~860,000 km2), the Asia Pacific region (7.2% of total area; ~614,000 km2), and North Africa (9.5% of total area; ~646,000 km2) all have relatively less mountainous area. Southeast Asia, with more than 1.5 million km2, is comprised of almost 35% mountainous area. Europe has nearly 2.7 million km2 of mountains comprising more than 29% of its total area.
Manageable, vulnerable and irrecoverable carbon in mountains
-
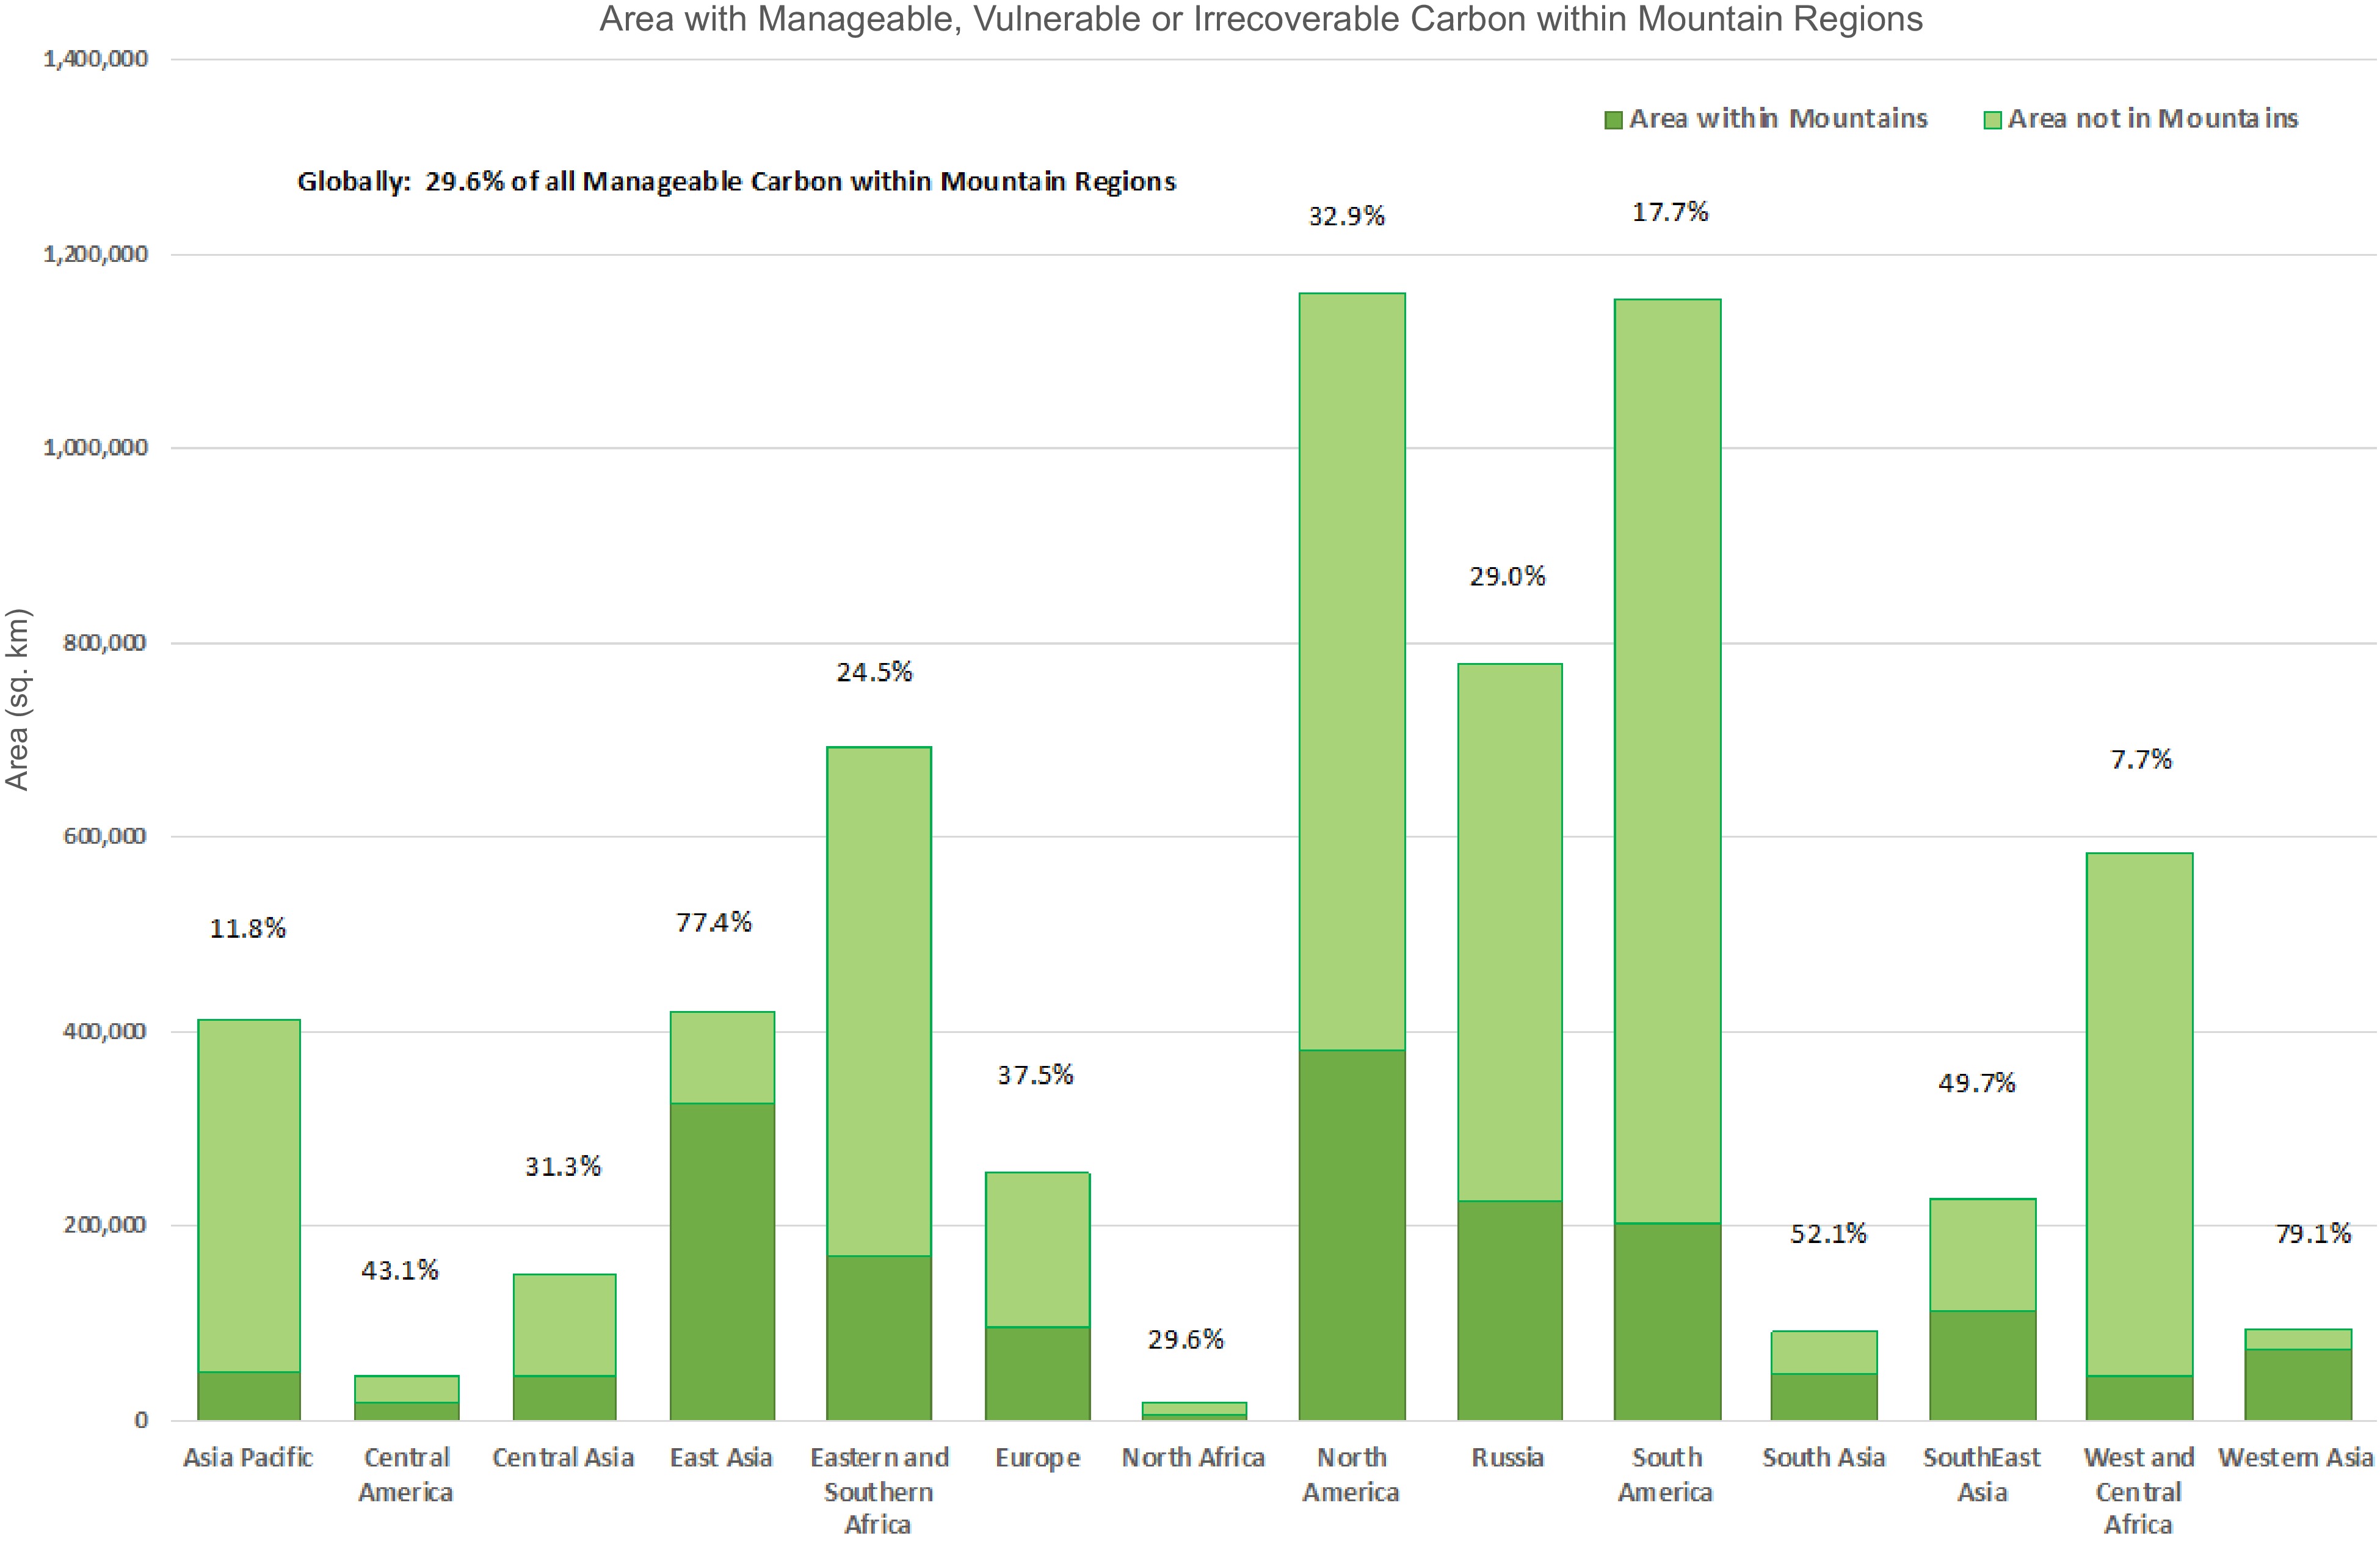
North America, South America and Russia had the most geographic area of total manageable, vulnerable, or irrecoverable carbon, with 33%, 17%, and 29% of their total area with manageable carbon found within mountains (Fig. 2). Globally, by area, 30% of all manageable carbon (which includes vulnerable and irrecoverable carbon), is found in mountains (Fig. 3; Supplemental Tables S1 & S2). More than 79% of the area with manageable carbon in Western Asia, and 77% in East Asia is found in mountains, while in South Asia it is more than 52 %, and almost 48% in Central America. Europe had almost 38% of all its manageable carbon by area within mountains. Only West and Central Africa has less than 10% of their total area within mountains, while South America has less than 18%. Noon et al.[18] found that globally, 75% of all irrecoverable carbon was found on just 7.5% of all Earth's land area, while 50% is found on a meagre 3.3%.
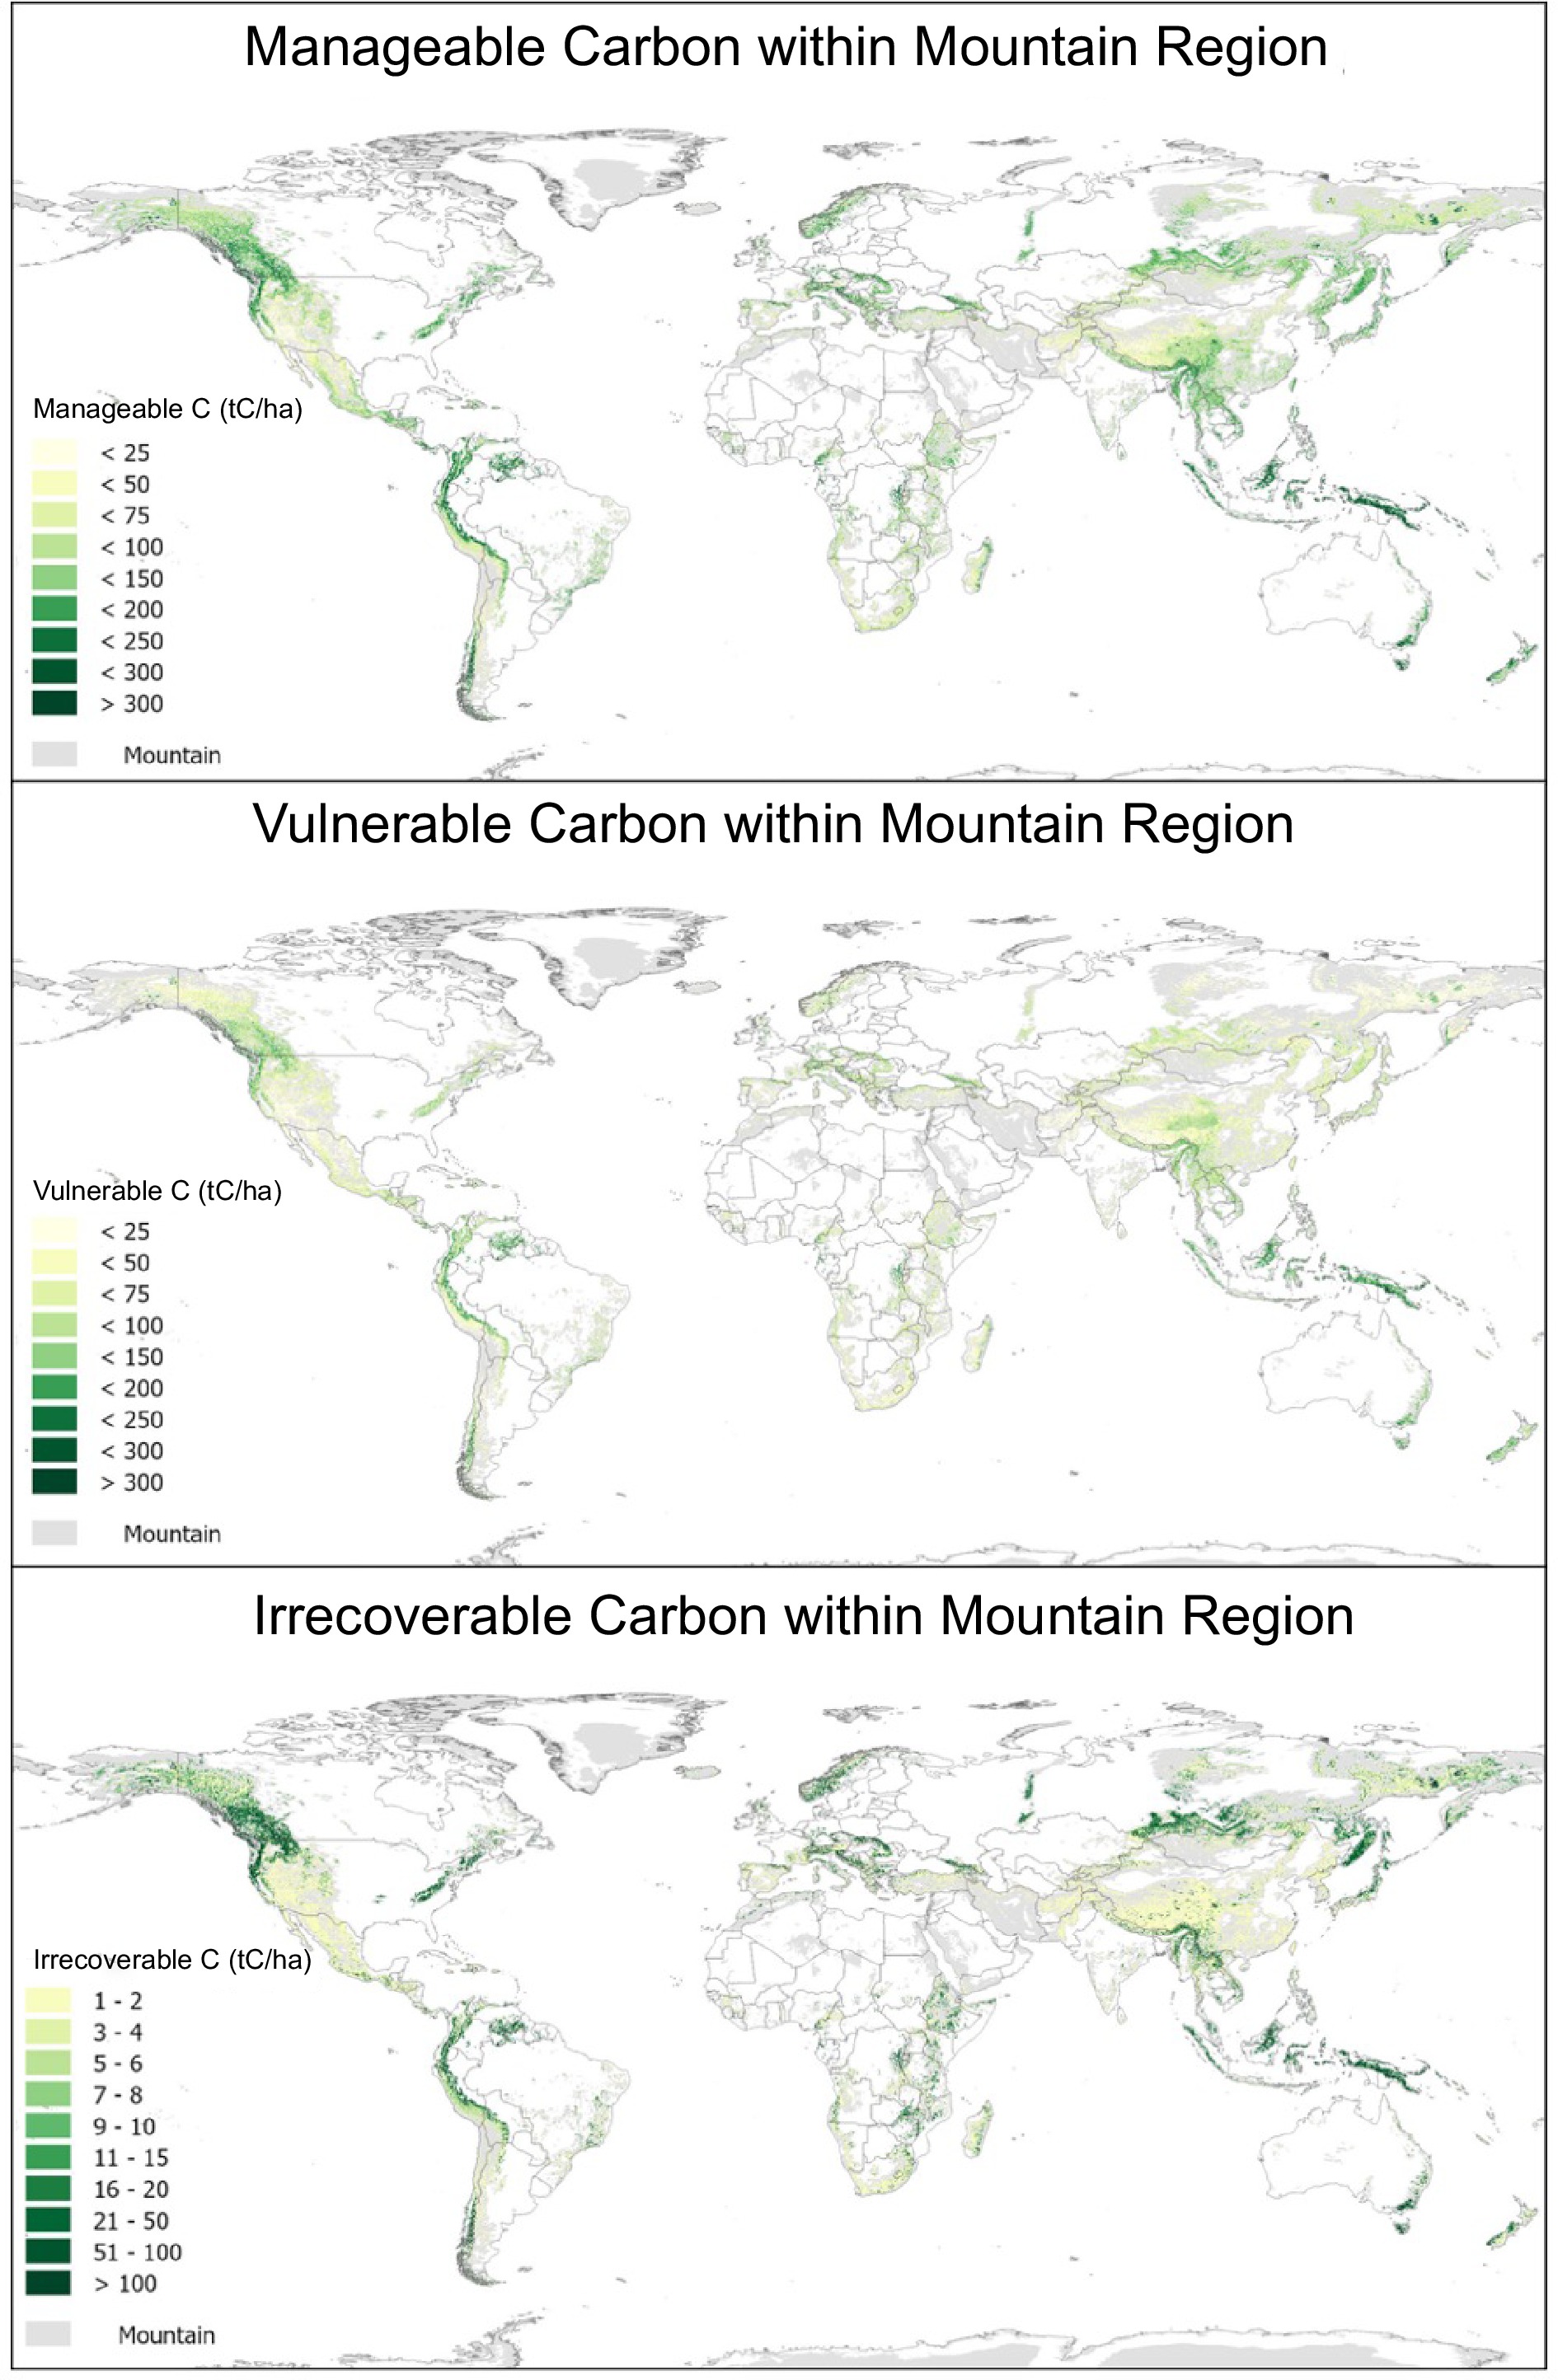
Figure 2.
Manageable, vulnerable, and irrecoverable carbon with mountainous regions, in tons of carbon per hectare (tC·ha−1), as per the year 2018[18].
The global map of total manageable carbon produced by Noon et al.[18], which includes marine environments beyond continental shorelines as delineated by administrative boundaries, estimates 731.7 ± 340.2 PgC. When using only terrestrial area and administrative boundaries, we found this to be 725.8 PgC, with 208.1 PgC (28.7%) of all terrestrial manageable carbon found in mountains (Fig. 4; Table 1). South America (179 PgC), North America (123 PgC) and Russia (117 PgC) had the largest quantity of total manageable carbon globally, as well the largest quantities of carbon in mountain areas, with over 40 PgC in North America, and over 28 PgC in South America, Russia, and East Asia located in mountains. East Asia (87%) and Western Asia (80%) both have much of their total manageable carbon in mountains, while South Asia (64%), North Africa (53%), Southeast Asia (48%), all have nearly half or more of their manageable carbon in mountains. Europe has a relatively modest amount of manageable (10.9 PgC) with 33% in mountains. Of the 752 PgC of manageable carbon globally, 460 PgC (27%) is classified as vulnerable, with 122 PgC (27%) found in mountains. South America (135 PgC) has the greatest amount of vulnerable carbon generally. Western Asia (86%), East Asia (81%), South Asia (64%), and North Africa (55%) all had a large proportion of their total vulnerable carbon in mountains.
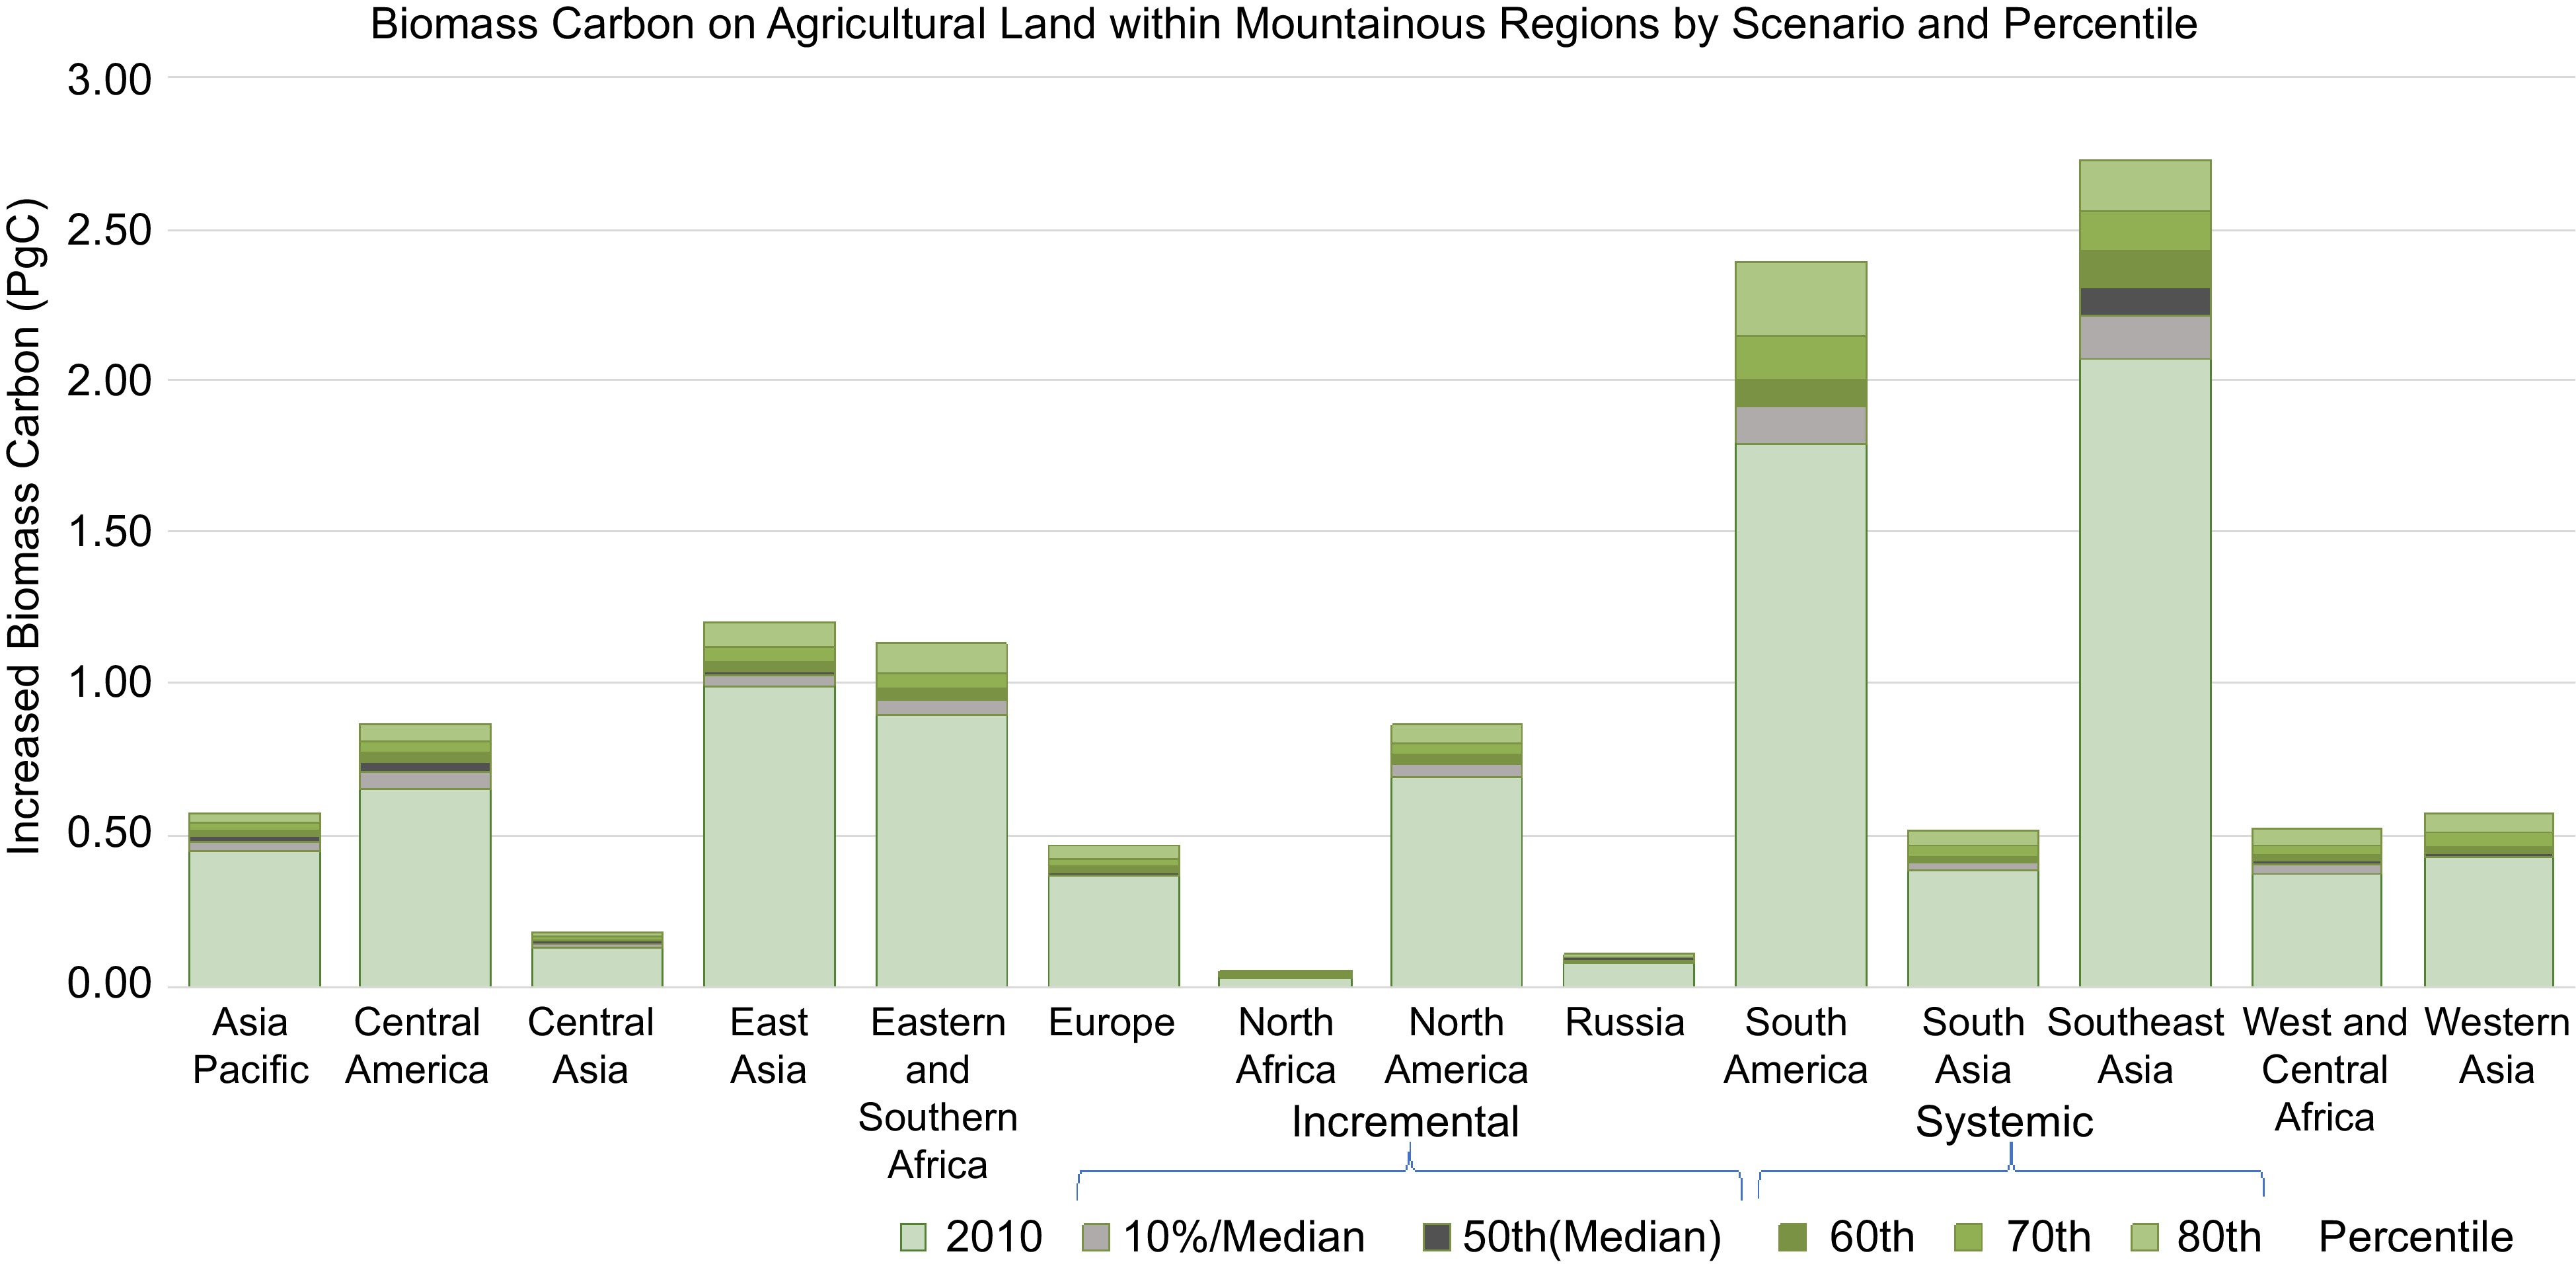
Figure 4.
Biomass carbon on agricultural land with mountainous regions, by scenarios. Incremental change represented by two subsets of the first scenario: a) 10% increase in tree cover on all land under the median (50th percentile) for each respective strata (n = 495), and b) increase of all land under the median up to the median. A systemic transformative change to a agroforestry type system incorporating increased tree cover as a core production component is represented by a range of percentiles (60th−80th) of tree cover for each respective strata, with the 70th percentile assumed as an ecologically reasonable and attainable adoption level[5, 20, 41].
Table 1. Irrecoverable, manageable, and vulnerable carbon (Pg C) globally, and as found within each of the respective mountain regions, and as a percentage (%) of the total carbon in each of the three categories of carbon found within each region[4,5,18].
Region Manageable carbon Vulnerable carbon lrrecoverable carbon PgC % PgC % PgC % Asia Pacific 10.99 29.60 7.99 33.04 3.60 47.75 Central America 2.79 43.40 1.65 40.97 0.13 18.57 Central Asia 3.58 41.50 2.82 36.98 0.22 68.75 East Asia 28.03 80.86 17.50 80.79 1.38 72.63 Eastern and Southern Africa 15.78 29.12 9.84 28.08 1.98 35.74 Europe 10.86 33.00 6.14 32.00 2.33 32.45 North Africa 0.52 53.15 0.33 55.70 0.09 69.23 North America 40.66 32.92 22.08 33.43 6.85 35.38 Russia 28.21 24.02 10.90 20.77 4.91 15.52 South America 28.65 15.97 18.18 13.49 4.64 12.00 South Asia 5.68 64.36 3.42 64.40 0.47 61.84 Southeast Asia 21.59 48.62 14.86 44.83 3.72 32.86 West and Central Africa 5.84 8.16 3.90 7.37 0.61 5.33 Western Asia 4.89 86.14 2.55 86.00 0.25 80.65 Global 208.07 28.67 122.17 26.56 31.18 22.79 Noon et al.[17,18]. found 139 ± 443 PgC of irrecoverable carbon globally when including coastal marine ecosystems, representing about 20% of total manageable carbon, with 57% (79 PgC) found in biomass, and 43% (60 PgC) in soils. Almost all that irrecoverable carbon is found on land (136 PgC), with almost 23% (31.2 PgC) of total global irrecoverable carbon found in mountains (Fig. 4). North America (6.85 PgC), Russia (4.91 PgC), South America (4.64 PgC), and Southeast Asia (3.72 PgC) had the largest quantities of irrecoverable carbon in mountains, while Europe had a more modest but still substantial 2.3 PgC, more than 32% of which is found in mountains. Western Asia (86%), East Asia (73%), North Africa (69%) Central Asia (69%), and South Asia (62%) had the largest percent of their total irrecoverable carbon in mountains.
Although the Noon et al. manageable carbon analysis[17,18] explicitly excludes agricultural areas, we found substantial overlap between the spatial distribution of manageable carbon and the delineation of agricultural land used in our analysis (Supplemental Tables S3 & S4), likely a reflection of differing definitions for agricultural landuse categories used in our respective analyses. Globally, almost 19 PgC of manageable carbon was found on agricultural land in mountains, representing 2.6% of total global manageable carbon, and 9% of all the manageable carbon found in mountains. Likewise, 7% of all irrecoverable carbon found in mountains, is on agricultural land.
Tree cover and biomass carbon in mountain agricultural systems
-
Globally, mountain agricultural systems account for at least 3.67 million km2 of land in mountains (Fig. 5). East and Southern Africa (605,000 km2), South America (501,000 km2), East Asia (490,000 km2), and Western Asia (476,000 km2) have the largest area of agricultural land in mountains. Agricultural land in mountains was found to have more than 19% tree cover globally in 2000, which increased by 1.1% to 20.3% by the year 2010 (Table 2). The Asia Pacific region (4.1%) had the largest increase, with several regions including West and Central Africa, North America, Central Asia, and East and Southern Africa showing decreases in tree cover on mountain agricultural land, while Europe, with 16.7% tree cover increased by 2.1% over the decade.
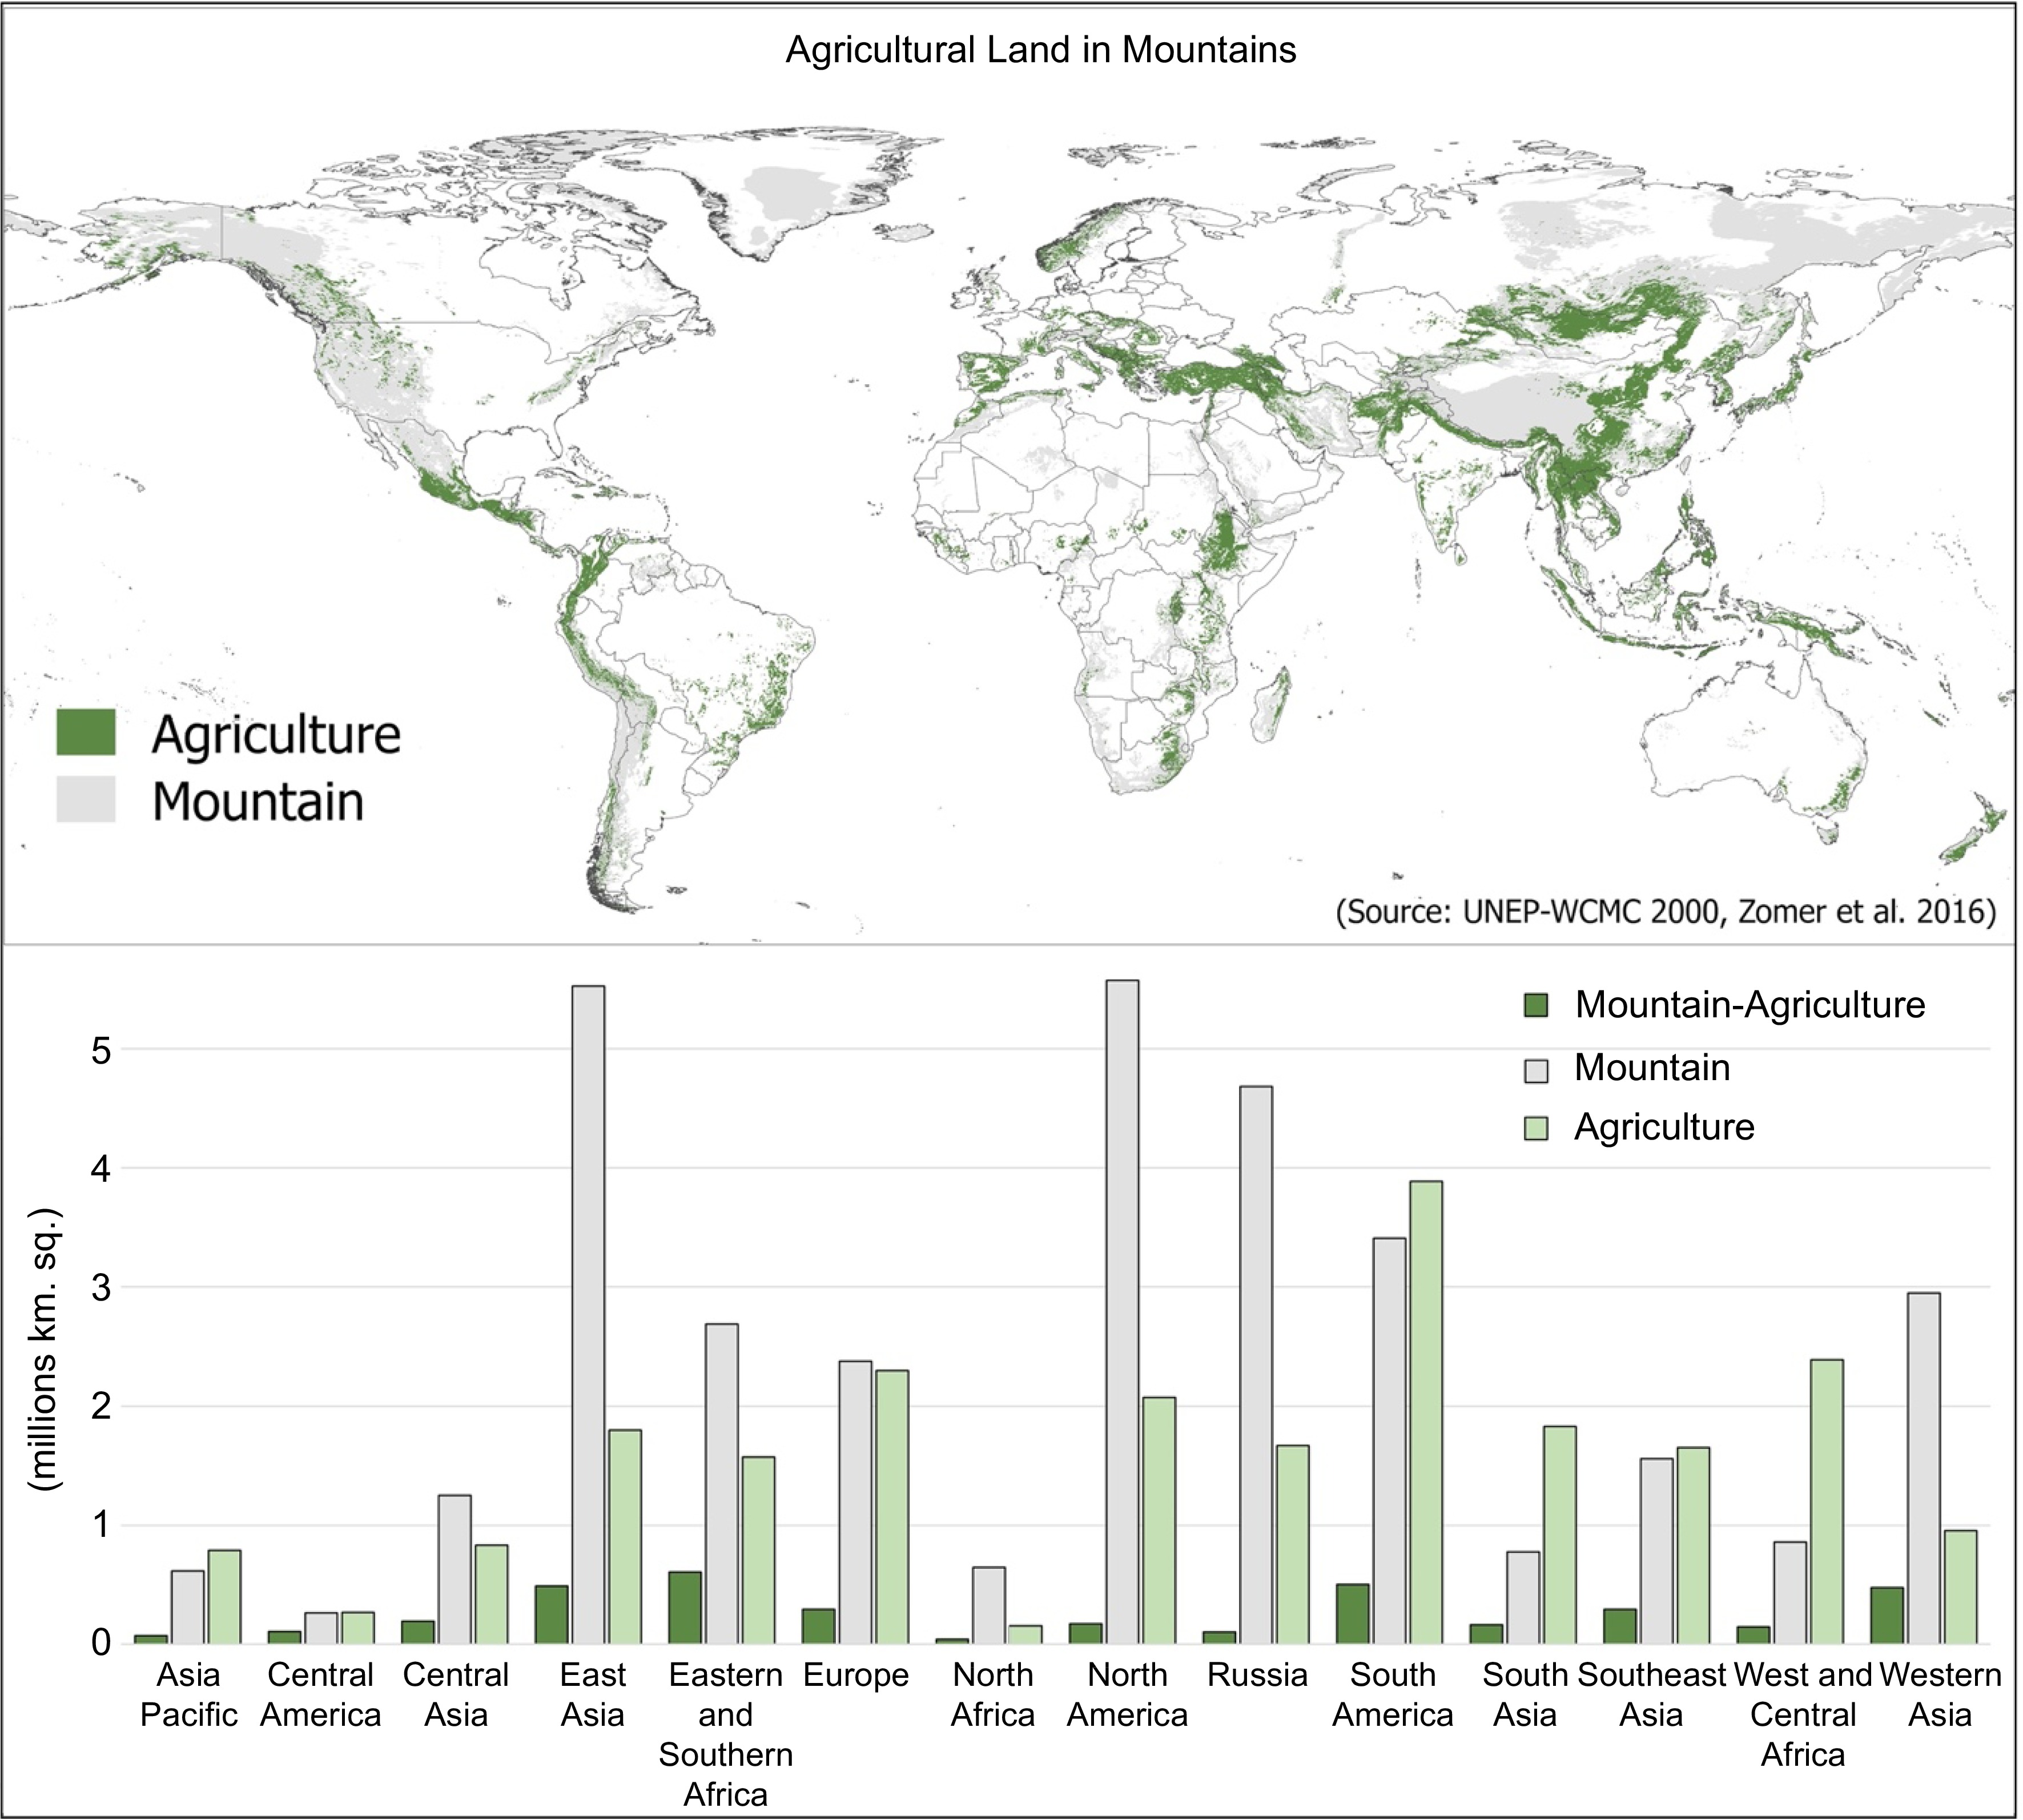
Table 2. Mean tree cover (%) by percentile for all agricultural land globally, and within in the various mountainous regions. All land below the specified percentile threshold comes up to that level of adoption (percentile), and land already above the specified percentile remains as is[5,20].
Region Mean percent tree cover (%) Area (km2) 2000 2010 Change 50th 60th 70th 80th Asia Pacific 28.4 32.5 4.1 36.3 38.0 40.1 42.9 71,989 Central America 36.1 38.4 2.3 43.4 45.4 47.9 51.7 105,827 Central Asia 5.6 5.4 −0.3 6.4 7.0 8.0 9.6 194.908 East Asia 18.1 20.9 2.8 22.2 23.1 24.8 27.4 490,326 Eastern and Southern Africa 11.9 11.7 −0.2 12.8 13.4 14.3 16.2 605,705 Europe 14.6 16.7 2.1 18.1 19.2 20.8 23.7 294,482 North Africa 2.5 3.3 0.8 3.6 3.6 4.1 5.5 43,300 North America 30.2 29.6 −0.5 32.3 33.7 35.8 39.0 173,494 Russia 14.6 15 0.4 16.8 17.8 19.4 22.1 105,035 South America 23.5 26 2.5 28.3 29.9 32.5 36.9 501,408 South Asia 20.1 21.3 1.2 23.7 25.2 27.7 31.6 163,323 Southeast Asia 42.8 43.6 0.8 48.1 50.4 53.2 56.8 293,696 West and Central Africa 14.9 14 −1.0 15.4 16.3 17.7 20.5 147,633 Western Asia 5.5 6.3 0.8 7.4 8.0 9.0 11.0 476,485 Global 19.2 20.3 1.1 21.3 22.4 24.1 26.9 3,667,611 An increase in tree cover to the median (50th percentile) tree cover in each respective carbon / ecofloristic zone would bring the average tree cover up to 21.3%, while adoption at the 70th percentile would represent an average tree cover of 24.1%. Adoption at the 80th percentile would bring it up to almost 27%.
Just over 8.9 PgC of above- and below-ground biomass was found on mountain agricultural land in 2000, which increased by 4.6% (0.43 PgC) to 9.34 PgC by the year 2010 (Table 3). Southeast Asia (2.1 PgC), South America (1.79 PgC), East Asia (1.0 PgC) and East and Southern Africa (0.9 PgC) had the most biomass carbon on agricultural land with mountainous areas in 2010, with South America, East Asia, and Southeast Asia seeing the largest decadal increases.
Table 3. Biomass carbon on agricultural land within mountainous regions, by scenarios. Incremental change represented by two subsets of the first scenario: a) 10% increase in tree cover on all land under the median (50th percentile) for each respective strata (n = 495), and b) increase of all land under the median up to the median. A systemic transformative change to a agroforestry type system incorporating increased tree cover as a core production component is represented by a range of percentiles (60th−80th) of tree cover for each respective strata, with the 70th percentile assumed as an ecologically reasonable and attainable adoption level[5,20,41].
Region Increase in biomass carbon by scenario and percentile (PgC) Biomass carbon (PgC) Incremental Systemic 2000 2010 10%/Median Median (50th) 60th 70th 80th Asia Pacific 0.4 0.45 0.48 0.49 0.52 0.54 0.57 Central America 0.63 6.6 0.71 0.74 0.77 0.81 0.87 Central Asia 0.13 0.13 0.14 0.14 0.14 0.15 0.16 East Asia 0.89 0.99 1.03 1.03 1.06 1.11 1.19 Eastern and Southern Africa 0.9 0.9 0.94 0.95 0.98 1.02 1.12 Europe 0.34 0.37 0.37 0.38 0.40 0.43 0.47 North Africa 0.03 0.03 0.03 0.03 0.03 0.03 0.04 North America 0.7 0.69 0.73 0.73 0.76 0.80 0.86 Russia 0.08 0.08 0.08 0.08 0.09 0.09 0.10 South America 1.65 1.79 1.91 1.92 2.00 2.15 2.39 South Asia 0.37 0.38 0.41 0.41 0.43 0.46 0.52 Southeast Asia 2 2.07 2.21 2.31 2.42 2.56 2.73 West and Central Africa 0.39 0.37 0.41 0.4 0.42 0.45 0.51 Western Asia 0.41 0.43 0.39 0.4 0.42 0.47 0.53 Increased Biomass Carbon / 0.43 0.52 0.67 1.10 1.73 2.71 Total Biomass Carbon 8.91 9.34 9.86 10.01 10.44 11.07 12.05 Increasing biomass carbon in mountain agricultural systems
-
An estimate of 'potential tree cover' was found by assuming that for a given carbon/aridity zone combination (n = 495), the 2010 distribution of tree cover in agricultural land represents feasible or viable systems. While the maximum tree cover that occurs in those conditions could be taken as a maximum technical potential, this maximum probably occurs in a very small area and represents some unusual set of circumstances. Therefore, we look across the range of the distribution (by percentiles) of tree cover within the respective stratum as presenting potential values that can be attained under the prevalent biophysical conditions, as per the two scenarios[39]. For example, if the 70th percentile is chosen as the potential tree cover, only 30% of the agricultural area within each respective carbon/aridity zone exceeds this tree cover value, i.e, already has 'above potential' tree cover. This paper assumes that this is within an attainable range of tree cover levels, consistent with the systemic production change scenario, i.e., with widespread adoption of agroforestry type practices. A range of outcomes were examined at various percentile levels to illustrate results of various adoption and tree cover increase scenarios. A limited set of results, from the 50th percentile (i.e., the median) to the 80th percentile are presented, to maintain realistic and ecologically feasible expectations, but to also illustrate the potential range under higher levels of adoption.
In the first scenario, an incremental change from current practices, i.e., increasing tree cover by no more than 10% in areas that are currently below median tree cover for their respective bioclimatic or ecological zone, would increase biomass carbon in mountain agricultural systems globally by 0.52 PgC, or about 5%, whereas adoption at the median (50th percentile) would increase it globally by more than 7% (Table 3). Since potential carbon benefit of this incremental change is evaluated based upon the median tree cover found within each of the 124 ecofloristic zones, further stratified by five aridity zones, i.e., the median tree cover within each of 495 bioclimatic strata delineated globally, we presume this very modest change is easily achievable and limited to areas where it should be ecologically, and perhaps, by extension, socio-economically reasonable to plant trees. Regions showing relatively higher potential mitigation benefits from incrementally increasing tree cover to the median level on mountain agricultural land include Southeast Asia (0.23 PgC), South America (0.13 PgC), and Central America (0.08 PgC), with most regions showing modest sequestration potential at or below (0.5 PgC).
We assume an adoption rate which brings tree cover within an ecofloristic carbon strata to the 70th percentile signifies an attainable systemic change of the production system, such as wide-scale adoption of agroforestry, and/or modifications in landscape management and other practices which systematically incorporate increased tree cover with the agricultural landscape, e.g., for conservation easements, habitat management, riparian restoration, or watershed management, If the global adoption rate was at the 70th percentile, global biomass carbon in mountain agricultural systems would increase by 1.7 PgC, or 18.5%, to a total of 11.1 PgC. At the more ambitious 80th percentile level, more than12 PgC would be sequestered within the tree component of agricultural landscapes. Central America (23.7%), Southeast Asia (23.6%), Asia Pacific (20.9%), West and Central Africal (20.8%), and South Asia (20.7%) all show high relative increases in carbon biomass on mountain agricultural land at 70th percentile adoption level. Increasing tree cover by 1% per year for 10 years, globally, on all mountain agricultural land would sequester 3.0 PgC over the decade (Table 4). Countries with the highest potential to sequester biomass carbon by increasing tree cover 1% per year for ten years include China (0.92), Brazil (0.77), Ethiopia (0.20 PgC), and Indonesia (0.19 PgC).
Table 4. Biomass carbon in 2010 (PgC), and potential increase in biomass carbon (PgC) on agricultural land within mountainous regions resulting from a 1% increase in tree cover, or shown as a 1% increase in tree cover per year for 10 years (10%), globally, by region, and by the top countries showing the highest potential biomass increase[5,20,41].
Increased biomass carbon (PgC) 2010 1% 10% Region Asia Pacific 0.45 0.01 0.11 Central America 0.66 0.02 0.16 Central Asia 0.13 0.01 0.07 East Asia 0.99 0.03 0.31 Eastern and Southern Africa 0.9 0.04 0.44 Europe 0.37 0.01 0.15 North Africa 0.03 0.00 0.03 North America 0.69 0.02 0.18 Russia 0.08 0.00 0.02 South America 1.79 0.06 0.57 South Asia 0.38 0.01 0.13 Southeast Asia 2.07 0.05 0.44 West and Central Africa 0.37 0.02 0.15 Western Asia 0.43 0.03 0.31 Global 9.34 0.31 3.07 Country China 0.918 0.030 0.297 Brazil 0.769 0.031 0.290 Ethiopia 0.410 0.021 0.208 Indonesia 0.885 0.021 0.185 Mexico 0.637 0.018 0.168 Turkey 0.206 0.015 0.143 Colombia 0.535 0.014 0.138 Philippines 0.434 0.009 0.104 India 0.251 0.009 0.098 Spain 0.078 0.006 0.059 Papua New Guinea 0.301 0.008 0.057 Afghanistan 0.047 0.006 0.057 Mongolia 0.090 0.005 0.049 Peru 0.116 0.005 0.047 lran 0.051 0.005 0.047 Madagascar 0.178 0.004 0.044 Honduras 0.168 0.005 0.040 -
As our results show, 30% of the area mapped as manageable carbon globally is in mountains, underscoring their vital importance in biodiversity conservation and climate change mitigation[21,49−51]. With nearly 29% of the world's manageable carbon in terms of gigatons (PgC), and 23% of irrecoverable carbon, the role of mountains in maintaining both the health of the global ecosystem and the prosperity of humanity, has been established in various international forums, notably as outlined in Chapter 13 of the Agenda 21[50,52]. The fact that 19 PgC (9%) of that manageable carbon was found on agricultural land is indicative of the essential and central role mountain farmers and mountain communities have in many, if not all, of the world's mountain regions. Additionally, it points to the difficulty in categorizing, classifying, and remote sensing the oft times small farm sizes of the highly varied, highly integrated, and highly adapted farming systems found in mountains.
A better understanding of the potential mitigation benefits of various agroforestry and tree-based systems has become an essential component of international land sector mitigation efforts[27,53−55] and national carbon accounting[54−56] to meet nationally determined contributions (NDCs), as the need for transformative change in agricultural systems becomes more apparent, urgent, and generally recognized[12,13,31,33,34]. The benefits of agroforestry and increased tree cover on agricultural land, especially in terms of adaptation and resilience, both biophysically and socio-economically, are well described[29,57−60]. Trees on agricultural land have direct impacts on the livelihoods of hundreds of millions of small farmers around the globe[39,40] and have been shown to have significant co-benefits for biodiversity, ecosystems, and ecosystem services[59]. It has been proposed that given the large amount of land potentially suitable for higher tree cover densities, sequestering carbon via increases in the tree component on agricultural land is an achievable and relatively fast route to increasing CO2 sequestration[61] and global restoration efforts (as per this UN Decade of Restoration). Agroforestry type approaches, including multi-strata agroforestry, tree intercropping, biomass production, silvopasture, tropical staple tree, intercropping, bamboo, and indigenous tree–based land management have been highlighted as substantive solutions to reduce emissions and atmospheric carbon[62]. Previous results[20] show that even incremental changes to existing agricultural production systems and agricultural landscape management by marginally increasing tree cover increased biomass carbon from 4–6 PgC, with up to 12–19 PgC for a systemic change to tree-based systems, and that increasing tree cover on agricultural land by just 10% globally, that is, by 1% per year for the next ten years, would sequester more than 18 PgC, or 1.83 PgC·yr−1. By comparison, the potential increase in mountain agricultural systems is relatively small, 0.31 PgC·yr−1, or about 3.1 PgC over ten years. However, to put this in perspective, above-ground losses due to tropical land use conversion[61] have been estimated at 0.6–1.2 Pg·yr−1, with net emissions from land use, land-use change, and forestry for the year 2020 estimated to be 1.6 ± 0.7 PgC·yr−1[63].
Nevertheless, the potential for accumulating carbon in biomass on agricultural land, whether in mountains, or more generally globally, is small relative to the amount of carbon in yearly emissions[25], and in known coal, oil and gas reserves[61,64], and should not be considered a substitute for protection of 'irrecoverable carbon' in natural ecosystems including forests, grasslands, and montane meadows[17,65]. Although not the solution to climate change, absorption of carbon by trees on agricultural land has been shown to have significant mitigation potential and could provide some measure of near-term respite to carbon accumulation in the atmosphere[61,66]. In the case of mountain farming system, the sequestrated carbon plays a multifunctional role increasing both the mitigation and adaptation value of agroforestry approaches and increased tree cover, particularly in regard to provision of ecosystems services and biodiversity conservation. Synergistic effects of tree cover and other regenerative agricultural management approaches on soil health, through addition of organic matter, microclimate enhancement, and improved water relations may significantly increase soil organic matter and sequestration while improving soil fertility and water holding capacity[59] and should be seen a major additive mitigation co-benefit of increased tree cover in mountain agricultural systems. Likewise, various agroforestry type systems have recently been widely promoted as effective approaches to restore vast areas of degraded and abandoned agricultural land[67], as well as halting serious soil and soil carbon losses through erosion and/or poor management, and restoring fertility and soil health[68]. Like several recent assessments[31,54,69], our results indicate that the addition of trees in mountain agricultural landscapes can contribute substantially to adaptation efforts[70] and both help relieve pressure on nearby protected areas and other natural landscapes and common resource use areas in many countries with mountainous regions, both tropical and temperate[74].
Uptake and adoption of agroforestry practices on a wide scale, and within mountain farming systems more specifically, can help to address the need for fundamental transformation of the global food system[27,57,67,71], notably the impacts of monocultural and industrialized agricultural practices, particularly unsuited for mountain environments. It is widely recognized now that such a transformation is urgently required[34], and recognized that many mountain landscapes throughout the world are unsustainably managed and suffer from severe degradation due to deforestation, over-grazing and the ever more evident impacts of climate change[10]. Adopting landscape and ecosystem management approaches within mountains that include mountain communities and mountain farmers provides opportunities to leverage agroforestry approaches, and the livelihood improvement incentives which appropriate systems can provide to farmers to create wildlife habitat, conservation buffer zones, connectivity corridors, and other biodiversity refugia, while improving watershed management and decreasing soil degradation. Arguably, many of these additional 'co-benefits' of increased tree cover on agricultural land in mountains outweigh the quantification of the global mitigation potential in terms of carbon, or carbon offset projects. As such, it may be convenient to think of carbon in mountains as a form of 'premium carbon', and much like mountains themselves, essential irreplaceable components of the global ecosystem. Much of the carbon found in manageable areas with mountains is irrecoverable if lost (22%). This 'premium carbon' is likely to support high levels of biodiversity, and some of the last remaining large mammal species on the planet. Increasing tree cover within agricultural landscapes in mountains has the potential to support environmental and biodiversity conservation and provide sustainable, biodiversity-friendly development options. This will require enhanced policy environments and significant active policy and financial support, from the global to national and local levels, to promote widespread implementation and adoption, and to face a formidable array of challenges[54,70], not the least of which is the need for appropriate agroforestry technologies that can be implemented within mountain agricultural systems, along with global, regional, and national monitoring systems for verified carbon accounting[72].
-
For a multitude of peoples, and a rich diversity of cultures across the globe, mountains provide irreplaceable ecological, cultural and spiritual values[73,74], and importantly, globally significant ecosystems services which impact on the global climate and other process, and support billions of people around the world. As evident by the high portion of irreplaceable carbon found in mountainous regions, mountains contain some of the most threatened and highly valued ecosystems and biodiversity. However, although mountains were addressed in Chapter 13 of Agenda 21 at the United Nations Conference on Environment & Development held in Rio de Janeiro, Brazil in 1992[50,52], they have received little international policy attention relative to their importance since[10]. Mountains have been included in the United Nations (UN) Sustainable Development Goals[75] since 2015, though these goals have proved to be elusive and critically behind schedule as of 2023[75]. Mountains were not highlighted at the 27th UN Conference of the Parties (COP 27) on climate[73], and while there were two mountain-focused side-events at the CBD COP 15 in December 2022, montane systems are mentioned only once (as an optional subsidiary indicator) in the new ten-year Kunming- Montreal Global Biodiversity Framework[73,76]. The growing recognition among researchers and practitioners of the threats to montane social-ecological systems encompassing biodiversity, ecosystem services, human livelihoods, institutions, and governance highlights the need for transformative change[73].
Although the potential for accumulating carbon in biomass on mountain agricultural land is small relative to the amount of carbon in yearly emissions[25], but still shown to be substantial and globally significant, increased tree cover and agroforestry's potential to provide livelihood options within mountain environments and for mountain communities, and as a community-based socio-ecological approach to restoration of degraded mountain lands, highlights the multi-functional adaptive benefits of agroforestry systems to conserve and enhance mountain environments and ecosystem services. The rapid onset of climate change impacts and the growing recognition of the importance of the landuse sector within proposed global adaptation and mitigation efforts[24,25] has brought agroforestry systems and the role of trees to the forefront of discussions in various international forums. An emerging awareness of the relevance of agroforestry and trees outside forests to the climate change agenda[26−30] is apparent within the recent IPCC WGIII report[30] and the earlier landuse report[77,78] explicitly including, for the first-time, default data for a range of agroforestry land uses[77,79]. Similarly, increasingly abundant references to agroforestry are found in National Adaptation Plans and Nationally Determined Contributions[29,54−56]. There is now a global recognition of the need for transformative change in land management and food production systems[31−33] as a result of the significant impact of the agricultural sector on the biosphere[25,80], with climate[63] and biodiversity implications[81]. Agroforestry and increased tree cover on agricultural land are widely seen as pathways to improved agricultural production systems[24,31] that reduce carbon emissions, sequester carbon, and minimize the environmental impact of agricultural production[34], with multiple environmental, ecological, and socio-economic benefits, while potentially contributing to at least nine of the 17 SDGs[35]. It is our conclusion that these positive benefits are both relevant and greatly amplified within mountainous regions of the world, and for mountain communities and mountain agricultural systems.
-
The authors confirm contribution to the paper as follows: research study design: Zomer RJ, Trabucco A; spatial analysis: Zomer RJ; data analysis: Zomer RJ, Yang J, Trabucco A; draft manuscript preparation: Zomer RJ, Yang J, Spano D, Trabucco A; maps, tables, and figures preparation: Zomer RJ. All authors reviewed the results and approved the final version of the manuscript.
-
All of the data used in this study are available in the public domain, as described in the methodology section. The datasets generated during and/or analyzed during the current study are available from the corresponding author on reasonable request. The geospatial dataset of global tree cover on agricultural land and biomass carbon is available online at:
www.worldagroforestry.org/global-tree-cover/index.html . Research partly supported by the National Key Basic Research Program of China (Grant No. 2014CB954100), and National Science Foundation China (Grant No. 31270524), the European Union's Horizon 2020 Research and Innovation Programme (Grant No. 101003881 NEXOGENESIS) and the National Recovery and Resilience Plan of Italian Ministry of University and Research funded by NextGenerationEU (Grant No. CN_00000033 NBFC). We also express our gratitude to the Carbon Dioxide Information Analysis Center (CDIAC), Oakridge National Laboratory, the authors of the 'New IPCC Tier 1 Global Biomass Carbon Map' and the 'Global Aboveground and Belowground Biomass Carbon Density Maps for the Year 2010', and the authors of the two cited Irrecoverable Carbon papers for providing the online data used in this analysis.
-
The authors declare that they have no conflict of interest.
- Supplemental Table S1 Area classified as mountain agriculture (Mountains – Agricultural), all area classified as mountains (Mountain – All), all area classified as agriculture (Agricultural – All), and all terrestrial area (Terrestrial – All), globally, and by regions (km2). Source: Zomer et al., 2022[1]; Spawn et al. 2020[2]; UNEP-WCMC 2000[3].
- Supplemental Table S2 Area classified as mountain agricultural land as a percentage of all area classified as mountains (Mountains – Agricultural as % of Mountains - All), mountain agricultural land as a percent of all area classified as agriculture (Mountains – Agricultural as % of Agriculture - All), mountains as a percentage of total terrestrial area (Mountains – All as % of Terrestrial – All), and agriculture as a percentage of total area (Agricultural – All as % of Terrestrial – All), globally, and by regions (km2). Source: Zomer et al., 2022[1]; Spawn et al. 2020[2]; UNEP-WCMC 2000[3].
- Supplemental Table S3 Irrecoverable, manageable, and vulnerable carbon (Pg C) as found within all terrestrial area (All Terrestrial), area classified as mountains (Mountains), and within area classified as agricultural land within mountains (Mountain Agriculture). Source: Noon et al., 2021[4].
- Supplemental Table S4 Percent of all global irrecoverable, manageable, and vulnerable carbon (Pg C) found within areas classified as mountain regions (% All C in Mountains), and within areas classified as agricultural land with mountain regions ((% All C in Mt Ag), and percent of irrecoverable, manageable, and vulnerable carbon found within mountains in areas classified as agricultural land. Source: Noon et al., 2021[4].
- Copyright: © 2023 by the author(s). Published by Maximum Academic Press, Fayetteville, GA. This article is an open access article distributed under Creative Commons Attribution License (CC BY 4.0), visit https://creativecommons.org/licenses/by/4.0/.
-
About this article
Cite this article
Zomer RJ, Yang J, Spano D, Trabucco A. 2023. Irrecoverable carbon in mountains and the global mitigation potential of agroforestry and increased tree cover in mountain agricultural systems. Circular Agricultural Systems 3:11 doi: 10.48130/CAS-2023-0011 

Irrecoverable carbon in mountains and the global mitigation potential of agroforestry and increased tree cover in mountain agricultural systems
- Received: 09 June 2023
- Accepted: 16 October 2023
- Published online: 11 December 2023
Abstract: Agroforestry has many benefits suited to mountain agricultural systems. This paper seeks to understand and quantify the mitigation potential of multifunctional agroforestry systems, and the potential for increased tree cover in mountains. The potential of agroforestry approaches for protecting irrecoverable carbon in mountains providing alternative, sustainable, and biodiversity-friendly livelihood options for local mountain communities is explored. A substantial portion (29%) of global 'irrecoverable carbon' is found in mountains, representing irreplaceable ecosystems, biodiversity, and globally significant ecosystem services, under unprecedented environmental and demographic pressures, and rapidly changing climatic conditions. This 'premium' mountain carbon supports high levels of biodiversity, including many of the last remaining large mammal species on the planet. Increasing tree cover within agricultural landscapes in mountains can provide sustainable, biodiversity-friendly development options that support environmental and biodiversity conservation. Estimates of existing and decadal change of above- and below-ground biomass on agricultural land within mountainous regions are modeled based up IPCC Tier 1 estimates. Two scenarios are evaluated to estimate carbon sequestration potential of increasing tree cover on agricultural land: 1) incremental change and 2) a systemic change to agroforestry. Estimates of above- and below ground biomass carbon were combined with the tree cover analysis to estimate the change in biomass. Global increases (0.5−0.7 PgC for incremental change; 1.1−2.7 PgC for systematic change) highlight the mitigation potential within mountain agricultural systems. A 10% increase in tree cover on all agricultural land within mountain regions is estimated to sequester 3 PgC.
-
Key words:
- Mitigation /
- Adaptation /
- Agroforestry /
- Biomass carbon /
- Biodiversity conservation /
- Mountain agriculture