


-
Ridership figures in subway systems worldwide indicate the preference of travelers toward subway lines[1]. For instance, the Beijing subway carries more than 10.5 million passengers daily[2], and many stations have been suffering from very high passenger density. Crowds with high-level density may endanger the safety of passengers and the security of the subway's operation. Indeed, several statistical analyses of accident data performed in Europe and the United States of America[3] show that a lot of injuries occur because of crowding[4]. Some crucial stations are overloaded and overcrowded. Moreover, when passengers come into a narrow area or change their walking direction (see Fig. 1), the passengers distribute unevenly and the facility capacity is insufficiently utilized, which will increase their swings, arching, and clogging behaviors[5]. Due to the significant difference between the capacities of the adjacent facilities, there will be waiting and swinging passengers in the junction of facilities[6], and the efficiencies of station operation and passenger evacuation will be lessened substantially[7].
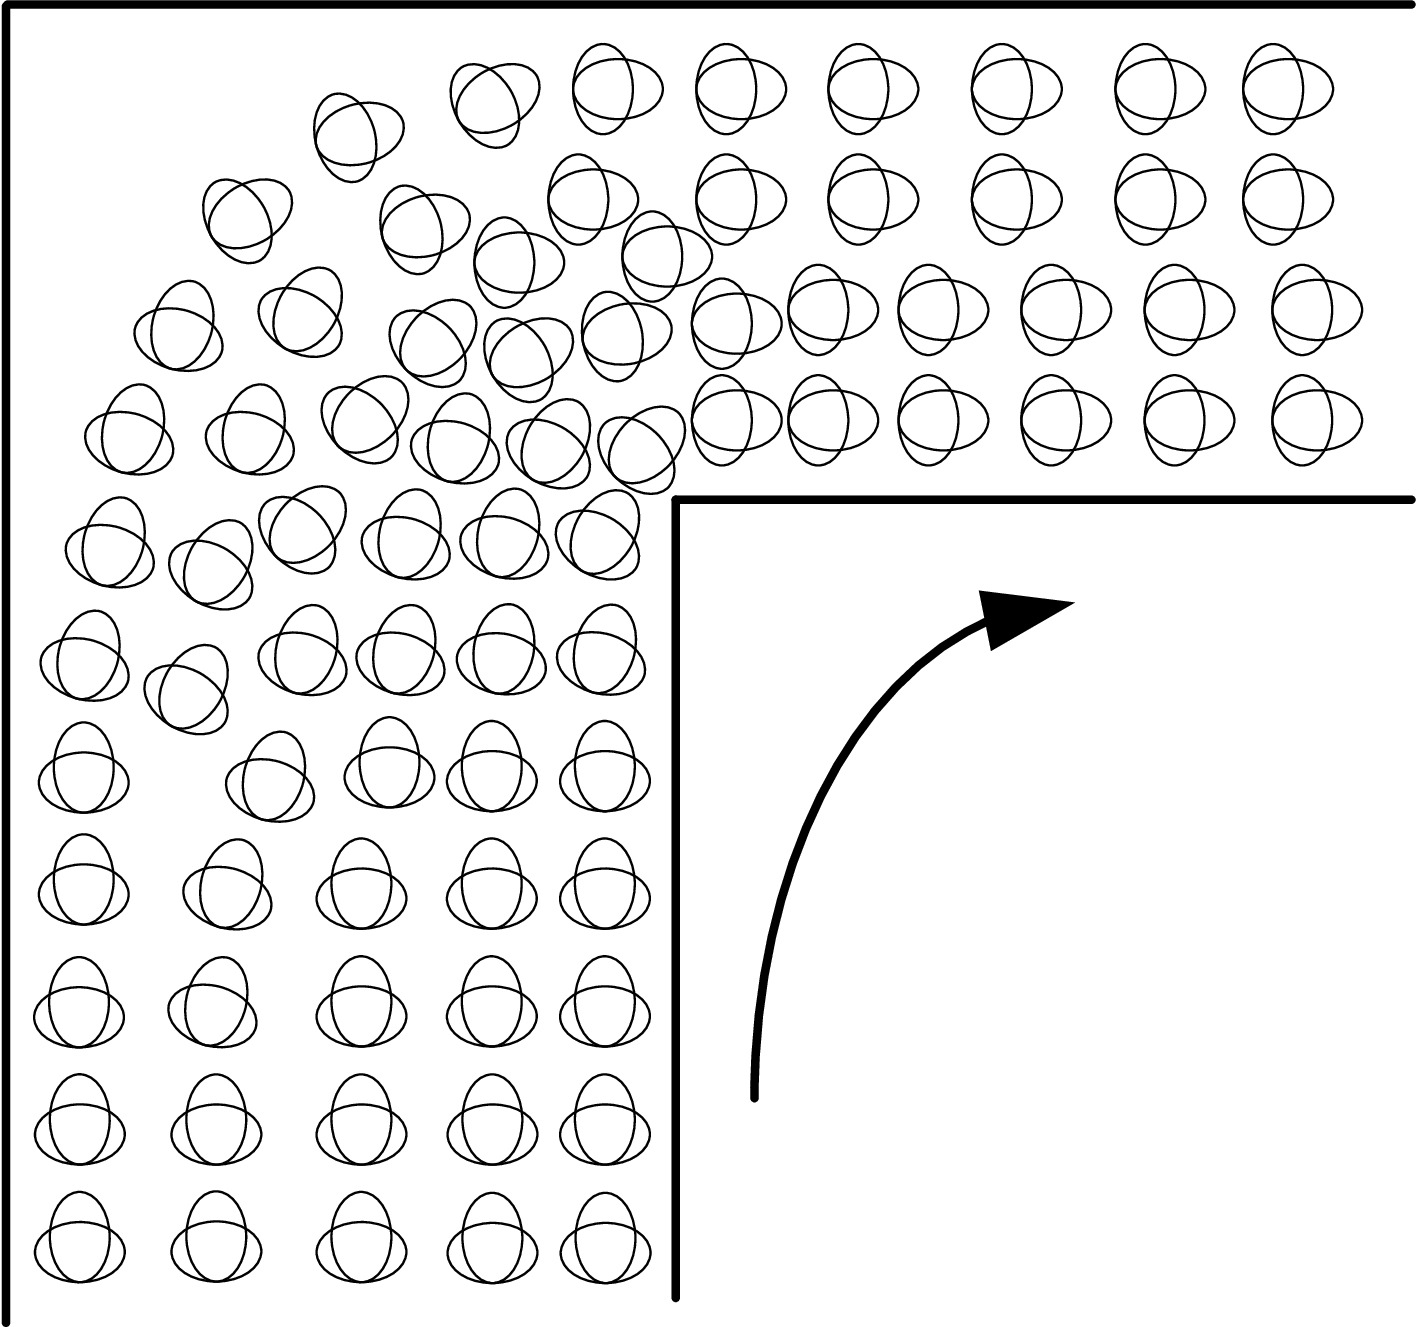
Figure 1.
Discrepancy of passenger density in a corner.
Overcrowding and crushing incidents have occurred around the world[7]. In subway stations, congestion forms frequently at corners, junctions, and entrances of escalators and staircases. With the increase of passenger density, the interference among passengers are more serious, which decreased walking efficiency and passenger comfort. However, arrival intervals of passengers at facilities in subway stations are different from that of other enclosed buildings. In general, the inbound passengers arrive at the entrance of the facility in a Poisson distribution[8], and the alighted passengers arrive at the entrance of the subsequent facility of the platform in a Phase Type distribution[9]. Under emergencies, the evacuation efficiency of passengers is influenced by both the facility capacities and the initial distribution of passengers in subway stations. Therefore, investigating the more efficient gathering-scattering manner of passengers has become an emergent task for subway operational management[10]. Subject to the narrow room, the angled corner has to be constructed, which could decrease performance of a corridor. A discrete field cellular automaton (CA) model was proposed to reproduce the unidirectional pedestrian movement in a channel[11]. Considering speeds of passengers in merging areas decreased with turning angle increase, the social force model (SFM) is improved to describe their turning process[1]. Based on captured microscopic walking behaviors during the turning process, Dias reproduced pedestrians' walking behaviors on angled corridors[12]. However, few studies focused on passengers' walking behaviors at merging junctions in subway stations. Additionally, most of the studies considered that arrival intervals of the inbound passengers and passengers on intermediate facilities follow exponential distribution or uniform distribution[13,14], which differs from the actual scenario in a subway station. While the time interval of the alighted outbound passengers moving from platform to the merging junction generally follows a phase-type distribution[15]. To reproduce passengers' walking behaviors in subway stations, the queueing network model is proposed by taking different walking behaviors in various scenarios into account. In addition, the performance of typical corner corridors with various dimensions will be evaluated to improve managerial efficiency of subway stations.
This paper aims to investigate the law involved in the circulation efficiency of the corners in subway stations. The remainder of this paper is organized as follows: the next provides an overview of the relevant literature. The statement about this problem is given subsequently. Then, the state of passenger flow on the corners is analyzed based on the queueing model proposed. To verify the approach, we exemplify simulations with a typical corner of the Beijing subway station. Finally, we finish with concluding remarks.
-
According to related research, occupants' walking behaviors are subject to the capacity of the walking facility, which is determined by the width of the facility[12]. Many bottleneck experiments have studied the relationship between the width of the bottleneck and the speed of passenger flow[13]. Experiments were carried out to study the relationship between walking speed and population density, and the characteristic of the fundamental diagram in corridors with various widths. To study how the layout of the facility impacts passengers walking, controlled experiments with human participants[14] and non-human organisms are conducted[15]. Parameters of walking behaviors (speed, walking time, etc.) in regular facilities, such as corridors, stairs, and plazas are estimated[16]. In addition, some experiments focused on collective phenomena, such as jamming, oscillations[5], and spatial and temporal separation rules[17]. The flow increases with the increasing distance between the bottleneck and the holding area[18]. With the initial density of passengers in the holding area increasing, the passenger flow will increase correspondingly, but the rate of the increase will decrease[19]. Moreover, a modified version of the cumulative sum control chart algorithm is proposed to robustly detect steady states from density and speed time series of bottleneck experiments[20]. In addition, most research focuses on pedestrian walking behavior at bottlenecks or junctions of facilities.
Some macroscopic models construct the physical environment as a network of nodes connected by arcs, and passengers are modeled as flow. The models are generally based on the queueing network[21] or fluid dynamics model[22]. Passenger flow moves from a source to a sink node via arcs without exceeding the capacity of each node and arc. Learning from the hydrodynamic model in vehicle movement, Hoogendoorn & Daament[18] presented a pedestrian dynamic model describing pedestrian movement.
The above studies regarding bottlenecks, to a certain extent, help ease the congestion in the subway station. The research also provides helpful studies on the evacuation of specific stations, passenger travel organization in stations, optimization of station structure design, and rehabilitation of existing stations. Based on the studies, many simulation experiments of passenger evacuation from subway stations were also carried out[23]. When passengers traverse corners, they have to adjust their speed because of the change of walking direction, which increases interactions among passengers and decreases walking efficiency[20,24]. Their walking time increases by 2.15%−6.59% because of the congestion and turning[7]. However, the process of passenger gathering and scattering in the corners of the subway station is rarely explored. In this study, based on queueing theory, theoretical analysis is conducted to investigate the impact of the corner on passenger behavior and the influence of facility capacity on circulation efficiency. It is meaningful to develop the theoretical basis and practical reference for subway station designers and managers.
-
Arrival intervals of passengers at subway stations are different from that of other enclosed buildings. Facilities in the subway station and passenger flow comprise a type of unique system with diversified arrival interval distributions[9]. To describe the circulation process of passengers in the facility, the movement model is presented based on the queueing theory. The circulation facility and passengers are considered as the server and items, respectively. Each queueing system is characterized by Markovian arrival rates, Markovian service times, and some parallel servers[25]. A realistic methodology for modeling the corner with uni-directional inbound passenger flow as a system of M/M/C/K queues is proposed in this paper, and the PH/PH(n)/C/C state-dependent queuing model[9] is established to analyze the process of alighted passengers (Fig. 2).
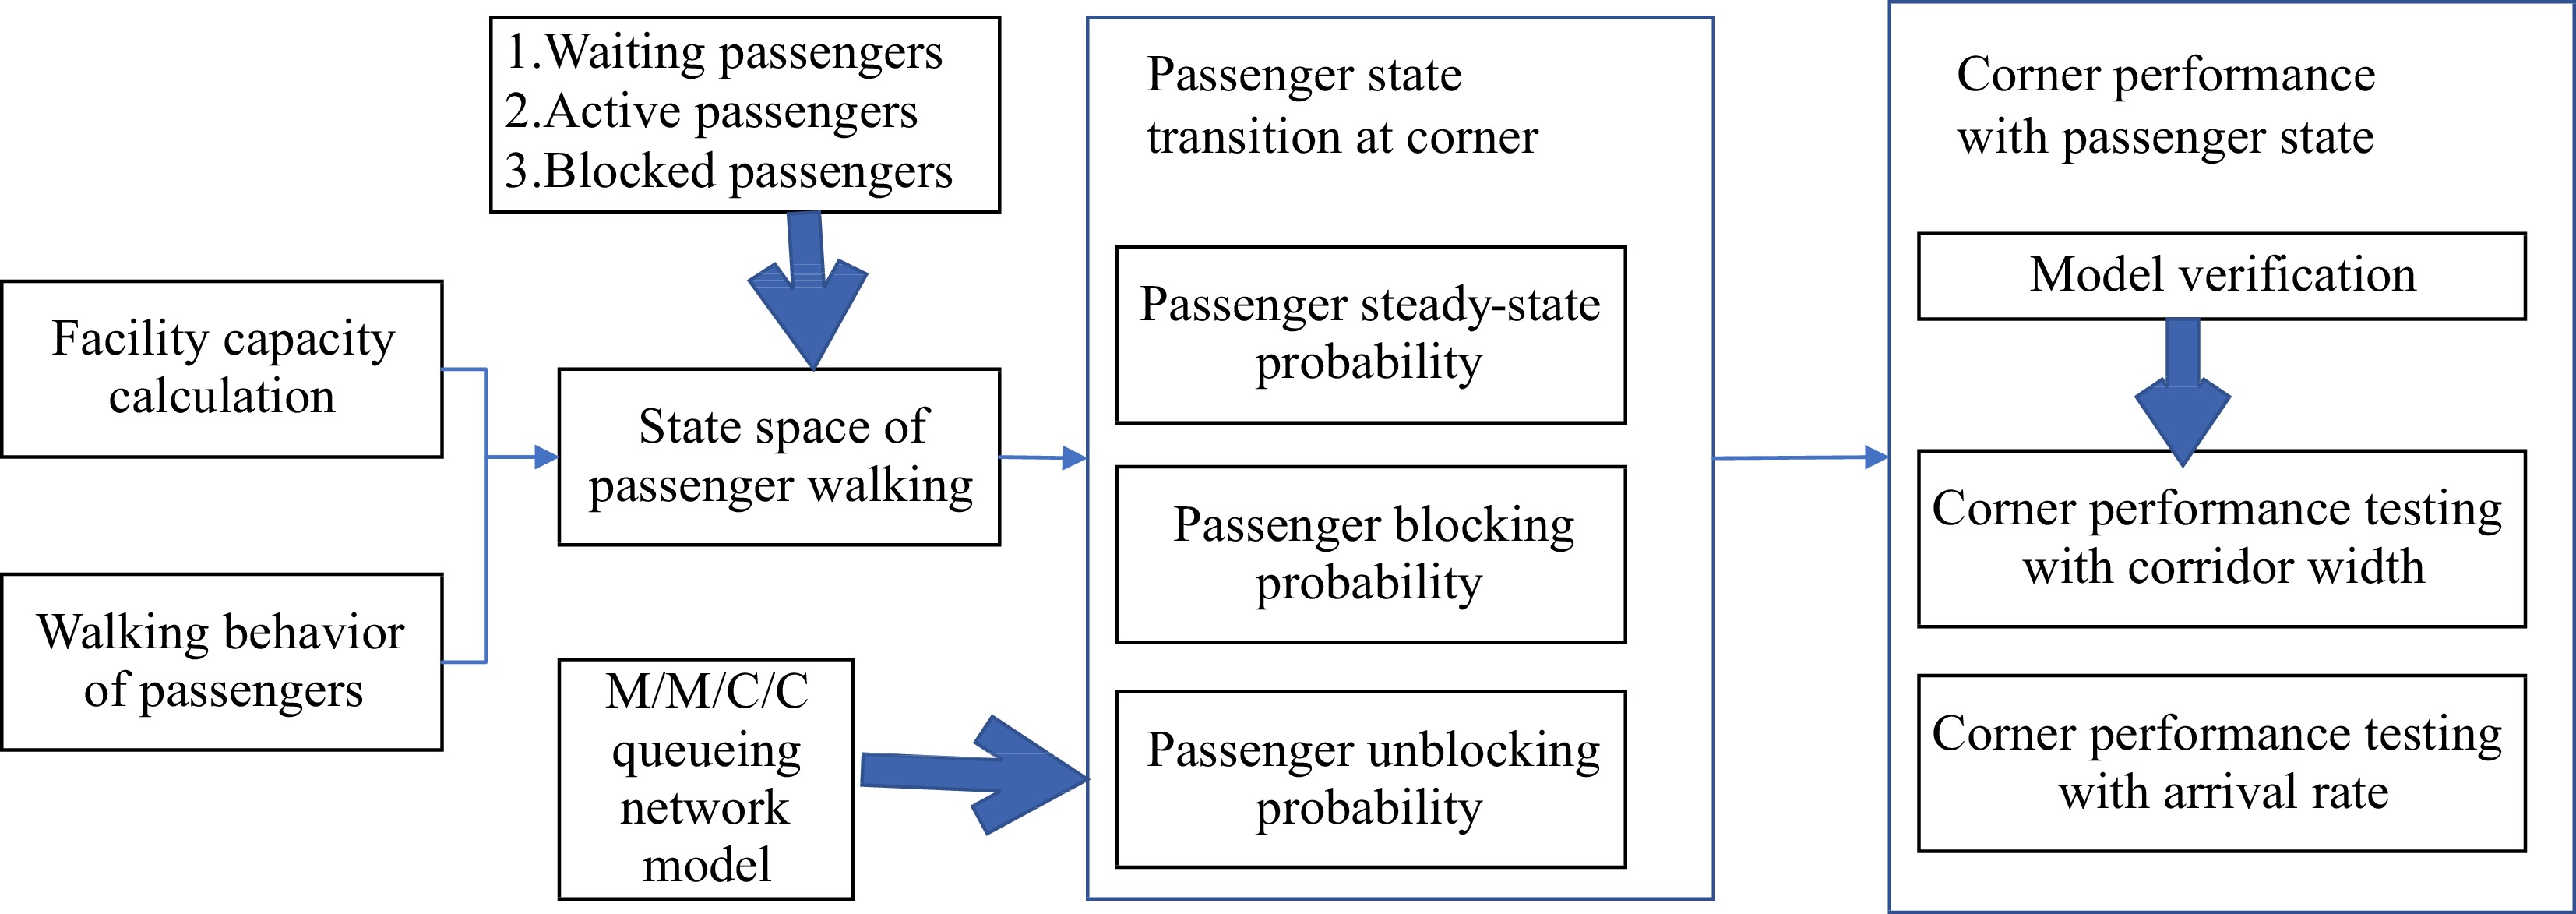
Figure 2.
Framework of passenger gathering-scattering analysis.
Facility capacity
-
Facility capacity can be defined as the maximum number of passengers that can be served in a given period of time. While passengers walk in the facility, they should keep a distance from the wall and barrier, and the effective width of the circulation facility is 0.75 m less than its actual width[21]. To maximize the utilization of facility capacity, passengers line up orderly and walk in straight lines, which is similar to vehicle operations on the road. Thus, circulation facilities are divided into Pedestrian Lanes (PLs, see Fig. 3). The width of a PL is the lateral spacing required for an adult moving, that is,
$ wd $ $ pl $ 
Figure 3.
Self-organizing passenger line method in the facility.
$ pl=\left[\frac{W-0.75}{wd}=\frac{{W}^{eff}}{wd}\right] $ (1) where [ ] stands for rounding the number down.
$ W $ $ {W}^{eff} $ $ wd $ The lengthwise PL is divided into Pedestrian Segments (PSs) to represent servers in the queueing system. The length of a PS is the longitudinal distance per capita, which equals the safety margin needed to avoid interference with the prior passenger. The length of the facility and a PS are Le and le, respectively. The number of servers in a queue can be calculated as:
$ {n}_{s}=\left[\frac{Le}{le}\right] $ (2) The total number of servers in a state-dependent queueing model is:
$ {N}_{s}=pl\times {n}_{s} $ (3) When passenger density approaches 5 peds/m2, the passengers' walking will be seriously disturbed, and the passenger flow will come to a halt[25]. Therefore, the facility accommodating capacity
$ \mathbb{N} $ $ \mathbb{N} = [5LW] $ (4) where L denotes the length of the corridor.
However, there may still be some forward movement at n =
$ \mathbb{N} $ $ \mathbb{N}+1 $ $ {V}_{\mathbb{N}+1} $ Walking speed of passengers
-
When n passengers occupy a single corridor, they travel at an average walking speed,
$ {V}_{n} $ $ n $ $ {N}_{s} $ $ {V}_{n} $ $ {V}_{f} $ $ {m}^{2} $ $ {V}_{n}=1.5\times \mathit{exp}\left[-{\left(\frac{n-1}{\beta }\right)}^{\gamma }\right] $ (5) where n is the number of passengers in the facility,
$ n=\mathrm{1,2},\dots ,c,\dots ,\mathbb{N} $ Furthermore, the algebraic relationship between
$ \beta $ $ \gamma $ $ \gamma =\mathit{ln}\left[\frac{\mathit{ln}\left({V}_{a}/1.5\right)}{\mathit{ln}\left({V}_{b}/1.5\right)}\right]/\mathit{ln}\left(\frac{a-1}{b-1}\right) $ (6) $ \beta =\frac{a-1}{[\mathit{ln}\left(1.5/{V}_{a}\right){]}^{1/\gamma }}=\frac{b-1}{[\mathit{ln}\left(1.5/{V}_{b}\right){]}^{1/\gamma }} $ (7) where
$ a=2\times Le\times W $ $ b=4\times Le\times W $ $ {V}_{a}=0.64 $ $ {V}_{b}=0.25 $ State space of passengers
-
Because of the change in the corridor width or walking direction (see Fig. 4), the walking speed of passengers will slow down at the junction of facilities. With the density increasing, passengers in free flow will turn into the crowded flow, which easily leads to congestion. To describe the circulation process of passengers in the corners, passengers are divided into three categories according to the current location.

Figure 4.
Schematic diagrams of occupant states at corners.
(1) Waiting passengers are denoted as S. They wait for available PSs in the buffer area when all PSs are occupied;
(2) Active passengers are denoted as A. They are walking at a certain speed passing through the facility;
(3) Blocked passengers are denoted as B. Their target facilities are occupied, and the buffer area is full of waiting occupants. They halt and wait for the buffer area or target facility.
The state space of passengers in the prior facility is represented as follows:
$ x\left(i\right)=({a}_{i},{b}_{i},{s}_{i}) $ (8) where
$ {a}_{i} $ $ {b}_{i} $ $ {s}_{i} $ $ \left({A}_{i},{B}_{i},{S}_{i}\right) $ $ P\left(i\right)=\left\{(a,b,s)\in {\mathbb{N}}^{3},a+b\le {N}_{s},a+b+s\le {\mathbb{N}}_{i}\right\} $ $ {\mathbb{N}}_{i} $ Assumptions
-
The M/M/C/C queueing system mentioned above is based on the following assumptions:
(1) Passengers distribute evenly on the PLs because of crowding;
(2) Active passengers walk in line in the same lane, that is, passengers will select the adjacent queue at route transfer probability when it comes to the junctions of facilities;
(3) Blocked passengers creep along with queues;
(4) Passengers are served with a first in first out (FIFO) mechanism in the M/M/C/C system.
-
In the M/M/C/C system, the time spent by each passenger in the facility is exponentially distributed with the rate
$ {M}^{n} $ $ \mu $ $ \mu =le\times {V}_{f}\times {d}_{c} $ (9) where
$ {V}_{f} $ $ {d}_{c} $ Then, the overall service rate U in the queueing model is:
$ U={N}_{s}\times \mu $ (10) When there are n passengers occupying the facility, the service rate
$ \mu $ $ {\mu }_{n}=le\times {V}_{n}\times {d}_{n} $ (11) where
$ {V}_{n} $ $ \mathbb{N} $ $ {d}_{n} $ Assume that the random number of items is n (n ≤
$ \mathbb{N} $ $ {M}^{n} $ $ n\times \mu $ $ {t}_{s}=\frac{1}{n\times \mu } $ (12) The limiting probability for the random number of items n (n ≤
$ C $ $ {p}_{n}=\mathit{Pr}\left\{n=\mathbb{N}\right\} $ $ {p}_{n}=\frac{\lambda \lambda \cdots \lambda }{\left(\mu \right)\left(2\mu \right)\cdots \left(n\mu \right)}{p}_{0}=\frac{{\left(\lambda /\mu \right)}^{n}}{n!}{p}_{0} $ (13) where n = 1, 2, …, C.
When n >
$ C $ $ {t}_{s}^{\text{'}}=\frac{1}{U} $ (14) The steady-state probability is calculated as follows:
$ {p}_{n}=\frac{{\left(\lambda /\mu \right)}^{n}}{p!{p}^{n-p}}{p}_{0} $ (15) According to the formula of total probability equals 1:
$ {p}_{0}+\frac{{\left(\lambda /\mu \right)}^{n}}{n!}{p}_{0}+\frac{{\left(\lambda /\mu \right)}^{n}}{p!{p}^{n-p}}{p}_{0}=1 $ (16) where
$ {p}_{0} $ $ \begin{split}{p}_{0}=&{\left[1+{\sum }_{n-1}^{p-1}\frac{{\left(\lambda /\mu \right)}^{n}}{n!}+{\sum }_{n=p}^{\infty }\frac{{\left(\lambda /\mu \right)}^{n}}{p!{p}^{n-p}}\right]}^{-1}\\=&{\left[{\sum }_{n=0}^{p-1}\frac{{\left(\lambda /\mu \right)}^{n}}{n!}+\frac{{\left(\lambda /\mu \right)}^{p}}{p!(1-\lambda /p\mu )}\right]}^{-1} \end{split}$ (17) The passenger steady-state probability
$ {p}_{n} $ $ {\pi }_{n} $ $ \pi {\left(i\right)}_{n} $ $ \left\{\begin{array}{l}\pi \left(i\right)Q\left(i\right)=0\\ {\sum }_{x\in X\left(i\right)}\pi {\left(i\right)}_{x}=1\end{array}\right. $ (18) where
$ \pi {\left(i\right)}_{x} $ $ \pi \left(i\right) $ The matrix
$ Q\left(i\right) $ $ p\left(i\right) $ $ Q\left(i\right) $ $ Q{\left(i\right)}_{sj},\left(s\ne j\right) $ $ Q{\left(i\right)}_{ss}=-{\sum }_{j\ne s}Q{\left(i\right)}_{sj} $ $ -Q{\left(i\right)}_{ss} $ $ s $ $ {\sum }_{j\ne s}\pi {\left(i\right)}_{j}Q{\left(i\right)}_{js}=-\pi {\left(i\right)}_{s}Q{\left(i\right)}_{ss} $ (19) It, therefore, balances the inflow and the outflow for a given state s. We define
$ Q\left(i\right) $ (1)
$ {\lambda }^{i} $ $ i $ (2)
$ {\mu }^{i} $ $ i $ (3)
$ {\tilde{\mu }}^{ib} $ $ i $ $ {\tilde{\mu }}^{i} $ (4)
$ {p}_{{K}^{i}} $ $ i $ $ {K}^{i} $ $ {N}_{s} $ The above four parameters allow us to describe the transition rates between different states of queue
$ i $ $ Q\left(i\right)=f\left({\lambda }^{i},{\mu }^{i},{\tilde{\mu }}^{i},{p}_{{K}^{i}}\right) $ (20) The transition rates are different in different passengers states, and
$ Q\left(i\right) $ (1) is
$ {\lambda }^{i} $ $ i $ $ a+b+1 < {C}^{i} $ $ i $ $ {\lambda }^{i} $ $ \left(a+1,b,s\right) $ (2) is
$ {\lambda }^{i} $ $ i $ $ a+b+1=={C}^{i} $ $ s+1\le {N}_{s}-{C}^{i} $ $ i $ $ {\lambda }^{i} $ $ \left(a+1,b,s\right) $ (3) is
$ {\tilde{\mu }}^{ib} $ $ s==0 $ $ \left(a,b-1,s\right) $ (4) is
$ {\mu }^{i}\left(1-{p}_{{K}^{i}}\right) $ $ a{\mu }^{s}\left(1-{p}_{{K}^{i}}\right) $ $ s==0 $ $ \left(a,b-1,s\right) $ (5) is
$ {\tilde{\mu }}^{ib} $ $ s\ge 1 $ $ \left(a+1,b-1,s-1\right) $ (6) is
$ {\mu }^{i}\left(1-{p}_{{K}^{i}}\right) $ $ s\ge 1 $ $ {\mu }^{i}\left(1-{p}_{{K}^{i}}\right) $ (7) is
$ {\mu }^{i}\left({p}_{{K}^{i}}\right) $ $ \left(a,b,s)\right) $ $ \left(a-1,b+1,s\right) $ Passenger blocking probability
-
A PL i is considered as a queue i for the corner, which is regarded as a series-parallel queue. There would be a routing decision to be made at each queueing system. When passengers transfer from the queueing system of the prior corridor to that of the target corridor, the transfer probability is denoted as
$ {p}_{ij} $ When the volume of passengers is greater than the number of servers, passenger blocking will occur, and there are some waiting passengers in the junction. We assume 'blocking after service' (BAS)[26] in the M/M/C/K system. The passenger leaves the prior queueing system i, and the target queueing system j may be blocked with probability
$ {p}_{{K}_{i}} $ $ {p}_{{K}_{i}} $ $ {p}_{{K}_{i}}={\sum }_{j}{p}_{ij}P\left({N}_{j}={K}_{j}\right) $ (21) Based on the equation of conservation of passenger flow,
$ {p}_{ij} $ $ i $ $ j $ $ i $ $ {\lambda }_{i}^{eff}=wd\times {d}_{c}\times {v}_{in} $ (22) where
$ {v}_{in} $ Meanwhile, the effective arrival rate of the target queue is obtained via the flow conservation equations. It can be approximated as follows:
$ {\lambda }_{j}^{eff}=\left(1-p\left({N}_{i}={\mathbb{N}}_{i}\right)\right)+{\sum }_{i}{p}_{ij}{\lambda }_{i}^{eff} $ (23) Based on the general expansion method (GEM)[27], we can approximate the effective service rate at the upstream queueing system
$ i $ $ j $ $ {h}_{j} $ $ j $ $ j $ 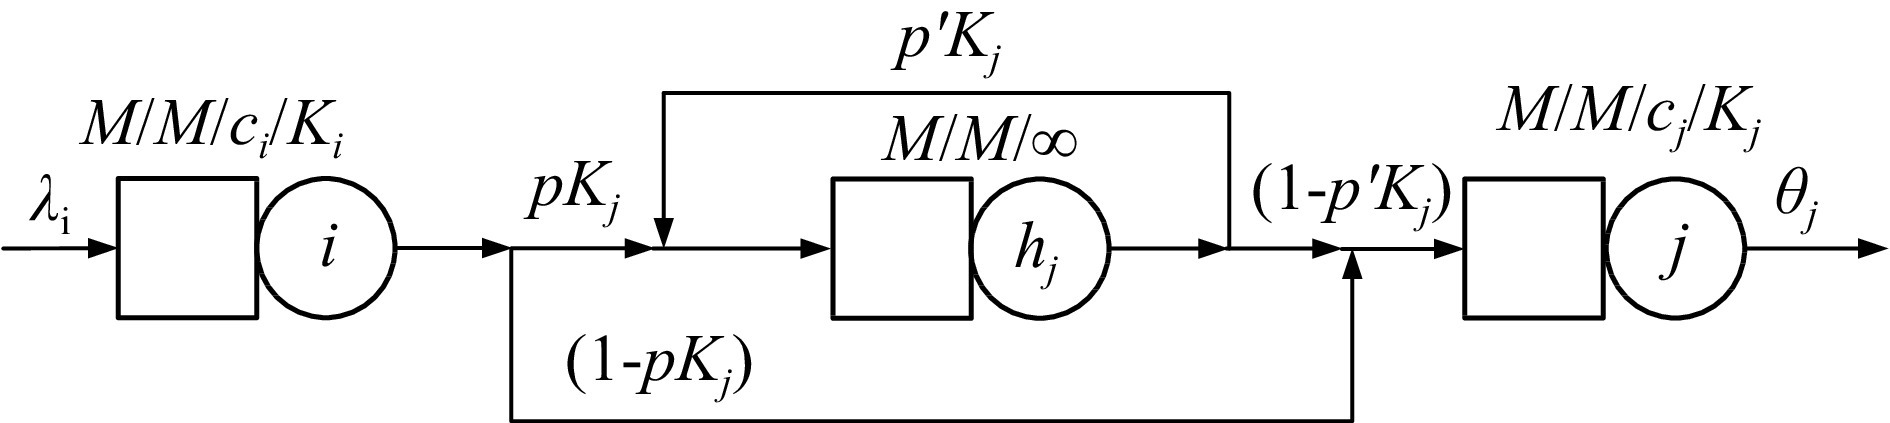
Figure 5.
Virtual queue when the target queue is blocked.
The effective service rate of queueing system
$ i $ $ {\mu }_{i}^{eff} $ $ {h}_{j} $ $ j $ $ j $ $ {\left({\tilde{\mu }}_{i}^{eff}\right)}^{-1}={\mu }_{i}^{-1}+{p}_{{k}_{j}}{\left({\mu }_{{h}_{j}}\right)}^{-1} $ (24) where
$ {\mu }_{{h}_{j}} $ $ {h}_{j} $ $ {\tilde{p}}_{ij} $ $ {\tilde{p}}_{ij}=\frac{{p}_{ij}p\left({N}_{j}={C}_{j}\right)}{{p}_{i}^{j}}=\frac{{p}_{ij}p\left({N}_{j}={\mathbb{N}}_{j}\right)}{{\sum }_{l}{p}_{il}p\left({N}_{l}={k}_{l}\right)}\approx \frac{{p}_{ij}}{{\sum }_{l}{p}_{il}} $ (25) Passenger unblocking probability
-
Each target facility unblocks passengers in facility i at its own rate, which is the acceptance rate of blocked occupants. We approximate the acceptance rate of a target facility by the average acceptance rate
$ {\tilde{\mu }}_{i}^{a} $ $ \frac{1}{{\tilde{\mu }}_{i}^{a}}={\sum }_{j}{\tilde{p}}_{ij}\frac{1}{{r}_{ij}{\tilde{\mu }}_{i}^{eff}{c}_{j}} $ (26) Let
$ D\left(i,b\right) $ $ b $ $ D\left(i,b\right)\times {\tilde{\mu }}_{i}^{a} $ $ \text{1/}\tilde{\mu }\left(i,b\right) $ $ \frac{1}{\tilde{\mu }\left(i,b\right)}={\sum }_{d=1}^{\mathit{min}\left(b,card\left({I}^+\right)\right)}p\left(D\left(i,b\right)=d\right)\frac{1}{d{\tilde{\mu }}_{i}^{a}} $ (27) where
$ {I}^{+} $ $ card\left({I}^{+}\right) $ $ p\left(D\left(i,b\right)=d\right) $ $ b $ $ p\left(D\left(i,b\right)=d\right)={\sum }_{l\left(i,b,d\right)\in L\left(i,b,d\right)}\frac{b!}{{\prod }_{j\in {J}^+}l{\left(i,b,d\right)}_{j}!}{\prod }_{j\in {J}^+}{\tilde{p}}_{ij}^{l{\left(i,d,d\right)}_{j}} $ (28) where
$ l{\left(i,b,d\right)}_{j}\in L{\left(i,b,d\right)}_{j} $ $ L{\left(i,b,d\right)}_{j} $ $ L{\left(i,b,d\right)}_{j}\iff \left\{\begin{array}{l}{\sum }_{j\in {J}^+}l{\left(i,b,d\right)}_{j}=b\\ {\sum }_{j\in {J}^+}{\rm I}{\rm I}\left(l{\left(i,b,d\right)}_{j} \gt 0\right)=d\\ l{\left(i,b,d\right)}_{j}\ge 0,\forall j\in {J}^+\end{array}\right. $ (29) where
$ {\rm I}{\rm I}\left(l{\left(i,b,d\right)}_{j} > 0\right) $ $ b $ $ i $ $ d $ $ l{\left(i,b,d\right)}_{j} $ $ \frac{b!}{{\prod }_{j\in {J}^{+}}l{\left(i,b,d\right)}_{j}!} $ $ \delta \left(i,b,d\right) $ $ b $ $ j $ $ l{\left(i,b,d\right)}_{j} $ Putting Eqn (24) and (27) together, we obtain:
$ \frac{1}{{\tilde{\mu }}_{ib}}=\frac{1}{{\tilde{\mu }}_{i}^{a}}{\sum }_{d=1}^{\mathit{min}\left(b,card\left({p}^+\right)\right)}\frac{1}{d}{\sum }_{l\left(i,b,d\right)\in L\left(i,b,d\right)}\frac{b!}{{\prod }_{j\in {J}^+}l{\left(i,b,d\right)}_{j}!}{\prod }_{j\in {J}^+}{\tilde{p}}_{ij}^{l{\left(i,d,d\right)}_{j}} $ (30) where
$ {J}^{+} $ There are
$ b $ $ i $ $ {t}_{i}^{b} $ $ {\mu }_{i}^{eff} $ $ i $ $ {\mu }_{i}^{eff}=\frac{1}{{\mu }_{i}}+{P}_{i}^{f}E\left[{t}_{i}^{b}\right] $ (31) where
$ {P}_{i}^{f}E\left[{t}_{i}^{b}\right] $ $ i $ $ E\left[{t}_{i}^{b}\right] $ $ E\left[{t}_{i}^{b}\right]={\sum }_{b\ge 1}\frac{P\left({b}_{i}=b\right)}{P\left({b}_{i} \gt 0\right)}E\left[{t}_{i}^{b}\left|{b}_{i}=b\right.\right]=\frac{1}{b}{\sum }_{j=1}^{b}E\left[t{\left(i,b\right)}_{j}\right] $ (32) where
$ t{\left(i,b\right)}_{j} $ The average time between successive passenger departure is given that there are
$ b $ $ i $ $ \frac{1}{{\tilde{\mu }}_{ib}} $ $ E\left[{t}_{i}^{b}\left|{b}_{i}=b\right.\right]=\frac{1}{b}{\sum }_{k=1}^{b}\frac{k}{\tilde{\mu }\left(i,k\right)} $ (33) Furthermore:
$ E\left[{t}_{i}^{b}\right]={\sum }_{b\ge 1}\frac{P\left({b}_{i}=b\right)}{P\left({b}_{i} \gt 0\right)}{\sum }_{k=1}^{b}\frac{k}{b}\times \frac{1}{\tilde{\mu }\left(i,k\right)} $ (34) The traffic capacity of facility
$ i $ $ {\mu }_{i}^{eff}{c}_{i} $ $ {r}_{ij} $ $ {r}_{ij}=\frac{{\tilde{p}}_{ij}\cdot {\lambda }_{i}^{eff}}{{\lambda }_{j}^{eff}} $ (35) The throughput of passengers via facility i is:
$ {\theta }_{i}={r}_{ij}\cdot {\mu }_{i}^{eff}{c}_{i} $ (36) $ E\left({L}_{q}\right) $ $ E\left({L}_{q}\right)=\frac{{\left(np\right)}^{n}{\pi }_{0}\rho }{n!{\left(1-\rho \right)}^{2}}\left[1-\left(-n+1\right){\rho }^{N-n}+\left(N-n\right){\rho }^{N-n+1}\right] $ (37) where
$ \rho $ $ \rho =\frac{{\mu }^{eff}}{{\lambda }^{eff}} $ (38) The mean length of the queue is computed as follows:
$ E\left(L\right)=\frac{\lambda }{\mu }\left(1-{\pi }_{n}\right)+\frac{{\left(np\right)}^{n}{\pi }_{0}\rho }{n!{\left(1-\rho \right)}^{2}}\left[1-\left(N-n+1\right){\rho }^{N-n}+\left(N-n\right){\rho }^{N-n+1}\right] $ (39) -
The model is used to investigate the walking characteristics of passengers at corners in subway stations. Passengers are modeled as items and facilities as severs. The layout of the corner of facilities in HUIXINXIJIENANKOU station (abbreviated as H station) of Beijing subway station is given and shown in Fig. 6.
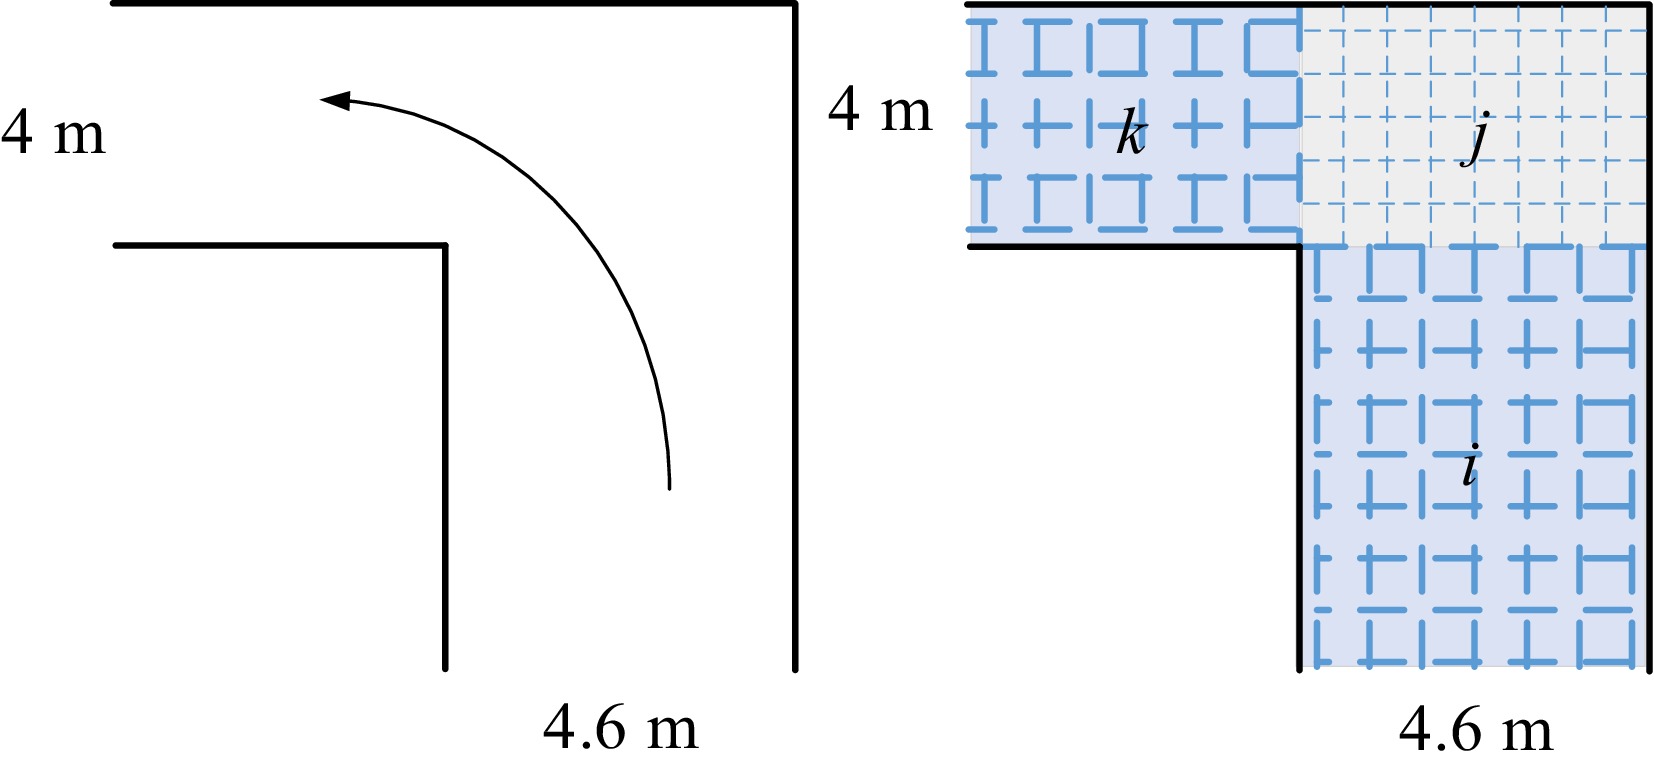
Figure 6.
The topology of the corner in H station.
The corner is defined as a two-node network as shown in Fig. 7. The virtual queue
$ {v}_{k} $ 
Figure 7.
Model network structure of a corner between walking facilities.
We carried out the field survey in H station. The corner (queueing system) is characterized by Poisson arrivals, general service, and multiple servers. According to the dimension of the corner, the parameters of queueing systems are tabulated in Table 1. The exogenous parameters
$ {\lambda }_{i} $ $ {p}_{ij} $ Table 1. Configuration of the queueing network of a corner.
Node Length
(m)Width
(m)$ {N}_{s} $ $ \mathbb{N} $ $ \mathrm{\mu } $ U K Corridor i 10 4.6 170 230 0.43 73 176 Corner j 4 4.6 92 92 0.59 54 146 Corridor k 8 4 72 160 0.43 31 146 The field surveys at rush-hour durations were conducted from the 9th April, 2018 to the 12th July, 2018 at H station of Beijing subway system. Passenger volumes and speeds in three durations (7:30−8:00, 8:00−8:30, and 8:30−9:00) were taken into consideration. To analyze passenger behavior in an automated fashion, a digital camera was attached to the ceiling. Video footage at a unidirectional flow bottleneck was extracted. The data consisted of 95 groups of occupant flow (the data of each day is a group), and the most crowded group had an average number of passengers of 170 peds/min (see Fig. 8). The cumulative 83% of the rush hour volume is 8,800 peds/h at the stations. Hence, 8,800 peds/h and above capacities are considered, and speeds at corners are shown in Table 2.
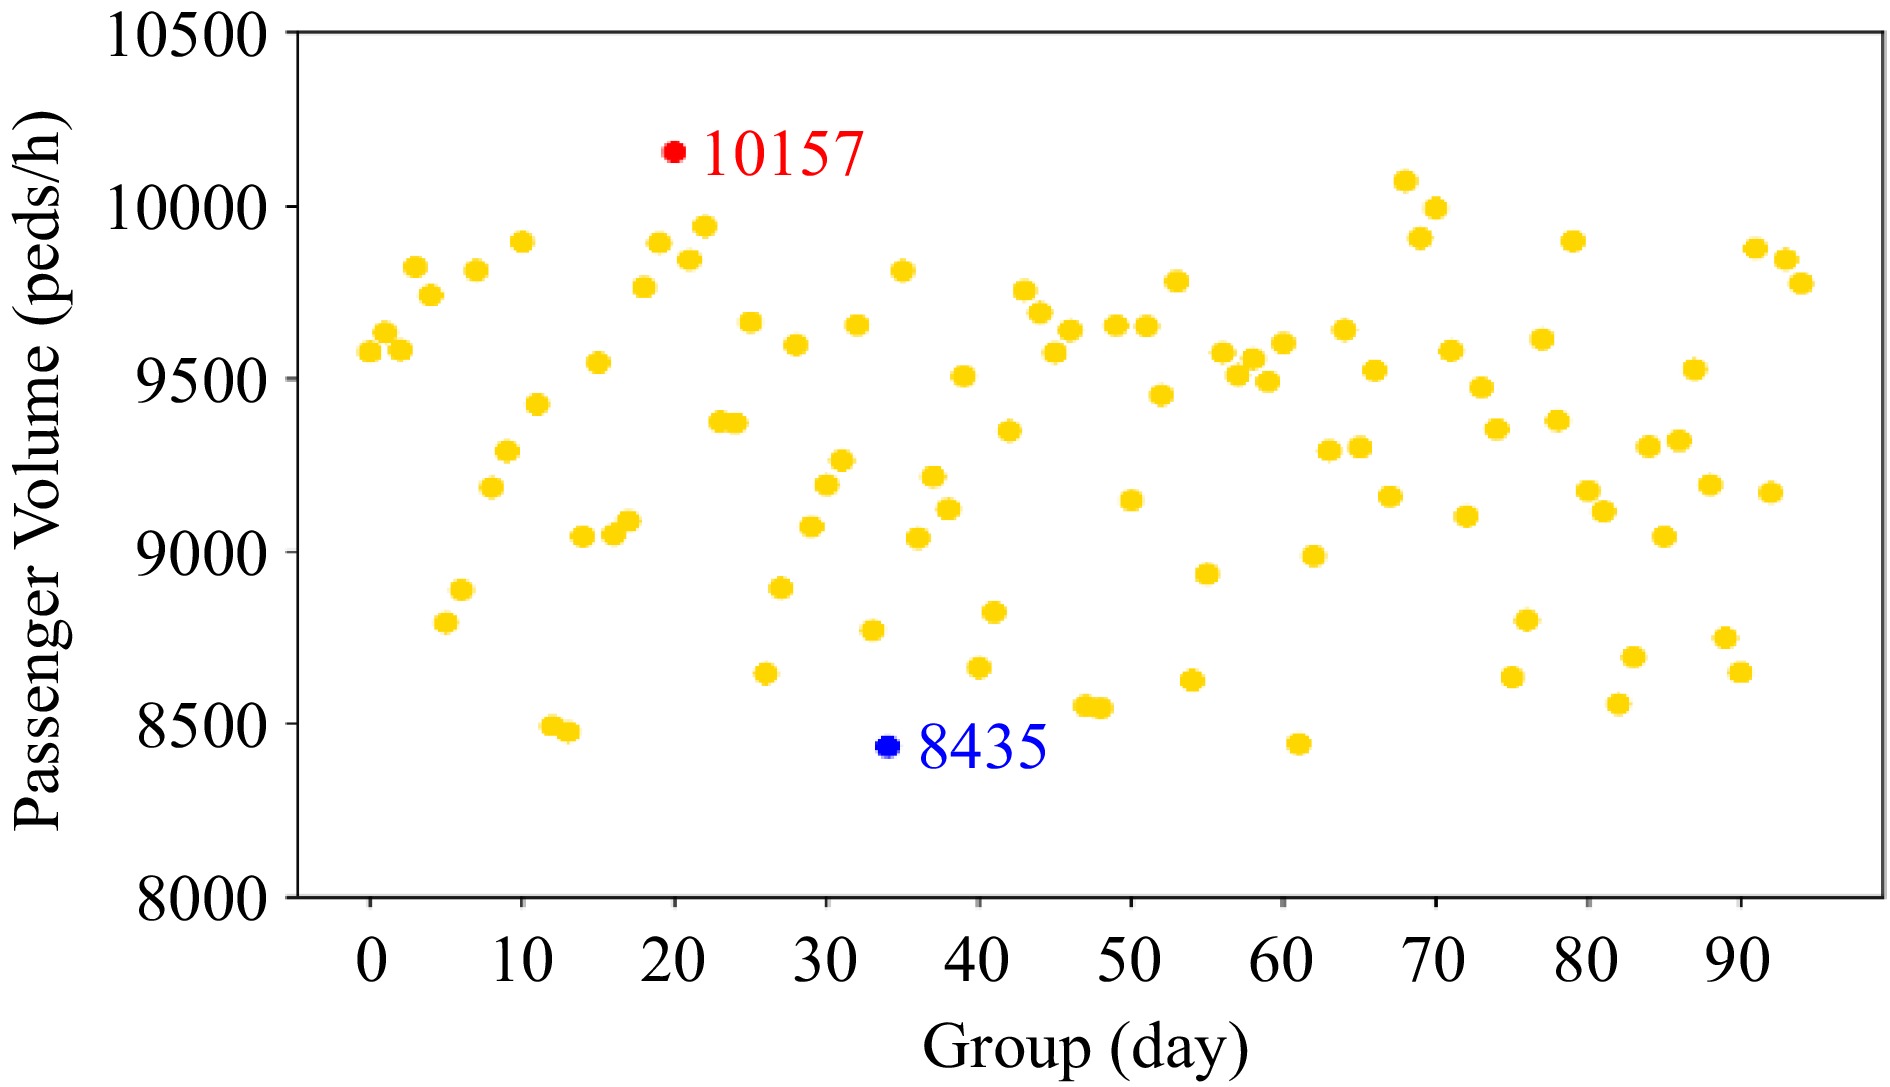
Figure 8.
The observation of volumes of passenger flow in subway stations.
Table 2. Descriptive statistics of the speed of passengers at the corner.
Observation
regionMean (m/s) Median (m/s) Max
(m/s)Min
(m/s)Standard deviation (m/s) Prior corridor 0.449 0.376 0.759 0.230 0.163 Corner junction 0.248 0.201 0.495 0.160 0.119 Target corridor 0.579 0.505 1.055 0.380 0.127 The observation of the paired comparisons of arrival rate and average speeds of the passengers are statistically analyzed using the binomial test (confidence level 95%). Figure 9 presents all the pairwise scatter plots. The first row of the scatter plots shows that the average speeds of passengers are associated with a negative arrival rate. In the second row, the third and the fourth column show the relationship between the coefficient of the average speeds, the average speeds of the prior corridor is associated positively with that of the junction and the target corridor. Likewise, the third and the fourth row show similar relationships.
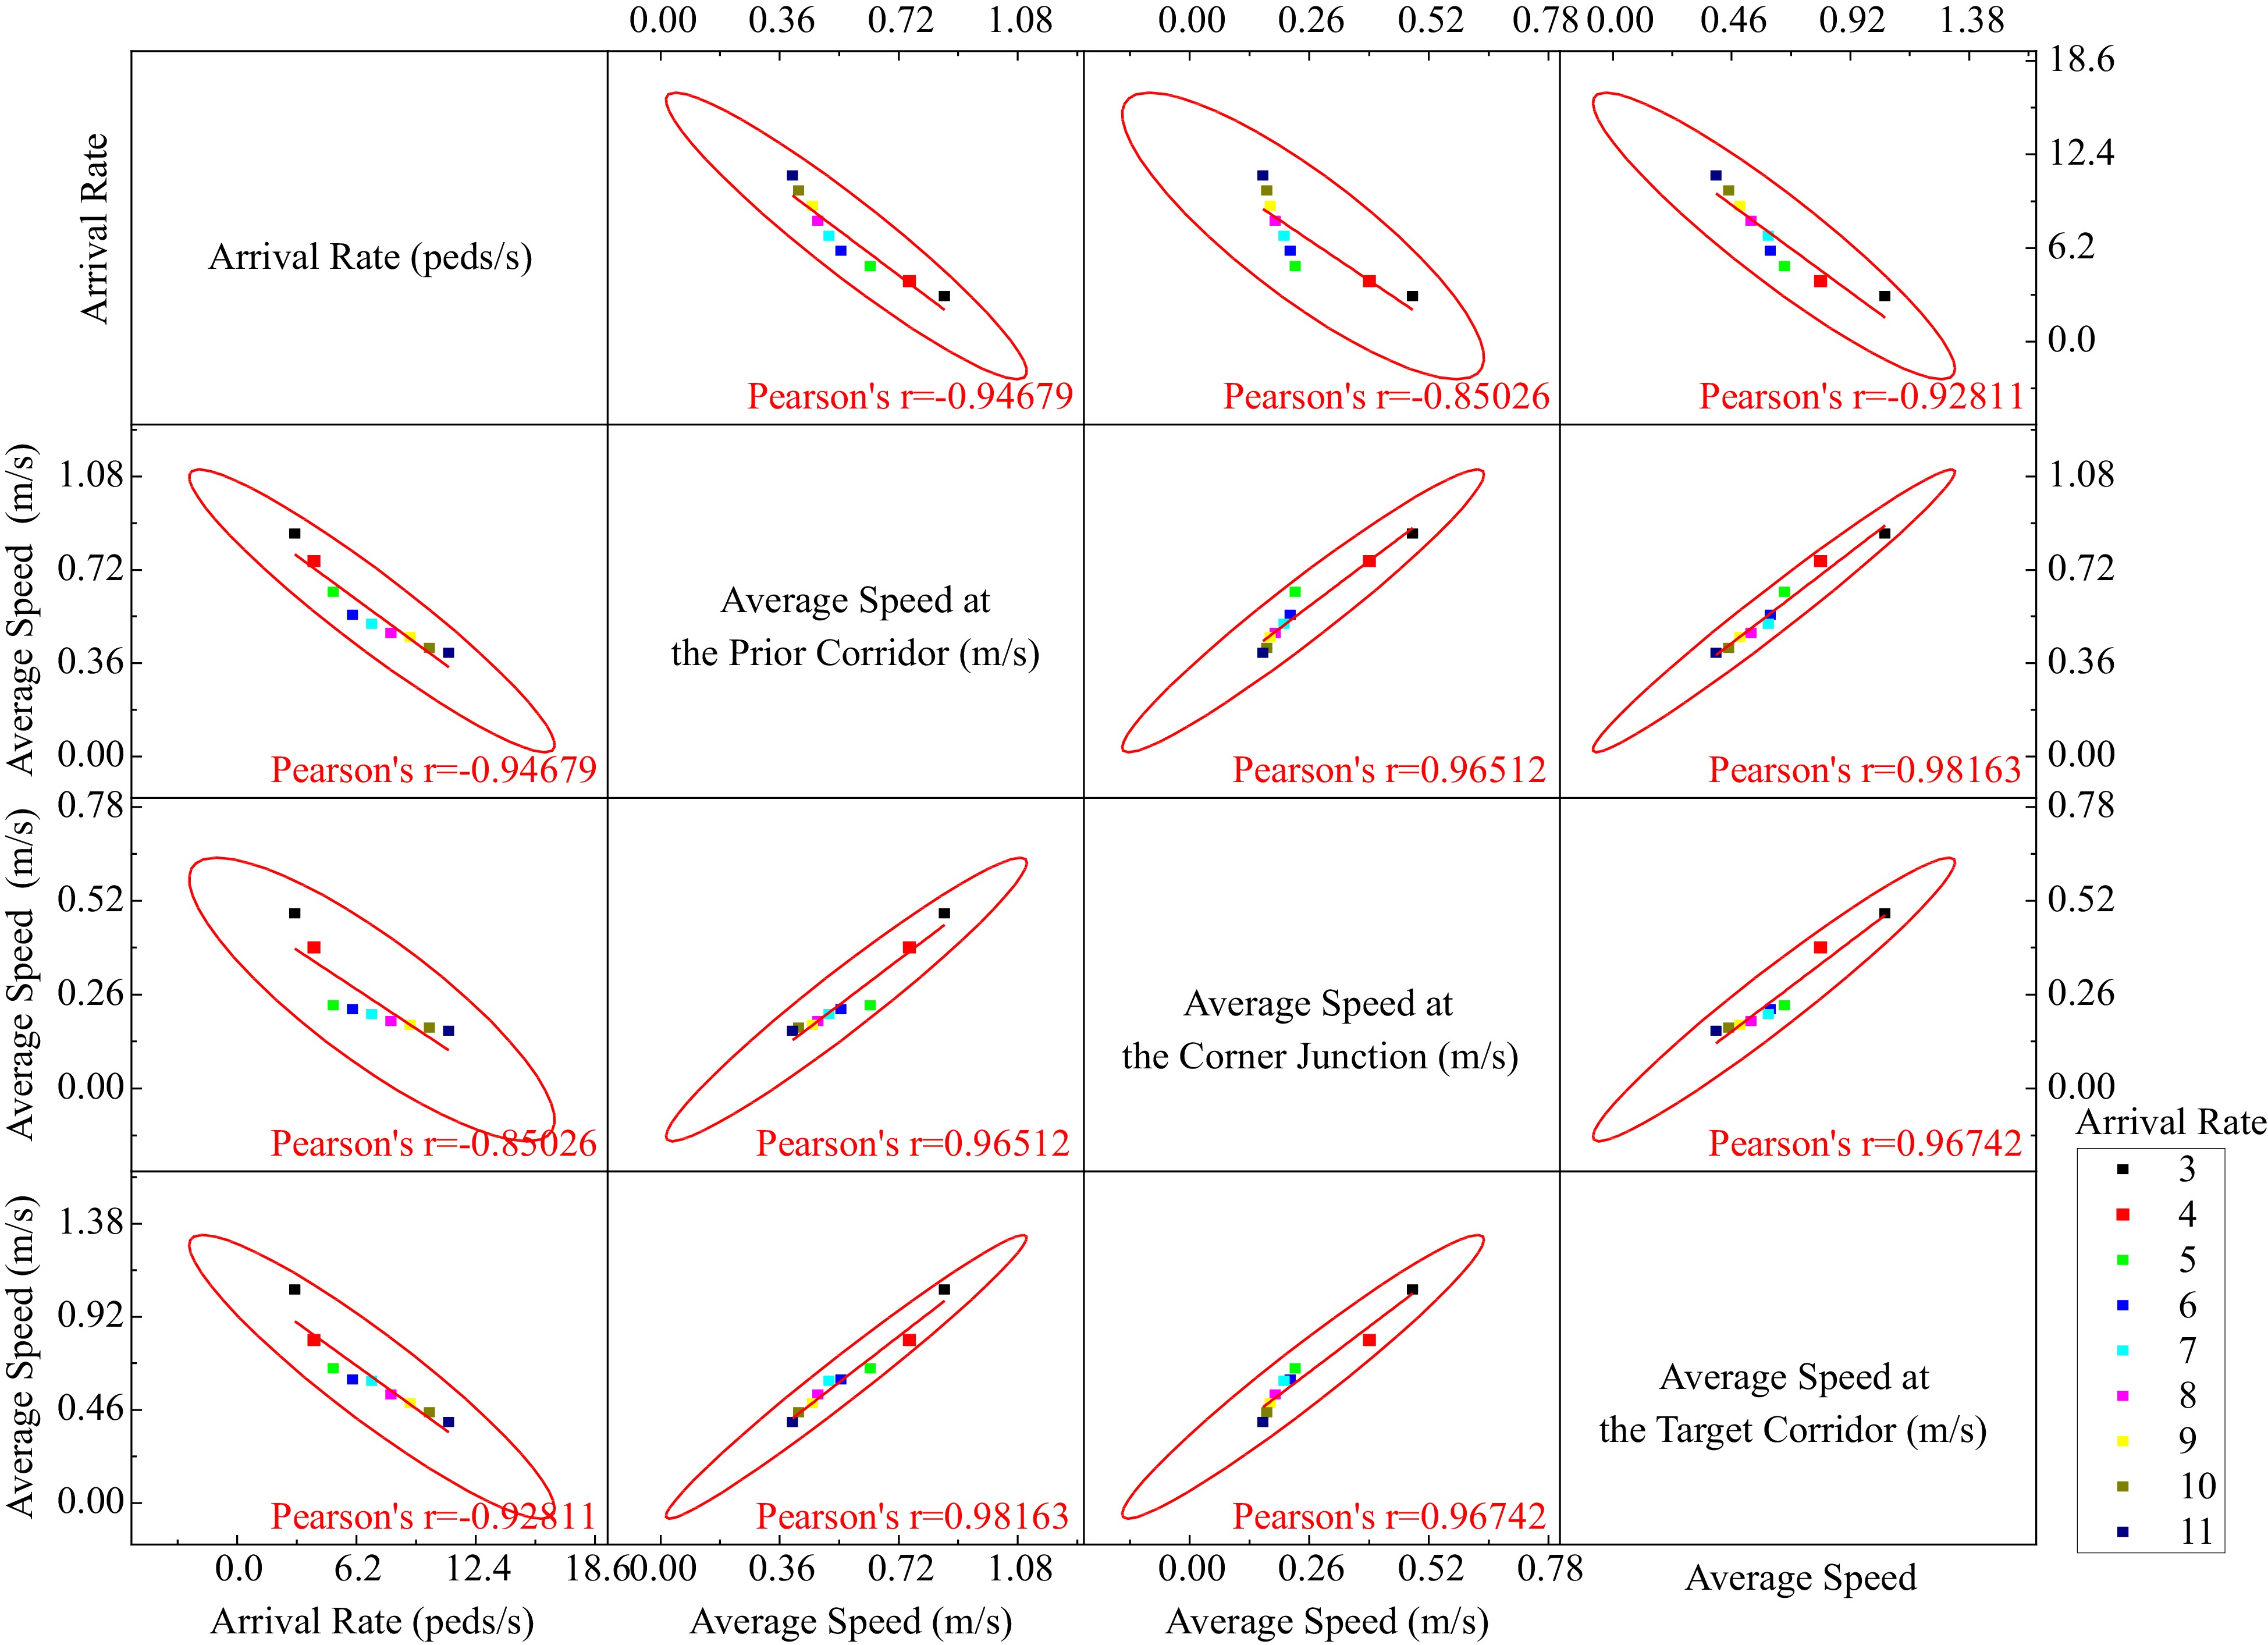
Figure 9.
Pairwise scatter plots between coefficients of arrival rate and speeds.
Speeds of passengers at the prior corridor are higher than that of the corner junction and vary greatly. When passengers enter the corner, the speed change is less than before, and the average speed at the corner is about 37% lower than that of the prior corridor. When passenger volume is close to the corner capacity, the follow-up will sway and congestion occurs. The swaying range and the walking speed turned out to be negatively correlated in the normal situation[29]. Entering the corner, passengers tend to choose the shortest path and often sidle up to the wall along the turning angle[30], and they will slow down and congestion is observed. Through the corner junction, passengers will speed up, and the average speed in the target corridor will increase by 156% compared to that of the corner junction. The average speed of passengers and expected time traversing the corner are shown in Fig. 10 with various arrival rates.
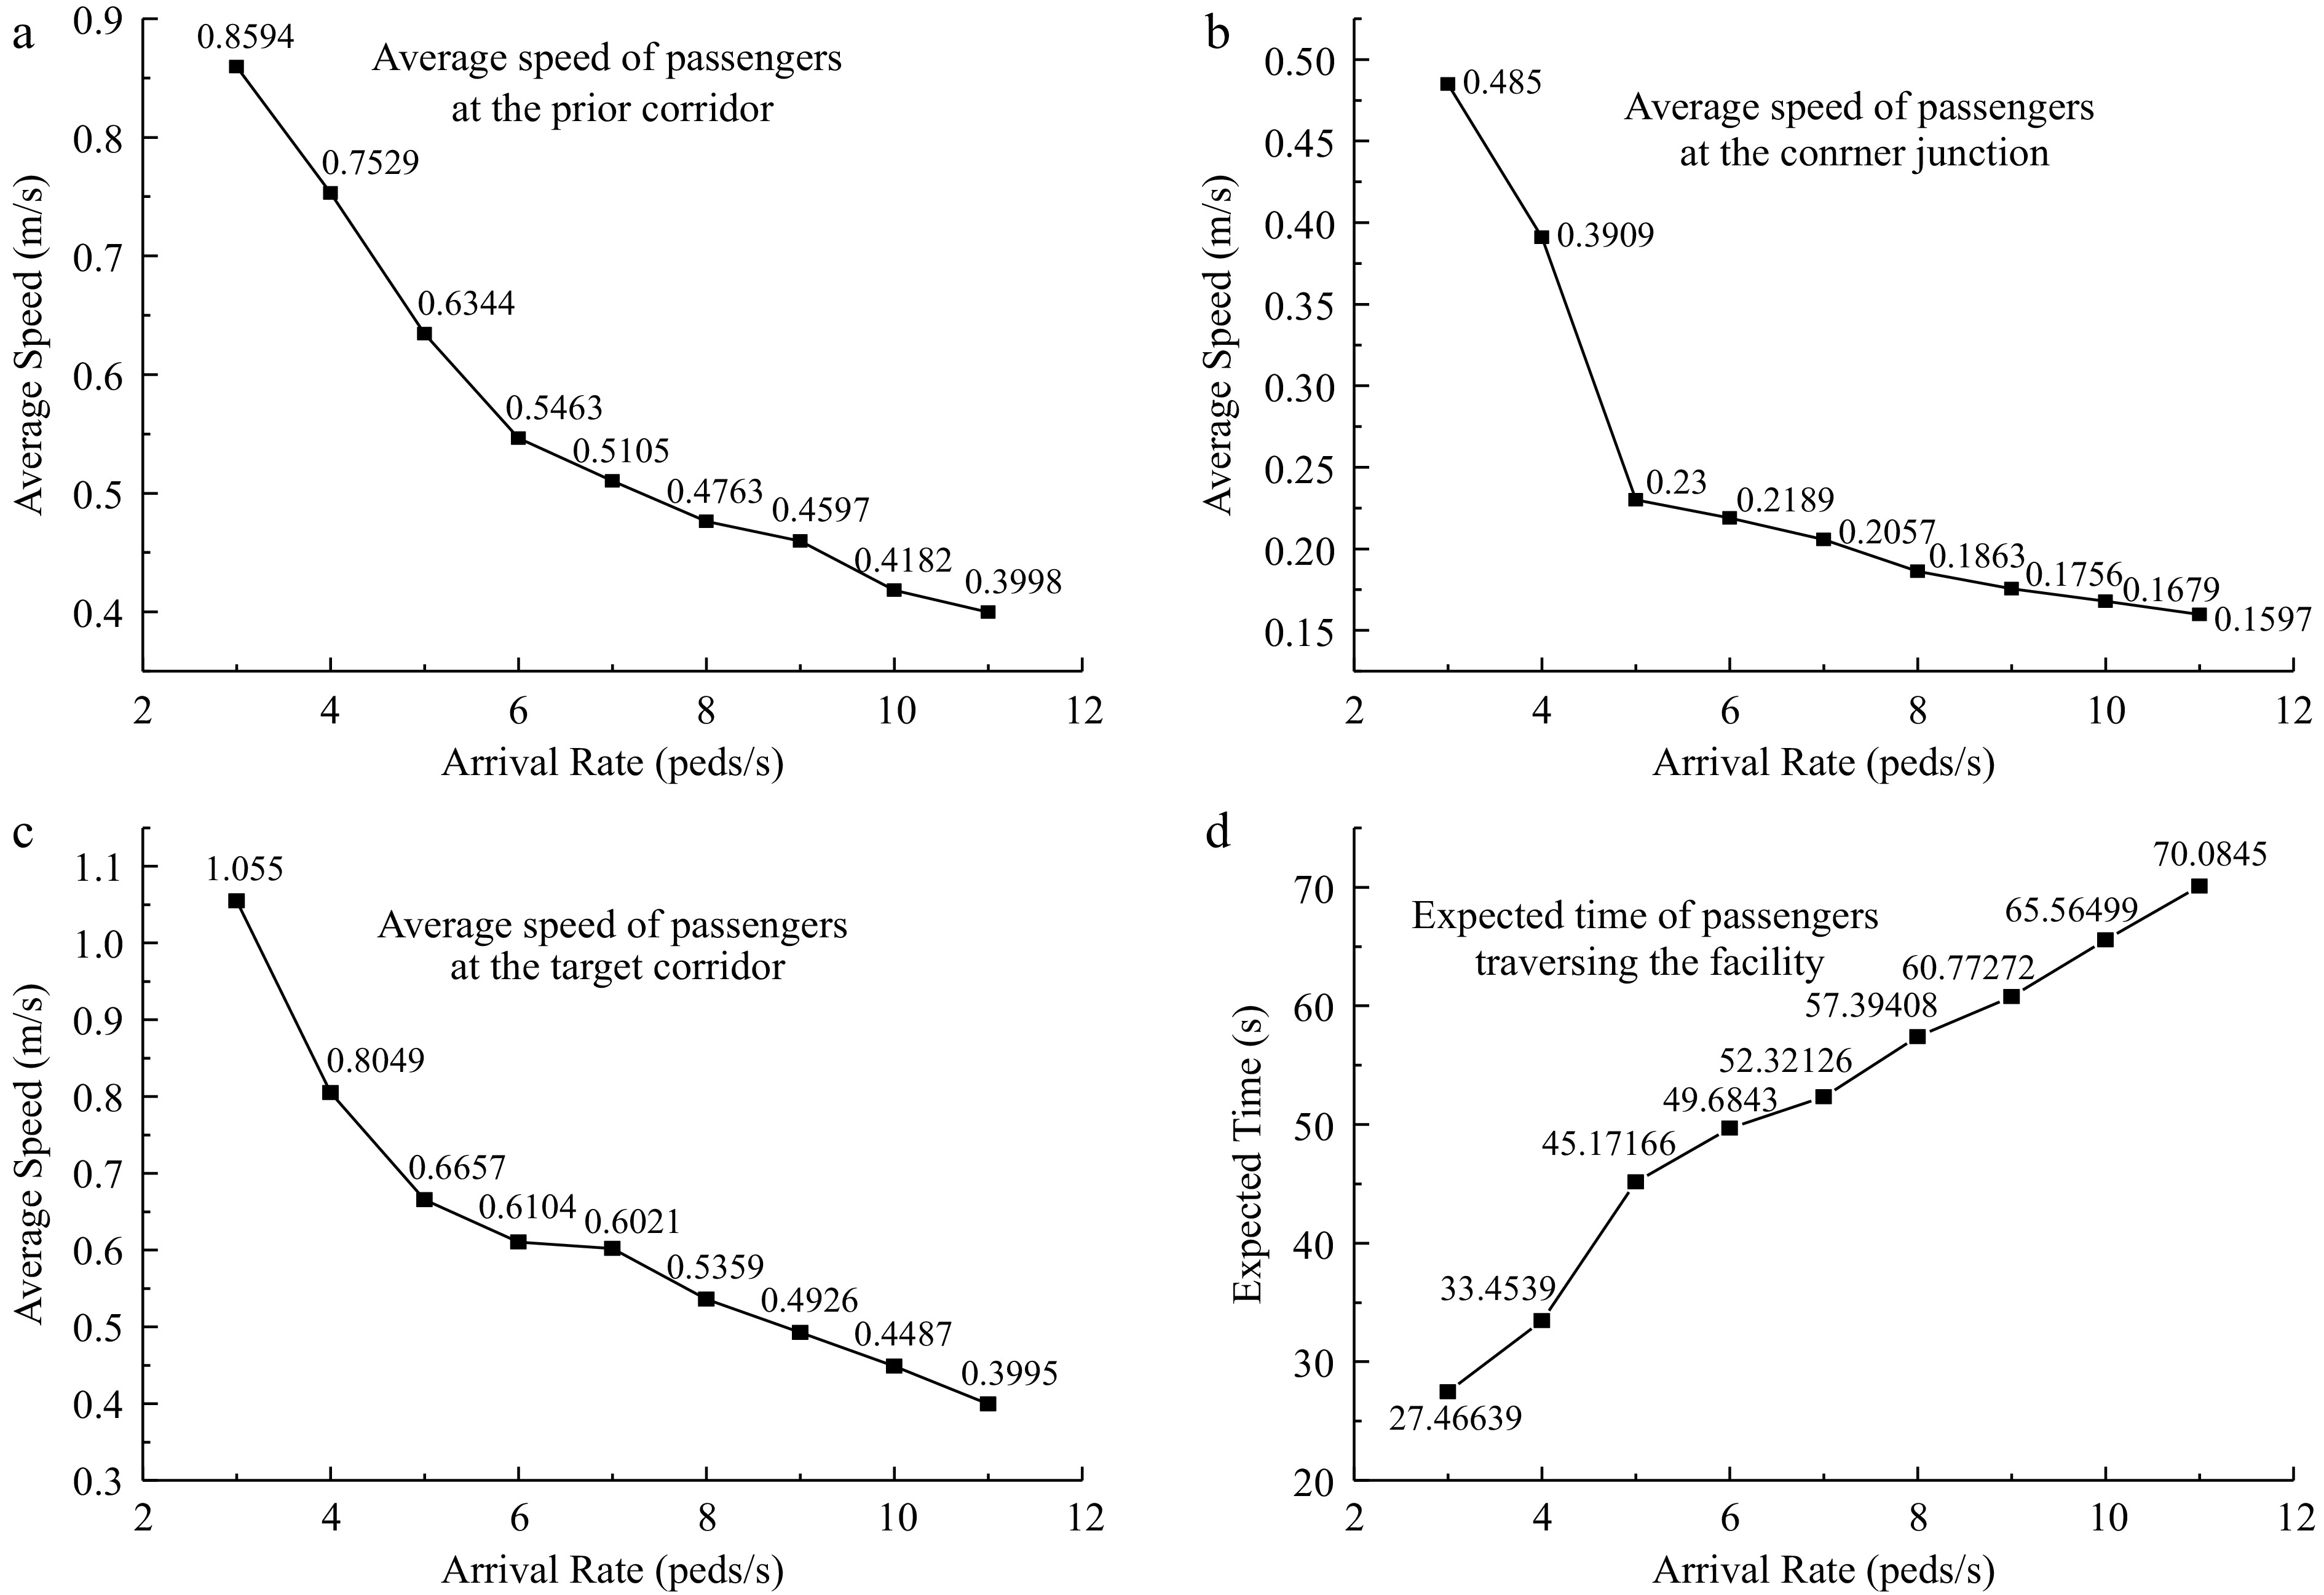
Figure 10.
Relationship between arrival rate and average speed and expected time. (a) Average speed of passengers at prior corriodor. (b) Average speed of passengers at the junction. (c) Average speed of passengers at target corridor. (d) Average speed of passgengers traversing the facility.
Corner performance with arrival rates
-
The passenger flow is strongly correlated with the train arrival, which will cause passenger volume to increase sharply during the train dwelling phase. Because field surveys were conducted during peak hours, the observations showed that the maximum volume of the alighting passenger amounted to 364 during train dwelling at H station, and the minimum volume of alighting passengers was 81. Three different processes were observed: alighting, alighting and boarding simultaneously and boarding. Alighting and boarding simultaneously mean alighting and boarding at the same time and passengers interweave to change their position outbound and inbound. The correlation of passenger volume and speed at α = 0.05 significance level is shown in Table 3.
Table 3. Correlation analysis between the volume of passengers and their speed.
Correlation Passenger volume (peds) Mean time (s) Mean speed (peds/s) r Alighting passengers 140 19.19 6.225 0.237 Boarding passengers 38 12.98 2.927 0.236 Total passengers 178 23.91 7.670 0.039 According to Table 3, there is a correlation between the volume and speed, and the correlation
$ {r}_{0.05/2} $ During peak hours, most passengers are commuters and they are strongly purpose-oriented. The head of the alighted passengers walks at free-flow speed. Their speeds are relatively higher, and the arrival rate of passengers at the corner is nearly 3 peds/s. The blocking probability of the corner is zero. With the arrival rates increasing, the speed of passengers decreases continuously. When the arrival rate is about 5 peds/s, the blocking at the corner occurs and the blocking probability is about 0.2. As the arrival rate increases continually, the blocking probability increases correspondingly. When the arrival rate comes up to 7 peds/s, the blocking probability of the corner tends to be constant and not increase further (see Fig. 11). The speed of passengers is concentrated in 0.55 m/s at the arrival rate being 7 peds/s and then declines to 0.37 m/s at 11peds/s. The statistics of the case of 364 passengers demonstrate that the higher arrival rate of passengers could diminish the corner performance.
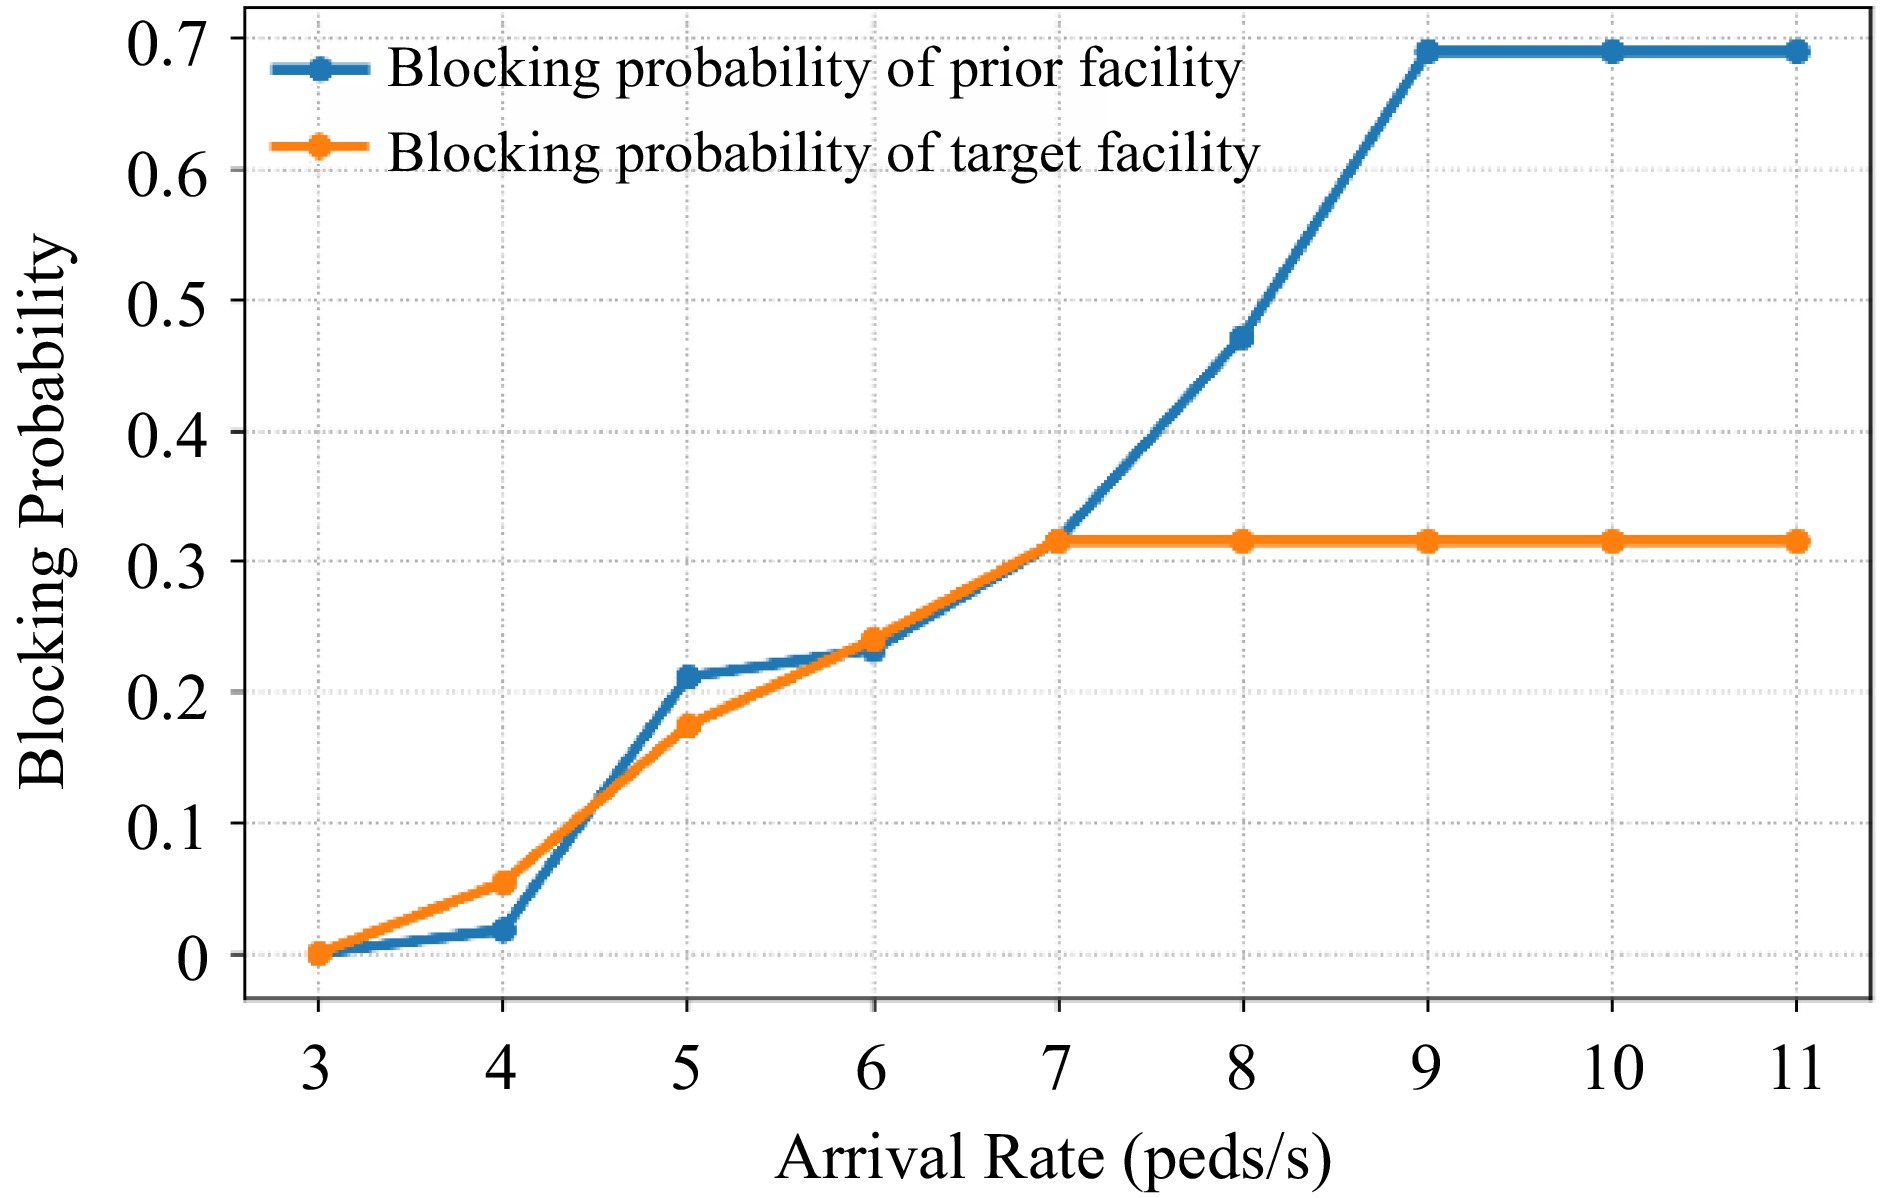
Figure 11.
The blocking probability with various arrival rates.
In the case of 364 passengers, the throughput of the corner is increasing with the arrival rate at first because of their higher speed. Then, the throughput begins to decrease under 6 peds/s arrival rate because of crowding (see Fig. 12). With the arrival rate increasing, the facility capacity will be fully utilized. However, when the arrival rate exceeds 7 peds/s, the queueing system will be more crowded, and the follow-up occupants have to swing at the rear of the queue. And the expected time of passengers traversing the corner will be prolonged, and the number of waiting passengers in the buffer area will increase with the arrival rate increasing.

Figure 12.
The throughput and expected time with various arrival rates.
The average speed calculated by the queueing model is compared with the results of the field survey in Fig. 13. With the arrival rate increasing, the average speed of passengers decreases because of the congestion in the corner. In the arrival rate ranging from 3 to 11 peds/s, the average speed obtained by queueing system is about 14% more than that of the field survey. On the one hand, the error between the two results lies in the queueing model itself. The queueing model is macroscopic and cannot illustrate the walking behaviors of individuals in subway stations. Based on the field survey data, the average speed calculated by queueing model is consistent with the results of the field survey.
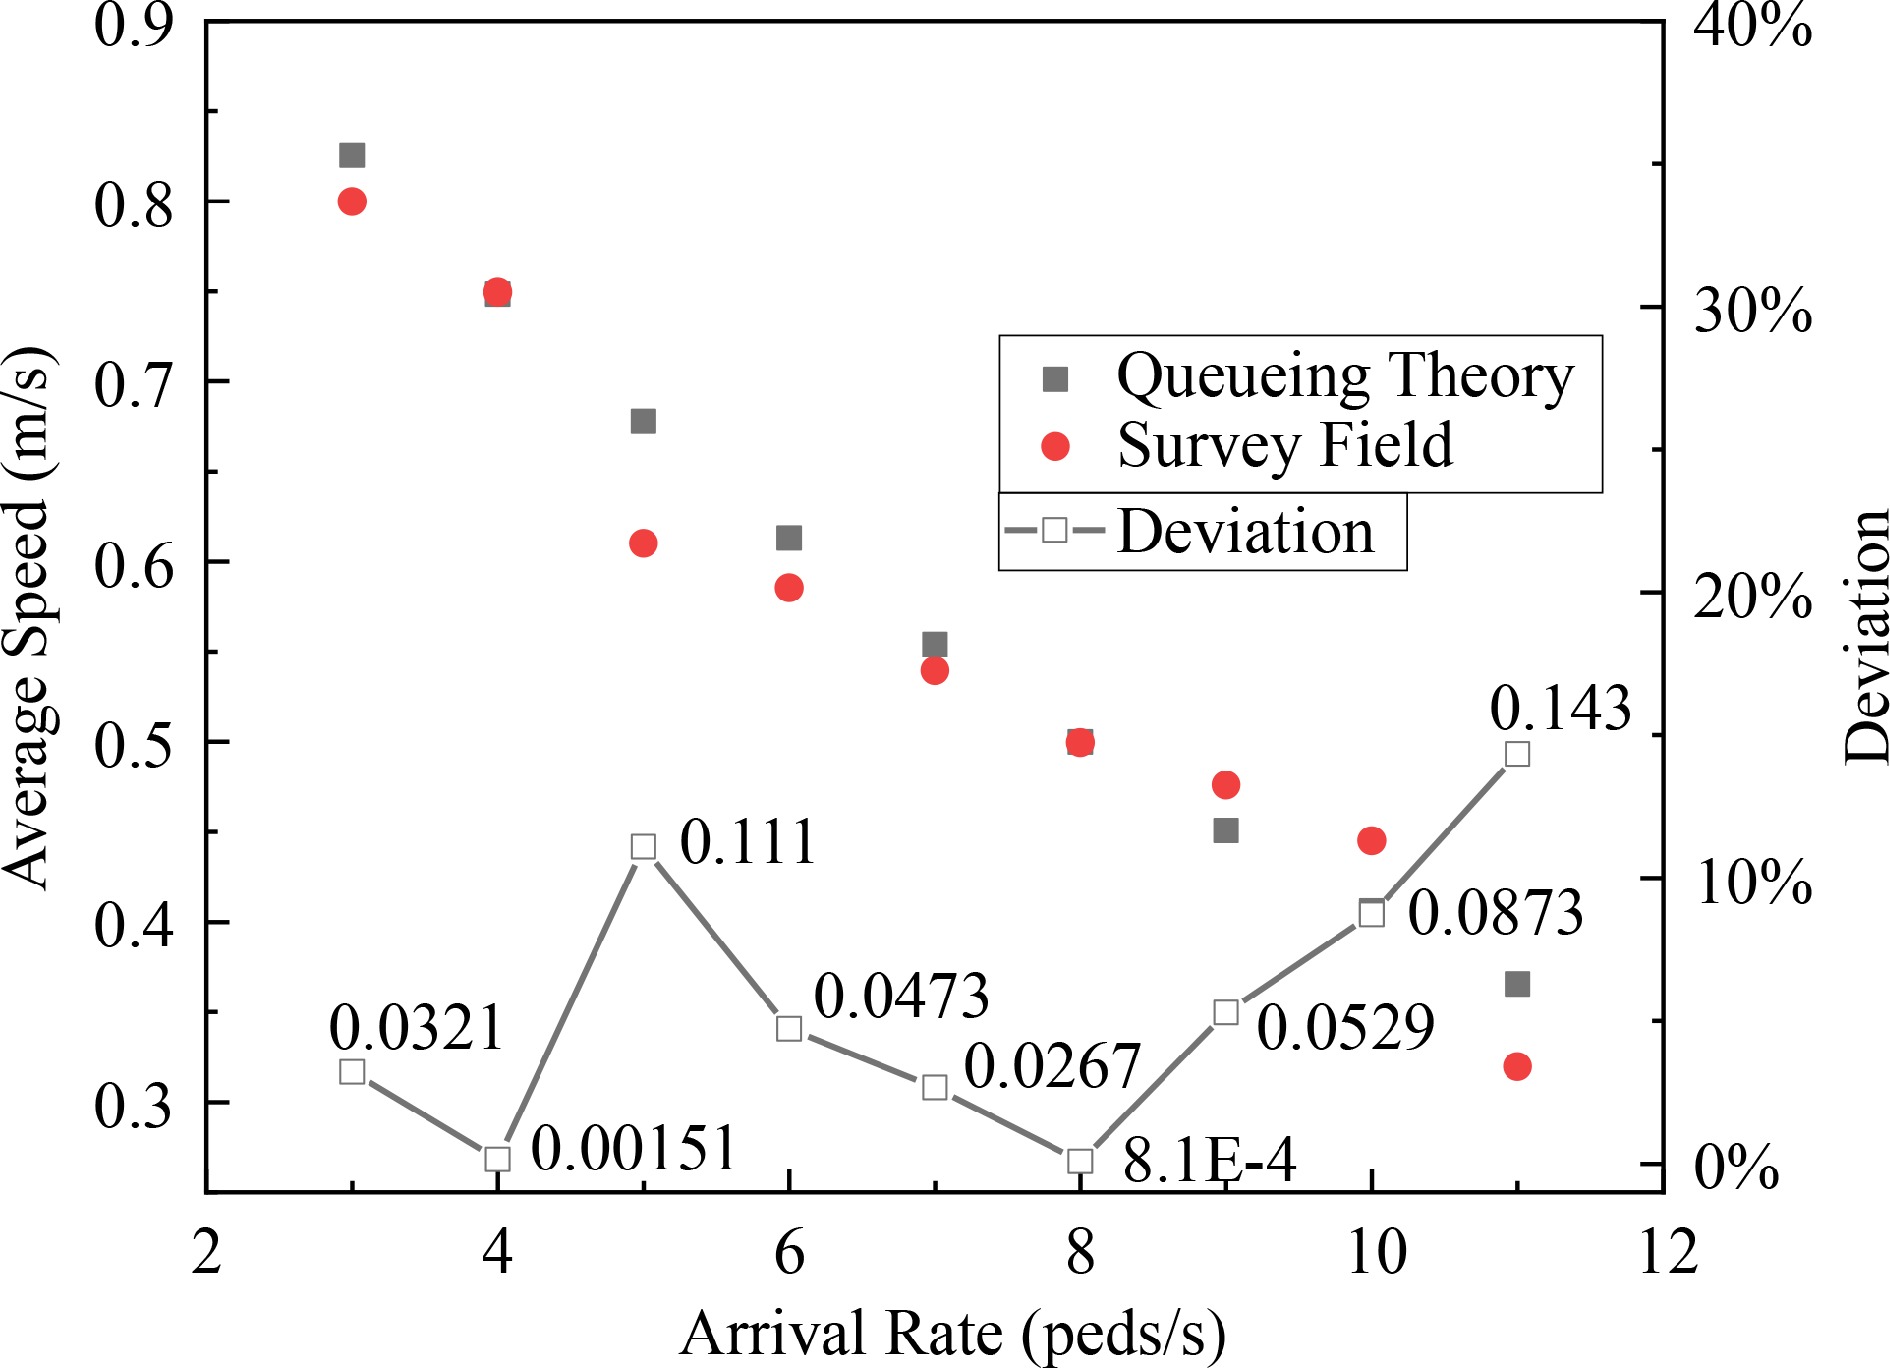
Figure 13.
The comparison of average speeds vary with arrival rates.
Corner performance with corridor width
-
Here we investigate the corner performance with various widths of the target corridor, which could improve or diminish the circulation efficiency. According to advice from subway managers, the width of the target corridor ranges from 3.5 m to 5.0 m. In the case of 364 passengers, the blocking probability (BP), throughput, and expected time are used to analyze passengers' walking behaviors under various widths of the target corridor. According to Supplemental Fig. S1, the blocking probability increases rapidly when the width of the target corridor (4 m) is 10% less than that of the prior corridor (4.6 m), and the steady states of passenger flow is congested with the arrival rate increasing. When the width is 3.5 m, the steady state of blocking probability will increase to 0.6130. It is100% more than that of the corridor with 4.0 m. However, if the width of the target corridor was enlarged by 10%, the steady state of passenger flow will be less crowded. Even though the arrival rate mounts up to 11 peds/s, the blocking probability will decrease by 99%. Therefore, the augment of the target corridor has a large influence on the blocking probability of passenger flow.
The throughput of the queueing system and arrival rate are highly correlated before congestions occur. The throughput increases with the arrival rate increasing at first. Once congestion occurs, the throughput will decrease rapidly, which is following the faster-is-slower effect. If the width of the target corridor is 10% less than that of the proper corridor, the performance of the corner could degrade by a large margin. In the proper width of the target corridor (4.4 m), the throughput will increase by about 20% of that of the width of the target corridor being 4.0 m. However, if the width of the target corridor is larger than the proper width, the growth of throughput is not significant. With the arrival rate increasing, the decline of throughput of the queueing system is mainly because congestions occur at the prior corridor. When the arrival rate is more than 7 peds/s, the throughput could fluctuate slightly because of the prior corridor crowding.
When the arrival rate is 3 peds/s, the throughput rises with the increase of the width of the target corridor and gets to the highest (3 peds/s, the red dot shown in Fig. 14). Then, the throughput is kept constant despite the width increasing. Likewise, the blue and yellow dots indicate the highest throughputs with the arrival rate being 5 peds/s (3.9 peds) and 7 peds/s (4.8 peds) respectively. The throughput begins to decline when the arrival rate is 8 peds/s (the green dot) and is about 4.2 peds/s. With the arrival rate increases, the throughput will decline slightly and be illustrated by black (2.8 peds/s), grey (3.1 peds/s), and purple dots (3.4 peds/s) shown in Supplemental Fig. S1 because of the prior corridor crowding.

Figure 14.
The throughput of queueing network changes with the width of the target corridor.
The expected time of passengers traversing the queueing system has a strong relationship with the throughput. From Supplemental Fig. S2, if the width of the target corridor (4.0 m) is 13% less than that of the prior corridor (4.6 m), the expected time will prolong by 3%, and the corridor will be more crowded. Otherwise, if the width of the target corridor is larger by 8.7% (5 m) than that of the prior corridor, the expected time will decrease by about 5%. Besides, with the increasing arrival rate, the expected time will increase by a wide margin and is merely related to the width of the prior corridor.
Simulation for model validation
-
Simulation experiments in the case of various widths of the target corridor were ran with different arrival rates ranging from 3 to 11 peds/s for model validation. The simulation experiments of the corner in H subway station are conducted by AnyLogic considering different parameters, including the width of the target corridor and the arrival rate of passenger flow. The model is verified by comparing the simulation results with the parameters calculated by the queueing model.
As shown in Fig. 15, relative deviations of simulation results compared with queueing model data are used to measure the differences. The queueing model presented in this paper exhibits a range of collective phenomena at the subway station corner. The larger the arrival rate, the longer the expected walking time of passengers. In the beginning, the expected walking time reduced rapidly with the target facility width increasing, and then the change is relatively slow. Furthermore, the expected time calculated by the queueing system is less than that of the simulation results. That is because the simulation results in Anylogic are based on the Social Force Model, which is a microscopic model considering the interaction among pedestrians (see Supplemental Fig. S3). However, the trend of expected time by queueing system is similar to that of field survey with the target corridor width increasing. The simulation results show the ability of the queueing model to capture the characteristics of passenger walking movement in the corners of subway stations.
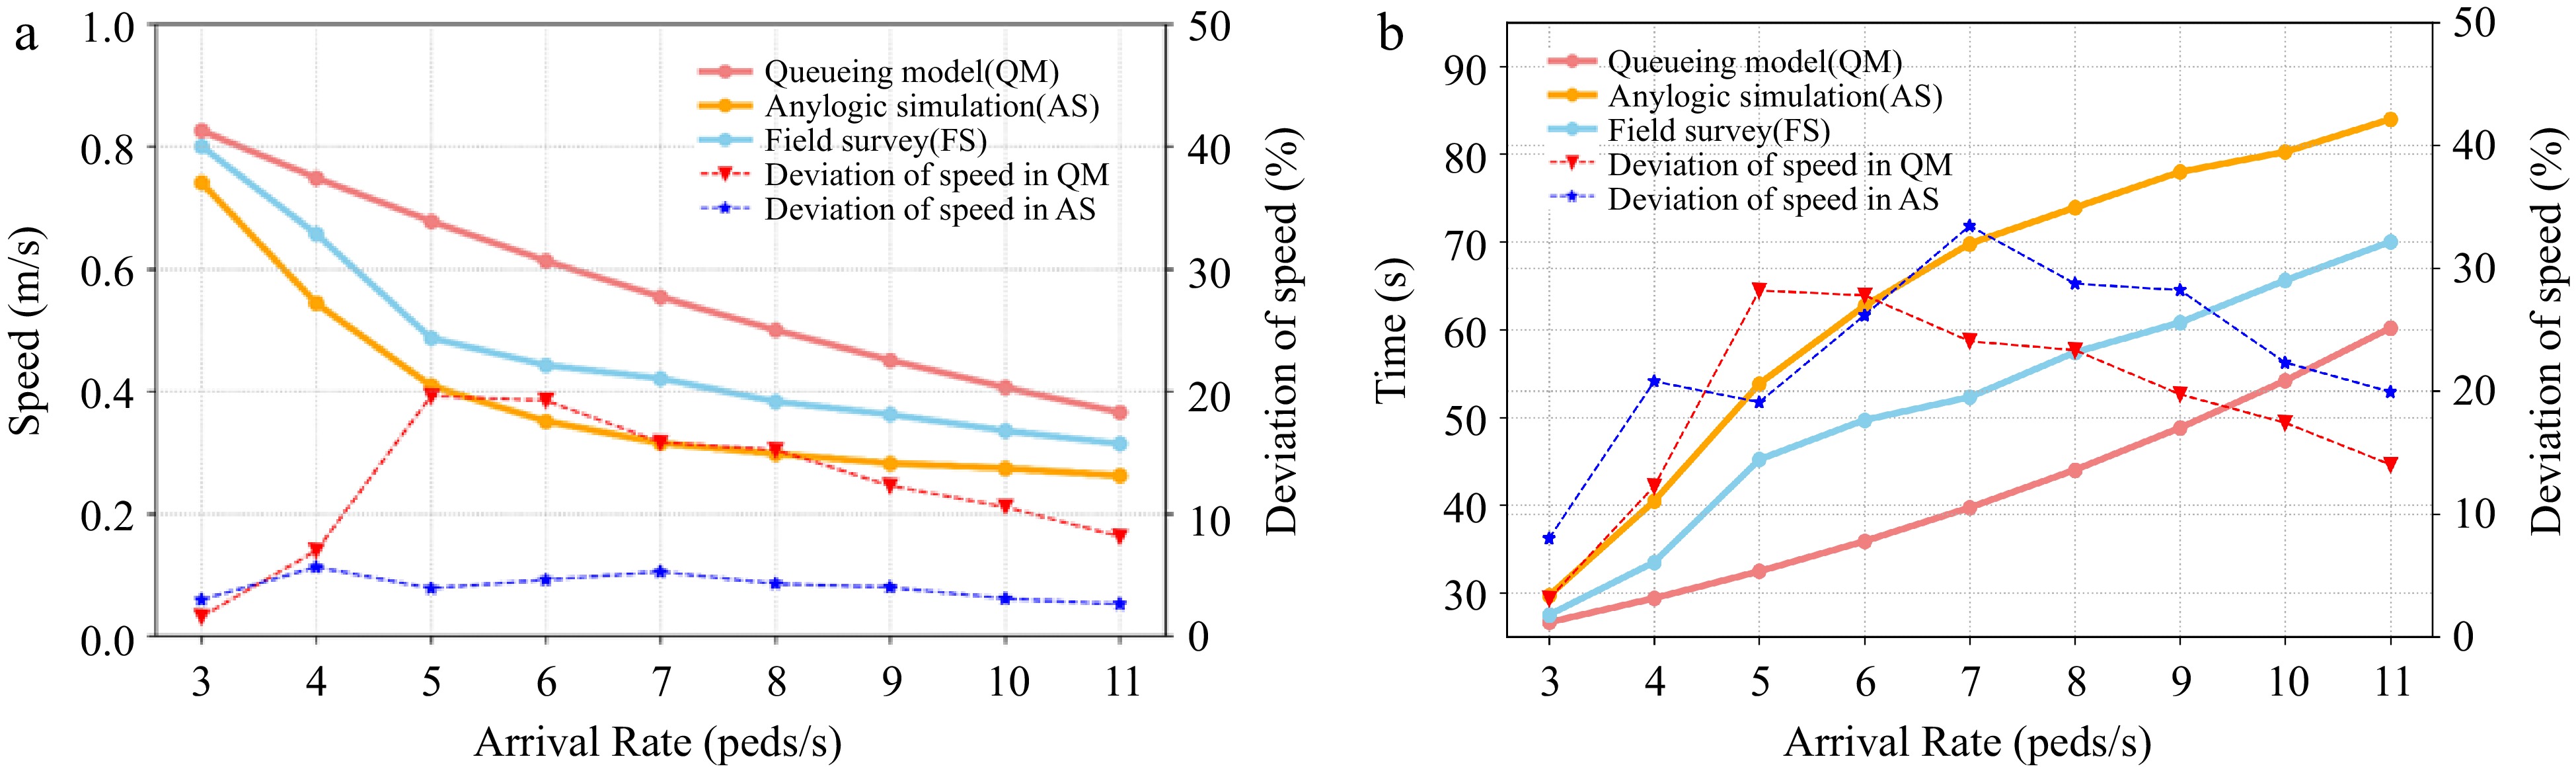
Figure 15.
The comparison results for model verification. (a) Walking speeds of passengers in various scenarios. (b) The walking time of passengers in various scenarios.
-
Congestion is a common phenomenon at corners in subway stations, which decreases passengers circulation efficiency and prolongs evacuation duration under unexpected adverse conditions. The queueing model in this paper exhibits a range of the parameters of walking behavior. The simulation results show the validity of the proposed model to emulate passenger movement, which can help managers to assess the bottleneck of the circulation facility in subway stations. To promote the circulation efficiency, station managers would guide passengers to select the appropriate evacuation or traversing routes to avoid overcrowding. In addition, the model also captures the relationship between congestion and the arrival rate of passengers, which can help station managers establish a targeted passenger flow control scheme to avoid excessive passengers in stations and trains. When the arrival rate exceeds 7 peds/s, the blocking probability increases significantly, and congestion occurs. Reasonable passenger flow control is helpful to ease the jam and keep passengers walking safer. Corridor width is critical to the circulation efficiency of passengers in the subway stations. If the width of the target corridor is enlarged by 10%, the steady state of passenger flow will be less crowded. The model provides an effective method and tool for passenger organization and safe design practices in subway stations. It is also an effective way to investigate the passenger behavior under similar circumstances. However, the field data and experiments are limited for model calibration and validation in this paper, and focus on the plane corner. Further research needs to perform more observations and obtained more real walking data of passengers, and extend the scenario of corners with vertical facilities (such as stairs and ramps). Other detailed behavior that may influence passenger walking performance should be also considered and analyzed. When passenger flow increases sharply, the changeable corridor should be reassigned to change walking direction or prolong walking time in broad walking facilities, such as hallways, which decreases congestion probability of passenger flow. When passenger flow is slightly congested, loitering passengers should be fast to reduce mean speed, which helps to increase throughput of corridors in subway stations.
This research is supported by the National Key R&D Program of China (No. 2020YFB1600701).
-
The authors declare that they have no conflict of interest. Jie Xu is the Editorial Board member of Journal Digital Transportation and Safety. He was blinded from reviewing or making decisions on the manuscript. The article was subject to the journal’s standard procedures, with peer-review handled independently of this Editorial Board member and his research groups.
- Supplemental Fig. S1 The blocking probability varies with the width of the target corridor.
- Supplemental Fig. S2 The expected time under different widths and arrival rates.
- Supplemental Fig. S3 The expected time versus arrival rate under various target corridor widths.
- Copyright: © 2023 by the author(s). Published by Maximum Academic Press, Fayetteville, GA. This article is an open access article distributed under Creative Commons Attribution License (CC BY 4.0), visit https://creativecommons.org/licenses/by/4.0/.
-
About this article
Cite this article
Xu J, Shi Y, Zhang H. 2023. Passengers gathering-scattering analysis at the corners of subway stations. Digital Transportation and Safety 2(2):139−149 doi: 10.48130/DTS-2023-0011 

Passengers gathering-scattering analysis at the corners of subway stations
- Received: 18 February 2023
- Accepted: 05 June 2023
- Published online: 29 June 2023
Abstract: During both daily operation and emergency evacuation, the corners of walking facilities in subway stations play an important role in efficient circulation. However, the effectiveness of the corner is difficult to assess. In this paper, a method of passenger gathering and scattering analysis based on queueing models was proposed to investigate the corner performance in subway stations. Firstly, we constructed a set of state spaces of passenger flow according to passenger density and proposed the state transition model of passenger flow. Moreover, the model of passenger flow blocking and unblocking probability were also presented. Then, to illustrate the validity of the method and model, several passenger gathering-scattering scenarios and were simulated to verify the influence of passenger distribution and facility width on passenger walking, and the blocking probability, throughput, and expected time were also analyzed under various widths of the target corridor and arrival rates. Results showed that the proposed model can reproduce the trend of walking parameters changing and the self-organizing phenomenon of 'faster is lower'. With the increase of arrival rates of passengers, walking speeds of passengers decrease and the expected walking time is prolonged, and the blocking probability sharply increased when the arrival rate exceeded 7 peds/s. In addition, with change of width of the target facility, efficiency of capacity of walking circulation facility fluctuated. With the width of the target corridor enlarged by 10%, the steady state of passenger flow was less crowded. Therefore, corridor width is critical to the circulation efficiency of passengers in subway stations. The conclusions will help to develop reasonable passenger flow control plans to ease the jam and keep passengers walking safely.
-
Key words:
- Subway station /
- Corner /
- Gathering-scattering behavior /
- Queueing model /
- Transition probability model